topics: networks wrap-up, disks and reliability
TRANSCRIPT
1
Lecture: Networks, Disks, Datacenters, GPUs
• Topics: networks wrap-up, disks and reliability, datacenters,GPU intro (Sections 6.1-6.7, App D, Ch 4)
2
Distributed Switches: Ring
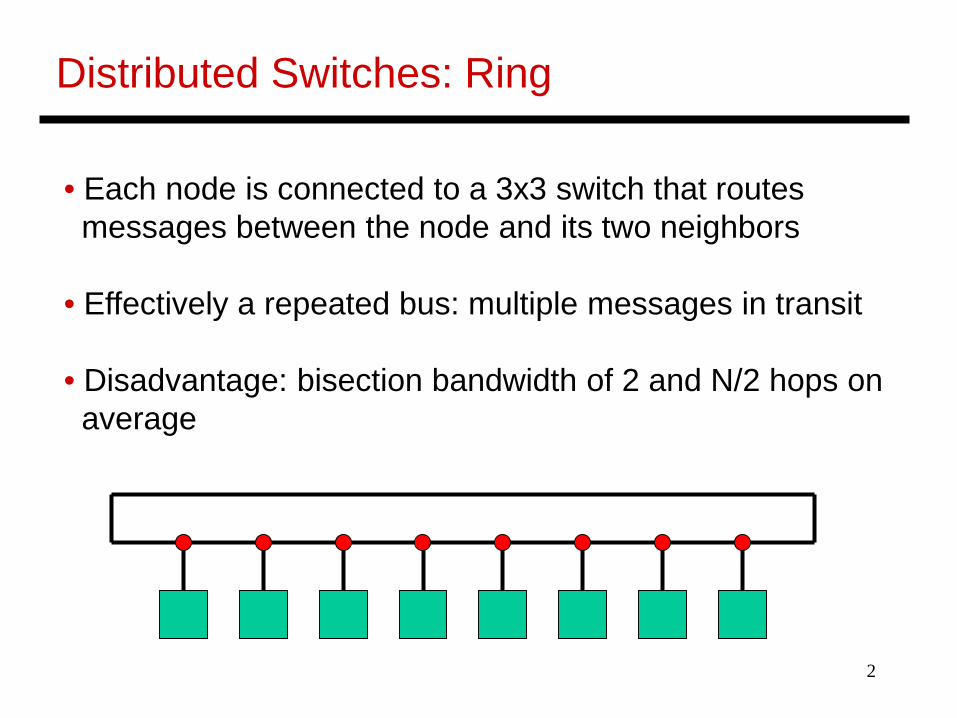
• Each node is connected to a 3x3 switch that routesmessages between the node and its two neighbors
• Effectively a repeated bus: multiple messages in transit
• Disadvantage: bisection bandwidth of 2 and N/2 hops onaverage

3
Distributed Switch Options
• Performance can be increased by throwing more hardwareat the problem: fully-connected switches: every switch isconnected to every other switch: N2 wiring complexity,N2 /4 bisection bandwidth
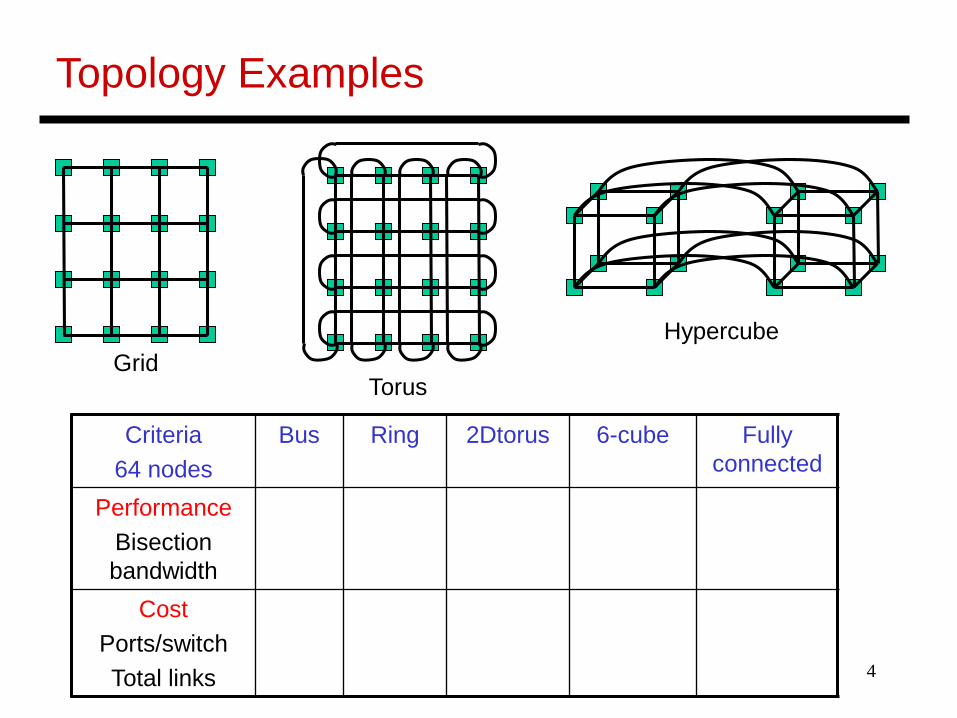
• Most commercial designs adopt a point between the twoextremes (ring and fully-connected): Grid: each node connects with its N, E, W, S neighbors Torus: connections wrap around Hypercube: links between nodes whose binary names
differ in a single bit
4
Topology Examples
GridHypercube
Torus
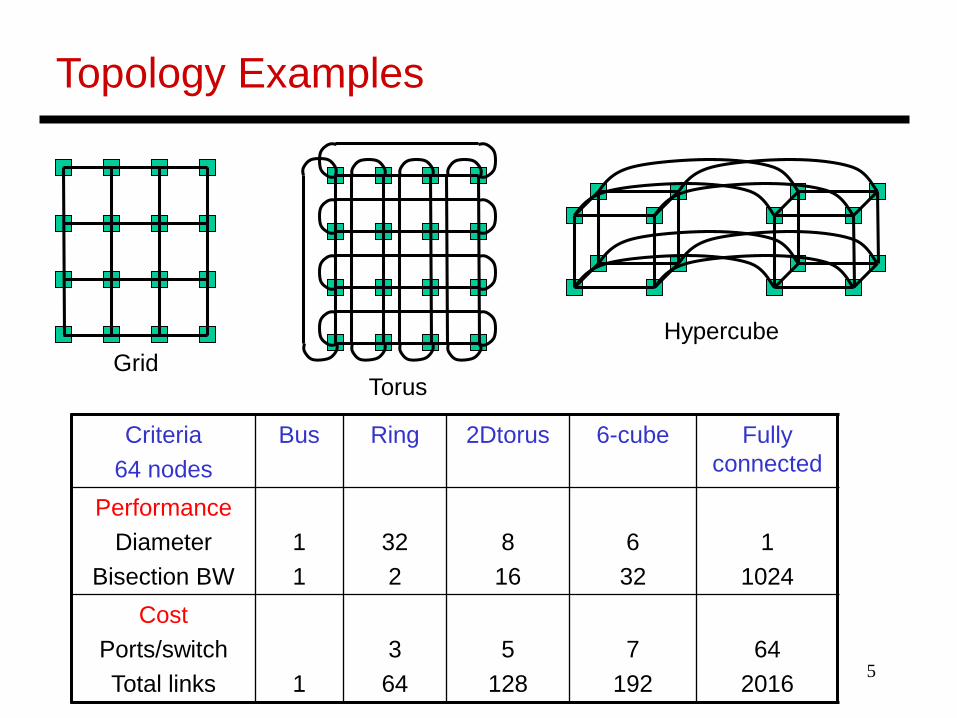
Criteria64 nodes
Bus Ring 2Dtorus 6-cube Fully connected
PerformanceBisection bandwidth
CostPorts/switchTotal links
5
Topology Examples
GridHypercube
Torus
Criteria64 nodes
Bus Ring 2Dtorus 6-cube Fully connected
PerformanceDiameter
Bisection BW 11
322
816
632
11024
CostPorts/switchTotal links 1
364
5128
7192
642016
6
k-ary d-cube
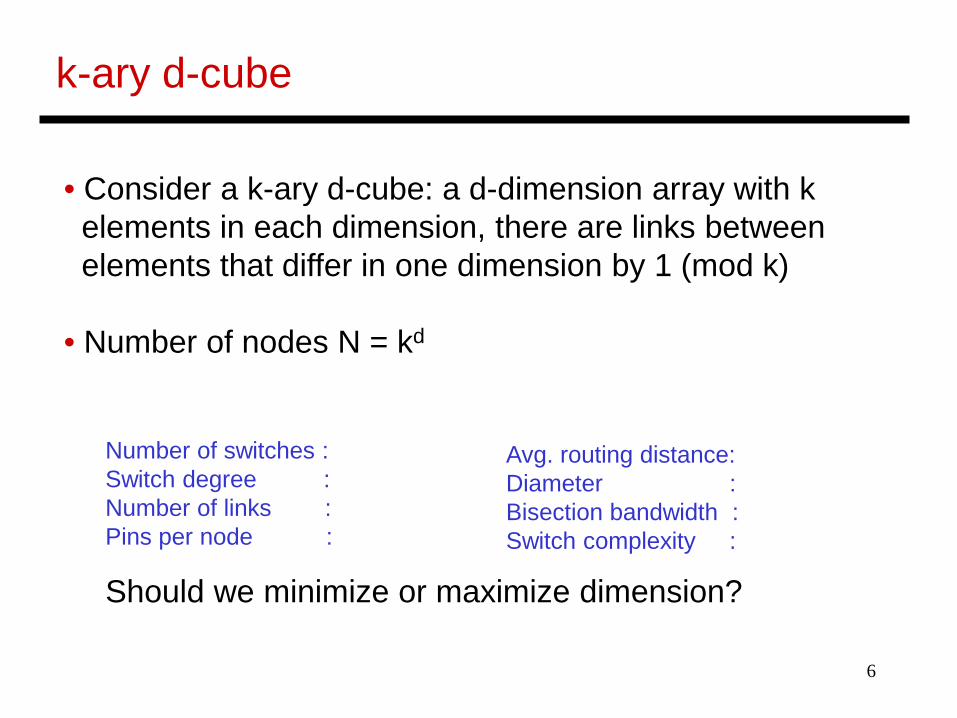
• Consider a k-ary d-cube: a d-dimension array with kelements in each dimension, there are links betweenelements that differ in one dimension by 1 (mod k)
• Number of nodes N = kd
Number of switches :Switch degree :Number of links :Pins per node :
Avg. routing distance:Diameter :Bisection bandwidth :Switch complexity :
Should we minimize or maximize dimension?
7
k-ary d-Cube
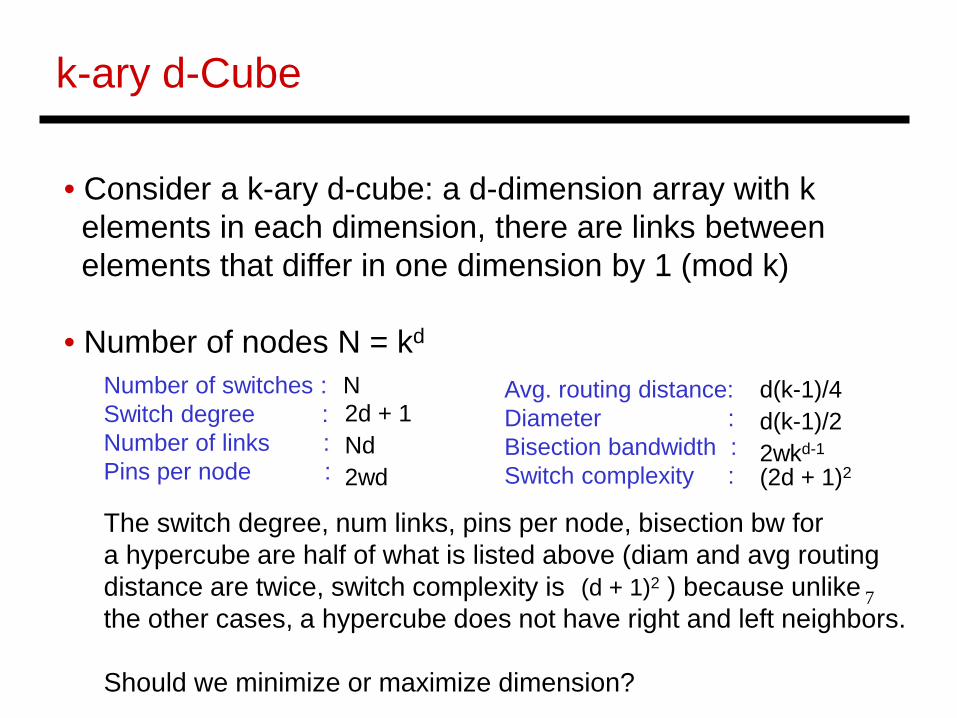
• Consider a k-ary d-cube: a d-dimension array with kelements in each dimension, there are links betweenelements that differ in one dimension by 1 (mod k)
• Number of nodes N = kd
Number of switches :Switch degree :Number of links :Pins per node :
Avg. routing distance:Diameter :Bisection bandwidth :Switch complexity :
N2d + 1Nd2wd
d(k-1)/4d(k-1)/22wkd-1
The switch degree, num links, pins per node, bisection bw fora hypercube are half of what is listed above (diam and avg routingdistance are twice, switch complexity is ) because unlikethe other cases, a hypercube does not have right and left neighbors.
Should we minimize or maximize dimension?
(2d + 1)2
(d + 1)2
8
Warehouse-Scale Computer (WSC)
• 100K+ servers in one WSC
• ~$150M overall cost
• Requests from millions of users (Google, Facebook, etc.)
• Cloud Computing: a model where users can rent computeand storage within a WSC; there’s an associatedservice-level agreement (SLA)
• Datacenter: a collection of WSCs in a single building,possibly belonging to different clients and using differenthardware/architecture
9
Workloads
• Typically, software developed in-house – MapReduce,BigTable, Memcached, etc.
• MapReduce: embarrassingly parallel operations performedon very large datasets, e.g., organize data into clusters,aggregate a count over several documents
• Hadoop is an open-source implementation of theMapReduce framework; makes it easy for users to writeMapReduce programs without worrying about low-leveltask/data management
10
MapReduce
• Application-writer provides Map and Reduce functionsthat operate on key-value pairs
• Each map function operates on a collection of records; arecord is (say) a webpage or a facebook user profile
• The records are in the file system and scattered acrossseveral servers; thousands of map functions are spawnedto work on all records in parallel
• The Reduce function aggregates and sorts the resultsproduced by the Mappers, also performed in parallel
11
MR Framework Duties
• Replicate data for fault tolerance
• Detect failed threads and re-start threads
• Handle variability in thread response times
• Use of MR within Google has been growing every year:Aug’04 Sep’09
Number of MR jobs has increased 100x+ Data being processed has increased 100x+ Number of servers per job has increased 3x
12
WSC Hierarchy
• A rack can hold 48 1U servers (1U is 1.75 inches high)
• A rack switch is used for communication within and out ofa rack; an array switch connects an array of racks
• Latency grows if data is fetched from remote DRAM or disk(300us vs. 0.1us for DRAM and 12ms vs. 10ms for disk )
• Bandwidth within a rack is much higher than betweenracks; hence, software must be aware of data placement and locality
13
PUE Metric and Power Breakdown
• PUE = Total facility power / IT equipment power(power utilization effectiveness)
• It is greater than 1; ranges from 1.33 to 3.03, median of 1.69
• The cooling power is roughly half the power used byservers
• Within a server, the approximate power distribution is asfollows: Processors (33%), DRAM memory (30%), Disks (10%), Networking (5%), Miscellaneous (22%)
14
CapEx and OpEx
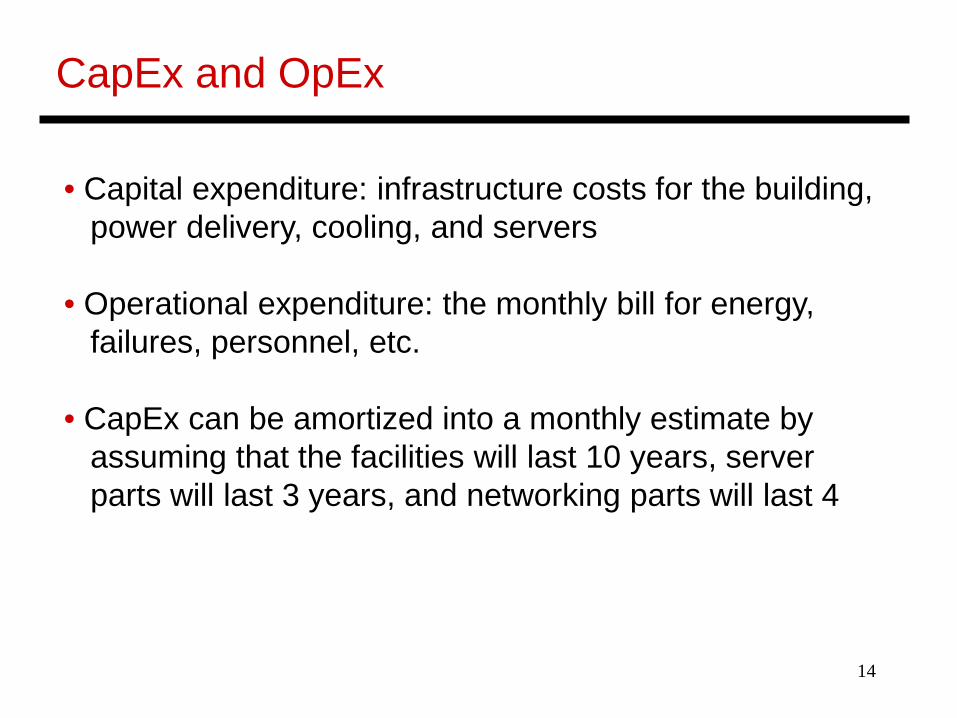
• Capital expenditure: infrastructure costs for the building,power delivery, cooling, and servers
• Operational expenditure: the monthly bill for energy,failures, personnel, etc.
• CapEx can be amortized into a monthly estimate byassuming that the facilities will last 10 years, serverparts will last 3 years, and networking parts will last 4
15
CapEx/OpEx Case Study
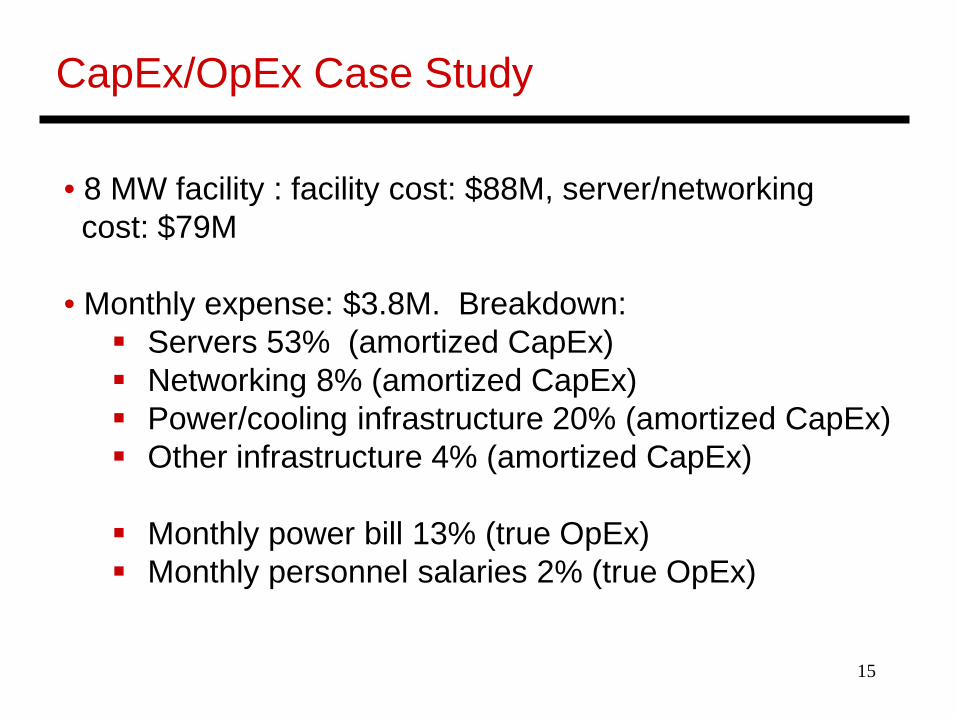
• 8 MW facility : facility cost: $88M, server/networkingcost: $79M
• Monthly expense: $3.8M. Breakdown: Servers 53% (amortized CapEx) Networking 8% (amortized CapEx) Power/cooling infrastructure 20% (amortized CapEx) Other infrastructure 4% (amortized CapEx)
Monthly power bill 13% (true OpEx) Monthly personnel salaries 2% (true OpEx)
16
Improving Energy Efficiency
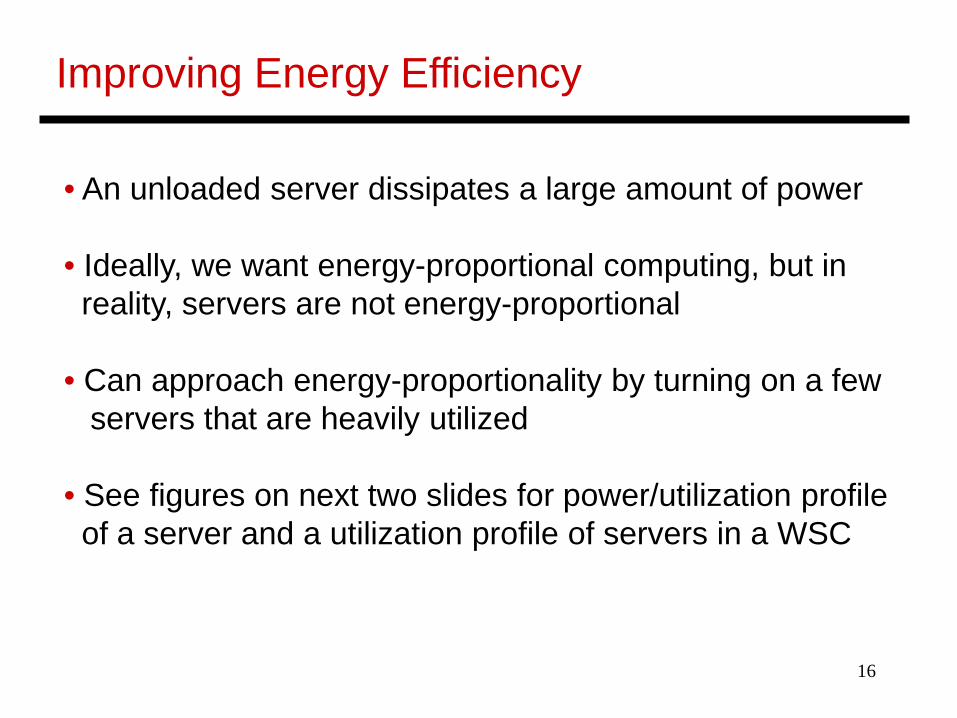
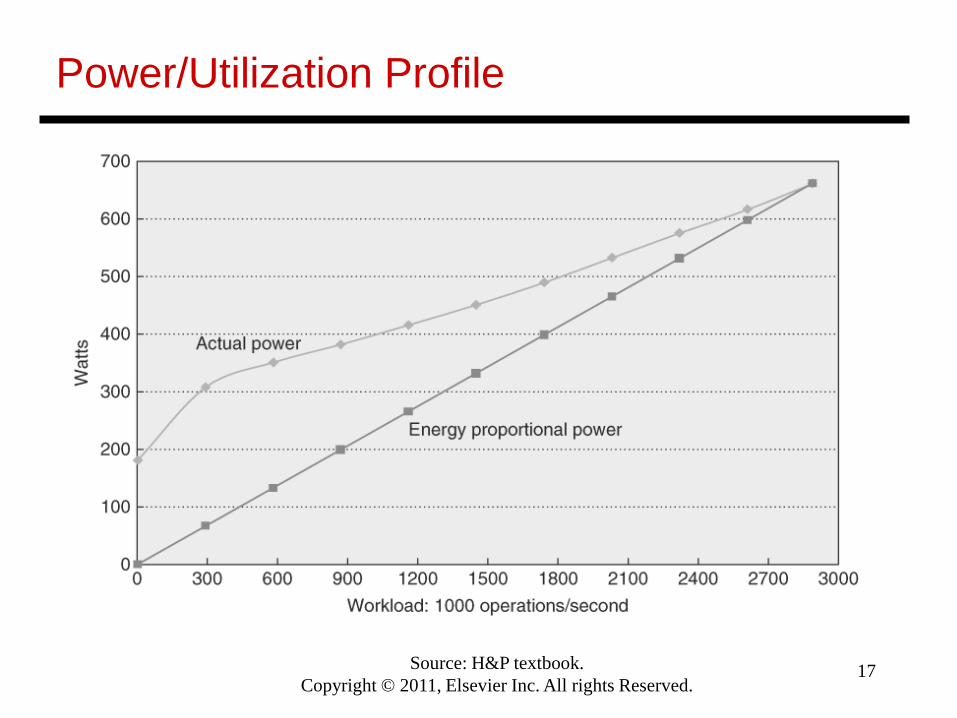
• An unloaded server dissipates a large amount of power
• Ideally, we want energy-proportional computing, but inreality, servers are not energy-proportional
• Can approach energy-proportionality by turning on a fewservers that are heavily utilized
• See figures on next two slides for power/utilization profileof a server and a utilization profile of servers in a WSC
17
Power/Utilization Profile
Source: H&P textbook.Copyright © 2011, Elsevier Inc. All rights Reserved.
18
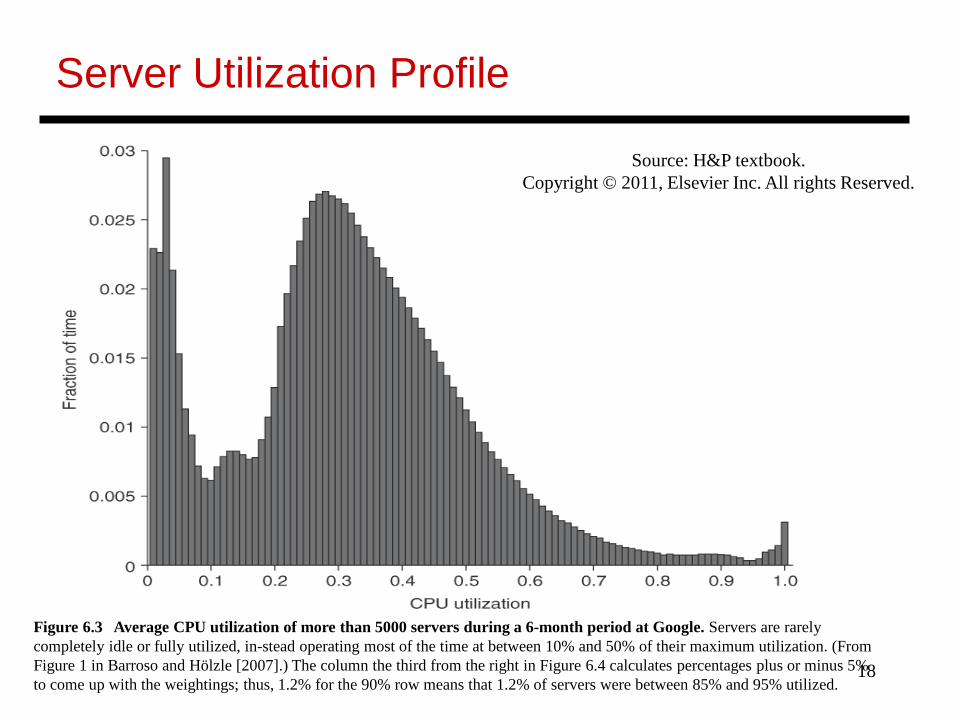
Server Utilization Profile
Figure 6.3 Average CPU utilization of more than 5000 servers during a 6-month period at Google. Servers are rarely completely idle or fully utilized, in-stead operating most of the time at between 10% and 50% of their maximum utilization. (From Figure 1 in Barroso and Hölzle [2007].) The column the third from the right in Figure 6.4 calculates percentages plus or minus 5% to come up with the weightings; thus, 1.2% for the 90% row means that 1.2% of servers were between 85% and 95% utilized.
Source: H&P textbook.Copyright © 2011, Elsevier Inc. All rights Reserved.
19
Problem 1
Assume that a server consumes 100W at peak utilizationand 50W at zero utilization. Assume a linear relationshipbetween utilization and power. The server is capable ofexecuting many threads in parallel. Assume that a singlethread utilizes 25% of all server resources (functional units,caches, memory capacity, memory bandwidth, etc.).What is the total power dissipation when executing 99threads on a collection of these servers, such that performance and energy are close to optimal?
20
Problem 1
Assume that a server consumes 100W at peak utilizationand 50W at zero utilization. Assume a linear relationshipbetween utilization and power. The server is capable ofexecuting many threads in parallel. Assume that a singlethread utilizes 25% of all server resources (functional units,caches, memory capacity, memory bandwidth, etc.).What is the total power dissipation when executing 99threads on a collection of these servers, such that performance and energy are close to optimal?
For near-optimal performance and energy, use 25 servers.24 servers at 100% utilization, executing 96 threads,consuming 2400W. The 25th server will run the last 3 threads and consume 87.5~W.
21
Other Metrics
• Performance does matter, both latency and throughput
• An analysis of the Bing search engine shows that if a200ms delay is introduced in the response, the nextclick by the user is delayed by 500ms; so a poorresponse time amplifies the user’s non-productivity
• Reliability (MTTF) and Availability (MTTF/MTTF+MTTR)are very important, given the large scale
• A server with MTTF of 25 years (amazing!) : 50K serverswould lead to 5 server failures a day; Similarly, annual diskfailure rate is 2-10% 1 disk failure every hour
22
Important Problems
• Reducing power in power-down states
• Maximizing utilization
• Reducing cost with virtualization
• Reducing data movement
• Building a low-power low-cost processor
• Building a low-power low-cost hi-bw memory
• Low-power low-cost on-demand reliability
23
Magnetic Disks
• A magnetic disk consists of 1-12 platters (metal or glassdisk covered with magnetic recording material on bothsides), with diameters between 1-3.5 inches
• Each platter is comprised of concentric tracks (5-30K) andeach track is divided into sectors (100 – 500 per track,each about 512 bytes)
• A movable arm holds the read/write heads for each disksurface and moves them all in tandem – a cylinder of datais accessible at a time
24
Disk Latency
• To read/write data, the arm has to be placed on thecorrect track – this seek time usually takes 5 to 12 mson average – can take less if there is spatial locality
• Rotational latency is the time taken to rotate the correctsector under the head – average is typically more than2 ms (15,000 RPM)
• Transfer time is the time taken to transfer a block of bitsout of the disk and is typically 3 – 65 MB/second
• A disk controller maintains a disk cache (spatial localitycan be exploited) and sets up the transfer on the bus(controller overhead)
25
RAID
• Reliability and availability are important metrics for disks
• RAID: redundant array of inexpensive (independent) disks
• Redundancy can deal with one or more failures
• Each sector of a disk records check information that allowsit to determine if the disk has an error or not (in other words,redundancy already exists within a disk)
• When the disk read flags an error, we turn elsewhere forcorrect data
26
RAID 0 and RAID 1
• RAID 0 has no additional redundancy (misnomer) – ituses an array of disks and stripes (interleaves) dataacross the arrays to improve parallelism and throughput
• RAID 1 mirrors or shadows every disk – every writehappens to two disks
• Reads to the mirror may happen only when the primarydisk fails – or, you may try to read both together and thequicker response is accepted
• Expensive solution: high reliability at twice the cost
27
RAID 3
• Data is bit-interleaved across several disks and a separatedisk maintains parity information for a set of bits
• For example: with 8 disks, bit 0 is in disk-0, bit 1 is in disk-1,…, bit 7 is in disk-7; disk-8 maintains parity for all 8 bits
• For any read, 8 disks must be accessed (as we usuallyread more than a byte at a time) and for any write, 9 disksmust be accessed as parity has to be re-calculated
• High throughput for a single request, low cost forredundancy (overhead: 12.5%), low task-level parallelism
28
RAID 4 and RAID 5
• Data is block interleaved – this allows us to get all ourdata from a single disk on a read – in case of a disk error,read all 9 disks
• Block interleaving reduces thruput for a single request (asonly a single disk drive is servicing the request), butimproves task-level parallelism as other disk drives arefree to service other requests
• On a write, we access the disk that stores the data and theparity disk – parity information can be updated simply bychecking if the new data differs from the old data
29
RAID 5
• If we have a single disk for parity, multiple writes can nothappen in parallel (as all writes must update parity info)
• RAID 5 distributes the parity block to allow simultaneouswrites
30
Other Reliability Approaches
• High reliability is also expected of memory systems;many memory systems offer SEC-DED support – singleerror correct, double error detect; implemented with an8-bit code for every 64-bit data word on ECC DIMMs
• Some memory systems offer chipkill support – the abilityto recover from complete failure in one memory chip – manyimplementations exist, some resembling RAID designs
• Caches are typically protected with SEC-DED codes
• Some cores implement various forms of redundancy,e.g., DMR or TMR – dual or triple modular redundancy
31
SIMD Processors
• Single instruction, multiple data
• Such processors offer energy efficiency because a singleinstruction fetch can trigger many data operations
• Such data parallelism may be useful for manyimage/sound and numerical applications
32
GPUs
• Initially developed as graphics accelerators; now viewedas one of the densest compute engines available
• Many on-going efforts to run non-graphics workloads onGPUs, i.e., use them as general-purpose GPUs or GPGPUs
• C/C++ based programming platforms enable wider useof GPGPUs – CUDA from NVidia and OpenCL from anindustry consortium
• A heterogeneous system has a regular host CPU and aGPU that handles (say) CUDA code (they can both beon the same chip)
33
The GPU Architecture
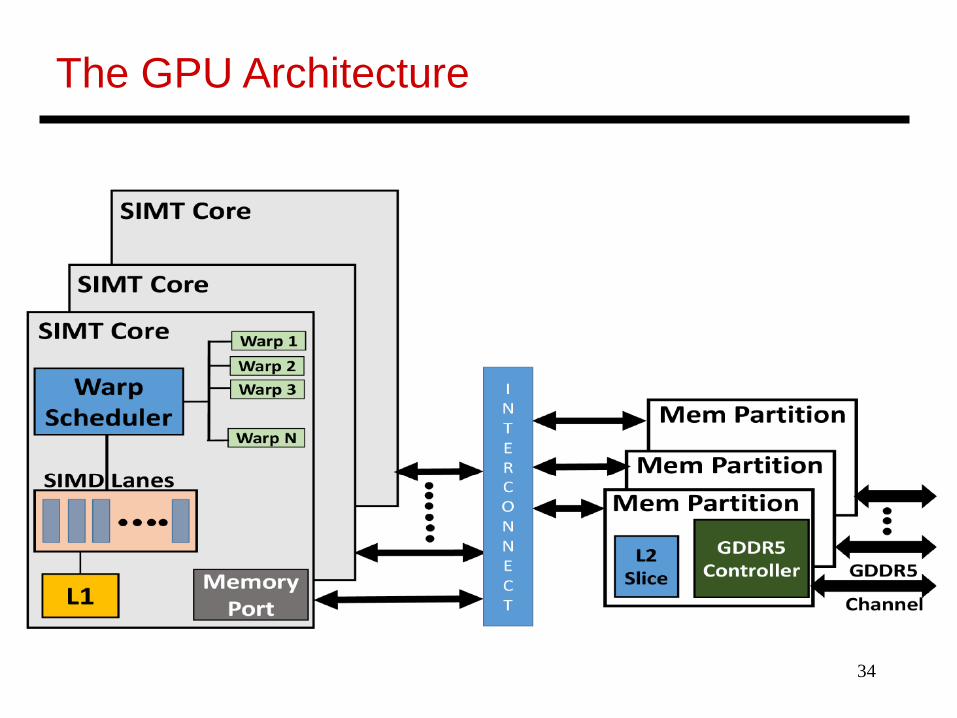
• SIMT – single instruction, multiple thread; a GPU hasmany SIMT cores
• A large data-parallel operation is partitioned into manythread blocks (one per SIMT core); a thread block ispartitioned into many warps (one warp running at atime in the SIMT core); a warp is partitioned across manyin-order pipelines (each is called a SIMD lane)
• A SIMT core can have multiple active warps at a time,i.e., the SIMT core stores the registers for each warp;warps can be context-switched at low cost; a warpscheduler keeps track of runnable warps and schedulesa new warp if the currently running warp stalls
34
The GPU Architecture
35
Architecture Features
• Simple in-order pipelines that rely on thread-level parallelismto hide long latencies
• Many registers (~1K) per in-order pipeline (lane) to supportmany active warps
• When a branch is encountered, some of the lanes proceedalong the “then” case depending on their data values;later, the other lanes evaluate the “else” case; a branchcuts the data-level parallelism by half (branch divergence)
• When a load/store is encountered, the requests from alllanes are coalesced into a few 128B cache line requests;each request may return at a different time (mem divergence)
36
GPU Memory Hierarchy
• Each SIMT core has a private L1 cache (shared by thewarps on that core)
• A large L2 is shared by all SIMT cores; each L2 bankservices a subset of all addresses
• Each L2 partition is connected to its own memorycontroller and memory channel
• The GDDR5 memory system runs at higher frequencies,and uses chips with more banks, wide IO, and betterpower delivery networks
• A portion of GDDR5 memory is private to the GPU and therest is accessible to the host CPU (the GPU performs copies)

37
Title
• Bullet