topic - refpet.com petchem integration - vinay gupta...delayed coker ebulated bed residue...
TRANSCRIPT

Topic
Integration Opportunities in
Refineries - Petrochemicals
Presented by :
VINAY GUPTA Engineers India Limited

Complexity of Indian refineries
Gross Refinery Margin
Stand Alone
Integrated Complex
Pricing of petrochemical & Refinery products w.r.t crude
Integration Opportunities between refineries & petrochemical
Case Study
AGENDA
3
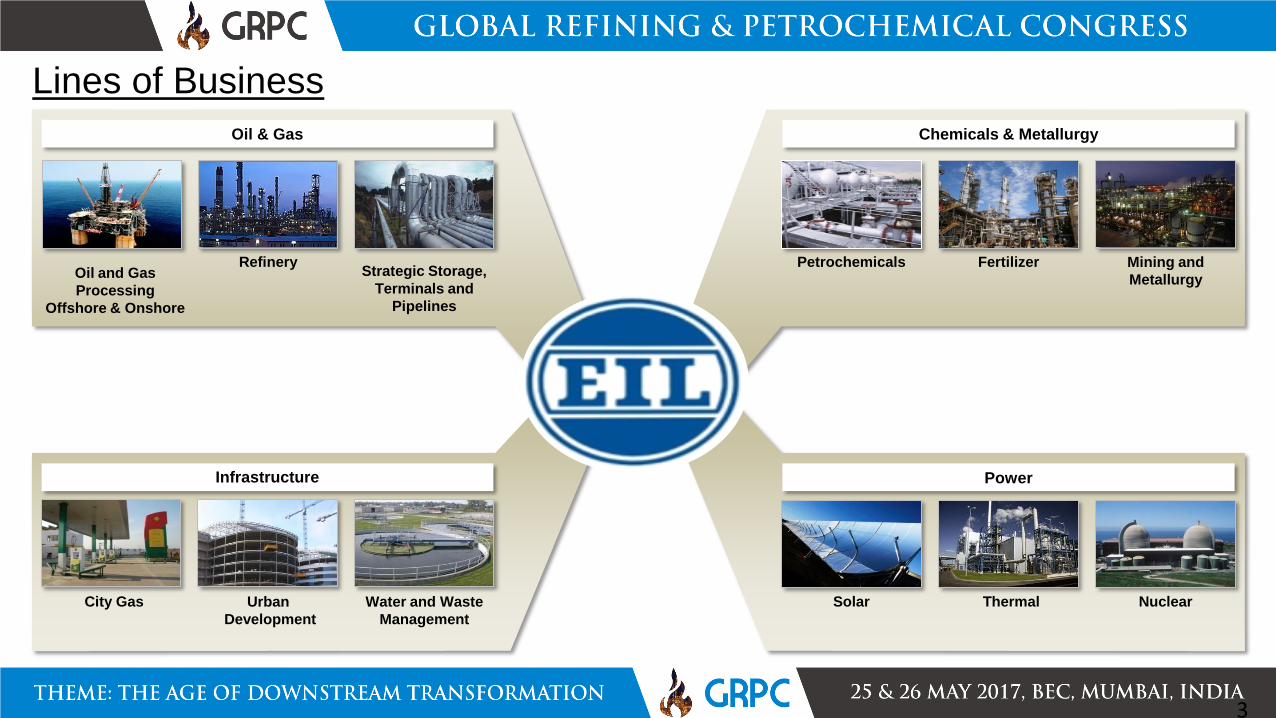
Lines of Business
Oil & Gas Chemicals & Metallurgy
Infrastructure Power
Oil and Gas
Processing
Offshore & Onshore
Strategic Storage,
Terminals and
Pipelines
Refinery Petrochemicals Fertilizer Mining and
Metallurgy
Solar Thermal Nuclear City Gas Urban
Development
Water and Waste
Management

4
Service Offering - From Concept to Commissioning
Pre-feasibility studies
Technology and licensor selection
Conceptual design & feasibility
Process design package
Process Design
Residual engineering and FEED
Detailed engineering
Engineering for procurement
Engineering for construction
Engineering
Supplier and contractor management
Expediting and inspection
Vendor development
Procurement
Materials and warehouse management
Quality assurance and health, safety &
environment
Progress monitoring/ Scheduling
Mechanical completion
Site closure
Construction Management
Pre-commissioning and commissioning
assistance
Safety audit
Hazard and operability studies
Risk analysis
Commissioning
Integrated project management services with
focus on cost, quality and schedule
Project Management
Environment engineering
Heat and mass transfer
Plant operations and safety management
Specialist materials and maintenance services
Specialized Services
Certification and re-certification services
EIL subsidiary – Certification Engineers
International Limited (CEIL)
Third party inspection
Certification
5
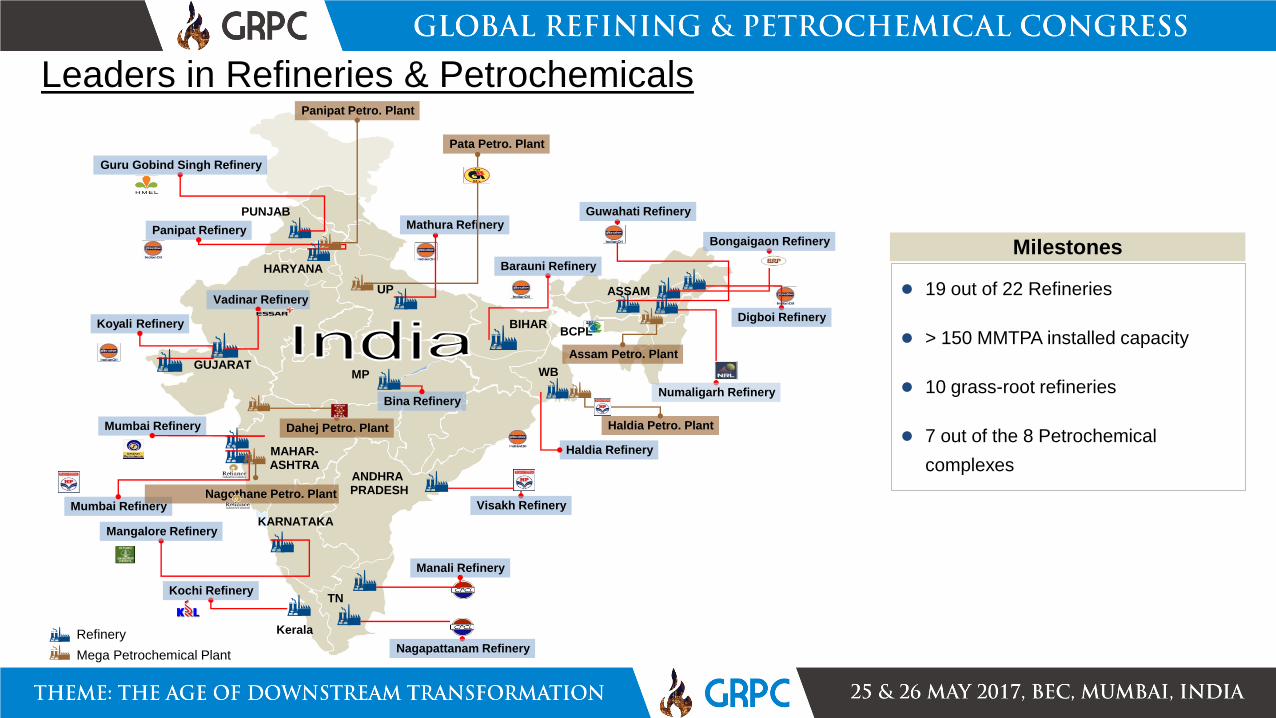
Leaders in Refineries & Petrochemicals
Milestones
19 out of 22 Refineries
> 150 MMTPA installed capacity
10 grass-root refineries
7 out of the 8 Petrochemical
complexes
Refinery
Mega Petrochemical Plant
Koyali Refinery
ASSAM
BIHAR
GUJARAT WB
Haldia Refinery
UP
Panipat Refinery
HARYANA
MAHAR- ASHTRA
Mumbai Refinery
Mumbai Refinery
ANDHRA PRADESH
Visakh Refinery
Kochi Refinery
Manali Refinery
TN
Kerala
Nagapattanam Refinery
Guwahati Refinery
Barauni Refinery
Mathura Refinery
Bongaigaon Refinery
Numaligarh Refinery
Digboi Refinery
Mangalore Refinery KARNATAKA
Vadinar Refinery
PUNJAB
Guru Gobind Singh Refinery
Bina Refinery
MP
Assam Petro. Plant
BCPL
Haldia Petro. Plant
Panipat Petro. Plant
Dahej Petro. Plant
Pata Petro. Plant
Nagothane Petro. Plant

Complexity of Indian refineries
Gross Refinery Margin
Stand Alone
Integrated Complex
Pricing of petrochemical & Refinery products w.r.t crude
Integration Opportunities between refineries & petrochemical
Case Study
AGENDA
1 2
3 4
5 6
7
9
11 12
13 14
15 16
17 18
19 20
21 22
Total number
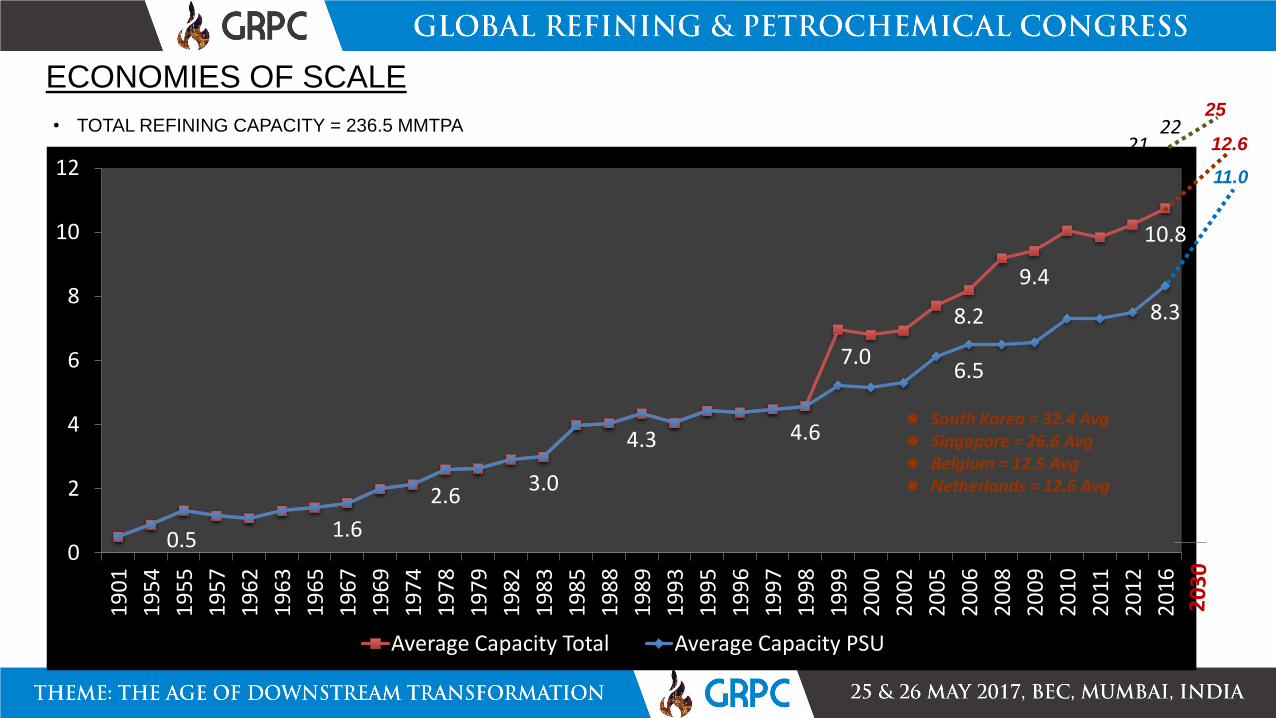
0.5 1.6
2.6 3.0
4.3 4.6
7.0
8.2
9.4
10.8
6.5
8.3
0
2
4
6
8
10
12
19
01
19
54
19
55
19
57
19
62
19
63
19
65
19
67
19
69
19
74
19
78
19
79
19
82
19
83
19
85
19
88
19
89
19
93
19
95
19
96
19
97
19
98
19
99
20
00
20
02
20
05
20
06
20
08
20
09
20
10
20
11
20
12
20
16
Average Capacity Total Average Capacity PSU
ECONOMIES OF SCALE
• TOTAL REFINING CAPACITY = 236.5 MMTPA
South Korea = 32.4 Avg Singapore = 26.6 Avg Belgium = 12.5 Avg Netherlands = 12.6 Avg
25
12.6
11.0
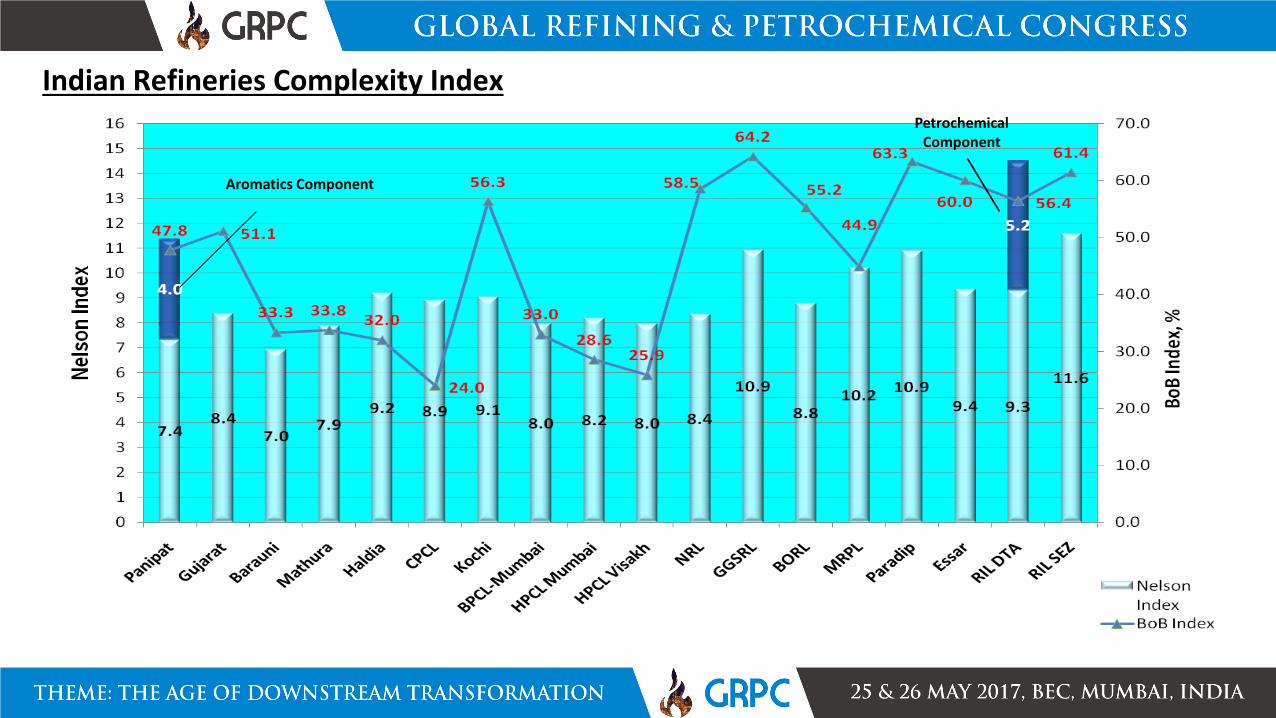
Indian Refineries Complexity Index
Aromatics Component
Petrochemical Component

Complexity of Indian refineries
Gross Refinery Margin
Stand Alone
Integrated Complex
Pricing of petrochemical & Refinery products w.r.t crude
Integration Opportunities between refineries & petrochemical
Case Study
AGENDA

Refinery Margin
ITEM $/ bbl % Contribution
Refined Product Revenue $ 80
Raw Material (Crude) Cost $ 70 87.5 %
Gross Margin $ 10
Energy Cost $ 0.8
2.5 % Marketing Cost $ 0.3
Environmental Operating Cost $ 0.2
Other Refining Costs (Wages, etc) $ 0.7
Net Refining Margin $ 8
Gross Refinery Margin = Price of refined product – Price of crude oil
Net Refinery Margin = Gross Refinery Margin – Refinery Operating Costs – Transportation and Storage

Refining Margin Impact
1
1
$ / B
arre
l
Crude
Pipeline /
COT
Crude Cost Refinery
Configuration
Operating
Expenses
Net Margin PetChem
Integration
+
-
Illustrative Only

Evolution of Value Addition
Hydro skimming Refinery
Secondary Processing
Complex Refinery
Complex Refinery
Residue Upgradation
Petrochemicals Integration
Integrated Refinery-Cum-Petrochemical Complex
Hydrogen Chemicals
Petrochemicals Gasification
Hydrocracker
FCCU
Delayed Coker
Ebulated Bed
Residue Hydrocrackers
PetCoke , Biomass
Aromatics and Olefins

Configuration Impact
Hydro skimming Refinery (1)
Secondary Processing (2)
Residue Upgradation (3)
47
70
84
30
40
50
60
70
80
90
1 2 3
Distillate yield wt% on Crude

Value Addition Through Integration
Complex Refinery (1)
Aromatics Integration (2)
Petrochemical Integration (3)
Integration of refinery & Petrochemicals also improve ROI significantly by ~ 4-5%.
7 8.7
15.7
0
2
4
6
8
10
12
14
16
18
1 2 3
GR
M $
/bb
l

Complexity of Indian refineries
Gross Refinery Margin
Stand Alone
Integrated Complex
Pricing of petrochemical & Refinery products w.r.t crude
Integration Opportunities between refineries & petrochemical
Case Study
AGENDA

Value Addition – Stand Alone Refinery
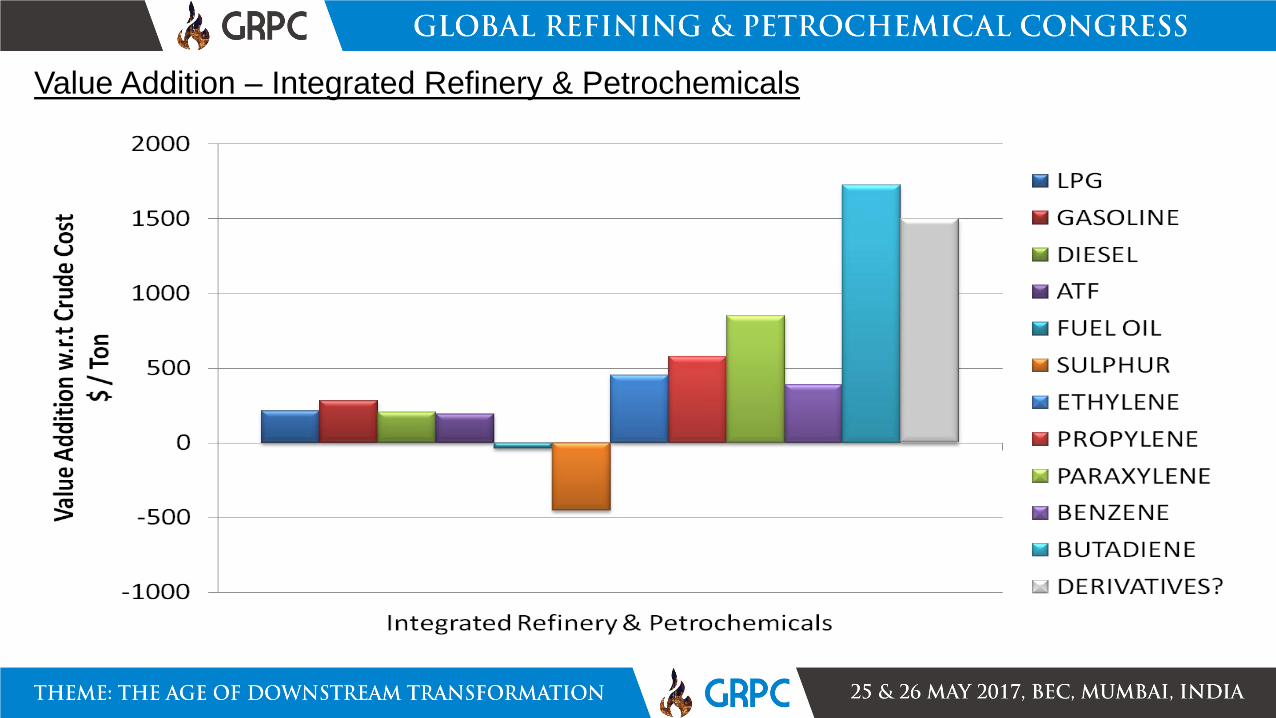
Value Addition – Integrated Refinery & Petrochemicals

Complexity of Indian refineries
Gross Refinery Margin
Stand Alone
Integrated Complex
Pricing of petrochemical & Refinery products w.r.t crude
Integration Opportunities between refineries & petrochemical
Case Study
AGENDA

Drivers for Refinery Petrochemical Integration
Premium available in olefins vis-à-vis transportation fuels
Stability over Value chain
Flexibility to the dynamic market demand and Prices
Feedstock and product flexibility
Assured Feedstock's Availability
Absorption of return streams
Upgrade low value refinery streams to high value products
Capital, OPEX and Resource Optimization
Shared Infrastructure, storage & Utilities
Lower logistic & Energy cost
Minimize overhead and waste
FUEL PETCHEM
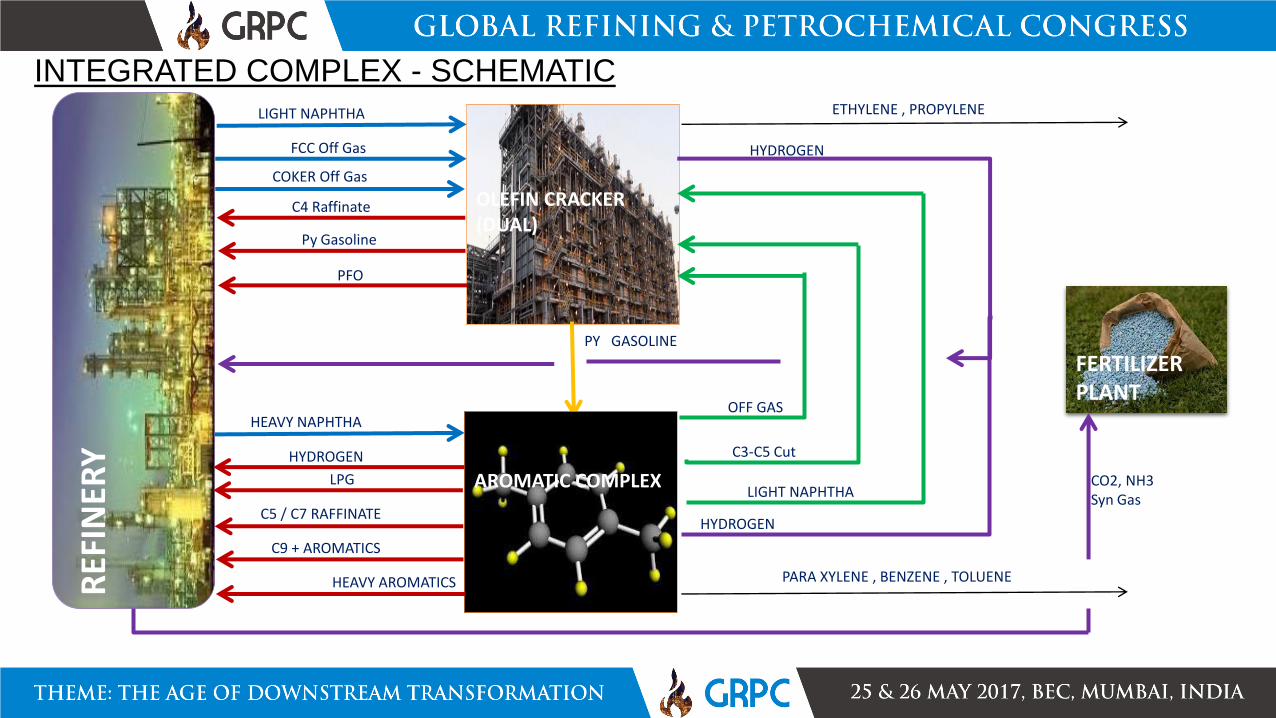
INTEGRATED COMPLEX - SCHEMATIC R
EFIN
ERY
OLEFIN CRACKER (DUAL)
LIGHT NAPHTHA
FCC Off Gas
COKER Off Gas
Py Gasoline
PFO
C4 Raffinate
PY GASOLINE
OFF GAS
C3-C5 Cut
LIGHT NAPHTHA
HYDROGEN
HYDROGEN
FERTILIZER PLANT
AROMATIC COMPLEX
HEAVY NAPHTHA
HYDROGEN
LPG
C5 / C7 RAFFINATE
C9 + AROMATICS
HEAVY AROMATICS
ETHYLENE , PROPYLENE
PARA XYLENE , BENZENE , TOLUENE
CO2, NH3 Syn Gas

Complexity of Indian refineries
Gross Refinery Margin
Stand Alone
Integrated Complex
Pricing of petrochemical & Refinery products w.r.t crude
Integration Opportunities between refineries & petrochemical
Case Study
AGENDA

CASE STUDY -1
LNG INTEGRATION TO REFINERIES

POINTERS FOR CASE STUDY
Indian Refineries – Low Margins and High Operating Costs
Operating on High Valued Fuel
Inflexibility towards volatile Crude prices and quality
• Low Capacities - Economies of scale
• Insufficient feedstock for downstream petrochemical complex
• LNG Availability
Stand Alone Refineries -
Lack of Expansion Plot Area
Emergence Of “Make in India”, PCPIR’s and Smart Cities Concepts

LNG Integration – Impact on Refinery Fuels Product Pool
24
Hydrogen Generation
Units
Captive Power Plant
Naphtha
LCO (Diesel)
FUEL OIL
H2
Power and
Steam
Furnace Firing
FUEL GAS Refinery Fuel Pool

LNG Integration – Impact on Refinery Fuels Product Pool
25
Hydrogen Generation
Units
MS-Block
Captive Power Plant
Refinery Fuel Pool
Diesel
Hydro-Treating Unit
Bottoms Processing Unit
Refinery Gasoline Pool
Refinery Diesel Pool
Naphtha
LNG
LCO
LNG
RFO
LNG
H2
Power and
Steam
Furnace Firing
RFG
C2 / C2= Rich Gas
Petrochemical / Cracker

Location & Capacities
Refinery A Capacity – 8.0 MMTPA
•Paucity of Space
•Excess Naphtha available
•HGU 90 KTPA – Naphtha Feed
•CPP – 90 MW – Naphtha Feed
Refinery B Capacity – 6.5 MMTPA
•Paucity of Space
•Excess Naphtha available
•HGU 54 KTPA – Naphtha Feed
•CPP – 54 MW – Naphtha Feed
Refinery C Capacity– 15.0 MMTPA
•Plans for Capacity Expansion
•Space Available
•HGU 73 KTPA – Naphtha Feed
•CPP 204 MW – Naphtha Feed
•Proximity to Natural Gas Import Terminals
•Opportunity for PCPIR and Smart City Development
Refinery
A
Refinery
B
Refinery
C
Refinery
A
Refinery
B
Refinery
C
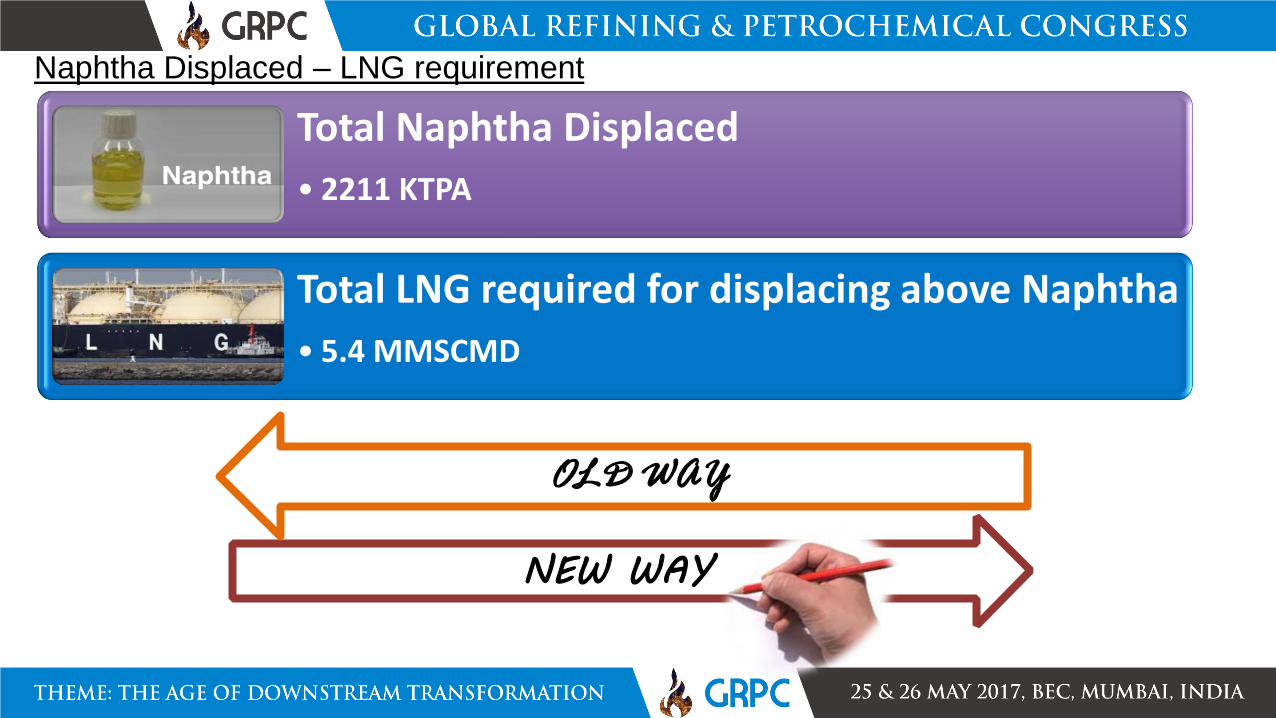
Naphtha Displaced – LNG requirement
Total Naphtha Displaced
• 2211 KTPA
Total LNG required for displacing above Naphtha
• 5.4 MMSCMD
NEW WAY
OLD WAY

Pipeline Integration - Schematic
Map Source: IOCL
Naphtha LNG
Dhamra port

Integration Opportunities
Excess & Displaced Naphtha through LNG integration at Refineries A , B and C
Proximity and availability of Natural Gas in the region
Ethane & Ethylene rich DCU / FCC off gasses
Availability of Land
Announced Plastic Park can be envisaged in the region
Logistics
Utilities
Plastic Park
Derivatives
Basic Petrochem
Refinery

Conclusion
LNG INTEGRATION
&
REFINERY INTEGRATION
Efficiency improvement
Value addition.
LNG to Petrochem
Make in India
Feedstock ensured
Refinery Flexibility

Thank you The information upon which this presentation is based comes from our own experience, knowledge and databases, supplemented by reference to primary sources and published industry data. Any opinions expressed are those of the author as of this date. They have been arrived at following careful consideration and enquiry but we do not guarantee their fairness , completeness or accuracy. We do not
accept any liability for your reliance upon them.