topic 1 introduction the the earth’s changing environment
TRANSCRIPT

Topic 1
Introduction the the Earth’s Changing environment
4 Branches of Earth Science
• 1) Astronomy-The study of the solar system and universe. All matter, time energy and space.
• 2) Geology-The study of the Earth’s origin, history, structure and processes
• 3) Meteorology-The study of the Earth’s atmosphere. (Weather and Climate)
• 4) Oceanography-The study of the Earth’s oceans. (waves, tides and currents)

Observation• The perception of some aspect of the
environment produced by one or more human senses-sight, sound, touch, taste, smell
Instruments
• Extend Senses
• Make the impossible, possible
Like:????
• Help us make better observations
Inference• A judgment based on observations• An educated guess. Synonymous with
hypothesis.• Can be incorrect.• Ex: weather forecasts

Classification: • Grouping things together that have similar
properties.
• Makes studying them easier, more understandable
Examples: For living things we use Kingdom, Phylum, Class, Order, Family, Genus, Species. For stars: The H-R diagram. For minerals: The mineral identification flow chart.
Measurement• Comparing a known standard to an
unknown object
• Quantifies observations
• Must have a NUMBER and UNIT to mean something-Ex. 6.25 cm
24o c
6 hrs
Day 3:

3 Fundamental Units of Measure
1. Length• Kilometer, meter, centimeter,
millimeter
2. Mass• Kilogram, gram, milligram
3. Time• Year, day, hour, minute, second
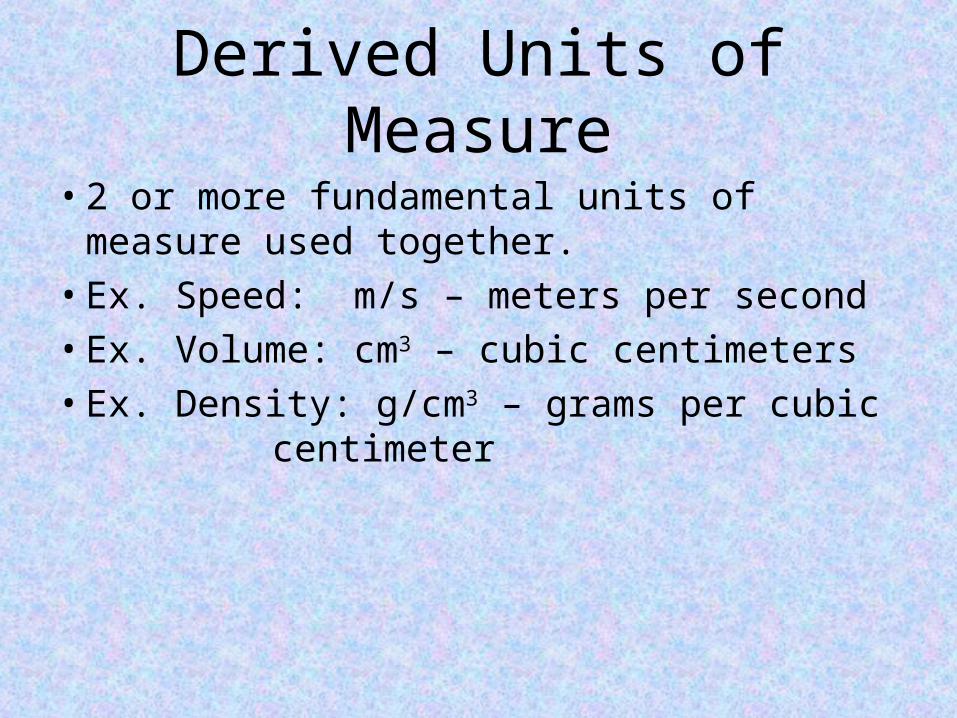
Derived Units of Measure
• 2 or more fundamental units of measure used together.
• Ex. Speed: m/s – meters per second• Ex. Volume: cm3 – cubic centimeters• Ex. Density: g/cm3 – grams per cubic
centimeter

Percent Deviation (Percent Error)
• Since there is no such thing as a perfect measurement, %-deviation shows you how close you are to an accepted value
Difference between values
• Percent Deviation = _______________________________ X 100
Accepted Value

Sample %-Deviation (Percent Error)
Example (put in your notes):
A student found the air temperature to be 86.7ºF. If the correct temperature was 85.0ºF, what was her percent deviation? (Round to tenth’s place)

Sample %-Deviation (Percent Error)
1. A student found the mass of a rock to be 12.0 grams. If the actual mass of the rock was 10.0 grams, what was his percent deviation?
2. Mary estimated there were 728 marbles in a jar. When she actually counted them, she found it contained 800. What was her percent deviation?
3. A student found the density of a rock to be 7.3 g/cc. If the actual density was 7.5 g/cc, what was the student’s percent error?
Answers
• Sample: 2.00%
• 1) 20%
• 2) 9%
• 3) 2.7%

Percent Deviation (Percent Error)
The moral of the story: The moral of the story:
There is no such thing as a perfect measurement ……

Scientific Notation
• A standardized way to express very large (or very small) numbers.
• Scientific Notation:
__?__ X 10_?_
# must beexponent(+ or -) between 1.0 and 9.9
Day 4:

Sample Scientific Notation:
1. 3200 3.2 X 10³
2. 0.067 6.7 X 10⁻²
3. 6,250,000 6.25 X 10⁶
4. 0.00065 6.5 X 10⁻⁴
HINT:
•If you move the decimal to the left, your exponent is positive
•If you move the decimal to the right, your exponent is negative

Density:
• Measure of how closely packed molecules or atoms are in a material
• Density = Mass / Volume• Density = Amount of Matter (grams)
Amount of space it takes up
(cc, cm3, or ml)
Units: g/cc; or g/cm3; or g/ml
Day 5:
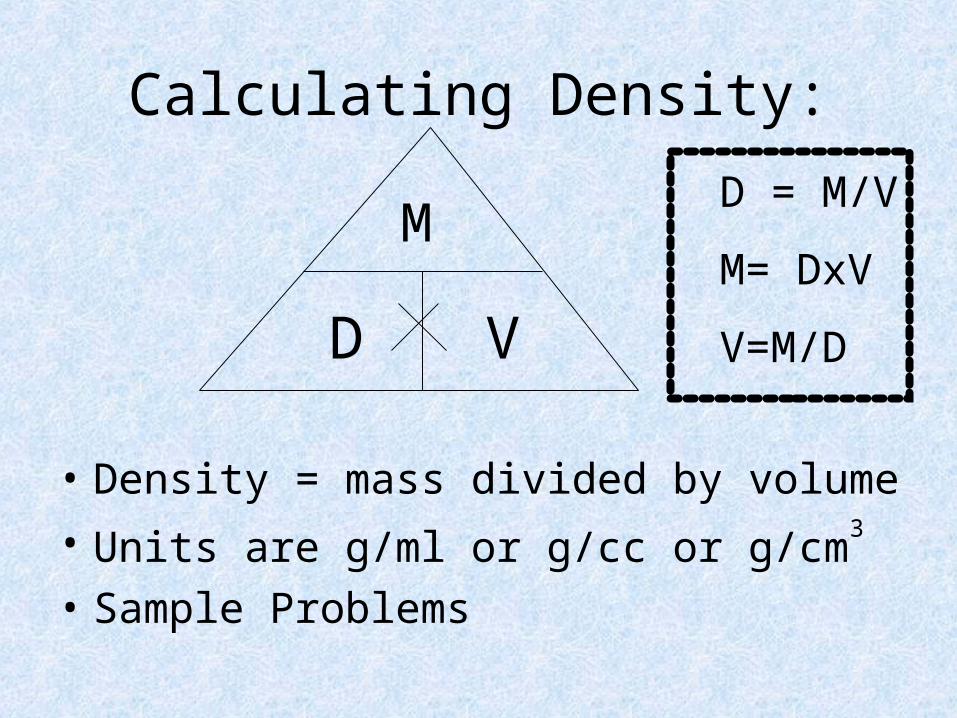
Calculating Density:
• Density = mass divided by volume
• Units are g/ml or g/cc or g/cm3
• Sample Problems
D
M
V
D = M/V
M= DxV
V=M/D
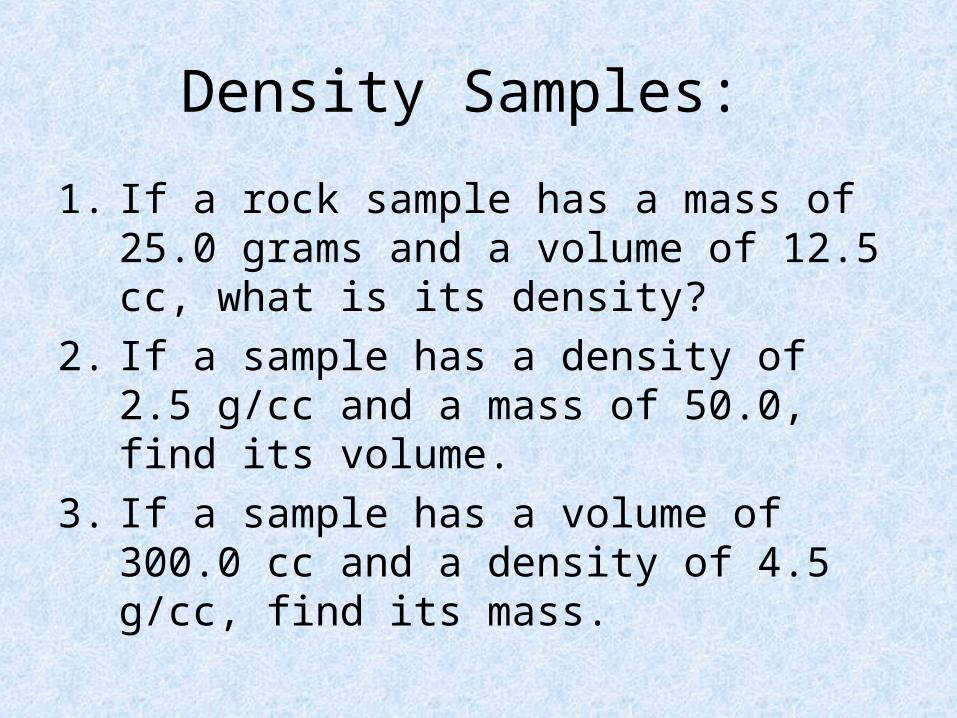
Density Samples:
1. If a rock sample has a mass of 25.0 grams and a volume of 12.5 cc, what is its density?
2. If a sample has a density of 2.5 g/cc and a mass of 50.0, find its volume.
3. If a sample has a volume of 300.0 cc and a density of 4.5 g/cc, find its mass.

Calculate the Density
of theFollowing in
yourNotebooks:
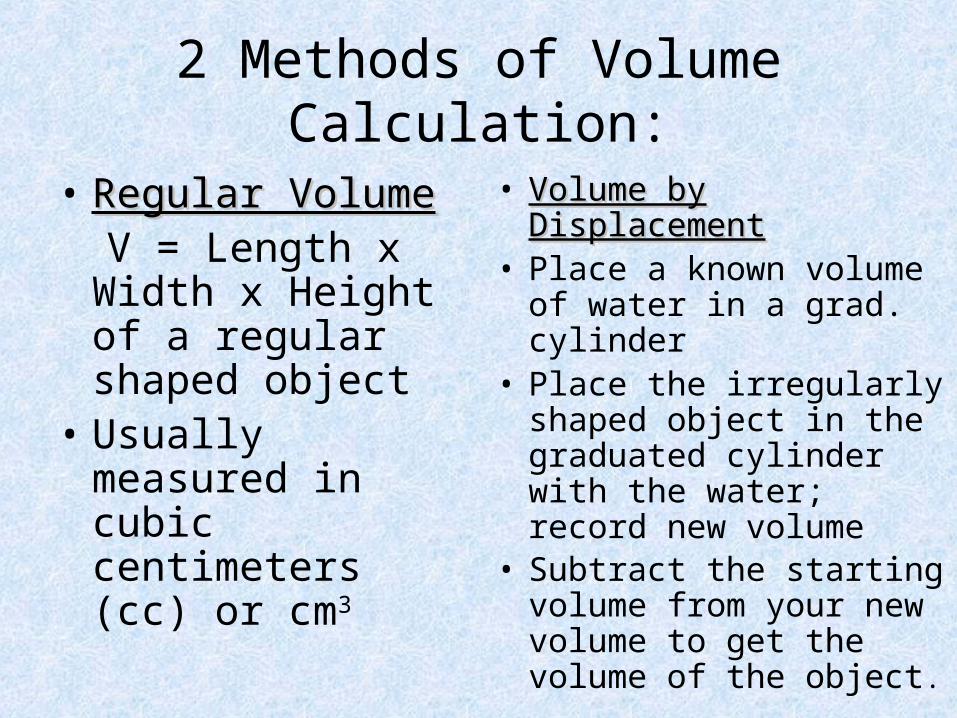
2 Methods of Volume Calculation:
• Regular VolumeRegular Volume V = Length x
Width x Height of a regular shaped object
• Usually measured in cubic centimeters (cc) or cm3
• Volume by Volume by DisplacementDisplacement
• Place a known volume of water in a grad. cylinder
• Place the irregularly shaped object in the graduated cylinder with the water; record new volume
• Subtract the starting volume from your new volume to get the volume of the object.

Factors Affecting Density• Temperature:
– As T Increases, D decreases
– As T decreases, D increases
• Pressure: – As P increases, D increases
– As P decreases, D decreases
Important Point
• The density of a material will always be the same no matter how much you have of it.
• Example: Aluminum is always 2.7g/ml at STP.
• Explain w/ example

Phases of Matter and Density
• Phases of matter= Solid, Liquid or Gas
• All substances, EXCEPT water have their greatest density in the solid phase and least in the gaseous phase.
• Water has it’s highest density in the liquid phase at 3.98oc. That is why ice (solid) floats!
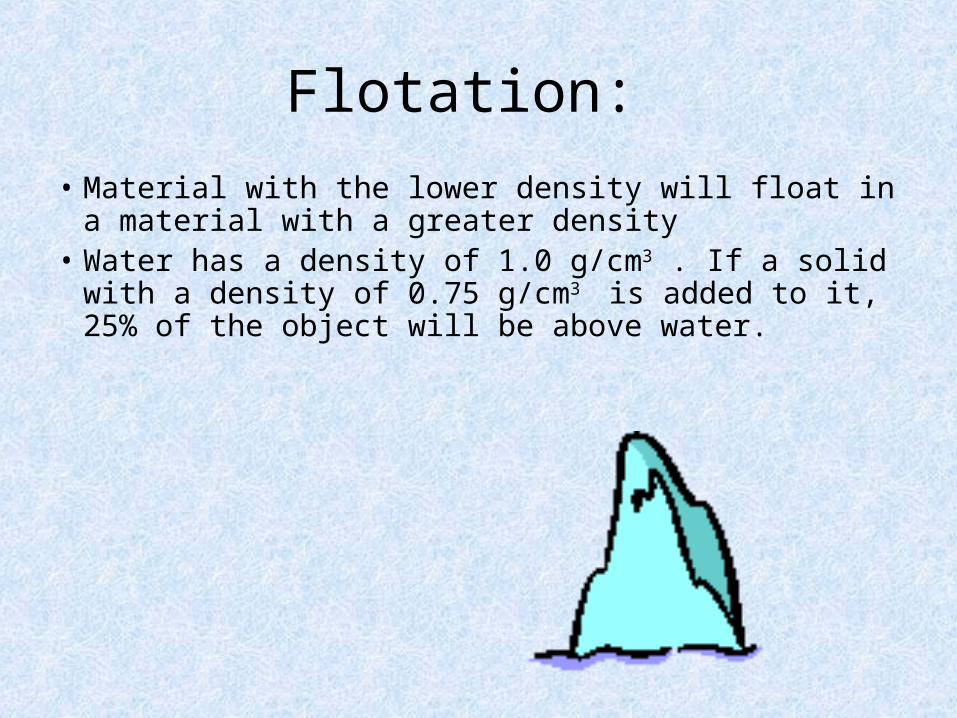
Flotation:
• Material with the lower density will float in a material with a greater density
• Water has a density of 1.0 g/cm3 . If a solid with a density of 0.75 g/cm3 is added to it, 25% of the object will be above water.

Change•A variation that involves the flow of energy across an interface (a boundary); properties or characteristics of the environment are altered
• An EVENT is the occurrence of change.
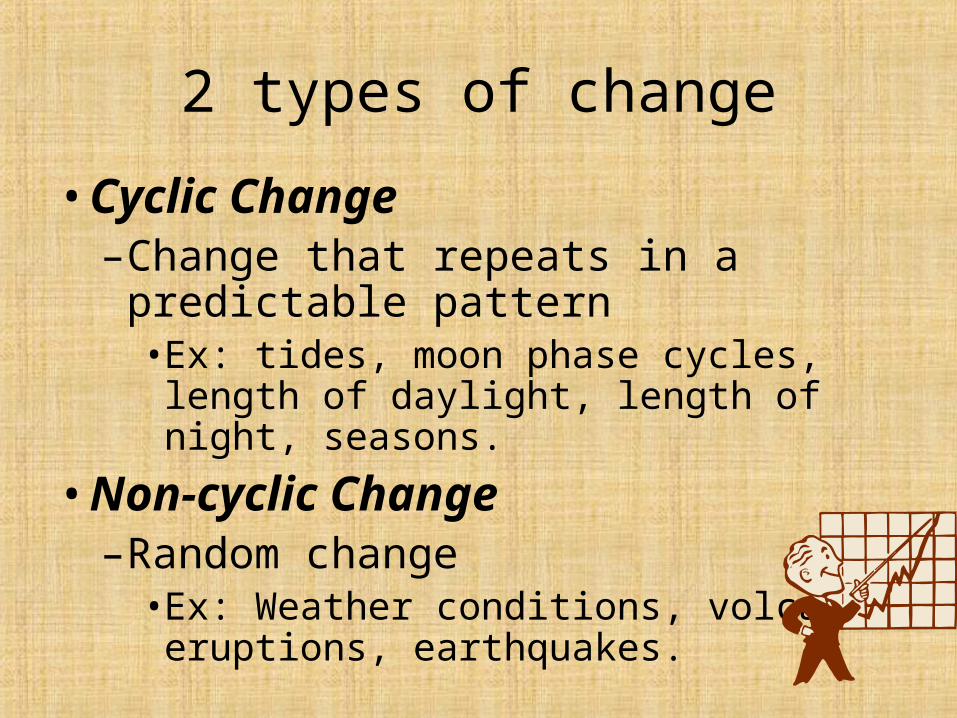
2 types of change
•Cyclic Change–Change that repeats in a predictable pattern•Ex: tides, moon phase cycles, length of daylight, length of night, seasons.
•Non-cyclic Change–Random change
•Ex: Weather conditions, volcanic eruptions, earthquakes.
Frames of Reference Describe change
1.Time– How long it took for a change to
occur
2.Space– Where the change occurred
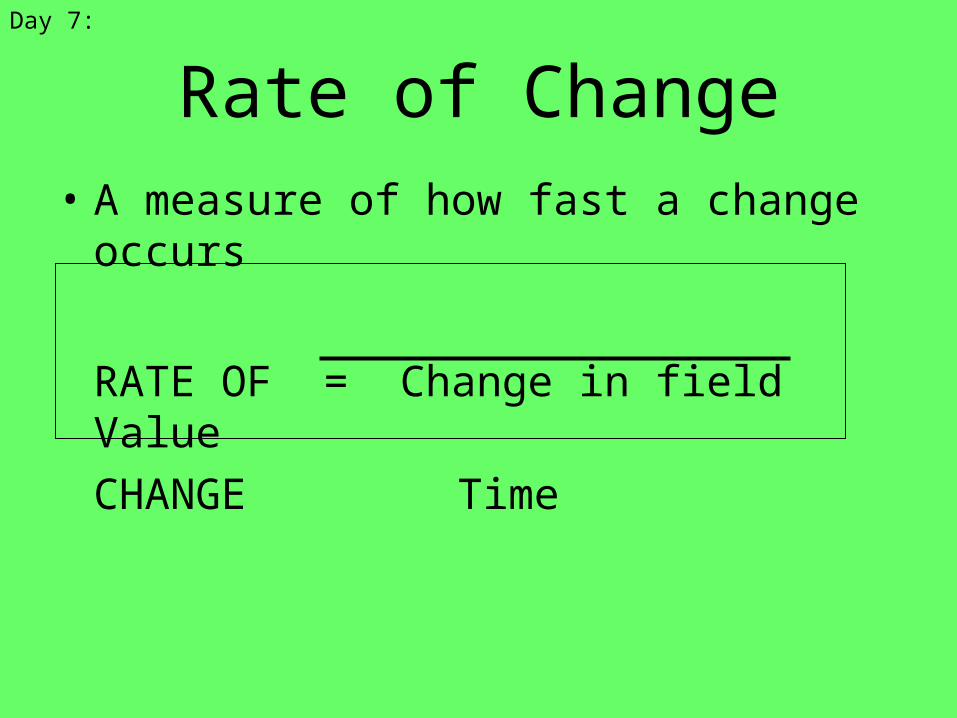
Rate of Change• A measure of how fast a change occurs
RATE OF = Change in field Value
CHANGE Time
Day 7:

Sample Rate of change Problems
1. A student moved 12.0 meters in 8.0 seconds. What was his rate of travel?
2. When it began snowing at 6PM there was 4 inches of snow on the ground. By 9PM there was 12 inches of snow on the ground. What was the rate of change for the snowfall from 6PM to 9PM (to the nearest 1/10th)?
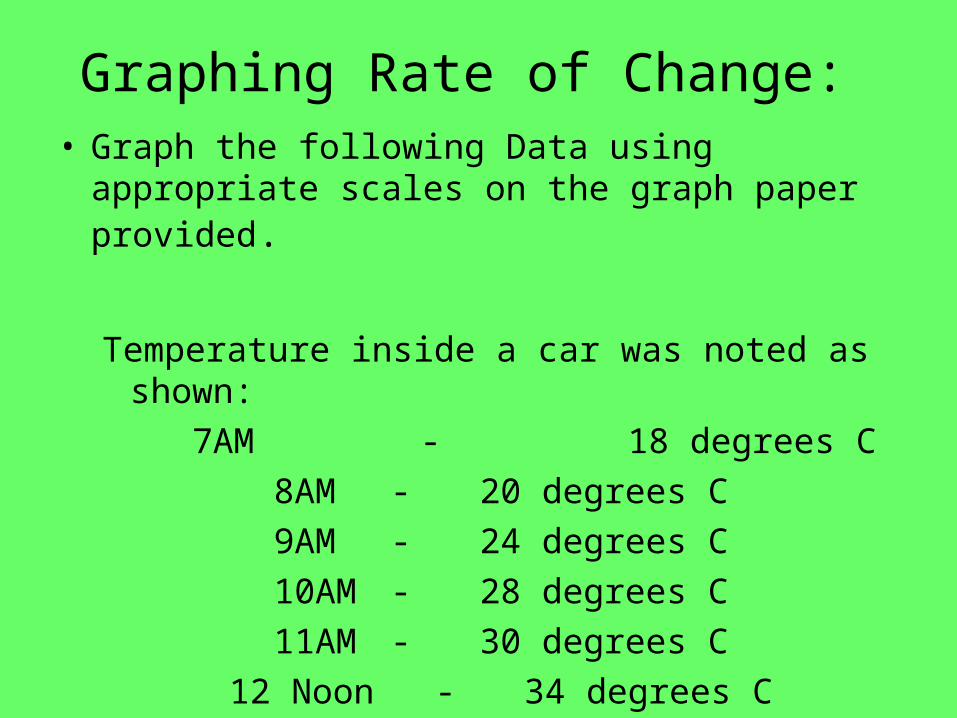
Graphing Rate of Change: • Graph the following Data using appropriate
scales on the graph paper provided.
Temperature inside a car was noted as shown:
7AM - 18 degrees C8AM - 20 degrees C9AM - 24 degrees C10AM - 28 degrees C11AM - 30 degrees C
12 Noon - 34 degrees C

Graphical Relationships
• A relationship showing how one thing affects another
• Direct Relationship:– One quantity increases and the other
one also increases
As X increases,Y increases.
Independent Variable – “X”
Dependent Variable – “Y”
Day 9:

Indirect Relationship
• When one quantity increases and causes the other to decrease
As X increases, Ydecreases.
Dependent Variable – “Y”
Independent Variable – “X”

“No Change” Relationship
• One quantity changes while the other stays the same; a straight horizontal or vertical lines -As X increases,
Y stays the same.
dependent Variable – “Y”
independent Variable – “X

Cyclic Relationship
• A repeating pattern of change over time.
- Ex. seasonal changes
- Ex. Tidal charts
dependent Variable – “Y”
independent Variable – “X

What does this graph say?
As heat increases, body odor increases. The line tells you what the Y axis (B.O.) is doing.
Body odor
Day 9:
Heat