topdanmark q1-q3 report 2021
TRANSCRIPT

21 October 2021, Announcement No. 13/2021
Interim report for Q1-Q3 2021
Topdanmark A/S • Borupvang 4 • DK-2750 Ballerup Tel +45 44 68 33 11 • CVR no. [email protected] • www.topdanmark.com

2 / 31 Announcement No. 13/2021 from Topdanmark A/S
Contents

3 / 31Announcement No. 13/2021 from Topdanmark A/S
Management’s review 5 Highlights6 Financial highlights7 Results for Q1-Q3 20217 Results for Q3 20218 Non-life insurance in Q1-Q3 20219 Non-life insurance in Q3 202111 Life insurance in Q1-Q3 202112 Life insurance in Q3 202112 Investment activities14 Solvency calculation and capital requirements14 Parent company etc.14 Taxation14 Efficiency programme14 New IT systems15 Profit forecast model16 Assumptions for the profit forecast model for 202216 Financial calendar17 Disclaimer
Financial statements for Q1-Q3 2021 – Group19 Income statement20 Statement of comprehensive income21 Assets22 Shareholders’ equity and liabilities23 Cash flow statement24 Statement of changes in equity25 Segment information26 Notes to the financial statements
Financial statements for Q1-Q3 2021 – Parent company29 Income statement29 Statement of comprehensive income30 Balance sheet
31 Statement by Management

4 / 31 Announcement No. 13/2021 from Topdanmark A/S
Management’s review

5 / 31Announcement No. 13/2021 from Topdanmark A/S
Q1-Q3 2021 y Post-tax profit of DKK 1,513m (Q1-Q3 2020:
DKK 553m) y EPS was DKK 17.2 (Q1-Q3 2020: DKK 6.3) y Combined ratio: 84.3 (Q1-Q3 2020: 87.0) y Combined ratio excluding run-off: 86.4
(Q1-Q3 2020: 88.5) y Premiums increased by 4.6% in non-life insurance
and decreased by 9.4% in life insurance. y Profit on life insurance was DKK 371m
(Q1-Q3 2020: DKK 44m). y After return on non-life insurance provisions, the
investment return was DKK 395m (Q1-Q3 2020: DKK 214m (loss)).
Q3 2021 y Post-tax profit of DKK 356m (Q3 2020: DKK 357m) y EPS was DKK 4.0 (Q3 2020: DKK 4.1) y Combined ratio: 85.7 (Q3 2020: 89.8) y Combined ratio excluding run-off profits: 87.6
(Q3 2020: 91.2) y Premiums increased by 4.4% in non-life insurance
and decreased by 0.7% in life insurance. y Profit on life insurance was DKK 113m (Q3 2020:
DKK 69m). y After return on non-life insurance provisions, the
investment return was DKK 8m (Q3 2020: DKK 158m).
Profit forecast model for 2021 y The assumed combined ratio for 2021 is narrowed
from 85-86 to 85-85.5, excluding run-off in Q4 2021.
y The assumed premium growth for non-life is narrowed from 4-5% to 4-4.5%.
y The post-tax profit forecast for 2021 is improved from DKK 1,650-1,750m to DKK 1,750-1,800m, excluding run-off in Q4 2021.
Assumptions for 2022 y Premium growth in non-life of 4-5.5%, and a
combined ratio of 86-89, excluding run-off, are assumed for 2022.
Conference callA conference call will be held today at 15:30 (CET) where Peter Hermann, CEO, and Lars Kufall Beck, CFO, will be available for questions based on the results. The call will be conducted in English.
To participate in the conference call, please call:DK dial-in-number: +45 78 72 32 52SE dial-in-number: +46 8 50 55 83 73UK dial-in-number: +44 333 300 9031US dial-in-number: +1 646 722 4956
10-15 minutes before the conference and ask the operator to connect you to the Topdanmark conference call – or listen to the live transmission of the call.
Please direct any queries to:
Peter Hermann Chief Executive Officer
Lars Kufall Beck Chief Financial Officer
Robin Hjelgaard LøfgrenHead of Investor RelationsDirect tel.: +45 4474 4017 Mobile tel.: +45 2962 1691
Highlights

6 / 31 Announcement No. 13/2021 from Topdanmark A/S
Financial highlightsFull year Q3 Q3 Q1-Q3 Q1-Q3
(DKKm) 2020 2020 2021 2020 2021
Premiums earned:Non-life insurance 9,732 2,428 2,534 7,245 7,575Life insurance 10,981 2,411 2,393 8,406 7,616
20,713 4,839 4,927 15,651 15,191
Results:Non-life insurance 1,302 383 376 653 1,597Life insurance 117 69 113 44 371Parent company etc. 34 8 (16) 25 (18)Pre-tax profit 1,453 460 474 722 1,950Tax (329) (103) (118) (169) (437)Profit 1,124 357 356 553 1,513
Run-off profits, net of reinsurance 164 33 46 114 160
Shareholders' equity of parent company at 1 January 6,703 6,218 6,659 6,703 7,185Profit 1,124 357 356 553 1,513Dividend paid (765) 0 0 (765) (1,800)Dividend own shares 24 0 0 24 48Share-based payments 98 22 25 82 95Other movements in shareholders' equity 1 0 0 1 (1)Shareholders' equity of parent company end of period 7,185 6,598 7,040 6,598 7,040
Deferred tax on security funds (306) (306) (306) (306) (306)Shareholders' equity of Group end of period 6,879 6,292 6,734 6,292 6,734
Total assets, parent company 7,785 7,194 7,888Total assets, Group 109,288 102,508 115,028
Provisions for insurance and investment contracts:Non-life insurance 16,462 17,215 17,698Life insurance 79,335 73,867 85,748
Financial ratios (parent company)Post-tax profit as a percentage of shareholders' equity 16.6 5.6 5.2 8.4 22.2Post-tax EPS (DKK) 12.9 4.1 4.1 6.3 17.3Post-tax EPS, diluted (DKK) 12.9 4.1 4.0 6.3 17.2Dividend per share issued, proposed (DKK) 20.0 - - - -Net asset value per share, diluted (DKK) 82.0 75.4 80.0Listed share price end of period 264.2 307.0 332.0
Number of shares end of period ('000) 87,491 87,262 87,710
Average number of shares ('000) 87,266 87,257 87,703 87,203 87,626Average number of shares, diluted ('000) 87,475 87,453 87,961 87,423 87,858
Ratios non-life insuranceGross loss ratio 67.5 72.2 70.0 68.4 67.9Net reinsurance ratio 2.6 2.6 1.0 2.3 0.6Claims trend 70.1 74.8 71.0 70.8 68.5Gross expense ratio 16.3 15.0 14.8 16.2 15.8Combined ratio 86.5 89.8 85.7 87.0 84.3
Combined ratio excl. run-off profits 88.2 91.2 87.6 88.5 86.4
Ratios have been calculated in accordance with the Danish FSA´s Executive order on Financial Reports for Insurance Companiesand in accordance with the definitions issued by the Danish Finance Society. See accounting policies in the Annual Report 2020.

7 / 31Announcement No. 13/2021 from Topdanmark A/S
Trend in profit Full year Q3 Q3 Q1-Q3 Q1-Q3(DKKm) 2020 2020 2021 2020 2021
Non-life insurance- Technical result 1,316 248 361 945 1,190- Investment return after return and revaluations of non-life insurance provisions etc. (15) 136 15 (292) 406Profit on non-life insurance 1,302 383 376 653 1,597Life insurance 117 69 113 44 371Parent company etc. 34 8 (16) 25 (18)Pre-tax profit 1,453 460 474 722 1,950Tax (329) (103) (118) (169) (437)Profit 1,124 357 356 553 1,513
Results for Q1-Q3 2021
Topdanmark’s post-tax profit for Q1-Q3 2021 was DKK 1,513m (Q1-Q3 2020: DKK 553m).
The technical result increased by DKK 245m to DKK 1,190m. The improvement was driven mainly by improving trends in house insurance and the absence of major weather-related claims in the first half of 2021. Conversely, the very low temperatures in Q1 2021 caused many water pipes to freeze and burst, while Q2 and Q3 2021 saw a higher frequency of rain- and fire-related claims.
The investment return adjusted for return and revaluation on non-life insurance provisions increased by DKK 698m to DKK 406m. The improvement should be seen in the light of the challenging market conditions especially in Q1 2020, whereas the investment return in Q1-Q3 2021 was impacted by more favourable market conditions, especially for equity investments and CLOs.
The profit on life insurance increased by DKK 327m to DKK 371m affected by a higher investment return and a positive development in the sales and administration result.
Results for Q3 2021The profit for Q3 2021 was DKK 356m (Q3 2020:DKK 357m).
The technical result increased by DKK 113m to DKK 361m with stronger performance in house and motor insurance, including positive run-off.
After return on non-life insurance provisions, the investment return in non-life insurance decreased by DKK 121m to DKK 15m. The development should be seen in the light of the strong rebound in financial markets during Q3 2020.
The profit on life insurance increased by DKK 44m to DKK 113m driven by property revaluation as well as the inclusion of Topdanmark Kapitalforvaltning (Topdanmark Asset Management) in the life result from Q3 2021.

8 / 31 Announcement No. 13/2021 from Topdanmark A/S
Claims trend Full year Q3 Q3 Q1-Q3 Q1-Q32020 2020 2021 2020 2021
Claims trend 70.1 74.8 71.0 70.8 68.5Run-off excl. COVID-19 1.9 1.3 1.8 1.9 2.1Weather-related claims (1.0) (1.4) (2.2) (1.4) (0.7)Large-scale claims (0.9) (1.3) (1.8) (1.0) (1.3)Other 0.3 0.0 0.0 0.4 0.3Claims before run-off, weather,large-scale claims and other 70.4 73.4 68.8 70.7 68.8Rain/frost (0.5) (1.1) (0.9) (0.7) (0.9)Discounting 0.4 0.2 0.8 0.5 0.5COVID-19 1.2 1.9 0.8Underlying claims trend 71.6 74.3 68.7 71.3 68.4
In full year 2020, run-off loss of DKK 22m related to COVID-19 effects on income protection insurance is included in the line COVID-19.
Z:\KONCREGN\2021_09 Regn\2.Tabeller\Udvikling i skadeforløbet\Udvikling i skadeforløbet 09 2021 v2.xlsx Skadeforløb TD
Non-life insurance in Q1-Q3 2021
Premiums earnedPremiums earned increased by 4.6% to DKK 7,575m. The private segment accounted for a 2.2% increase, while the SME segment accounted for a 7.2% increase.
In Q3 2020, provisions for unexpired risk increased significantly following the underperformance in house insurance. As the house insurance product has seen stronger performance since then, part of the provisions has been released in Q3 2021.
Claims trend
In addition, provisions for unexpired risk within illness and accident insurance increased in Q3 2021 due to rising inflation. In total, this resulted in an approx. 0.5pp uplift to reported Group premium growth in Q1-Q3 2021.
The distribution agreement with Nordea continues to have good traction and more than compensated for the outflow from the old agreement with Danske Bank in Q1-Q3 2021. We expect the trend to continue throughout 2021.
Financial highlights – Non-life insurance Full year Q3 Q3 Q1-Q3 Q1-Q3(DKKm) 2020 2020 2021 2020 2021
Gross premiums earned 9,732 2,428 2,534 7,245 7,575Claims incurred (6,568) (1,753) (1,773) (4,957) (5,146)Expenses (1,591) (365) (374) (1,174) (1,194)Net reinsurance (257) (63) (25) (170) (46)Technical result 1,316 248 361 945 1,190
Investment return after return and revaluations ofnon-life insurance provisions (12) 135 14 (289) 405Other items (2) 0 1 (2) 2Profit on non-life insurance 1,302 383 376 653 1,597
Run-off profits, net of reinsurance 164 33 46 114 160
Gross loss ratio 67.5 72.2 70.0 68.4 67.9Net reinsurance ratio 2.6 2.6 1.0 2.3 0.6Claims trend 70.1 74.8 71.0 70.8 68.5Gross expense ratio 16.3 15.0 14.8 16.2 15.8Combined ratio 86.5 89.8 85.7 87.0 84.3
Combined ratio excl. run-off profits 88.2 91.2 87.6 88.5 86.4
The claims trend improved to 68.5 in Q1-Q3 2021 from 70.8 in Q1-Q3 2020.
The run-off profit, net of reinsurance, was DKK 160m (Q1-Q3 2020: DKK 138m, excluding COVID-19),
representing a 0.2pp positive effect on the claims trend. Run-off profits were primarily generated in house, in property and in workers’ compensation insurance, while run-off losses were primarily related to illness and accident insurance.
9 / 31Announcement No. 13/2021 from Topdanmark A/S
We saw good traction on the profitability-enhancing measures initiated within house insurance. We have sharpened our focus on acceptance criteria as well as claims prevention and handling, and we have raised prices by 9% on average for around 115,000 customers so far. In addition, we see good results of our procurement efforts within building materials and claims handling. As a result, the claims trend in house insurance improved by approx. 5pp.
Weather-related claims (claims exceeding DKK 4.5m in total over a 72-hour period) amounted to DKK 55m(Q1-Q3 2020: DKK 101m), representing a 0.7pp improvement of the claims trend. This was a result of no weather-related events being big enough to define the resulting claims as weather-related claims in the first two quarters of 2021, whereas Q3 saw a significant number of cloudbursts.
The level of large-scale claims (claims exceeding DKK 5m by event after refund of reinsurance) increased by DKK 32m to DKK 102m, representing a 0.3pp deterioration of the claims trend. This was primarily driven by a few large fire-related events.
Inflation within construction materials has been significant in the first nine months of 2021, most notably on iron and steel but also on timber. In the short term, we are in a good position to handle rising cost inflation through procurement, and our efforts within this area continue as part of the efficiency programme.
In general, and over time, we see around 2-4% overall inflation in claim expenses, varying between different business lines. Over time, it is our target to maintain our profitability by pricing at least in line with inflation.
The claims trend adjusted for run-off, weather-related claims, large-scale claims and other positions including change of risk margin improved by 1.9pp to 68.8.
The underlying claims trend, which is adjusted for the large rain claims in Q1-Q3 2020 as well as in Q1-Q3 2021, severe frost in Q1 2021, discounting and COVID-19 impact, improved by 2.9pp to 68.4. As mentioned in the H1 2021 Report, from Q3 2021 we have stopped reporting on the estimated impact of COVID-19 due to the high uncertainty related to the assessment.
Expense ratioThe expense ratio was 15.8, down from 16.2 in Q1-Q3 2020. The decrease in theexpense ratio is driven by
our efficiency programme and is achieved despite higher sales.
Combined ratioThe combined ratio was 84.3 (Q1-Q3 2020: 87.0). Excluding run-off, the combined ratio was 86.4 (Q1-Q3 2020: 88.5).
Non-life insurance in Q3 2021Premiums earned in Q3 2021 increased by 4.4% to DKK 2,534m. The growth in premiums was 4.2% and 4.5% in the private segment and the SME segment, respectively. In Q3 2021, provisions for unexpired risk within illness and accident increased by DKK 40m due to rising inflation. Offset by the changes to unexpired risk within house, this resulted in an approx. 0.2pp uplift to reported Group premium growth in Q3 2021.
The claims trend was 71.0, down from 74.8 in Q3 2020.
The run-off profit, net of reinsurance, was DKK 46m (Q3 2020: DKK 32m, excluding COVID-19), representing a 0.5pp improvement of the claims trend. Run-off was largely in line with preceding quarters following positive trends in house insurance in the first nine months of 2021. Inflation has had a marked impact on run-off within illness and accident, and workers’ compensation in Q3 2021, but the net impact for the Group is roughly neutral.
Large-scale claims amounted to DKK 46m (Q3 2020: DKK 32m), representing a 0.5pp deterioration of the claims trend. The SME area was hit by a few, but large fire claims.
Weather-related claims were DKK 55m (Q3 2020: DKK 34m) as especially July and August brought many cloudbursts. This represented a deterioration of the claims trend of 0.8pp compared with the level in Q3 2020.
The claims trend was positively impacted by the higher level of interest rates. The discounting effect (movements in the yield curve used for discounting the provisions) had a positive impact on the claims trend of 0.6pp compared with Q3 2020.
The claims trend adjusted for run-off, weather-related claims, large-scale claims and other positions including change of risk margin improved by 4.6pp to 68.8 inQ3 2021.
10 / 31 Announcement No. 13/2021 from Topdanmark A/S
The underlying claims trend, which is adjusted for the extraordinary rain claims, discounting and COVID-19 impact, improved by 5.6pp to 68.7. The improvement is driven by the Private segment.
Segment reporting Private
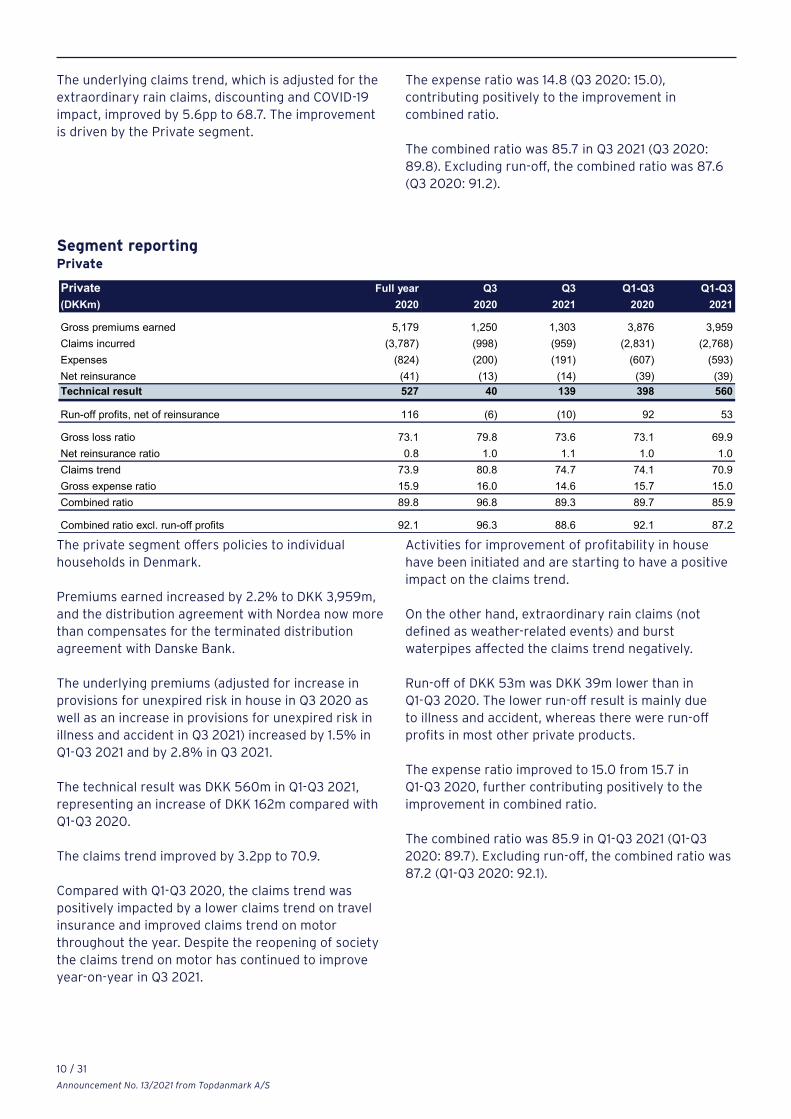
Private Full year Q3 Q3 Q1-Q3 Q1-Q3(DKKm) 2020 2020 2021 2020 2021
Gross premiums earned 5,179 1,250 1,303 3,876 3,959Claims incurred (3,787) (998) (959) (2,831) (2,768)Expenses (824) (200) (191) (607) (593)Net reinsurance (41) (13) (14) (39) (39)Technical result 527 40 139 398 560
Run-off profits, net of reinsurance 116 (6) (10) 92 53
Gross loss ratio 73.1 79.8 73.6 73.1 69.9Net reinsurance ratio 0.8 1.0 1.1 1.0 1.0Claims trend 73.9 80.8 74.7 74.1 70.9Gross expense ratio 15.9 16.0 14.6 15.7 15.0Combined ratio 89.8 96.8 89.3 89.7 85.9
Combined ratio excl. run-off profits 92.1 96.3 88.6 92.1 87.2
Activities for improvement of profitability in house have been initiated and are starting to have a positive impact on the claims trend.
On the other hand, extraordinary rain claims (not defined as weather-related events) and burst waterpipes affected the claims trend negatively.
Run-off of DKK 53m was DKK 39m lower than in Q1-Q3 2020. The lower run-off result is mainly due to illness and accident, whereas there were run-off profits in most other private products.
The expense ratio improved to 15.0 from 15.7 in Q1-Q3 2020, further contributing positively to the improvement in combined ratio.
The combined ratio was 85.9 in Q1-Q3 2021 (Q1-Q3 2020: 89.7). Excluding run-off, the combined ratio was 87.2 (Q1-Q3 2020: 92.1).
The private segment offers policies to individual households in Denmark.
Premiums earned increased by 2.2% to DKK 3,959m, and the distribution agreement with Nordea now more than compensates for the terminated distribution agreement with Danske Bank.
The underlying premiums (adjusted for increase in provisions for unexpired risk in house in Q3 2020 as well as an increase in provisions for unexpired risk in illness and accident in Q3 2021) increased by 1.5% in Q1-Q3 2021 and by 2.8% in Q3 2021.
The technical result was DKK 560m in Q1-Q3 2021, representing an increase of DKK 162m compared with Q1-Q3 2020.
The claims trend improved by 3.2pp to 70.9.
Compared with Q1-Q3 2020, the claims trend was positively impacted by a lower claims trend on travel insurance and improved claims trend on motor throughout the year. Despite the reopening of society the claims trend on motor has continued to improve year-on-year in Q3 2021.
The expense ratio was 14.8 (Q3 2020: 15.0), contributing positively to the improvement in combined ratio.
The combined ratio was 85.7 in Q3 2021 (Q3 2020: 89.8). Excluding run-off, the combined ratio was 87.6 (Q3 2020: 91.2).

11 / 31Announcement No. 13/2021 from Topdanmark A/S
Result of life insurance Full year Q3 Q3 Q1-Q3 Q1-Q3(DKKm) 2020 2020 2021 2020 2021
Investment return on shareholders' equity 19 23 68 (40) 241Sales and administration (43) 9 8 (31) 19Insurance risk (10) (1) 2 0 (3)Risk return on shareholders' equity 152 38 36 115 113Profit on life insurance 117 69 113 44 371
Z:\KONCREGN\2021_09 Regn\2.Tabeller\Resultat livsforsikring\Resultat livsforsikring 09 2021.xlsxResultat livsforsikring 09 2021.xlsx
SME Full year Q3 Q3 Q1-Q3 Q1-Q3(DKKm) 2020 2020 2021 2020 2021
Gross premiums earned 4,571 1,183 1,235 3,385 3,630Claims incurred (2,799) (760) (818) (2,139) (2,390)Expenses (767) (165) (184) (568) (603)Net reinsurance (216) (50) (11) (131) (7)Technical result 789 208 222 547 631
Run-off profits, net of reinsurance 47 39 56 22 107
Gross loss ratio 61.2 64.2 66.2 63.2 65.8Net reinsurance ratio 4.7 4.2 0.9 3.9 0.2Claims trend 66.0 68.5 67.1 67.1 66.0Gross expense ratio 16.8 14.0 14.9 16.8 16.6Combined ratio 82.7 82.4 82.0 83.8 82.6
Combined ratio excl. run-off profits 83.8 85.7 86.6 84.5 85.6
SME
The SME segment offers policies to Danish-based SMEs and agricultural businesses.
Premiums earned increased by 7.2% to DKK 3,630m, and by 4.5% in Q3 2021.
The underlying premiums adjusted for extraordinary items increased by 6.4% in Q1-Q3, and by 4.6% in Q3 2021.
The technical result increased by DKK 84m to DKK 631m in Q1-Q3 2021. Run-off increased to DKK 107m in Q1-Q3 2021 (Q1-Q3 2020: DKK 22m), driven mainly by liability insurance and building insurance.
The claims trend improved by 1.1pp to 66.0, as the higher run-off level was partly offset by a few large fire claims, which for the most part was covered by reinsurance.
The expense ratio was 16.6 in Q1-Q3 2021 which is 0.2pp below Q1-Q3 2020.
The combined ratio improved to 82.6 in Q1-Q3 2021(Q1-Q3 2020: 83.8).
Excluding run-off, the combined ratio was 85.6 in Q1-Q3 2021 (Q1-Q3 2020: 84.5), with the negative development being driven by a few large and exceptional fire claims.
Life insurance in Q1-Q3 2021
The result from life insurance was a profit of DKK 371m (Q1-Q3 2020: DKK 44m).
Profit on life insurance activities comprises the profit on life insurance plus the investment return of Topdanmark Liv Holding. These profits are calculated in accordance with the stated policy for the calculation of profit for the life insurance company: see www.topdanmark.com → About Topdanmark → Business → Life insurance → Policy for the calculation of profit in life insurance.
Developments in Q1-Q3 2021The positive development primarily derives from investment return on shareholders’ equity, and sales and administration result. The investment return on shareholders’ equity was DKK 241m in Q1-Q3 2021 (Q1-Q3 2020: DKK 40m (loss)) affected by a return higher than assumed, primarily due to property revaluation.
The result of sales and administration increased by DKK 50m to DKK 19m primarily as higher assets under management gave increased fees/commissions from

12 / 31 Announcement No. 13/2021 from Topdanmark A/S
Topdanmark Asset Management. The insurance risk result has decreased from DKK 0m to DKK 3m (loss). The insurance risk result may fluctuate from one quarter to the next.
Trend in premiumsGross premiums decreased by 9.4% to DKK 7,616m in Q1-Q3 2021, of which premiums on unit-linked pension schemes were DKK 7,118m, representing an 8.9% decrease compared with Q1-Q3 2020.
Regular premiums increased by 1.5% to DKK 2,548m in Q1-Q3 2021. Single premiums were DKK 5,068m in Q1-Q3 2021, representing a 14.0% decrease.
Investment activities Topdanmark Group excl. life insurance
Investment return Portfolio 30 Sep2020 2021
(DKKm) % (DKKm) % (DKKm) % (DKKm) %
Danish equities 0.3 0.2 34 12.1 (2) (0.5) 31 10.9 28 14.5Foreign equities 0.8 0.8 40 5.5 6 1.2 (19) (2.5) 116 14.9Unlisted equities and hedge funds 0.3 0.4 25 7.2 (3) (0.8) (21) (5.9) 32 9.4Government and mortgage bonds 16.9 16.0 89 0.5 (105) (0.6) 120 0.7 (489) (2.9)Index linked bonds 0.3 0.5 (5) (1.7) (8) (1.6) 7 2.4 (14) (3.3)CLOs 0.5 0.7 31 6.4 33 4.9 (69) (11.9) 142 25.0Properties 1.3 1.2 14 1.1 29 2.4 40 3.2 74 6.3Expenses, money markets etc. 1.8 2.0 (6) (0.3) 5 0.3 (15) (0.9) 10 0.5Subordinated loan capital (1.7) (0.9) (12) (0.7) (9) (0.7) (35) (2.0) (29) (1.8)
20.4 21.0 209 1.0 (54) (0.3) 39 0.2 (128) (0.6)Asset management (2021: 6 months) 22 - 65 31Investment return 231 (54) 104 (97)
non-life insurance provisions (73) 62 (318) 492Investment return after returnon non-life insurance provisions 158 8 (214) 395
The exposure in foreign equities and credit bonds has been adjusted by the use of derivatives. The return percentages are calculated as the ratio betweenthe return on financial instruments and the size of the exposure of the underlying asset. The return on properties includes revaluation of owner-occupied property, which has been included in other comprehensive income.
Q1-Q3 2020 Q1-Q3 2021Return Return
(DKKbn)
Return and revaluations of
Return Q3 2020 Return Q3 2021
Z:\KONCREGN\2021_09 Regn\2.Tabeller\Afkasttabel til og fra TDK\R_AFKAST_TABEL 09 2021 121021.xlsx TD-KC15/10/2021
Life insurance in Q3 2021The result in Q3 2021 was a profit of DKK 113m (Q3 2020: DKK 69m).
The profit on life insurance increased by DKK 44m due to a higher investment return on shareholders’ equity. This derives from property revaluation in Q3 2021 as well as Topdanmark Livsforsikring acquiring Topdanmark Kapitalforvaltning (Topdanmark Asset Management) whose result also contributes positively in Q3 2021.
Gross premiums decreased by 0.7% to DKK 2,393m in Q3 2021, of which premiums on unit-linked pension schemes were DKK 2,250m, a 0.3% decrease compared with Q3 2020.
Regular premiums increased by 2.7% to DKK 837m in Q3 2021 whereas single premiums decreased by 2.5% to DKK 1,557m.
The investment return of the Topdanmark Group excluding life insurance was a loss of DKK 97m in Q1-Q3 2021 (Q1-Q3 2020: DKK 104m). Return and revaluation of non-life insurance provisions were DKK 492m in Q1-Q3 2021 (Q1-Q3 2020: DKK 318m (loss)).
The return on investments after return and revaluation of non-life insurance provisions in Q1-Q3 2021 was DKK 395m and thus DKK 303m higher than the assumed return, when calculated by means of Topdanmark’s forecast model at the beginning of 2021. The higher return should be seen in the light of the financial rebound after the COVID-19 pandemic

13 / 31Announcement No. 13/2021 from Topdanmark A/S
The class “Credit bonds” is composed of a minor share of a well-diversified portfolio of credit bonds, primarily issued from businesses in Europe.
The class “Index linked bonds” comprises bonds, primarily Danish mortgage bonds, for which the coupon and principal are index linked.
The class “CLOs” primarily comprises positions in CLO equity tranches. The underlying assets of CLOs are mostly senior secured loans, while the remainder are primarily investment grade investments.
The property portfolio mainly comprises owner-occupied property (DKK 805m). The properties are valued in accordance with the rules of the Danish FSA (Danish Financial Supervisory Authority) i.e. at market value taking into account the level of rent and the terms of the tenancy agreements. The property portfolio is currently fully let when adjusting for properties under construction or being converted for other purposes.
“Expenses, money markets etc.” comprises money market deposits, intra-group balances, the result from currency positions, other returns and expenses not included in the other classes.
“Subordinated loan capital” comprises subordinated loans issued by the parent company and by Topdanmark Forsikring.
We use the Solvency ll discounting curve with volatility adjustment (VA) for assessing insurance provisions. The VA component comprises a corrective element for the development in pricing of Danish mortgage bonds, as well as a corrective element for the development in pricing of European business credits. The VA component was 22bp at the beginning of the year and 55bp at the end of Q3 2021.
seems to be contained by vaccines.
In Q3 2021, the Danish mortgage bond market which is dominated by AAA bonds was charaterised by some widening of spreads to swaps. The loss suffered on assets hedging the provisions due to this widening exceeded the profit from revaluations of provisions in Q3 2021. Q1-Q3 2021 gains on return and revaluation of provisions still dominates the losses from assets hedging the interest sensitivity – however, with a narrower margin than after H1.
Topdanmark’s policy is to accept a certain level of financial risk, given its strong liquidity and stable, high earnings from insurance operations. Among other things, Topdanmark has invested in equities, properties, and CLOs to improve the average investment return.
The equity exposure was DKK 898m pre-tax and excluding associated companies but including the impact of derivatives. The equity portfolios are well diversified with no large individual positions.
The composition of the portfolios is based on OMXCCAP for Danish equities, representing approx. 20% of the portfolio as at 30 September 2021, and the foreign portfolios are based on MSCI World DC in local currency for foreign equities.
The class “Unlisted equities and hedge funds” includes private equity positions (DKK 26m) and positions in hedge funds where the investment mandates aim at positioning in the credit market (DKK 223m).
The Group’s investments have no significant concentration of credit risk except for investments in AAA-rated Danish mortgage bonds.
The class “Government and mortgage bonds” mainly consists of Danish government and mortgage bonds. The interest rate sensitivity of this asset class is to a significant extent equivalent to the total interest rate sensitivity of the technical provisions in Topdanmark Forsikring, and the illness and accident provisions in Topdanmark Livsforsikring (the life insurance company). Consequently, the return on “Government and mortgage bonds” and the return and revaluation of non-life insurance provisions should be assessed on an aggregate level. However, as mentioned above during times of financial distress, proper interest risk management does not necessarily ensure that losses on liabilities are offset by gains on assets and vice versa.

14 / 31 Announcement No. 13/2021 from Topdanmark A/S
We still have ample capacity to potentially issue new Tier 2 debt.
Parent company etc.The parent company, Topdanmark, does not perform any independent activities. The profit of the parent company etc. includes the profits from subsidiaries not within the insurance business (primarily Topdanmark Asset Management up to and including Q2 2021), finance costs and other expenses.
The profit of the parent company decreased by DKK 43m to DKK 18m (loss) in Q1-Q3 2021.
TaxationThe tax charge was DKK 437m of the pre-tax profit of DKK 1,950m, corresponding to an effective tax rate of 22.4% (Q1-Q3 2020: 23.4%).
Efficiency programmeAs announced in the Q3 2020 Report, we are upscaling the level of investments to improve the efficiency of the group.
The main focus areas in the efficiency programme are: y Automation/digitalisation of routine-based
processes y Risk and pricing y Procurement and cost
Please refer to the Annual Report 2020 for the full details of the programme.
The annual gross efficiency gains are targeted to be DKK 500m in 2025. We continue to expect a net impact of the efficiency programme of around DKK 70m in 2021. So far, our efforts to become more efficient are progressing according to plan.
New IT systemsWe have initiated the process of implementing the new IT system in non-life, and the implementation is so far progressing according to plan.
Please refer to the Annual Report 2020 for the full details of the implementation plan.
Solvency calculation and capital requirements
Solvency II provides insurance companies with the opportunity to develop their own full or partial internal risk model for solvency calculation. We use such a partial internal in-house developed model to calculate the non-life risk.
This model, approved by the Danish FSA, provides thebasis for including non-life risks in our solvency calculations while we use the standard model for life products.
The SCR in Topdanmark Livsforsikring increased from DKK 1,395m end Q2 2021 to DKK 1,527m end Q3 2021 as the impact from the solvency stress scenario on profit margin increased.
As a result, Topdanmark Livsforsikring’s solvency cover decreased to 328% end Q3 2021 from 361% end Q2 2021.
The solvency cover for the Group decreased to 243% end Q3 2021 from 246% end Q2 2021 as the quarterly result was more than offset by the increase in solvency requirement.
We have an outstanding subordinated tier 1 loan (restricted tier 1 capital notes) of DKK 400m. This loan is perpetual, but includes an option enabling us to redeem the loan as at 23 November 2022. Topdanmark Forsikring also has an outstanding subordinated tier 2 loan of DKK 500m with first call date in 2025 and maturity in 2030.
Further, we have redeemed DKK 850m of outstanding Tier 2 debt as at 11 September 2021, which was already deducted from own funds by the end of Q2 2021.
Solvency cover 31 Dec 30 Sep 30 Sep(DKKm) 2020 2020 2021
Shareholders´equity 6,879 6,292 6,734Proposed dividend (1,800) 0 0Deferred tax on security funds 306 306 306Profit margin 1,442 1,025 2,504Intangible assets (1,529) (1,452) (1,592)Other (169) (181) (178)Tax effects (41) 37 (258)Subordinated loan tier 1 400 400 400Subordinated loans tier 2, usable share 1,350 1,362 500Own funds 6,839 7,788 8,415Solvency requirement 4,016 3,888 3,469Solvency cover (%) 170 200 243
Potential dividend for the interim periods was not deducted.
Z:\KONCREGN\2021_09 Regn\2.Tabeller\Solvensdækning\Solvensdækning 09 2021.xlsx Solvensdækning TD

15 / 31Announcement No. 13/2021 from Topdanmark A/S
Profit forecast model
y Large-scale claims amounted to DKK 46m in Q3, which is DKK 21m higher than assumed, corresponding to a deterioration of the assumed combined ratio for 2021 by 0.2pp.
y Provisions for unexpired risk within illness and accident increased by DKK 40m in Q3 as a result of rising inflation, corresponding to a 0.3pp deterioration of the combined ratio for 2021.
y Improving underlying trends mainly within house insurance as a result of our profitability-enhancing measures, corresponding to a 0.4pp improvement of the combined ratio for 2021.
The assumed combined ratio for 2021 is narrowed from about 85-86 to 85-85.5 excluding run-off in Q4 2021.
The underlying business momentum remained solid, but due to the provisions for unexpired risk the assumed premium growth in non-life is narrowed from 4-5% to 4-4.5%.
The overall assumed pre-tax result for non-life insurance is DKK 1,870-1,920m excluding run-off in Q4 2021.
Life insuranceIn the H1 2021 Report, we assumed a pre-tax profit on life insurance of DKK 320-370m for 2021. The assumptions behind this forecast can be found in the H1 2021 Report. Since this report, the following major changes to assumptions have occurred: y The investment return in Q3 2021 was DKK 35m
higher than forecasted. y Sales and administration and the risk result in
Q3 2021 were DKK 15m higher than forecasted.
Profit forecast 2021 Results(DKKm) 2020
Non-life insurance- Technical result 1,316 1,450 – 1,500 1,470 – 1,500- Investment return after return and revaluations of non-life insurance provisions etc. (15) 380 – 430 400 – 420Profit on non-life insurance 1,302 1,830 – 1,930 1,870 – 1,920Life insurance 117 320 – 370 400 – 425Parent company etc. 34 (30) – (20) (30) – (25)Pre-tax profit 1,453 2,120 – 2,280 2,240 – 2,320Taxation (329) (470) – (530) (490) – (520)Profit for the year 1,124 1,650 – 1,750 1,750 – 1,800
Forecast 202130 June 2021
Forecast 202130 September 2021
Z:\KONCREGN\2021_09 Regn\2.Tabeller\Resultatforventninger\Resultatforventninger 09 2021.xlsxTD-KC
Traditionally, we do not publish actual profit forecasts, but instead, the expected level of results provided that a number of assumptions about the return in the financial markets are met. The return on financial assets changes on a daily basis, and consequently our profit forecast model will already deviate from actual expectations by the time it is published. Therefore, set out at www.topdanmark.com → Investors → Risk management, we provide additional information on how changes in the assumptions underlying the profit forecast model will affect the results.
As can be seen, the investment return forecast model is not based on a specific estimate of the expected investment return for the rest of the year, but solely on a long-term standard assumption regarding the return.
In the H1 2021 Report, it was stated that our post-tax model profit forecast for 2021 was DKK 1,650-1,750m exclusive run-off in H2 2021.
Non-life insuranceFor non-life insurance, we assumed a pre-tax profit of DKK 1,830-1,930m for 2021 in the H1 2021 Report. The assumptions behind this model profit forecast can be found in the H1 2021 Report. Since this report, the following major changes to assumptions have occurred: y In Q3 2021, there were run-off profits of DKK 46m,
corresponding to a 0.5pp improvement of the combined ratio for 2021.
y Weather-related claims amounted to DKK 55m in Q3, which is DKK 10m higher than assumed, corresponding to a deterioration of the assumed combined ratio for 2021 by 0.1pp.

16 / 31 Announcement No. 13/2021 from Topdanmark A/S
Note that the sales and administration result can fluctuate between quarters.
The assumed pre-tax result on life insurance is adjusted to DKK 400-425m.
The result is very sensitive to fluctuations particularly in the investment return. The risk return and shadow account will not be finally determined before year end.
Parent companyThe profit forecast model for the parent company plus subsidiaries outside of the insurance group assumes an almost unchanged pre-tax profit of DKK 25-30m (loss) compared with the H1 2021 Report.
TaxationGiven a corporation tax rate of 22%, the tax charge is expected to be DKK 490-520m.
Total Group profitTopdanmark’s overall post-tax forecast for 2021 is upgraded to DKK 1,750-1,800m, representing an EPS of DKK 20.0-20.5. The assumed profit is exclusive of run-off in Q4 2021.
The profit forecast model assumes an annual 7.0% return on equities, and unchanged foreign exchange rates from the level of 30 September 2021.
Furthermore, it is assumed that the return on interest-bearing assets that hedge the discounted provisions exactly suffices to cover discounting and revaluation of the provisions.
Assumptions for the profit forecast model for 2022Non-life insuranceFor 2022, the assumed premium growth in non-life will be 4-5.5% and the assumed combined ratio will be 86-89, excluding run-off.
The profit forecast model is based upon the following assumptions among others: y Continued positive net impact on premiums from
the switch of distribution partner from Danske Bank to Nordea
Announcement of 2021 Annual Results 21 Jan 2022
Deadline for submittingitems for AGM agenda 9 Feb 2022
2021 Annual Report 24 Feb 2022
AGM 24 Mar 2022
Q1 2022 Interim Report 26 Apr 2022
2022 Half-year Report 15 July 2022
Q1-Q3 2022 Interim Report 21 Oct 2022
Z:\KONCREGN\2021_09 Regn\2.Tabeller\Finanskalender\Finanskalender 09 2021.xlsxengelsk
y The automatic premium indexing, excluding any additional or extraordinary price increases, in the private segment will be 2.5% in 2022. Approx. 70% of our premiums earned are subject to automatic premium indexing. Thus, the premium effect of the automatic premium indexing on non-life insurance is approx. 1.8%.
y Automatic premium indexing of workers’ compensation insurance
y Continued positive effects from our pricing initiative on house insurance
y The positive COVID-19 effects are expected to significantly decrease in 2022 as claims frequencies across all products except travel have normalised. This is expected to increase the combined ratio by 0.9pp compared with 2021.
y Weather related claims of DKK 170m y Large-scale claims (large-scale claims of a gross
value exceeding DKK 5m) of DKK 100m y An expense ratio of 15-16 y A level of interest rates corresponding to the
interest rate curve on 30 September 2021 y Continued good traction on our efficiency
programme, including a larger positive net impact compared with 2021.
Financial calendar

17 / 31Announcement No. 13/2021 from Topdanmark A/S
DisclaimerThis interim report includes statements relating to the future. Such statements are uncertain and involve both general and specific risks.
Many factors may cause significant deviation from the forecasts and assumptions set out in the interim report.
Such factors could be, for example, cyclical movements, changes in the financial markets, the financial effect of unexpected events such as acts of terror or exceptional weather conditions, changes in Danish and EU rules, competitive factors in the insurance industry, and trends in the reinsurance market. See also: www.topdanmark.com → Investor → Risk management.
The above description of risk factors is not exhaustive. Investors and others, who may base decisions relating to Topdanmark on statements relating to the future, should give their own careful consideration to these and other factors of uncertainty.
Topdanmark’s statements relating to the future are solely based on information known at the time of the preparation of this interim report.

18 / 31 Announcement No. 13/2021 from Topdanmark A/S
Financial statements for Q1-Q3 2021 – Group

19 / 31Announcement No. 13/2021 from Topdanmark A/S
Income statement GroupFull year Q3 Q3 Q1-Q3 Q1-Q3
(DKKm) Note 2020 2020 2021 2020 2021
NON-LIFE INSURANCE
Gross premiums written 9,803 1,853 1,983 8,086 8,481Ceded reinsurance premiums (592) (144) (167) (538) (559)Change in the provisions for unearned premiums 282 485 446 (908) (1,062)Change in profit margin and risk margin (323) 106 128 98 227Change in the reinsurers' share of the provisions for unearned premiums 3 (2) 0 105 107Premiums earned, net of reinsurance 9,174 2,297 2,390 6,843 7,194
Claims paid (6,500) (1,559) (1,403) (4,851) (4,558)Reinsurance cover received 292 93 86 231 212Change in the provisions for claims (87) (190) (366) (125) (599)Change in risk margin 30 (1) (1) 29 20Change in the reinsurers' share of the provisions for claims (41) (32) 32 (28) 134Claims incurred, net of reinsurance 1 (6,305) (1,688) (1,653) (4,745) (4,792)
Bonuses and rebates (31) (16) (23) (31) (71)
Acquisition costs (1,015) (224) (224) (747) (762)Administrative expenses (550) (133) (145) (408) (415)Reinsurance commission and share of profits 81 22 24 61 61Insurance operating expenses, net of reinsurance (1,484) (335) (345) (1,094) (1,116)TECHNICAL RESULT FROM NON-LIFE INSURANCE 1,354 258 370 974 1,216
LIFE INSURANCE
Gross premiums written 2 10,981 2,411 2,393 8,406 7,616Ceded reinsurance premiums (1) (0) (0) (1) (1)Premiums, net of reinsurance 10,980 2,411 2,393 8,405 7,615
Allocated investment return, net of reinsurance 5,291 2,356 482 (62) 6,893
Pension return tax (617) (81) (71) 4 (997)
Claims and benefits paid (6,393) (1,660) (2,050) (4,642) (6,718)Reinsurance cover received 6 1 0 5 3Claims and benefits paid, net of reinsurance (6,387) (1,660) (2,050) (4,637) (6,716)
Change in the life insurance provisions (8,839) (2,923) (673) (3,410) (5,258)Change in the reinsurers' share (7) (1) (0) (5) (1)Change in the life insurance provisions, net of reinsurance (8,847) (2,923) (673) (3,415) (5,260)
Change in profit margin (38) (5) 24 (0) (1,225)
Acquisition costs (184) (38) (47) (133) (141)Administrative expenses (375) (90) (98) (274) (299)Insurance operating expenses, net of reinsurance (559) (128) (145) (407) (440)TECHNICAL RESULT FROM LIFE INSURANCE (176) (30) (40) (112) (129)

20 / 31 Announcement No. 13/2021 from Topdanmark A/S
Income statement GroupFull year Q3 Q3 Q1-Q3 Q1-Q3
(DKKm) 2020 2020 2021 2020 2021
NON-TECHNICAL ACTIVITIES
Technical result from non-life insurance 1,354 258 370 974 1,216Technical result from life insurance (176) (30) (40) (112) (129)
Income from associates 92 4 101 13 384Income from investment properties 191 56 53 145 155Interest income and dividends etc. 1,909 394 599 1,370 1,878Revaluations 3,981 2,261 (128) (1,238) 5,024Interest charges (102) (24) (21) (79) (65)Expenses on investment activities (86) (20) (28) (62) (78)Total investment return 5,986 2,671 575 149 7,298
Return and revaluations of non-life insurance provisions (374) (73) 62 (318) 492Investment return transferred to life insurance business (5,291) (2,356) (482) 62 (6,893)Other income 14 3 (5) 9 8Other expenses (59) (13) (6) (41) (42)PRE-TAX PROFIT 1,453 460 474 722 1,950
Taxation (329) (103) (118) (169) (437)PROFIT FOR THE PERIOD 1,124 357 356 553 1,513
EPS (DKK) 12.9 4.1 4.1 6.3 17.3EPS, diluted (DKK) 12.9 4.1 4.0 6.3 17.2
Statement of comprehensive income ● Group
Profit for the period 1,124 357 356 553 1,513
Items which cannot subsequently be reclassified as profit or loss:Revaluation / Reversed revaluation owner-occupied properties 1 0 0 1 (2)Taxation (0) 0 0 (0) 0Other comprehensive income 1 0 0 1 (1)TOTAL COMPREHENSIVE INCOME FOR THE PERIOD 1,125 357 356 554 1,512

21 / 31Announcement No. 13/2021 from Topdanmark A/S
Assets Group31 Dec 30 Sep 30 Sep
(DKKm) 2020 2020 2021
INTANGIBLE ASSETS 1,486 1,452 1,592
Operating equipment 108 112 97Owner-occupied properties 837 837 805TOTAL TANGIBLE ASSETS 946 949 902
Investment properties 3,934 4,005 3,788
Equity investments in associates 1,741 1,662 2,123Total investments in associates 1,741 1,662 2,123
Equity investments 4,751 4,445 4,769Unit trusts 2 1 1Bonds 41,776 43,573 38,898Loans guaranteed by mortgages 6 6 5Deposits with credit institutions 4,989 3,067 2,260Derivatives 1,405 762 229Total other financial investment assets 52,928 51,853 46,162TOTAL INVESTMENT ASSETS 58,603 57,520 52,073
INVESTMENT ASSETS RELATED TO UNIT-LINKED PRODUCTS 44,997 39,658 57,684
Reinsurers' share of the provisions for unearned premiums 96 187 191Reinsurers' share of the life insurance provisions 5 7 3Reinsurers' share of the provisions for claims 440 452 570Total reinsurers' share of provisions 541 646 764
Receivables from policyholders 283 318 328Receivables from insurance companies 71 92 85Receivables from associates 252 261 243Other receivables 584 510 354TOTAL RECEIVABLES 1,731 1,827 1,773
Deferred tax assets 33 32 64Liquid funds 846 422 228Other 20 61 67TOTAL OTHER ASSETS 899 515 360
Accrued interest and rent 415 347 403Other prepayments and accrued income 210 240 240TOTAL PREPAYMENTS AND ACCRUED INCOME 626 587 643TOTAL ASSETS 109,288 102,508 115,028

22 / 31 Announcement No. 13/2021 from Topdanmark A/S
Shareholders' equity and liabilities Group31 Dec 30 Sep 30 Sep
(DKKm) Note 2020 2020 2021
Share capital 90 90 90Revaluation reserve 1 1 0Security fund 1,146 1,146 1,146Other reserves 79 77 83Total reserves 1,225 1,223 1,229Profit carried forward 3,763 4,978 5,415Proposed dividend 1,800 0 0TOTAL SHAREHOLDERS' EQUITY 6,879 6,292 6,734
OTHER SUBORDINATED LOAN CAPITAL 1,749 1,749 899
Provisions for unearned premiums 1,590 2,776 2,597
Profit margin, non-life insurance contracts 1,150 735 950
With-profit products 23,178 22,933 22,311Unit-linked products 55,790 50,605 61,844Total life insurance provisions 78,968 73,538 84,156
Profit margin, life insurance and investment contracts 367 329 1,592
Provisions for claims 13,364 13,351 13,814
Risk margin, non-life insurance contracts 226 226 190
Provisions for bonuses and rebates 130 127 147TOTAL PROVISIONS FOR INSURANCE AND INVESTMENT CONTRACTS 95,797 91,082 103,446
Pensions and similar commitments 31 31 28Deferred tax liabilities 83 83 93Deferred tax on security funds 306 306 306TOTAL PROVISIONS 420 420 427
DEPOSITS RECEIVED FROM REINSURERS 33 38 21
Debt relating to direct insurance operations 165 179 113Debt relating to reinsurance operations 23 18 74Amounts due to credit institutions 1,350 876 383Current tax liabilities 60 122 404Derivatives 983 702 597Other debt 1,727 974 1,853TOTAL DEBT 4,308 2,870 3,423ACCRUALS AND DEFERRED INCOME 103 58 78TOTAL SHAREHOLDERS' EQUITY AND LIABILITIES 109,288 102,508 115,028
Financial assets and liabilities 3Contingent liabilities 4Related parties 5Cash flow statement 6Accounting policies 7

23 / 31Announcement No. 13/2021 from Topdanmark A/S
Cash flow statement GroupFull year Q1-Q3 Q1-Q3
(DKKm) 2020 2020 2021
Cash flow from operationsGross premiums 9,741 7,972 8,350Claims (6,488) (4,844) (4,534)Expenses (1,437) (1,089) (1,112)Reinsurance ceded (166) (206) (230)Cash flow from non-life insurance 1,651 1,833 2,474
Gross premiums 10,984 8,305 7,475Claims and benefits (6,660) (4,943) (6,896)Pension return tax (823) (822) (735)Expenses (483) (344) (362)Reinsurance ceded (19) (15) (10)Cash flow from life insurance 2,999 2,181 (528)
Cash flow from insurance activities 4,650 4,015 1,946
Payments on investment contracts 145 146 71Interest income etc. 1,483 1,056 1,392Dividends 526 416 593Interest charges etc. (184) (130) (141)Corporation tax (313) (89) (111)Other items (332) (280) 190
Cash flow from operations 5,975 5,134 3,939
Cash flow from investmentsIntangible assets, operating equipment (205) (146) (205)Properties (191) (178) (160)Equity investments in affiliates (81) (81) -Equity investments in associates (8) (8) (17)Dividends from associates 27 27 20Equity investments 400 135 800Unit trusts 12 8 13Bonds 1,587 (325) 1,969Derivatives (250) (153) 768Investment assets related to unit-linked products (5,157) (4,223) (6,982)Balances with associates 34 25 9
Cash flow from investments (3,831) (4,918) (3,784)
Cash flow from financingDividend paid (741) (741) (1,752)Exercise of share options 33 33 36Redemption of subordinated loan capital (500) 0 (850)Issue of subordinated loan capital 500 0 0Amounts due to credit institutions 1,195 721 (967)
Cash flow from financing 486 12 (3,533)
Change in cash and cash equivalents 2,631 229 (3,378)
Cash and cash equivalents at 1 January 3,294 3,294 5,835Revaluation of cash and cash equivalents (90) (33) 31Cash and cash equivalents end of period 5,835 3,490 2,488
Cash and cash equivalents comprise:Liquid funds 846 422 228Deposits with credit institutions 4,989 3,067 2,260
5,835 3,490 2,488

24 / 31 Announcement No. 13/2021 from Topdanmark A/S
Statement of changes in equity Group
(DKKm)
Revalu- ProfitShare ation Security Other carried Proposedcapital reserve fund reserves forward dividend Total
2020
Shareholders' equity at 31 December previous year 90 0 1,146 72 3,559 1,530 6,397Reduction of proposed dividend previous year 765 (765) 0
Profit for the year 7 (683) 1,800 1,124Other comprehensive income 1 1Total comprehensive income for the year 1 7 (683) 1,800 1,125
Dividend paid (765) (765)Dividend, own shares 24 24Share-based payments 70 70Exercise of share options 33 33Taxation (5) (5)Other transactions 122 (765) (643)Shareholders' equity at 31 December 2020 90 1 1,146 79 3,763 1,800 6,879
Q1-Q3 2020
Shareholders' equity at 31 December prior year 90 0 1,146 72 3,559 1,530 6,397Reduction of proposed dividend previous year 765 (765) 0
Profit for the period 5 548 553Other comprehensive income 1 1Total comprehensive income for the period 1 5 548 554
Dividend paid (765) (765)Dividend, own shares 24 24Share-based payments 52 52Exercise of share options 33 33Taxation (4) (4)Other transactions 106 (765) (659)Shareholders' equity at 30 September 2020 90 1 1,146 77 4,978 0 6,292
Q1-Q3 2021
Shareholders' equity at 31 December previous year 90 1 1,146 79 3,763 1,800 6,879
Profit for the period 4 1,509 1,513Other comprehensive income (1) (1)Total comprehensive income for the period (1) 4 1,509 1,512
Dividend paid (1,800) (1,800)Dividend, own shares 48 48Share-based payments 55 55Exercise of share options 36 36Taxation 3 3Other transactions 143 (1,800) (1,657)Shareholders' equity at 30 September 2021 90 0 1,146 83 5,415 0 6,734

25 / 31Announcement No. 13/2021 from Topdanmark A/S
Segment information Group
Income statementElimin- Parent Elimin-
(DKKm) Private SME ated Non-life Life etc. ated Group
Q1-Q3 2020
Non-life insuranceGross premiums earned 3,876 3,385 (15) 7,245 7,245Claims incurred (2,831) (2,139) 14 (4,957) 10 (4,947)Expenses (607) (568) 1 (1,174) 19 (1,155)Net reinsurance (39) (131) 0 (170) (170)Technical result from non-life insurance 398 547 (0) 945 29 974
Life insuranceGross premiums written 8,406 8,406Allocated investment return (62) (62)Pension return tax 4 4Benefits and change in provisions (8,052) (8,052)Expenses (410) 3 (407)Net reinsurance (1) (1)Technical result from life insurance (115) 3 (112)
Total investment return 46 (117) 57 163 149Pension return tax non-life insurance (18) 18 0Return and revaluations of non-life insurance provisions (318) (318)Transferred to technical result 62 62Other items (2) 197 (32) (195) (32)Pre-tax profit 653 44 25 0 722Taxation (169)Profit 553
Q1-Q3 2021
Non-life insuranceGross premiums earned 3,959 3,630 (13) 7,575 7,575Claims incurred (2,768) (2,390) 12 (5,146) 8 (5,137)Expenses (593) (603) 2 (1,194) 17 (1,177)Net reinsurance (39) (7) 0 (46) (46)Technical result from non-life insurance 560 631 0 1,190 25 1,216
Life insuranceGross premiums written 7,616 7,616Allocated investment return 6,893 6,893Pension return tax (997) (997)Benefits and change in provisions (13,201) (13,201)Expenses (442) 3 (440)Net reinsurance 1 1Technical result from life insurance (131) 3 (129)
Total investment return (116) 7,142 20 251 7,298Pension return tax non-life insurance 28 (28) 0Return and revaluations of non-life insurance provisions 492 492Transferred to technical result (6,893) (6,893)Other items 2 282 (38) (280) (34)Pre-tax profit 1,597 371 (18) 0 1,950Taxation (437)Profit 1,513

26 / 31 Announcement No. 13/2021 from Topdanmark A/S
Notes to the financial statements GroupFull year Q1-Q3 Q1-Q3
(DKKm) 2020 2020 2021
Note 1. Claims incurred, net of reinsurance - Non-life insurance
Run-off result:Gross business 201 116 161Reinsurance ceded (38) (2) (1)Run-off result, net of reinsurance (profit) 164 114 160
Note 2. Gross premiums written - Life insurance
Individual policies 266 165 186Policies which are part of a tenure 2,860 2,130 2,152Group life 268 216 210Regular premiums 3,394 2,512 2,548
Individual policies 4,226 3,329 2,693Policies which are part of a tenure 3,361 2,566 2,375Single premiums 7,587 5,894 5,068Gross premiums 10,981 8,406 7,616
Note 3. Financial assets and liabilities
Fair value measurementFair value is the price which would be achieved on the sale of an asset or paid for the transfer of a liability in a normal transactionbetween the market players at the time of measurement.The IFRS defines a hierarchy of three levels for measurement of fair value:
Level 1The calculation at fair value is based on the listed prices of transactions in active markets. If there is an active market for listed equityinvestments, bonds, derivatives etc., the measurement is generally based on the closing price end of year.
Level 2If there is no closing price, another public price is used, which is believed to be the most appropriate, in the form of indicative pricesfrom banks/brokers. Assets of this type are, for example CLOs and CDOs. Valuation methods or other publicly available informationis used to value listed securities, where the closing price does not reflect the fair value.Valuation methods are based on publicly available market data. If there is no active market for the financial instrument, depending onthe nature of the asset or liability, the calculation is based on underlying parameters such as interest and foreign exchange rates,volatility or comparison with the market prices of corresponding instruments.
Level 3In certain cases, the valuation cannot be based on publicly available market information alone. In these cases, valuation models that could imply the use of estimates of both the future and the nature of the current market situation are used.Due to the COVID-19 situation, end of March 2020 Topdanmark transferred structured products as CLOs of DKK 6,628m from level 2to level 3 implying valuation models based on non observable inputs.In Q2 2021, management assessed that, in general, the markets for structured credit products (CLOs) could be defined as active again in accordance with the definition in IFRS 13. Therefore, according to the applied accounting policies, these assets weretransferred back from level 3 to level 2.
31 Dec 30 Sep 30 Sep2020 2020 2021
Financial assets recorded at fair value based on non-observable input (level 3):1 January 371 371 7,278Purchases 583 254 664Transferred from level 2 6,628 6,628 0Transferred to level 2 0 0 (7,463)Repayments (327) (285) (522)Revaluations 23 (87) 289
7,278 6,880 244
The portfolio consists of construction financing of property projects (DKK 166m) and bonds (DKK 78m), for which current returndepends on payment on life annuity contracts. The fair value is generally equivalent to the cost price in the transaction currency.
The carrying value of financial assets and financial liabilities recorded at amortised cost corresponds approximately to fair value.
The accounting policies for financial assets and liabilities are stated in the latest Annual Report.

27 / 31Announcement No. 13/2021 from Topdanmark A/S
Notes to the financial statements Group
31 Dec 30 Sep 30 Sep(DKKm) 2020 2020 2021
Note 4. Contingent liabilities
Contract liabilities 501 241 347Adjustments to VAT liabilities 136 133 118Other liabilities 1 2 1Capital commitments made to loan funds and private equity funds etc. 356 387 450
All companies in the Topdanmark Group and other Danish companies and branches in the Sampo Group are jointly taxed withTopdanmark A/S being the management company. Pursuant to the specific rules on corporation taxes etc. in the Danish CompaniesAct, the companies are liable for the jointly taxed companies and for any obligations to withhold tax on interest, royalties anddividend for companies concerned.In connection with the implementation of a new customer and core system, Topdanmark Forsikring A/S has undertaken to providesupport to specific suppliers to fulfil Topdanmark EDB IV ApS' obligations in accordance with the contracts.
Note 5. Related parties
In 2021, Q1, Topdanmark A/S paid dividend of DKK 840m (Q2 2020: DKK 357m) to Sampo plc. and received dividend of DKK 1,800m(Q2 2020: DKK 750m) from Topdanmark Forsikring A/S.In December 2020, Topdanmark Forsikring A/S issued subordinated notes of DKK 500m subscribed by If P&C Insurance Ltd.There have been no other material transactions with related parties except from ordinary commercial trade betweenthe companies in the Topdanmark Group.
Note 6. Cash flow statement
As at 1 April 2020, the Group acquired the company Rådhuskontorerne ApS for DKK 81m cash.The purchase price was compounded as follows:Investment properties (land) 112Deferred tax liabilities (16)Other debt (15)
81
Note 7. Accounting policies
The announcement of the Q1-Q3 2021 results has been prepared in accordance with IAS 34 on interim reports for listed companiesand additional Danish disclosure requirements on interim reports for listed financial services companies.The results of the parent company have been prepared in accordance with the executive order on financial reports presented byinsurance companies and lateral pension funds issued by the Danish FSA.Topdanmark Group has implemented those IFRS standards and interpretations taking effect from 2021. None of these has affected recognition or measurement.The segmented income statement and the tables ”financial highlights – non-life insurance” and “Investment return” have been affectedby a reclassification in the accounts for Topdanmark Forsikring A/S of investment brokerage commissions from Other income to Investment expenses. Comparatives have been adapted. The classification in the group income statement is not affected.Expenses for loss preventing activities have been reclassified from administrative expenses to claims incurred due to a change in theDanish FSA's Executive Order on Financial Reports for Insurance Companies. The change has had no significant effect.Apart from the above, the accounting policies remain unchanged compared with 2020. Please refer to the Annual Report 2020 for thefull accounting policies of the Group.This announcement has not been audited nor subjected to review.

28 / 31 Announcement No. 13/2021 from Topdanmark A/S
Financial statements for Q1-Q3 2021 – Parent company

29 / 31Announcement No. 13/2021 from Topdanmark A/S
Income statement Parent companyFull year Q3 Q3 Q1-Q3 Q1-Q3
(DKKm) 2020 2020 2021 2020 2021
Income from affiliates 1,168 368 371 584 1,555Revaluations 0 0 0 0 (3)Interest charges (11) (3) (3) (8) (8)Total investment return 1,157 365 368 576 1,543
Other expenses (46) (11) (13) (32) (38)PRE-TAX PROFIT 1,112 354 355 544 1,505
Taxation 12 3 1 9 8PROFIT FOR THE PERIOD 1,124 357 356 553 1,513
Statement of comprehensive income ● Parent company
Profit for the period 1,124 357 356 553 1,513
Other comprehensive income from affiliates 1 0 0 1 (1)Other comprehensive income 1 0 0 1 (1)TOTAL COMPREHENSIVE INCOME FOR THE PERIOD 1,125 357 356 554 1,512

30 / 31 Announcement No. 13/2021 from Topdanmark A/S
Balance sheet Parent company31 Dec 30 Sep 30 Sep
(DKKm) 2020 2020 2021
AssetsOperating equipment 3 3 3TOTAL TANGIBLE ASSETS 3 3 3
Equity investments in affiliates 6,816 6,217 6,502Total investment in affiliates 6,816 6,217 6,502
Equity investments 4 4 1Total other financial investment assets 4 4 1TOTAL INVESTMENT ASSETS 6,820 6,221 6,503
Receivables from affiliates 913 964 1,352Other receivables 48 4 30TOTAL RECEIVABLES 961 969 1,382
Liquid funds 1 1 1TOTAL OTHER ASSETS 2 1 1TOTAL ASSETS 7,785 7,194 7,888
Shareholders' equity and liabilitiesShare capital 90 90 90Other reserves 3,067 2,468 2,774Total reserves 3,067 2,468 2,774Profit carried forward 2,228 4,040 4,176Proposed dividend 1,800 0 0TOTAL SHAREHOLDERS' EQUITY 7,185 6,598 7,040
OTHER SUBORDINATED LOAN CAPITAL 399 399 399
Amounts due to affiliates 133 68 35Current tax liabilities 60 121 404Other debt 8 8 10TOTAL DEBT 201 197 449TOTAL SHAREHOLDERS' EQUITY AND LIABILITIES 7,785 7,194 7,888

31 / 31Announcement No. 13/2021 from Topdanmark A/S
Statement by ManagementThe Board of Directors and the Executive Board have today considered and adopted the interim report for Q1-Q3 2021 for Topdanmark A/S.
The consolidated financial statements are presented in accordance with International Financial Reporting Standards as adopted by the EU, and the interim financial statements for the parent company are presented in accordance with the Danish Financial Business Act. Further, the interim report is presented in accordance with additional Danish disclosure requirements on interim reports for listed financial services companies.
In our opinion, the consolidated financial statements and the interim financial statements give a true and fair view of the Group’s and the parent company’s
assets, liabilities and financial position as at 30 September 2021 as well as the result of the Group’s and the parent company’s activities and the Group’s cash flows for the financial period from 1 January to 30 September 2021.
We believe that the management review contains a fair view of the development in the Group’s and parent company’s activities and financial position, together with a description of the most material risks and uncertainties by which the Group and the parent company can be affected.
There have been no events in the period from 30 September 2021 until the presentation of the consolidated financial statements which could change the assessment of the interim report for Q1-Q3 2021.
Executive Board:
Peter Hermann Lars Kufall Beck (CEO)
Brian Rothemejer Jacobsen Thomas Erichsen
Board of Directors:
Ricard Wennerklint Jens Aaløse Elise Bundgaard (Chairman) (Deputy Chairman)
Anne Louise Eberhard Mette Jensen Cristina Lage
Ole Lomholt Mortensen Petri Niemisvirta Morten Thorsrud
Ballerup, 21 October 2021