top u.s. export - international trade administration · published by the u.s. department of...
TRANSCRIPT

Top U.S. Export Markets
Free Trade Agreement and Country Fact Sheets
2009
The International Trade Administration’s mission is to create prosperity by strengthening the competitiveness of U.S. industry, promoting trade and invest-ment, and ensuring fair trade and compliance with trade laws and agreements.
Market Access and Compliance1401 Constitution Ave., NWWashington, DC 20230
T 202.482.3022 F 202.482.5444
www.trade.gov
Top U.S. E
xport Markets Free Trade A
greement and Country Fact Sheets
2009

TopU.S. ExportMarkets
Free Trade Agreementand Country Fact Sheets
2009

Published by the U.S. Department of Commerce, International Trade Administration, Washington, D.C. 20230 www.trade.gov
Federal Recycling Program Printed on recycled paper

iii Top U.S. Export Markets 2009
Contents
Market Access and Compliance
Overview . . . . . . . . . . . . . . . . . . . . . . . . . . . . . . . . . . . . . . . . . . . . . . . . . . . . . . . . . . . . . . . . . . . . . . . . . . . . . . . . . . . . . . . . . . 1Organizational Chart . . . . . . . . . . . . . . . . . . . . . . . . . . . . . . . . . . . . . . . . . . . . . . . . . . . . . . . . . . . . . . . . . . . . . . . . . . . . . . . 2Free Trade Agreements and Top 50 Export Markets (map) . . . . . . . . . . . . . . . . . . . . . . . . . . . . . . . . . . . . . . . . . . . . . 3Top U.S. Export Markets . . . . . . . . . . . . . . . . . . . . . . . . . . . . . . . . . . . . . . . . . . . . . . . . . . . . . . . . . . . . . . . . . . . . . . . . . . . . 4Top U.S. Import Suppliers . . . . . . . . . . . . . . . . . . . . . . . . . . . . . . . . . . . . . . . . . . . . . . . . . . . . . . . . . . . . . . . . . . . . . . . . . . . 5Data Sources . . . . . . . . . . . . . . . . . . . . . . . . . . . . . . . . . . . . . . . . . . . . . . . . . . . . . . . . . . . . . . . . . . . . . . . . . . . . . . . . . . . . . . 6
Free Trade Agreement Fact Sheets
Australia . . . . . . . . . . . . . . . . . . . . . . . . . . . . . . . . . . . . 8Bahrain . . . . . . . . . . . . . . . . . . . . . . . . . . . . . . . . . . . . 10Central America–Dominican Republic (CAFTA–DR) . . . . . . . . . . . . . . . . . . . . . . . . . . . . 12Chile . . . . . . . . . . . . . . . . . . . . . . . . . . . . . . . . . . . . . . . 14Colombia . . . . . . . . . . . . . . . . . . . . . . . . . . . . . . . . . . 16Israel . . . . . . . . . . . . . . . . . . . . . . . . . . . . . . . . . . . . . . 18Jordan . . . . . . . . . . . . . . . . . . . . . . . . . . . . . . . . . . . . . 20
Korea . . . . . . . . . . . . . . . . . . . . . . . . . . . . . . . . . . . . . . 22Morocco . . . . . . . . . . . . . . . . . . . . . . . . . . . . . . . . . . . 24North American Free Trade Agreement (NAFTA) . . . . . . . . . . . . . . . . . . . . . . . . . . . . . . . . 26Oman . . . . . . . . . . . . . . . . . . . . . . . . . . . . . . . . . . . . . . 28Panama . . . . . . . . . . . . . . . . . . . . . . . . . . . . . . . . . . . . 30Peru . . . . . . . . . . . . . . . . . . . . . . . . . . . . . . . . . . . . . . . 32Singapore . . . . . . . . . . . . . . . . . . . . . . . . . . . . . . . . . . 34
Country Fact Sheets
Malaysia . . . . . . . . . . . . . . . . . . . . . . . . . . . . . . . . . . . 90Mexico . . . . . . . . . . . . . . . . . . . . . . . . . . . . . . . . . . . . . 92Netherlands . . . . . . . . . . . . . . . . . . . . . . . . . . . . . . . . 94Netherlands Antilles . . . . . . . . . . . . . . . . . . . . . . . . 96Nigeria . . . . . . . . . . . . . . . . . . . . . . . . . . . . . . . . . . . . . 98Norway . . . . . . . . . . . . . . . . . . . . . . . . . . . . . . . . . . . 100Panama . . . . . . . . . . . . . . . . . . . . . . . . . . . . . . . . . . . 102Peru . . . . . . . . . . . . . . . . . . . . . . . . . . . . . . . . . . . . . . 104Philippines . . . . . . . . . . . . . . . . . . . . . . . . . . . . . . . . 106Poland . . . . . . . . . . . . . . . . . . . . . . . . . . . . . . . . . . . . 108Russia . . . . . . . . . . . . . . . . . . . . . . . . . . . . . . . . . . . . 110Saudi Arabia . . . . . . . . . . . . . . . . . . . . . . . . . . . . . . . 112Singapore . . . . . . . . . . . . . . . . . . . . . . . . . . . . . . . . . 114South Africa . . . . . . . . . . . . . . . . . . . . . . . . . . . . . . . 116South Korea . . . . . . . . . . . . . . . . . . . . . . . . . . . . . . . 118Spain . . . . . . . . . . . . . . . . . . . . . . . . . . . . . . . . . . . . . 120Sweden . . . . . . . . . . . . . . . . . . . . . . . . . . . . . . . . . . . 122Switzerland . . . . . . . . . . . . . . . . . . . . . . . . . . . . . . . 124Taiwan . . . . . . . . . . . . . . . . . . . . . . . . . . . . . . . . . . . . 126Thailand . . . . . . . . . . . . . . . . . . . . . . . . . . . . . . . . . . 128Turkey . . . . . . . . . . . . . . . . . . . . . . . . . . . . . . . . . . . . 130United Arab Emirates . . . . . . . . . . . . . . . . . . . . . . 132United Kingdom . . . . . . . . . . . . . . . . . . . . . . . . . . . 134Venezuela . . . . . . . . . . . . . . . . . . . . . . . . . . . . . . . . . 136Vietnam . . . . . . . . . . . . . . . . . . . . . . . . . . . . . . . . . . . 138
Argentina . . . . . . . . . . . . . . . . . . . . . . . . . . . . . . . . . . 38Australia . . . . . . . . . . . . . . . . . . . . . . . . . . . . . . . . . . . 40Bahamas . . . . . . . . . . . . . . . . . . . . . . . . . . . . . . . . . . . 42Belgium . . . . . . . . . . . . . . . . . . . . . . . . . . . . . . . . . . . . 44Brazil . . . . . . . . . . . . . . . . . . . . . . . . . . . . . . . . . . . . . . 46Canada . . . . . . . . . . . . . . . . . . . . . . . . . . . . . . . . . . . . 48Chile . . . . . . . . . . . . . . . . . . . . . . . . . . . . . . . . . . . . . . . 50China . . . . . . . . . . . . . . . . . . . . . . . . . . . . . . . . . . . . . . 52Colombia . . . . . . . . . . . . . . . . . . . . . . . . . . . . . . . . . . 54Costa Rica . . . . . . . . . . . . . . . . . . . . . . . . . . . . . . . . . . 56Dominican Republic . . . . . . . . . . . . . . . . . . . . . . . . 58Ecuador . . . . . . . . . . . . . . . . . . . . . . . . . . . . . . . . . . . . 60Egypt . . . . . . . . . . . . . . . . . . . . . . . . . . . . . . . . . . . . . . 62European Union (EU-27) . . . . . . . . . . . . . . . . . . . . 64Finland . . . . . . . . . . . . . . . . . . . . . . . . . . . . . . . . . . . . 66France . . . . . . . . . . . . . . . . . . . . . . . . . . . . . . . . . . . . . 68Germany . . . . . . . . . . . . . . . . . . . . . . . . . . . . . . . . . . . 70Guatemala . . . . . . . . . . . . . . . . . . . . . . . . . . . . . . . . . 72Honduras . . . . . . . . . . . . . . . . . . . . . . . . . . . . . . . . . . 74Hong Kong . . . . . . . . . . . . . . . . . . . . . . . . . . . . . . . . . 76India . . . . . . . . . . . . . . . . . . . . . . . . . . . . . . . . . . . . . . . 78Indonesia . . . . . . . . . . . . . . . . . . . . . . . . . . . . . . . . . . 80Ireland . . . . . . . . . . . . . . . . . . . . . . . . . . . . . . . . . . . . . 82Israel . . . . . . . . . . . . . . . . . . . . . . . . . . . . . . . . . . . . . . 84Italy . . . . . . . . . . . . . . . . . . . . . . . . . . . . . . . . . . . . . . . 86Japan . . . . . . . . . . . . . . . . . . . . . . . . . . . . . . . . . . . . . . 88

1 Top U.S. Export Markets 2009
Market Access and Compliance
Overview
Market Access and Compliance (MAC), a unit of the International Trade Administration, works to increase access to foreign markets for American firms and workers and ensures that foreign nations comply with trade agreements signed with the United States. MAC identifies and overcomes foreign barriers to U.S. exports, and enables U.S. firms to better compete in foreign markets. MAC also helps U.S. exporters, especially small and medium-sized firms, receive the full benefits of trade agreements. Common trade problems include
• tariff and customs barriers • intellectual property protection• standards, testing, laboratory, and certification barriers • rules of origin • government procurement contract barriers• service barriers • excessive government requirements• excessive testing or licensing fees• investment barriers• bribery
MAC consists of five major operating units: Europe; Western Hemisphere; Asia; Africa, Middle East, and South Asia; and Trade Agreements and Compliance. MAC not only resolves market access barriers, but also actively participates in developing U.S. trade policy, assists negotiations of bilateral and multilateral trade agreements, and supports U.S. foreign policy goals.
MAC country and compliance experts work to establish a fair and transparent framework for international trade by assisting firms in overcoming foreign barriers to trade, monitoring foreign compliance with all U.S. non-agricultural trade agreements, working with the U.S. Trade Representative and other agencies to implement the strategies developed for removing market obstacles, and supporting U.S. trade negotiations to open foreign markets.
To learn more about MAC and its services for U.S. exporters and investors, please explore the Web site www.trade.gov/tcc. The site provides access to an on-line trade complaint hotline for exporters to identify and report export problems, the full texts of more than 270 international trade and related agreements, and Exporter Guides with brief explanations of selected agreements. The site provides World Trade Organization standards notifications via the Notify U.S. Web site and international government procurement notices. It also provides the opportunity to subscribe to a weekly update service called “What’s New” that contains the latest information regarding U.S. and foreign government practices, trade agreements, and other trade-related developments. If you have any questions or would like further information about MAC’s services for U.S. exporters, contact the Trade Compliance Center through the Web Site, by phone at (202) 482-1191, or by e-mail at [email protected].

2 U.S. Department of Commerce, International Trade Administration
MAC Organizational Chart
ASS
ISTA
NT
SEC
RET
AR
Y FO
RM
AR
KET
AC
CES
S A
ND
CO
MPL
IAN
CE
VA
CA
NT
RM
386
8A 4
82-3
022
MD
386
8AC
AB
LE C
OD
E 4
000
FA
X 4
82-5
444
DEP
UTY
ASS
ISTA
NT
SEC
RET
AR
Y FO
R
MA
RK
ET A
CC
ESS
AN
D C
OM
PLIA
NC
ES
TEP
HE
N J
AC
OB
SR
M 3
868A
482
-534
1 M
D 3
868A
CA
BLE
CO
DE
411
0 FA
X 4
82-5
444
MA
RK
ET A
CC
ESS
AN
D C
OM
PLIA
NC
E
OFF
ICE
OF
MU
LTIL
ATE
RA
L A
FFA
IRS
CH
RIS
TOP
HE
R R
OS
ETT
IER
M 3
033
482-
3227
MD
303
3C
AB
LE C
OD
E 4
120
FA
X 4
82-5
939
DEP
UTY
ASS
ISTA
NT
SEC
RET
AR
YFO
R T
RA
DE
AG
REE
MEN
TS
AN
D C
OM
PLIA
NC
ES
KIP
JO
NE
SR
M. 3
043
482
-576
7 M
D 3
043
FA
X 4
82-6
097
TRA
DE
CO
MP
LIA
NC
E C
EN
TER
BE
VE
RLY
VA
UG
HA
NR
M. 3
043
482
-119
1 R
M. 3
043
FA
X 4
82-6
097
DEP
UTY
ASS
ISTA
NT
SEC
RET
AR
YFO
R T
HE
WES
TER
N H
EMIS
PHER
EW
ALT
ER
BA
STI
AN
RM
382
6 4
82-5
324
MD
382
6C
AB
LE C
OD
E 4
300
FAX
482
-473
6
DEP
UTY
ASS
ISTA
NT
SEC
RET
AR
Y F
OR
EU
RO
PEJU
AN
VE
RD
ER
M 3
863
482-
5638
MD
386
3C
AB
LE C
OD
E 4
200
FAX
482
-409
8
DEP
UTY
ASS
ISTA
NT
SEC
RET
AR
YFO
R A
SIA
IR
A K
AS
OFF
RM
203
8 4
82-4
527
MD
203
6C
AB
LE C
OD
E 4
400
FA
X 4
82-4
760
OFF
ICE
OF
SO
UTH
AM
ER
ICA
AN
NE
DR
ISC
OLL
RM
320
3 4
82-1
648
MD
320
3C
AB
LE C
OD
E 4
332
FAX
482-
4726
OFF
ICE
OF
NO
RTH
AN
D C
EN
TRA
L A
ME
RIC
A A
ND
TH
E C
AR
IBB
EA
N
GE
RI W
OR
DR
M 3
024
482
-645
2 M
D 3
826
CA
BLE
CO
DE
432
0 FA
X 4
82-5
865
OFF
ICE
OF
EU
RO
PE
AN
UN
ION
DA
VID
DE
FALC
OR
M 3
513
482
-217
8 M
D 3
513
CA
BLE
CO
DE
421
1 FA
X 4
82-2
897
OFF
ICE
OF
RU
SS
IA, U
KR
AIN
E,
AN
D E
UR
AS
IA
JOH
N B
RO
UG
HE
R, J
R.
RM
331
8 4
82-0
998
MD
331
9C
AB
LE C
OD
E 4
231
FAX
482
-304
2
OFF
ICE
OF
THE
MID
DLE
EA
ST
CH
ER
IE L
OU
STA
UN
AU
RM
203
1 48
2-44
42 M
D 2
031
CA
BLE
CO
DE
452
0 FA
X 4
82-0
878
OFF
ICE
OF
AFR
ICA
KE
VIN
BO
YD
RM
203
7 48
2-42
27 M
D 2
037
CA
BLE
CO
DE
451
0 FA
X 4
82-5
198
OFF
ICE
OF
CH
INA
E
CO
NO
MIC
AR
EA
NIC
OLE
ME
LCH
ER
RM
320
4 4
82-2
515
MD
320
4 C
AB
LE C
OD
E 4
420
FAX
482
-157
6
OFF
ICE
OF
THE
PA
CIF
IC B
AS
IN
JEFF
RE
Y D
UTT
ON
RM
231
9 4
82-0
358
MD
231
9C
AB
LE C
OD
E 4
430
FAX
482
-331
6O
FFIC
E O
F S
OU
TH A
SIA
AN
D O
CE
AN
IALI
ND
A D
RO
KE
RR
M 2
312
482-
2955
MD
231
0C
AB
LE C
OD
E 4
530
FAX
482-
5330
OFF
ICE
OF
JAP
AN
KE
ITH
RO
THR
M 2
320
482-
5012
MD
232
0C
AB
LE C
OD
E 4
410
FAX
482
-331
6
DEP
UTY
ASS
ISTA
NT
SEC
RET
AR
YFO
R A
FRIC
A, T
HEM
IDD
LE E
AST
AN
D S
OU
TH A
SIA
HO
LLY
VIN
EY
AR
DR
M 2
329
482
-465
1 M
D 2
329
CA
BLE
CO
DE
450
0 F
AX
501
-022
4
JA
NU
AR
Y 20
10
OFF
ICE
OF
INTE
LLE
CTU
AL
PR
OP
ER
TY R
IGH
TS
SU
SA
N W
ILS
ON
RM
. 304
3 4
82-5
767
MD
304
3 F
AX
482
-609
7
OFF
ICE
OF
EU
RO
PE
AN
CO
UN
TRY
AFF
AIR
S
JAY
A. B
UR
GE
SS
RM
331
9 4
82-2
630
MD
331
9C
AB
LE C
OD
E 4
211
FAX
482
-450
5
OFF
ICE
OF
TRA
DE
AG
RE
EM
EN
TSS
EC
RE
TAR
IAT
VA
LER
IE D
EE
SR
M 2
063
482
-543
8 M
D 2
063
CA
BLE
CO
DE
431
0 FA
X 4
82-0
148
Not
e: A
rea
code
for p
hone
and
fax
num
bers
is 2
02.

3 Top U.S. Export Markets 2009
Un
ited
Sta
tes
Top
50
Exp
ort M
arke
ts
Free
Tra
de A
gree
men
t
Bot
h F
ree
Tra
de A
gree
men
t an
d T
op E
xpor
t Mar
ket
Free
Tra
de A
gree
men
ts a
nd
Top
50 E
xpor
t Mar
kets

4 U.S. Department of Commerce, International Trade Administration
Top U.S. Export MarketsCalendar Years: 2007 – 2009, Ranked by 2008
Millions of U.S. dollars
U. S. Exports U. S. Imports
Rank Partner CountryCalendar Years Calendar Years
2007 2008 %Change 2009 %Change 2007 2008 %Change 2009 %Change
World 1,148,199 1,287,442 12.1 1,056,932 -17.9 1,956,962 2,103,641 7.5 1,557,876 -25.9
Top 50 total 1,081,887 1,208,977 11.7 992,553 -17.9 1,815,676 1,931,675 6.4 1,452,180 -24.8
Top 50 share 94% 94% 94% 93% 92% 93%
EU-27 244,166 271,810 11.3 220,776 -18.8 354,409 367,617 3.7 281,320 -23.5
1 Canada 248,888 261,150 4.9 204,728 -21.6 317,057 339,491 7.1 224,911 -33.8
2 Mexico 135,918 151,220 11.3 128,998 -14.7 210,714 215,942 2.5 176,537 -18.2
3 China 62,937 69,733 10.8 69,576 -0.2 321,443 337,773 5.1 296,402 -12.2
4 Japan 61,160 65,142 6.5 51,180 -21.4 145,463 139,262 -4.3 95,949 -31.1
5 Germany 49,420 54,505 10.3 43,299 -20.6 94,164 97,497 3.5 71,253 -26.9
6 United Kingdom 49,981 53,599 7.2 45,714 -14.7 56,858 58,587 3.0 47,486 -18.9
7 Netherlands 32,837 39,719 21.0 32,347 -18.6 18,403 21,123 14.8 16,103 -23.8
8 Korea, South 34,402 34,669 0.8 28,640 -17.4 47,562 48,069 1.1 39,235 -18.4
9 Brazil 24,172 32,299 33.6 26,175 -19.0 25,644 30,453 18.8 20,074 -34.1
10 Belgium 25,259 28,903 14.4 21,630 -25.2 15,281 17,308 13.3 13,781 -20.4
11 France 26,676 28,840 8.1 26,522 -8.0 41,553 44,049 6.0 34,034 -22.7
12 Singapore 25,619 27,854 8.7 22,279 -20.0 18,394 15,885 -13.6 15,659 -1.4
13 Taiwan 25,829 24,926 -3.5 18,432 -26.1 38,278 36,326 -5.1 28,375 -21.9
14 Australia 19,178 22,219 15.9 19,597 -11.8 8,615 10,589 22.9 8,015 -24.3
15 Switzerland 17,039 22,024 29.3 17,499 -20.5 14,760 17,782 20.5 16,033 -9.8
16 Hong Kong 19,902 21,499 8.0 21,119 -1.8 7,026 6,483 -7.7 3,567 -45.0
17 India 14,969 17,682 18.1 16,462 -6.9 24,073 25,704 6.8 21,176 -17.6
18 Italy 14,150 15,461 9.3 12,233 -20.9 35,028 36,135 3.2 26,416 -26.9
19 Israel 12,887 14,487 12.4 9,568 -34.0 20,794 22,336 7.4 18,745 -16.1
20 United Arab Emirates 10,787 14,417 33.7 12,107 -16.0 1,337 1,286 -3.8 1,497 16.4
21 Malaysia 11,680 12,949 10.9 10,401 -19.7 32,629 30,736 -5.8 23,279 -24.3
22 Venezuela 10,201 12,610 23.6 9,360 -25.8 39,910 51,424 28.8 28,094 -45.4
23 Saudi Arabia 10,396 12,484 20.1 10,804 -13.5 35,626 54,747 53.7 22,046 -59.7
24 Spain 9,766 12,190 24.8 8,751 -28.2 10,498 11,094 5.7 7,865 -29.1
25 Chile 8,148 11,857 45.5 9,365 -21.0 8,999 8,196 -8.9 5,950 -27.4
26 Colombia 8,558 11,437 33.6 9,458 -17.3 9,434 13,093 38.8 11,320 -13.5
27 Turkey 6,499 9,959 53.2 7,089 -28.8 4,601 4,642 0.9 3,662 -21.1
28 Russia 7,283 9,335 28.2 5,383 -42.3 19,314 26,783 38.7 18,221 -32.0
29 Thailand 8,336 9,067 8.8 6,921 -23.7 22,755 23,538 3.4 19,085 -18.9
30 Philippines 7,712 8,295 7.6 5,773 -30.4 9,408 8,713 -7.4 6,797 -22.0
31 Ireland 7,777 7,611 -2.1 7,516 -1.2 30,445 31,346 3.0 28,066 -10.5
32 Argentina 5,856 7,536 28.7 5,560 -26.2 4,487 5,822 29.8 3,890 -33.2
33 Dominican Republic 6,084 6,594 8.4 5,270 -20.1 4,216 3,978 -5.6 3,329 -16.3
34 South Africa 5,521 6,490 17.6 4,461 -31.3 9,054 9,948 9.9 5,879 -40.9
35 Peru 4,120 6,183 50.1 4,925 -20.3 5,272 5,812 10.2 4,192 -27.9
36 Egypt 5,259 6,002 14.1 5,258 -12.4 2,377 2,370 -0.3 2,058 -13.2
37 Costa Rica 4,580 5,680 24.0 4,704 -17.2 3,942 3,938 -0.1 5,601 42.2
38 Indonesia 3,970 5,644 42.2 5,106 -9.5 14,301 15,799 10.5 12,938 -18.1
39 Sweden 4,473 5,018 12.2 4,564 -9.0 13,024 12,498 -4.0 8,207 -34.3
40 Panama 3,669 4,887 33.2 4,358 -10.8 365 379 3.8 304 -19.8
41 Honduras 4,461 4,846 8.6 3,384 -30.2 3,912 4,041 3.3 3,324 -17.7
42 Guatemala 4,065 4,718 16.1 3,901 -17.3 3,026 3,463 14.4 3,138 -9.4
43 Poland 3,123 4,131 32.3 2,305 -44.2 2,226 2,587 16.2 2,039 -21.2
44 Nigeria 2,778 4,102 47.7 3,658 -10.8 32,770 38,068 16.2 19,128 -49.8
45 Finland 3,133 3,761 20.0 1,666 -55.7 5,266 5,903 12.1 3,984 -32.5
46 Ecuador 2,936 3,450 17.5 3,927 13.8 6,135 9,048 47.5 5,272 -41.7
47 Norway 3,040 3,292 8.3 2,752 -16.4 7,318 7,315 0.0 5,679 -22.4
48 Netherlands Antilles 2,082 2,952 41.8 2,131 -27.8 782 809 3.5 475 -41.3
49 Vietnam 1,903 2,789 46.6 3,108 11.4 10,633 12,901 21.3 12,290 -4.7
50 Bahamas 2,468 2,760 11.8 2,589 -6.2 504 604 19.8 820 35.8
Source: Census Bureau, U.S. Department of Commerce

5 Top U.S. Export Markets 2009
Top U.S. Import SuppliersCalendar Years: 2007 – 2009, Ranked by 2008
Millions of U.S. dollars
U. S. Imports U. S. Exports
Rank Partner CountryCalendar Years Calendar Years
2007 2008 %Change 2009 %Change 2007 2008 %Change 2009 %Change World 1,956,962 2,103,641 7.5 1,557,876 -25.9 1,148,199 1,287,442 12.1 1,056,932 -17.9
Top 50 total 1,872,693 2,013,206 7.5 1,486,857 -26.1 1,050,856 1,168,796 11.2 960,555 -17.8
Top 50 share 96% 96% 95% 92% 91% 91%
EU-27 354,409 367,617 3.7 281,320 -23.5 244,166 271,810 11.3 220,776 -18.8
1 Canada 317,057 339,491 7.1 224,911 -33.8 248,888 261,150 4.9 204,728 -21.6
2 China 321,443 337,773 5.1 296,402 -12.2 62,937 69,733 10.8 69,576 -0.2
3 Mexico 210,714 215,942 2.5 176,537 -18.2 135,918 151,220 11.3 128,998 -14.7
4 Japan 145,463 139,262 -4.3 95,949 -31.1 61,160 65,142 6.5 51,180 -21.4
5 Germany 94,164 97,497 3.5 71,253 -26.9 49,420 54,505 10.3 43,299 -20.6
6 United Kingdom 56,858 58,587 3.0 47,486 -18.9 49,981 53,599 7.2 45,714 -14.7
7 Saudi Arabia 35,626 54,747 53.7 22,046 -59.7 10,396 12,484 20.1 10,804 -13.5
8 Venezuela 39,910 51,424 28.8 28,094 -45.4 10,201 12,610 23.6 9,360 -25.8
9 Korea, South 47,562 48,069 1.1 39,235 -18.4 34,402 34,669 0.8 28,640 -17.4
10 France 41,553 44,049 6.0 34,034 -22.7 26,676 28,840 8.1 26,522 -8.0
11 Nigeria 32,770 38,068 16.2 19,128 -49.8 2,778 4,102 47.7 3,658 -10.8
12 Taiwan 38,278 36,326 -5.1 28,375 -21.9 25,829 24,926 -3.5 18,432 -26.1
13 Italy 35,028 36,135 3.2 26,416 -26.9 14,150 15,461 9.3 12,233 -20.9
14 Ireland 30,445 31,346 3.0 28,066 -10.5 7,777 7,611 -2.1 7,516 -1.2
15 Malaysia 32,629 30,736 -5.8 23,279 -24.3 11,680 12,949 10.9 10,401 -19.7
16 Brazil 25,644 30,453 18.8 20,074 -34.1 24,172 32,299 33.6 26,175 -19.0
17 Russia 19,314 26,783 38.7 18,221 -32.0 7,283 9,335 28.2 5,383 -42.3
18 India 24,073 25,704 6.8 21,176 -17.6 14,969 17,682 18.1 16,462 -6.9
19 Thailand 22,755 23,538 3.4 19,085 -18.9 8,336 9,067 8.8 6,921 -23.7
20 Israel 20,794 22,336 7.4 18,745 -16.1 12,887 14,487 12.4 9,568 -34.0
21 Iraq 11,396 22,080 93.8 9,263 -58.0 1,560 2,070 32.7 1,775 -14.3
22 Netherlands 18,403 21,123 14.8 16,103 -23.8 32,837 39,719 21.0 32,347 -18.6
23 Algeria 17,816 19,355 8.6 10,718 -44.6 1,652 1,243 -24.8 1,109 -10.8
24 Angola 12,508 18,911 51.2 9,339 -50.6 1,242 2,019 62.6 1,423 -29.5
25 Switzerland 14,760 17,782 20.5 16,033 -9.8 17,039 22,024 29.3 17,499 -20.5
26 Belgium 15,281 17,308 13.3 13,781 -20.4 25,259 28,903 14.4 21,630 -25.2
27 Singapore 18,394 15,885 -13.6 15,659 -1.4 25,619 27,854 8.7 22,279 -20.0
28 Indonesia 14,301 15,799 10.5 12,938 -18.1 3,970 5,644 42.2 5,106 -9.5
29 Colombia 9,434 13,093 38.8 11,320 -13.5 8,558 11,437 33.6 9,458 -17.3
30 Vietnam 10,633 12,901 21.3 12,290 -4.7 1,903 2,789 46.6 3,108 11.4
31 Sweden 13,024 12,498 -4.0 8,207 -34.3 4,473 5,018 12.2 4,564 -9.0
32 Spain 10,498 11,094 5.7 7,865 -29.1 9,766 12,190 24.8 8,751 -28.2
33 Australia 8,615 10,589 22.9 8,015 -24.3 19,178 22,219 15.9 19,597 -11.8
34 South Africa 9,054 9,948 9.9 5,879 -40.9 5,521 6,490 17.6 4,461 -31.3
35 Ecuador 6,135 9,048 47.5 5,272 -41.7 2,936 3,450 17.5 3,927 13.8
36 Trinidad & Tobago 8,790 9,030 2.7 5,223 -42.2 1,780 2,250 26.4 1,989 -11.6
37 Philippines 9,408 8,713 -7.4 6,797 -22.0 7,712 8,295 7.6 5,773 -30.4
38 Austria 10,669 8,457 -20.7 6,377 -24.6 3,110 2,649 -14.8 2,538 -4.2
39 Chile 8,999 8,196 -8.9 5,950 -27.4 8,148 11,857 45.5 9,365 -21.0
40 Norway 7,318 7,315 0.0 5,679 -22.4 3,040 3,292 8.3 2,752 -16.4
41 Kuwait 4,118 7,093 72.2 3,783 -46.7 2,484 2,719 9.5 1,952 -28.2
42 Hong Kong 7,026 6,483 -7.7 3,567 -45.0 19,902 21,499 8.0 21,119 -1.8
43 Denmark 6,064 6,446 6.3 5,562 -13.7 2,890 2,711 -6.2 2,058 -24.1
44 Finland 5,266 5,903 12.1 3,984 -32.5 3,133 3,761 20.0 1,666 -55.7
45 Argentina 4,487 5,822 29.8 3,890 -33.2 5,856 7,536 28.7 5,560 -26.2
46 Peru 5,272 5,812 10.2 4,192 -27.9 4,120 6,183 50.1 4,925 -20.3
47 Congo 3,071 5,074 65.2 3,105 -38.8 140 185 32.1 277 49.7
48 Turkey 4,601 4,642 0.9 3,662 -21.1 6,499 9,959 53.2 7,089 -28.8
49 Azerbaijan 1,887 4,361 131.1 1,973 -54.8 178 239 34.3 222 -7.1
50 Libya 3,385 4,179 23.5 1,919 -54.1 511 721 41.1 666 -7.6
Source: Census Bureau, U.S. Department of Commerce
6 U.S. Department of Commerce, International Trade Administration
Data Sources
Data used in the fact sheets were obtained from the following sources:
International Monetary Fund (IMF), World Economic Outlook Database, October 2009 Global Trade Information Services, Global Trade Atlas Global Trade Information Services, World Trade Atlas World Bank, World Development Indicators, 2009. World Bank, International Finance Corporation, Doing Business 2010. U.S. Department of Commerce, Bureau of the Census, Foreign Trade Division U.S. Department of Commerce, Bureau of Economic Analysis U.S. Department of Commerce, International Trade Administration Economist Intelligence Unit European Union, EUROSTAT Central Intelligence Agency, The World Factbook, 2009
Data KeyProfile Section: Population: World Economic Outlook Database, IMF, October 2009 U.S. Department of Commerce, International Trade Administration
Economy Section:Unless otherwise indicated, all data are from World Economic Outlook Database, IMF, October 2009.
N/A indicates not available. * indicates World Economic Outlook Database, IMF, October 2009 estimate. † indicates World Development Indicators, World Bank, 2009 data. ‡ indicates Economist Intelligence Unit data. ‡• indicatesEconomistIntelligenceUnitestimate. § indicates CIA, The World Factbook, 2009 ** indicates International Trade Administration Country Commercial Guide 2009 †† indicates Central Bank of Costa Rica ‡‡ indicates Government of Ecuador, National Institute of Statistics and Censuses and Central Bank §§ indicates Government of Panama, Comptroller General data
Foreign Merchandise Trade Section: Global Trade Atlas World Trade Atlas U.S. Department of Commerce, Bureau of the Census, Foreign Trade Division
Foreign Direct Investment Section: U.S. Department of Commerce, Bureau of Economic Analysis (D) indicates data have been suppressed to avoid disclosure of individual company data. (*) indicates the data are less than $500,000.
Doing Business Ranking Section: World Bank, International Finance Corporation, Doing Business 2010. Doing Business quantifies regulations that apply to an economy’s businesses during their life cycles,
including start-up and operations, and those for trading across borders, paying taxes, and closing a business. Doing Business does not measure all aspects of the business environment that matter to firms and investors. For example, it does not measure security, macroeconomic stability, corruption, skill level, or the strength of financial systems.

Free Trade AgreementFact Sheets
8 U.S. Department of Commerce, International Trade Administration
U.S.–Australia Free Trade Agreement (FTA) Analysis
Commentary: The U.S.–Australia FTA was signed on May 18, 2004, and entered into force on January 1, 2005. This comprehensive agreement includes market access for industrial and agricultural goods and services, government procurement, e-commerce, investment, and intellectual property rights protections.
Before and After the U.S.–Australia FTA:
• Overall trade in goods between the United States and Australia grew from $21.5 billion in 2004 to $32.8 billion in 2008, an increase of 53 percent.
• U.S. exports to Australia grew from $14 billion in 2004 to $22.2 billion in 2008, a 59 percent expansion.
• U.S. imports from Australia increased from $7.5 billion in 2004 to $10.6 billion in 2008, an increase of 41 percent.
• Ranking: In 2008, Australia was the 14th largest export market for U.S. goods.
Benefits of the U.S.–Australia FTA:
Tariffs: More than 99 percent of U.S. manufactured exports to Australia became duty-free immediately upon entry into force of the agreement. Remaining tariffs on manufactured goods will be phased out within 10 years.
Investment: The FTA establishes a secure, predictable legal framework for U.S. investors operating in Australia. The threshold for the screening of acquisitions by Australia’s Foreign Investment Review Board for nearly all sectors was raised from A$50 million to A$800 million (indexed annually), exempting the vast majority of U.S. investments. U.S. Foreign Direct Investment (FDI) into Australia grew from $48.4 billion in 2003 (2004 data are not available) to $88.5 billion in 2008, an increase of 83 percent. Australian FDI into the United States rose from $40.1 billion in 2004 to $64.3 billion in 2008, an increase of 60 percent.
Services: The FTA gives U.S. companies expanded access to Australia’s services market, including telecommunications, express delivery, computer and related services, tourism, energy, construction and engineering, financial services, insurance, audiovisual services and entertainment, professional services, environmental services, education and training, and others. The FTA contains provisions to improve market access for U.S. films and television programs over a variety of media including cable, satellite, and the Internet. The FTA also set high standards for regulatory transparency, including procedures applying to licensing systems.
Government Procurement: Under the FTA’s government procurement provisions, U.S. firms can compete for Australian government purchases on a non-discriminatory basis at both the commonwealth and the state levels. The FTA requires the use of tendering procedures that ensure procurements are conducted in a transparent, predictable, and fair manner.
Intellectual Property Rights: The FTA complements and enhances existing international standards for the protection of intellectual property and provides better means for enforcing those rights. The FTA includes an increased copyright term, prohibition on circumvention of technological protection measures, criminalization of end-user piracy, and measures to prevent marketing of pharmaceutical products that infringe patents.

9 Top U.S. Export Markets 2009
U.S. Trade in Goods with Australia
U.S. Exports
U.S. Imports
0
5
10
15
20
25
1990 1992 1994 1996 1998 2000 2002 2004 2006 2008
Billions of dollars
FTA implemented 1/1/2005B
illio
ns
of d
olla
rsH
S C
omm
odit
y87
01
3105
84
29
8471
30
04
8703
90
18
8431
87
04
8800
Leading U.S. Exports to Australia in 2008 and Change from 2007
0 0.2 0.4 0.6 0.8 1 1.2 1.4
Civilian aircraft (+41%)
Trucks (+31%)
Parts for lifting machines (+1%)
Medical instruments (+13%)
Passenger vehicles (+7%)
Pharmaceuticals in dosages (+1%)
ADP machines (-28%)
Bulldozers, graders (+22%)
Fertilizer mixtures (N/A)
Tractors (+43%)
8800
8704
8431
9018
8703
3004
8471
8429
3105
8701
HS Commodity
Billions of dollars

10 U.S. Department of Commerce, International Trade Administration
U.S.–Bahrain Free Trade Agreement (FTA) Analysis
Commentary: The U.S.–Bahrain FTA, signed on September 14, 2004, entered into force on August 1, 2006. This was the first U.S. FTA with a Persian Gulf state and the third with an Arab state. The FTA provided duty-free access to all U.S. consumer, industrial, and agricultural exports, except for alcohol and tobacco, significant market access in services, and stronger IPR enforcement.
Before and After U.S.–Bahrain FTA:
• Overall trade in goods in the first three full years of the FTA (August 2006–July 2009) increased from $1.2 billion to $1.3 billion, a 10 percent increase.
• U.S. exports to Bahrain in the first three full years of the FTA increased from $529 million to $784 million, a 48 percent increase.
• U.S. imports from Bahrain in the first three full years of the FTA decreased from $637 million to $509 million, a 20 percent decline.
• Ranking: Bahrain was the 82nd largest export market for the United States in 2008 with exports totaling $830 million, an increase of 13 percent over the previous year. Major exports include vehicles, aircraft, and machinery.
Benefits of the U.S.–Bahrain FTA:
Tariffs: The FTA provides duty-free access to all U.S. consumer, industrial, and agricultural exports, except for alcohol and tobacco.
Investment: The FTA does not include an investment chapter. Services: The FTA provides U.S. businesses with substantial access to Bahrain’s services market. It opened key services sectors for U.S. providers, including financial services, audiovisual services, express delivery, telecommunications, computer and related services, distribution, health care, services incidental to mining, construction, and architecture and engineering services.
Government Procurement: The FTA provides for national treatment for U.S. firms in government procurement. Strong and transparent disciplines, such as an advance public notice requirement for purchases, and timely and effective bid review procedures provide increased certainty.
Intellectual Property Rights: The FTA ensures that copyright owners have the exclusive right to make their works available on-line. Owners also have the rights to temporary copies of their works on computers, which is important in protecting music, videos, software, and text from widespread unauthorized sharing via the Internet. The FTA prohibits government agencies from approving patent-infringing pharmaceuticals. The agreement requires the governments to establish transparent procedures for the registration of trademarks, including geographical indications, to develop an on-line system for the registration and maintenance of trademarks, and to maintain a searchable database.

11 Top U.S. Export Markets 2009
Leading U.S. Exports to Bahrain in 2008 and Change from 2007
0 20 40 60 80 100 120 140 160 180 200
Passenger vehicles (+43%)
Civilian aircraft (+284%)
Parts for lifting machines (+44%)
Aircraft, spacecraft (+586%)
Misc. food preparations (+316%)
Catalytic preparations (+5,487%)
Aircraft parts (+2%)
Stainless steel bars, rods (N/A)
TV, radio parts (+118%)
Refrigerators, freezers (-45%)
8703
8800
8431
8802
2106
3815
8803
7221
8529
8418
HS Commodity
Millions of dollars
HS
Com
mod
ity
8418
85
29
7221
88
03
3815
21
06
8802
84
31
8800
87
03
U.S. Exports
0
100
200
300
400
500
600
700
1990 1992 1994 1996 1998 2000 2002 2004 2006 2008
Mill
ion
s of
dol
lars
U.S. Trade in Goods with Bahrain
FTA implemented 8/1/2006
U.S. Imports
900
800

12 U.S. Department of Commerce, International Trade Administration
U.S.–Central America–Dominican Republic Free TradeAgreement (CAFTA–DR)
Commentary: The United States implemented CAFTA–DR on a rolling basis as countries ratified their commitments under the agreement. During 2006, CAFTA–DR entered into force between the United States and four partner countries—El Salvador in March, Honduras and Nicaragua in April, and Guatemala in July. The agreement went into force for the Dominican Republic on March 1, 2007, and for Costa Rica on January 1, 2009. CAFTA–DR creates new commercial opportunities for U.S. firms while promoting regional stability, economic integration, and economic development for an important group of U.S. neighbors.
Before and After CAFTA–DR:
• Overall trade in goods between the United States and the CAFTA–DR countries grew from $35 billion in 2005 to $44.7 billion in 2008, an increase of 28 percent.
• U.S. exports to the CAFTA–DR region were $25.4 billion in 2008, up 50 percent from 2005.• U.S. imports from the CAFTA–DR countries were $19.4 billion in 2008, up 7 percent from 2005.• Ranking: In 2008, the CAFTA–DR region was a larger market for U.S. exports than all but 12
individual countries.
Benefits of the CAFTA–DR:
Tariffs: More than 80 percent of U.S. exports of consumer and industrial goods to the four countries of Central America and the Dominican Republic became duty-free immediately upon entry into force of the agreement, with remaining tariffs to be phased out over 10 years. Key U.S. export sectors benefiting from the tariff elimination include information technology products, agricultural and construction equipment, paper products, chemicals, and medical and scientific equipment.
Investment: The agreement establishes a secure, predictable legal framework for U.S. investors in Central America and the Dominican Republic. All forms of investment are protected under the FTA, including real property, enterprises, debt, concessions, and intellectual property. U.S. direct investment in the CAFTA–DR countries was $8.5 billion in 2008.
Services: Central America and the Dominican Republic accord substantial market access to U.S. service providers in all sectors. The agreement loosens restrictive “dealer protection” regimes that had previously locked U.S. firms into exclusive or inefficient distributor arrangements.
Government Procurement: The agreement requires the use of fair and transparent government procurement procedures, including advance notice of purchases and timely and effective bid review.
Intellectual Property Rights: CAFTA–DR establishes high standards for protecting intellectual property rights, such as patents, trademarks, and copyrights, and supports the growth of trade in valuable digital and other intellectual property–based products.

13 Top U.S. Export Markets 2009
U.S. Trade in Goods with CAFTA-DR
U.S. Exports
U.S. Imports
0
5
10
15
20
25
30
1990 1992 1994 1996 1998 2000 2002 2004 2006 2008
Billions of dollars
FTA implemented from 3/1/2006 - 1/1/2009
Bill
ion
s of
dol
lars
Leading U.S. Exports to CAFTA-DR in 2008 and Change from 2007
0 0.5 1 1.5 2 2.5 3 3.5
Re�ned petroleum (+31%)
Integrated circuits (+29%)
Cotton yarn (+22%)
Corn (+33%)
Elec. appar. for switching (-6%)
Wheat, meslin (+49%)
Knitted fabrics (+1%)
Passenger vehicles (+6%)
Elec. appar. for telephones (+9%)
2710
8542
5205
1005
8536
1001
6006
8703
8517
HS Commodity
Billions of dollars
HS
Com
mod
ity
8517
87
03
6006
10
01
8536
10
05
5205
85
42
2710

14 U.S. Department of Commerce, International Trade Administration
U.S.–Chile Free Trade Agreement (FTA) Analysis
Commentary: The U.S.–Chile FTA was signed on June 6, 2003, and entered into force on January 1, 2004. The agreement fosters economic growth and creates higher-paying jobs in the United States by reducing and eliminating barriers to trade and investment between the United States and Chile.
Before and After the U.S.–Chile FTA:
• Overall trade in goods between the United States and Chile grew from $6.4 billion in 2003 to $20.1 billion in 2008, an increase of 214 percent.
• U.S. exports to Chile totaled $11.9 billion in 2008, up 341 percent from 2003.• U.S. imports from Chile totaled $8.2 billion in 2008, up 122 percent from 2003.• Ranking: In 2008, Chile was the 25th largest global market for U.S. exports and was the 39th largest
source of U.S. imports.
Benefits of the U.S.–Chile FTA:
Tariffs: 80 percent of bilateral trade in industrial and consumer products became duty-free upon the agreement’s entry into force.
Investment: The FTA established a secure, predictable legal framework for U.S. investors in the region, covering all forms of investment. In 2008, U.S. direct investment in Chile totaled $8.5 billion.
Services: Chile provided substantial market access to a broad range of sectors, including financial services. Chile eliminated measures that required U.S. firms to hire national professionals. Chile allowed Chilean mutual and pension funds to use portfolio managers in the United States.
Government Procurement: The FTA provides a rules-based procurement system for transparent, effective, and predictable market access and obligates Chile to guarantee national and non-discriminatory treatment to the goods and services produced by the United States. The agreement covers the purchases of most Chilean central government agencies, regional and local governments, and 11 ports.
Intellectual Property Rights: The FTA improved standards for the protection and enforcement of a broad range of intellectual property rights, including state-of-the-art protections for digital products such as U.S. software, music, text, and videos. The agreement also provided stronger protection for U.S. patents, trademarks, and test data, and further deterrence of piracy and counterfeiting by criminalizing end-user piracy.

15 Top U.S. Export Markets 2009
Bill
ion
s of
dol
lars
U.S. Trade in Goods with Chile
U.S. Exports
U.S. Imports
0
2
4
6
8
10
12
14
1990 1992 1994 1996 1998 2000 2002 2004 2006 2008
Billions of dollars
FTA implemented 1/1/2004
HS
Com
mod
ity
3105
39
01
8517
84
29
8703
84
31
8471
87
04
8800
27
10
Leading U.S. Exports to Chile in 2008 and Change from 2007
0 0.5 1 1.5 2 2.5 3 3.5 4
Re�ned petroleum (+117%)
Civilian aircraft (+23%)
Trucks (+20%)
ADP machines (+1%)
Parts for lifting machines (+76%)
Passenger vehicles (+82%)
Bulldozers, graders (+46%)
Elec. appar. for telephones (+40%)
Ethylene, primary form (+9%)
Fertilizer mixtures (N/A)
2710
8800
8704
8471
8431
8703
8429
8517
3901
3105
HS Commodity
Billions of dollars

16 U.S. Department of Commerce, International Trade Administration
U.S.–Colombia Trade Promotion Agreement (TPA) Analysis
Commentary: The U.S.–Colombia TPA was signed on November 22, 2006, and is awaiting consideration by the U.S. Congress. Colombia’s Congress approved the agreement in 2007. Upon entering into force, the TPA will help foster economic growth and create higher-paying jobs in the United States by reducing and eliminating barriers to trade and investment between the United States and Colombia. This agreement will also advance our goals of helping Colombia combat narcotics trafficking, build democratic institutions, and promote socioeconomic development. The U.S.–Colombia TPA would make permanent our unilateral trade preferences under the Andean Trade Promotion and Drug Eradication Act.
U.S.–Colombia Trade:
• Overall trade in goods between the United States and Colombia grew from $18 billion in 2007 to $24.5 billion in 2008, an increase of 36 percent.
• U.S. exports to Colombia totaled $11.4 billion in 2008, up 34 percent from 2007.• U.S. imports from Colombia were $13.1 billion in 2008, up 39 percent from 2007.• Ranking: In 2008, Colombia was the 26th largest global market for U.S. exports and the 29th largest
source of U.S. imports.
Benefits of the U.S.–Colombia TPA:
Tariffs: Immediately upon entry into force, the agreement would provide duty-free access to 80 percent of U.S. exports of industrial and consumer products to Colombia.
Investment: The TPA would establish a secure, predictable legal framework for U.S. investors. All forms of investment would be covered. In 2008, U.S. direct investment in Colombia totaled $6.3 billion.
Services: Colombia agreed to accord substantial market access across sectors, including financial services, and to eliminate measures requiring U.S. firms to hire national professionals and measures requiring the purchase of local goods. Colombia also agreed that both mutual and pension funds in Colombia would be allowed to use portfolio managers in the United States.
Government Procurement: The agreement requires the use of fair and transparent government procurement procedures, including advance notice of purchases and timely and effective bid review.
Intellectual Property Rights: The TPA would provide for improved standards for the protection and enforcement of a broad range of intellectual property rights. This includes state-of-the-art protections for digital products such as U.S. software, music, text, and videos; stronger protection for U.S. patents, trademarks, and test data; and further deterrence of piracy and counterfeiting by criminalizing end-user piracy.

17 Top U.S. Export Markets 2009
U.S. Trade in Goods with Colombia
0
2
4
6
8
10
12
14
1990 1992 1994 1996 1998 2000 2002 2004 2006 2008
Billions of dollars
U.S. Imports
U.S. Exports
Bill
ion
s of
dol
lars
HS
Com
mod
ity
2903
39
01
2901
85
17
8429
10
01
8471
84
31
1005
27
10
Leading U.S. Exports to Colombia in 2008 and Change from 2007
0 0.2 0.4 0.6 0.8 1 1.2
Re�ned petroleum (+316%)
Corn (+21%)
Parts for lifting machines (+19%)
ADP machines (+19%)
Wheat, meslin (+58%)
Bulldozers, graders (+83%)
Elec. appar. for telephones (+61%)
Acyclic hydrocarbons (+17%)
Ethylene, primary form (+12%)
Halogenated hydrocarbons (+12%)
2710
1005
8431
8471
1001
8429
8517
2901
3901
2903
HS Commodity
Billions of dollars

18 U.S. Department of Commerce, International Trade Administration
U.S.–Israel Free Trade Agreement (FTA) Analysis
Commentary: The U.S.–Israel FTA was signed on August 19, 1985, and entered into force on September 1, 1985. This was the first FTA signed by the United States. In addition, in 1996 the United States and Israel signed an Agreement on Trade in Agricultural Products (ATAP), establishing gradual and steady market access liberalization for food and agricultural products effective through December 31, 2001. Negotiation and implementation of a successor ATAP was completed in 2004. It was effective through December 31, 2008, and was extended through December 31, 2010.
Before and After the U.S.–Israel FTA:
• Overall trade in goods between the United States and Israel grew from $4.7 billion in 1985 to $36.8 billion in 2008, an increase of 683 percent.
• U.S. exports to Israel grew from $2.6 billion in 1985 to $14.5 billion in 2008, an increase of 462 percent.
• U.S. imports from Israel grew from $2.1 billion in 1985 to $22.3 billion in 2008, an increase of 952 percent.
• Ranking: In 2008, Israel was the 19th largest global market for U.S. exports and the 20th largest supplier of U.S. imports.
Benefits of the U.S.-Israel FTA:
Tariffs: Duties on manufactured goods were eliminated as of January 1, 1995.
Investment: The FTA does not include an investment chapter. Services: The FTA includes a nonbinding statement of intent to eliminate barriers to trade in services such as tourism, communications, banking, insurance, management consulting, accounting, law, computer services, and advertising.
Government Procurement: The FTA eliminates all restrictions on government procurement and calls on Israel to relax its offsets requirements for government agencies other than the Israeli Ministry of Defense. However, U.S. companies are concerned about the government procurement process, including the lack of transparency in the evaluation of tenders, lengthy tender procedures stemming from a lack of preparation, and the use of negotiated agreements or directed contracts rather than public tenders.
Intellectual Property Rights: The FTA reaffirms obligations under bilateral and multilateral agreements relating to intellectual property rights. However, Israel was elevated to the Priority Watch List in the Office of the U.S. Trade Representative’s 2005 Special 301 Report, where it remains because of continuing concerns about its policies on data protection for proprietary test data.

19 Top U.S. Export Markets 2009
U.S. Trade in Goods with Israel
U.S. Exports
U.S. Imports
0
5
10
15
20
25
1980 1983 1986 1989 1992 1995 1998 2001 2004 2007
Billions of dollars
FTA implemented 9/1/1985B
illio
ns
of d
olla
rsH
S C
omm
odit
y10
05
8542
870
3 8
471
880
3 8
486
880
2 2
710
880
0 7
102
0 1 2 3 4 5 6
Diamonds (+14%)
Civilian aircraft (-21%)
Re�ned petroleum (+80%)
Aircraft, spacecraft (+25%)
Semiconductor mfr. mach. (+69%)
Aircraft parts (-1%)
ADP machines (-19%)
Passenger vehicles (+85%)
Integrated circuits (-1%)
Corn (+17%)
Billions of dollars
Leading U.S. Exports to Israel in 2008 and Change from 2007

20 U.S. Department of Commerce, International Trade Administration
U.S.–Jordan Free Trade Agreement (FTA) Analysis
Commentary: The U.S.–Jordan FTA was signed on October 24, 2000, and entered into force on December 17, 2001. It was the fourth U.S. FTA and the first with an Arab trading partner. The United States and Jordan agreed to phased tariff reductions culminating in the complete elimination of duties on nearly all products by 2010. It was the first FTA to include provisions on environment, labor, and electronic commerce.
Before and After the U.S.–Jordan FTA:
• Overall trade in goods between the United States and Jordan grew from $728 million in 2000 to $2.1 billion in 2008, an increase of 185 percent.
• U.S. exports to Jordan grew from $316 million in 2000 to $940 million in 2008, an increase of 197 percent.
• U.S. imports from Jordan grew from $73 million in 2000 to $1.1 billion in 2008, an increase of 1,459 percent. Note: Most U.S. imports from Jordan come from Qualified Industrial Zones, which pre-date the FTA and allow for duty-free access into the United States when there is Israeli content in those products.
• Ranking: In 2008, Jordan was the 78th largest U.S. export market and the 75th largest supplier of imports.
Benefits of the U.S.–Jordan FTA:
Tariffs: Tariffs will be gradually reduced and eliminated on nearly all products by 2010.
Investment: The FTA does not include an investment chapter.
Services: The FTA opened up trade in services, giving U.S. service providers excellent opportunities in Jordan’s financial, education, audiovisual, courier, and other services sectors.
Government Procurement: The FTA noted that Jordan and the United States will enter into negotiations with regard to Jordan’s accession to the World Trade Organization’s Agreement on Government Procurement (GPA). Jordan applied to accede to the GPA on July 12, 2000, and has not yet completed its accession.
Intellectual Property Rights: With the signing of the U.S.–Jordan FTA, Jordan committed to stronger enforcement of intellectual property rights, particularly in the pharmaceutical sector. The benefits of the FTA for industry included expanded data protection, elimination of exclusions from patentability for biotechnology inventions, and limitations on compulsory licensing.

21 Top U.S. Export Markets 2009
HS
Com
mod
ity
4705
84
71
107
843
1 7
606
880
0 8
802
880
3 1
006
870
3
Leading U.S. Exports to Jordan in 2008 and Change from 2007
0 50 100 150 200 250
Passenger vehicles (+157%)
Rice (+42%)
Aircraft parts (-47%)
Aircraft, spacecraft (-73%)
Civilian aircraft (+32%)
Aluminum waste, scrap (+18%)
Printing machinery (+78%)
Soybean oil (N/A)
ADP machines (+70%)
Semichemical woodpulp (+10,383%)
8703
1006
8803
8802
8800
7606
8431
1507
8471
4705
HS Commodity
Millions of dollars
U.S. Trade in Goods with Jordan
U.S. Exports
U.S. Imports
0.0
0.2
0.4
0.6
0.8
1.0
1.2
1.4
1.6
1990 1992 1994 1996 1998 2000 2002 2004 2006 2008
Billions of dollars
FTA implemented 12/17/2001
Bill
ion
s of
dol
lars

22 U.S. Department of Commerce, International Trade Administration
U.S.–Korea Free Trade Agreement (KORUS FTA) Analysis Commentary: The KORUS FTA was signed on June 30, 2007, and is awaiting approval by the U.S. Congress and the Korean legislature. Upon entering into force, KORUS will be the United States’ most commercially significant FTA in several years. This comprehensive trade agreement will eliminate tariffs and non-tariff barriers to trade in goods and services, promote economic growth, and enhance trade between the United States and South Korea. KORUS FTA will help foster economic growth and create higher-paying jobs in the United States by reducing and eliminating barriers to trade and investment between the United States and South Korea.
U.S.– South Korea Trade:
• Overall trade in goods between the United States and South Korea grew from $82 billion in 2007 to $82.7 billion in 2008, up 1 percent.
• U.S. exports to South Korea totaled $34.7 billion in 2008, an increase of 1 percent from 2007. • U.S. imports from South Korea were $48.1 billion in 2008, up 1 percent from 2007.• Ranking: South Korea is the United States’ seventh largest trading partner.
Benefits of the U.S.–Korea FTA:
Tariffs: Nearly 95 percent of U.S. industrial and consumer products exports will become duty-free in Korea within three years of entry into force of the agreement.
Investment: The agreement establishes a stable legal framework for U.S. investors operating in Korea. All forms of investment are protected under the agreement. The investment protections in this FTA are as strong as those in any FTA to date. In 2008, U.S. direct investment in Korea totaled $27.7 billion.
Services: The FTA provides meaningful market access commitments that extend across virtually all major service sectors, including express delivery services, research and development, legal, accounting, financial, maintenance and repair of equipment, education, health, environmental, telecommunications, audiovisual, and services incidental to mining.
Government Procurement: The FTA will provide U.S. firms non-discriminatory access to nine Korean central government entities that are not covered under the plurilateral World Trade Organization Agreement on Government Procurement (GPA). The FTA will also set a threshold (contract values above which procurement is opened) that is nearly half the GPA threshold. It provides for a working group on government procurement to take up any issues, in particular those related to information technology.
Intellectual Property Rights: The FTA will provide for improved standards for the protection and enforcement of a broad range of intellectual property rights, including trademarks, copyrights, and patents. The measures are consistent with U.S. standards and will provide effective protection and enforcement for emerging technologies. These standards include state-of-the-art protections for digital products such as U.S. software, music, text, and videos. Additionally, the agreement provides for stronger, more comprehensive protection for patents, trademarks, and test data; rules on civil, criminal, and customs enforcement; and a commitment to establish a patent linkage system to ensure adequate enforcement of pharmaceutical patent rights.

23 Top U.S. Export Markets 2009
U.S. Trade in Goods with South Korea
U.S. Exports
U.S. Imports
0
10
20
30
40
50
60
1990 1992 1994 1996 1998 2000 2002 2004 2006 2008
Billions of dollarsBill
ion
s of
dol
lars
HS
Com
mod
ity
8803
10
01
8517
88
02
7204
88
00
8486
85
42
8541
10
05
Leading U.S. Exports to South Korea in 2008 and Change from 2007
0 0.5 1 1.5 2 2.5
Corn (+157%)
Semiconductors (+26%)
Integrated circuits (-40%)
Semiconductor mfr. mach. (-4%)
Civilian aircraft (-31%)
Ferrous waste, scrap (+116%)
Aircraft, spacecraft (-16%)
Elec. appar. for telephones (+12%)
Wheat, meslin (+58)
Aircraft parts (-16%)
1005
8541
8542
8486
8800
7204
8802
8517
1001
8803
HS Commodity
Billions of dollars

24 U.S. Department of Commerce, International Trade Administration
U.S.–Morocco Free Trade Agreement (FTA) Analysis
Commentary: The U.S.–Morocco FTA was signed on June 15, 2004, and entered into force on January 1, 2006.
Before and After the U.S.–Morocco FTA:
• Overall trade in goods between the United States and Morocco increased 150 percent between 2005 and 2008, from $927 million to $2.3 billion.
• U.S. exports to Morocco grew to $1.4 billion in 2008 from $481 million in 2005, an increase of 199 percent.
• U.S. imports from Morocco grew to $879 million in 2008 from $446 million in 2005, an increase of 97 percent.
• Ranking: In 2008, Morocco was the 68th largest global market for U.S. exports and the 81st largest source of U.S. imports.
Benefits of the U.S.–Morocco FTA:
Tariffs: About 95 percent of tariffs were immediately eliminated. Virtually all tariffs will be eliminated within 10 years.
Investment: The FTA expands the significant protections already afforded U.S. investors under a Bilateral Investment Treaty (BIT) signed in 1985 and provides for the protections of all forms of investment, including enterprises, debt, concessions, contracts, and intellectual property. In almost all circumstances, U.S. investors enjoy the right to establish, acquire, and operate investments in Morocco on an equal footing with Moroccan investors and with investors of other countries. U.S. investment in Morocco stood at $252 million in 2008.
Services: The FTA reinforces the ongoing development of Morocco’s legal and regulatory reforms and development plans for many sectors of interest to U.S. service providers in telecommunications, e-commerce, engineering and infrastructure services, and environmental and energy services, among other sectors. The FTA provides for transparency in Morocco’s regulatory framework for services in standard setting; the regulatory application process; and judicial, arbitral, and administrative procedures. The agreement reinforces reform already underway in many services sectors by lowering, phasing out, or making more transparent barriers to services trade and inward investment.
Government Procurement: The FTA prohibits the Moroccan government from discriminating against U.S. firms, or favoring Moroccan firms, when purchasing more than $175,000 in goods or services or $6.7 million in construction services.
Intellectual Property Rights: The FTA criminalizes end-user piracy, providing strong deterrence against piracy and counterfeiting, and provides significant new protection for U.S. patent, trademark, and copyright owners.

25 Top U.S. Export Markets 2009
U.S. Trade in Goods with Morocco
U.S. Exports
U.S. Imports
0.0
0.2
0.4
0.6
0.8
1.0
1.2
1.4
1.6
1990 1992 1994 1996 1998 2000 2002 2004 2006 2008
Billions of dollars
FTA implemented 1/1/2006
Bill
ion
s of
dol
lars
HS
Com
mod
ity
2303
39
02
1201
23
04
1001
27
13
1005
15
07
2701
88
00
Leading U.S. Exports to Morocco in 2008 and Change from 2007
0 20 40 60 80 100 120 140 160 180 200
Civilian aircraft (+38%)
Coal (+35%)
Soybean oil (+140%)
Corn (-47%)
Petroleum coke (+96%)
Wheat, meslin (-77%)
Soybean oilcake (+29%)
Soybeans (-50%)
Ole�n polymers (+6%)
Starch, sugar mrf. residues (+91%)
8800
2701
1507
1005
2713
1001
2304
1201
3902
2303
HS Commodity
Millions of dollars

26 U.S. Department of Commerce, International Trade Administration
North American Free Trade Agreement (NAFTA) Analysis
Commentary: The NAFTA between the United States, Canada, and Mexico entered into force on January 1, 1994. NAFTA created the world’s largest free trade area, linking 444 million people producing $16.9 trillion worth of goods and services. The dismantling of trade barriers and the opening of markets has led to economic growth and rising prosperity in all three countries.
Before and After the NAFTA:
• Overall trade in goods between the United States, Canada, and Mexico has grown from $297 billion in 1993 to $990 billion in 2008, an increase of 233 percent.
• U.S. exports to Canada and Mexico grew from $142 billion in 1993 to $412 billion in 2008, an increase of 190 percent.
• U.S. imports from Canada and Mexico grew from $151 billion in 1993 to $551 billion in 2008, an increase of 265 percent.
• Ranking: Canada and Mexico together rank as the top export and import market for the United States in 2008.
Benefits of the NAFTA:
Tariffs: All remaining duties and quantitative restrictions were eliminated on January 1, 2008.
Investment: NAFTA ensures that U.S. investors receive treatment equal to domestic investors in Mexico and Canada. NAFTA also permits investors to take the host government directly to international arbitration or settlement of disputes involving monetary damages for violations of the NAFTA’s investment provisions. Overall investment between the United States, Canada, and Mexico grew from $358 billion in 2003 to $557 billion in 2008, an increase of 56 percent.
Services: NAFTA covers virtually all services with the exception of aviation transport, maritime, and basic telecommunications. NAFTA substantially increases opportunities for U.S. exports to Canada and Mexico in such services as construction, environmental and computer software and design services, oil and gas field equipment and services, heavy electrical equipment, communications and computer systems, electronic, steel, pharmaceutical products, and medical equipment.
Government Procurement: The government procurement provisions of the NAFTA apply to goods, services, and construction contracts.
Intellectual Property Rights: NAFTA covers patents, trademarks, copyrights and related rights, trade secrets, semiconductor integrated circuits, plant breeder rights, geographical indications, and industrial designs. NAFTA “locks in” and extends the protection contained in the Intellectual Property Rights laws adopted by Mexico in June and July 1991.

27 Top U.S. Export Markets 2009
U.S. Trade in Goods with NAFTA
U.S. Exports
U.S. Imports
0
100
200
300
400
500
600
1990 1992 1994 1996 1998 2000 2002 2004 2006 2008
Billions of dollars
FTA implemented 1/1/1994
Bill
ion
s of
dol
lars
HS
Com
mod
ity
8407
85
17
2711
85
42
8471
88
00
8704
27
10
8703
87
08
Leading U.S. Exports to NAFTA in 2008 and Change from 2007
0 5 10 15 20 25 30
Motor vehicle parts (-9%)
Passenger vehicles (-8%)
Re�ned petroleum (+73%)
Trucks (-16%)
Civilian aircraft (+9%)
ADP machines (+3%)
Integrated circuits (-1%)
Petroleum gases (+38%)
Elec. appar. for telephones (+21%)
Piston engines (-10%)
8708
8703
2710
8704
8800
8471
8542
2711
8517
8407
HS Commodity
Billions of dollars

28 U.S. Department of Commerce, International Trade Administration
U.S.–Oman Free Trade Agreement (FTA) Analysis
Commentary: The U.S.–Oman FTA was signed in January 2006 and entered into force on January 1, 2009. This is the second U.S. FTA with a Gulf state, following Bahrain’s, which entered into force in 2006.
U.S.–Oman Trade
• Overall trade in goods between the United States and Oman in 2008 was $2.2 billion, an increase of 6 percent over 2007 figures.
• U.S. exports to Oman in 2008 totaled $1.4 billion, an increase of 30 percent over the previous year. Major exports were vehicles, machinery, aircraft, and electrical machinery.
• U.S. imports from Oman in 2008 were $852 million, a decrease of 18 percent over the previous year. Major imports were oil, precious stones and metals, plastic, and inorganic chemicals.
• Ranking: In 2008, Oman was our 70th largest export market.
Benefits of the U.S.–Oman FTA:
Tariffs: 100 percent of bilateral trade in industrial and consumer products became duty-free immediately upon entry into force of the agreement. The FTA provides reciprocal market access for U.S. textile and apparel producers.
Investment: All forms of investment are protected under the FTA, including enterprises, debt, concessions, contracts, and intellectual property. U.S. financial service suppliers have the right to establish subsidiaries, branches, and joint ventures in Oman, expand their operations throughout Oman, and offer a full range of financial services.
Services: Oman provides substantial market access across its entire services regime, including key service sectors such as audiovisual services, express delivery, telecommunications, computer and related services, distribution, health care, services incidental to mining, construction, architecture, and engineering.
Government Procurement: Under the FTA, U.S. suppliers are granted nondiscriminatory rights to bid on contracts to supply most Omani government entities. U.S. and Omani suppliers have increased certainty from the transparent, predictable, and fair procurement procedures, such as advance public notice requirements for purchases and timely and effective bid review procedures.
Intellectual Property Rights: The FTA requires expanded protections and strengthened enforcement of intellectual property rights.

29 Top U.S. Export Markets 2009
U.S. Trade in Goods with Oman
0.0
0.2
0.4
0.6
0.8
1.0
1.2
1.4
1.6
1990 1992 1994 1996 1998 2000 2002 2004 2006 2008
Billions of dollars
U.S. Imports
U.S. Exports
FTA implemented 1/1/2009
Bill
ion
s of
dol
lars
HS
Com
mod
ity
8906
84
11 1
515
848
1 8
413
930
6 8
802
880
0 8
431
870
3
0 200 300 400
Passenger vehicles (+81%)
Parts for lifting machines (+12%)
Civilian aircraft (+32%)
Aircraft, spacecraft (N/A)
Bombs, grenades (-44%)
Pumps for liquids (+62%)
Industrial valves (+92%)
Vegetable fats, oils (+1,518%)
Gas turbines (-29%)
Warships, lifeboats (N/A)
Millions of dollars
Leading U.S. Exports to Oman in 2008 and Change from 2007 100

30 U.S. Department of Commerce, International Trade Administration
U.S.–Panama Trade Promotion Agreement (TPA) Analysis
Commentary: The U.S.–Panama TPA was signed on June 28, 2007, and approved by the government of Panama on July 11, 2007. The TPA is awaiting approval by Congress. The U.S.–Panama TPA will eliminate tariffs; expand access to services trade; and include important disciplines on customs administration and trade facilitation, technical barriers to trade, government procurement, investment, telecommunications, electronic commerce, intellectual property rights, and labor and environmental protection. The U.S.–Panama TPA will also ensure that U.S. firms have an opportunity to participate on a competitive basis in the $5.25-billion Panama Canal expansion project.
U.S.–Panama Trade:
• Overall trade in goods between the United States and Panama grew from $4 billion in 2007 to $5.3 billion in 2008, an increase of 31 percent. The United States had a trade surplus of $4.5 billion in 2008.
• U.S. exports to Panama grew from $3.7 billion in 2007 to $4.9 billion in 2008, an increase of 32 percent.
• U.S. imports from Panama grew from $365 million in 2007 to $379 million in 2008, an increase of 4 percent.
• Ranking: Panama was the 40th largest market for U.S. exports in 2008.
Benefits of the U.S.–Panama TPA:
Tariffs: More than 88 percent of U.S. exports of consumer and industrial goods to Panama will become duty-free immediately upon entry into force of the agreement.
Investment: The U.S.–Panama TPA will cover all forms of investment and establish a secure, predictable legal framework for U.S. investors, including rules to protect investors against unfair or discriminatory government actions. The stock of U.S. foreign direct investment in Panama was $7.2 billion in 2008.
Services: The U.S.–Panama TPA will provide market access in several services sectors, including telecommunications, tourism, restaurants and hotels, construction, and energy. U.S. firms will have better access to Panama’s services sectors than it provides to other WTO members under the General Agreement on Tariffs in Services. The services chapter also affirms existing competitive opportunities in Panama and prevents cross-subsidization from a postal monopoly.
Government Procurement: The TPA guarantees non-discriminatory access and a fair and transparent process to sell goods and services to all significant Panamanian government entities, including the Panama Canal Authority.
Intellectual Property Rights: The U.S.–Panama TPA will establish high levels of intellectual property rights in Panama, including procedures for registering trademarks and stronger copyright, patent, and marketing data protection and enforcement.

31 Top U.S. Export Markets 2009
U.S. Trade in Goods with Panama
U.S. Exports
U.S. Imports
0.0
1.0
2.0
3.0
4.0
5.0
6.0
1990 1992 1994 1996 1998 2000 2002 2004 2006 2008
Billions of dollars
Bill
ion
s of
dol
lars
HS
Com
mod
ity
8525
23
04
8517
95
04
3303
84
71
1005
87
03
8800
27
10
Leading U.S. Exports to Panama in 2008 and Change from 2007
0 0.2 0.4 0.6 0.8 1 1.2 1.4 1.6 1.8 2
Re�ned petroleum (+55%)
Civilian aircraft (-9%)
Passenger vehicles (+53%)
Corn (+50%)
ADP machines (+10%)
Perfume, toilet waters (+12%)
Games (+81%)
Elec. appar. for telephones (+59%)
Soybean oilcake (+43%)
Transmission eqpt. for telecom (+72%)
2710
8800
8703
1005
8471
3303
9504
8517
2304
8525
HS Commodity
Billions of dollars

32 U.S. Department of Commerce, International Trade Administration
U.S.–Peru Trade Promotion Agreement (TPA) Analysis Commentary: The United States and Peru signed a TPA on April 12, 2006, which entered into force on February 1, 2009. The agreement fosters economic growth and creates higher-paying jobs in the United States by reducing and eliminating barriers to trade and investment. The TPA advances the American goals of helping Peru combat narcotics trafficking, build democratic institutions, and promote socioeconomic development. U.S.–Peru Trade:
• Overall trade in goods between the United States and Peru grew from $8.8 billion in 2006 to $12 billion in 2008, an increase of 50 percent.
• U.S. exports to Peru grew from $2.9 billion in 2006 to $6.2 billion in 2008, an increase of 114 percent.• U.S. imports from Peru dropped from $5.9 billion in 2006 to $5.8 billion in 2008, a decline of
1.7 percent.• Ranking: In 2008, Peru was the 35th largest global market for U.S. exports and the 46th largest
source of U.S. imports.
Benefits of the U.S.–Peru TPA:
Tariffs: 80 percent of bilateral trade in industrial and consumer products became duty free upon the agreement’s entry into force.
Investment: The TPA establishes a secure, predictable legal framework for U.S. investors. All forms of investment are covered. In 2008, U.S. direct investment in Peru totaled $8.5 billion.
Services: The FTA provided for substantial access to Peru’s services market, including financial services. Peru eliminated measures that required U.S. firms to hire national professionals and to purchase local goods. Peru also agreed to allow its mutual and pension funds to use portfolio managers in the United States.
Government Procurement: U.S. suppliers are granted non-discriminatory rights to bid on contracts from a broad range of Peruvian government ministries, agencies, public enterprises, and regional governments. The agreement requires the use of fair and transparent procurement procedures, such as advance notice of purchase and timely and effective bid review procedures
Intellectual Property Rights: The TPA provided for improved standards for the protection and enforcement of a broad range of intellectual property rights, including state-of-the-art protections for digital products such as U.S. software, music, text, and videos; stronger protection for U.S. patents, trademarks, and test data; and further deterrence of piracy and counterfeiting by criminalizing end-user piracy.

33 Top U.S. Export Markets 2009
U.S. Trade in Goods with Peru
U.S. Exports
U.S. Imports
0
1
2
3
4
5
6
7
1990 1992 1994 1996 1998 2000 2002 2004 2006 2008
Billions of dollarsBill
ion
s of
dol
lars
HS
Com
mod
ity
3902
39
04
1001
84
73
3901
84
29
8517
84
71
8431
27
10
Leading U.S. Exports to Peru in 2008 and Change from 2007
0 0.2 0.4 0.6 0.8 1 1.2 1.4
Re�ned petroleum (+137%)
Parts for lifting machines (+84%)
ADP machines (+49%)
Elec. appar. for telephones (+47%)
Bulldozers, graders (+57%)
Ethylene, primary form (+18%)
O�ce machine parts (+26%)
Wheat, meslin (-21%)
Vinyl chloride polymers (+146%)
Ole�n polymers (+36%)
2710
8431
8471
8517
8429
3901
8473
1001
3904
3902
HS Commodity
Billions of dollars

34 U.S. Department of Commerce, International Trade Administration
U.S.–Singapore Free Trade Agreement (FTA) Analysis
Commentary: The U.S.–Singapore FTA was signed on May 6, 2003, and went into force on January 1, 2004. It was the first U.S. FTA with an Asian nation.
Before and After the U.S.–Singapore FTA:
• Overall trade in goods between the United States and Singapore was $43.8 billion in 2008, an increase of 41 percent over 2003 (the final year before FTA implementation). The U.S. trade surplus with Singapore nearly tripled during the first year of FTA implementation, reaching $4 billion in 2004, and grew to $12 billion in 2008.
• U.S. exports to Singapore expanded to $27.9 billion in 2008, an increase of 68 percent over 2003.• U.S. imports from Singapore declined to $15.9 billion in 2008, an increase of 5 percent over 2003.• Ranking: In 2008, Singapore was the 12th largest market for U.S. exports, and the 27th largest
supplier to the United States.
Benefits of the U.S.–Singapore FTA:
Tariffs: All U.S. exports to Singapore became duty free immediately upon entry into force of the FTA.
Investment: The U.S.–Singapore FTA prohibits imposing performance-related requirements in connection with the establishment, acquisition, expansion, management, conduct, operation, sale, or other disposition of an investment.
Services: The U.S.–Singapore FTA reflects a substantial advance beyond Singapore’s commitments on services trade under the World Trade Organization Agreement on Trade and Services. The FTA guarantees U.S. firms enhanced access to key services markets in Singapore, particularly in the financial services, express delivery, and professional services sectors, and locks in current open access in other key services markets such as telecommunications.
Government Procurement: The FTA provides additional government procurement access to U.S. firms by expanding the contracts subject to FTA disciplines.
Intellectual Property Rights: In line with its FTA commitments, Singapore has developed one of the strongest intellectual property rights (IPR) regimes in Asia. Amendments to the Trademarks Act and the Patents Act, a new Plant Varieties Protection Act, and a new Manufacture of Optical Discs Act came into effect in July 2004. Amended Copyright and Broadcasting Acts came into effect in January 2005, and further amendments to the Copyright Act became effective in August 2005 and December 2008. Singapore is also a signatory to the major international IPR agreements administered by the World Intellectual Property Organization, which opened Secretariat offices in Singapore in June 2005.

35 Top U.S. Export Markets 2009
Bill
ion
s of
dol
lars
U.S. Trade in Goods with Singapore
U.S. Exports
U.S. Imports
0
5
10
15
20
25
30
1990 1992 1994 1996 1998 2000 2002 2004 2006 2008
Billions of dollars
FTA implemented 1/1/2004
0
HS
Com
mod
ity
1 2 3 4
Civilian aircraft (+8%)
Integrated circuits (-6%)
Re�ned petroleum (+44%)
Parts for lifting machines (+22%)
O�ce machine parts (+23%)
Semiconductor mfr. mach. (+14%)
ADP machines (-7%)
Elect. mach. w/indiv. functions (-9%)
Elec. appar. for telephones (+14%)
Semiconductors (-14%)
880
0 8
542
271
0 8
431
847
3 8
486
847
1 8
543
851
7 8
541
Billions of dollars
Leading U.S. Exports to Singapore in 2008 and Change from 2007

Country Fact Sheets

38 U.S. Department of Commerce, International Trade Administration
COUNTRY FACT SHEET: ARGENTINA
U.S. Ambassador to Argentina: Vilma MartinezArgentine Ambassador to the United States: Héctor Marcos Timerman
PROFILE Population: 39.7 million* Next Election Scheduled: April 2012 Capital: Buenos Aires Head of Government: Cristina Fernández de Kirchner Government: Federal Republic (President)
ECONOMY
• 2008 Nominal GDP (Current US$ billions): 324.8 • 2008 Nominal GDP Per Capita (Current US$): 8,171*
2006 2007 2008 Real GDP Growth Rate (%) 8.5 8.7 6.8 Real GDP Per Capita Growth Rate (%) 7.4 7.6 5.7 CPI (%) 10.9 8.8 8.6 Unemployment (%)
‡ 10.2 8.5 7.9
• Economic Mix in 2007†: 21% Manufacturing; 57% Services; 9% Agriculture.
FOREIGN MERCHANDISE TRADE (US$ billions) 2006 2007 2008 Argentina Exports to World 46.5 56.0 70.0 Argentina Imports from World 34.2 44.7 57.4 U.S. Exports to Argentina 4.8 5.9 7.5 U.S. Imports from Argentina 4.0 4.5 5.8 U.S. Trade Balance with Argentina 0.8 1.4 1.7
• Rank of Argentina as U.S. Export Market in 2008: 32nd Largest (0.6% of U.S. exports).• Rank of Argentina as Source of U.S. Imports in 2008: 45th Largest (0.3% of U.S. imports).• Principal U.S. Exports to Argentina in 2008: Machinery (25%); Electrical Machinery (12%); Mineral
Fuel, Oil (11%); Organic Chemicals (8%); Plastic (5%).• Principal U.S. Imports from Argentina in 2008: Mineral Fuel, Oil (37%); Miscellaneous Chemical
Products (13%); Aluminum (5%); Iron, Steel Products (5%); Preserved Food (5%).
FOREIGN DIRECT INVESTMENT (US$ billions) 2006 2007 2008 U.S. FDI in Argentina 13.1 14.1 15.2 FDI into U.S. from Argentina 0.3 0.3 0.7
• Principal Suppliers of Foreign Investment to Argentina: Spain, United States, France, Brazil, Chile, Italy, Canada, Mexico, United Kingdom, Netherlands, Germany.
DOING BUSINESS RANKING• World Bank Doing Business in 2010 Rank: 118 of 183 (112 in 2009).
COMMERCIAL OFFICER INFORMATIONSenior Commercial Officer: James RigassioCommerce Desk Officer: Ashley Rosen (202) 482-6311

39 Top U.S. Export Markets 2009
U.S
. Tra
de in
Goo
ds w
ith
Arg
enti
na
U.S
. Exp
orts
U.S
. Im
por
ts
012345678
1990
1992
1994
1996
1998
2000
2002
2004
2006
2008
Billi
ons o
f dol
lars
Arg
enti
na'
s Im
por
ts R
elat
ive
to G
DP
152
182
213
260
326
050100
150
200
250
300
350
2004
2005
2006
2007
2008
Billions of dollars
GD
PTo
tal i
mp
orts
Imp
orts
from
the
Un
ited
Sta
tes
HS Commodity3004 8800 3105 8502 8473 8708 8431 8517 8471 2710
Lead
ing
U.S
. Exp
orts
to A
rgen
tin
a in
200
8an
d C
han
ge fr
om 2
007
010
020
030
040
050
060
070
080
090
0
Re�
ned
pet
role
um
(+1
59%
)
AD
P m
ach
ines
(+7
%)
Ele
c. a
pp
ar. f
or te
lep
hon
es (
+47%
)
Part
s fo
r lif
tin
g m
ach
ines
(+3
8%)
Mot
or v
ehic
le p
arts
(+9
%)
O�
ce m
ach
ine
par
ts (
-2%
)
Ele
ctri
c ge
ner
atin
g se
ts (
+634
%)
Fert
ilize
r m
ixtu
res
(N/A
)
Civ
ilian
air
craf
t (-1
3%)
Ph
arm
aceu
tica
ls in
dos
ages
(+1
8%)
271
0
847
1
851
7
843
1
870
8
847
3
850
2
310
5
8800
300
4
HS
Com
mod
ity
Mill
ion
s of
dol
lars
Percent
U.S
. Mar
ket S
har
e of
Lead
ing
U.S
. Exp
orts
to A
rgen
tin
a
05101520253035404550
Re�
ned
pet
role
um
A
DP
mac
hin
esE
lec.
ap
par
.fo
rte
lep
hon
es Pa
rts
for
lifti
ng
mac
hin
es
Mot
orve
hic
le p
arts
271
0 8
471
851
7 8
431
870
8H
S C
omm
odit
y
Billions of dollars

40 U.S. Department of Commerce, International Trade Administration
COUNTRY FACT SHEET: AUSTRALIA
U.S. Ambassador to Australia: Jeff Bleich Australian Ambassador to the United States: Dennis J. Richardson
PROFILE Population: 21.6 million Next Election Scheduled: No later than 2010 Capital: Canberra Head of Government: Kevin Rudd
Government: Federal Parliamentary (Prime Minister) Democracy
ECONOMY
• 2008 Nominal GDP (Current US$ billions): 1,013.5 • 2008 Nominal GDP Per Capita (Current US$): 46,824
2006 2007 2008Real GDP Growth Rate (%) 2.8 4.0 2.4Real GDP Per Capita Growth Rate (%) 1.2 2.3 0.4CPI (%) 3.5 2.3 4.4Unemployment (%) 4.8 4.4 4.2
• Economic Mix in 2007†: 11% Manufacturing; 69% Services; 2% Agriculture.
FOREIGN MERCHANDISE TRADE (US$ billions) 2006 2007 2008Australia Exports to World 123.5 141.4 186.5Australia Imports from World 132.8 157.9 190.9U.S. Exports to Australia 17.5 19.2 22.2U.S. Imports from Australia 8.2 8.6 10.6U.S. Trade Balance with Australia 9.3 10.6 11.6
• Rank of Australia as U.S. Export Market in 2008: 14th Largest (1.7% of U.S. exports).• Rank of Australia as Source of U.S. Imports in 2008: 33rd Largest (0.5% of U.S. imports).• Principal U.S. Exports to Australia in 2008: Non-Electrical Machinery (22%); Vehicles, Not Railway
(12%); Aircraft, Spacecraft (10%); Electrical Machinery (8%); Optical, Photo, Medical Instruments (8%).
• Principal U.S. Imports from Australia in 2008: Mineral Fuel, Oil (11%); Meat (11%); Beverages (6%); Optical, Medical Instruments (6%); Vehicles, Not Railway (11%).
FOREIGN DIRECT INVESTMENT (US$ billions) 2006 2007 2008U.S. FDI in Australia 67.6 83.3 88.5FDI into U.S. from Australia 38.8 50.2 64.3
• Principal Suppliers of Foreign Investment to Australia: European Union, United States, Japan.
DOING BUSINESS RANKING• World Bank Doing Business in 2010 Rank: 9 of 183 (9 in 2009).
COMMERCIAL OFFICER INFORMATION Senior Commercial Officer: David MurphyCommerce Desk Officer: Jonathan Goldberg (202) 482-3822

41 Top U.S. Export Markets 2009
U.S
. Tra
de in
Goo
ds w
ith
Au
stra
lia
U.S
. Exp
orts U.S
. Im
por
ts
0510152025
1990
1992
1994
1996
1998
2000
2002
2004
2006
2008
Billio
ns of
dolla
rs
Au
stra
lia'
s Im
por
ts R
elat
ive
to G
DP
0.6
0.7
0.8
0.9
1.0
0
0.2
0.4
0.6
0.81
1.2
2004
2005
2006
2007
2008
Trilli
ons o
f doll
ars
GD
PTo
tal i
mp
orts
Imp
orts
from
the
Un
ited
Sta
tes
Trillions of dollars
Billions of dollars Percent
U.S
. Mar
ket S
har
e of
Lea
din
g U
.S. E
xpor
tsto
Au
stra
lia
0
102030405060
Civ
ilian
airc
raft
T
ruck
sPa
rts
for
lifti
ng
mac
hin
es M
edic
alin
stru
men
tsPa
ssen
ger
veh
icle
s
8802
8704
84
31
9018
87
03
HS
Com
mod
ity
Perc
ent
HS Commodity8701 3105 8429 8471 3004 8703 9018 8431 8704 8800
Lead
ing
U.S
. Exp
orts
to A
ust
rali
a in
200
8an
d C
han
ge fr
om 2
007
00.
20.
40.
60.
81
1.2
1.4
Civ
ilian
air
craf
t (+4
1%)
Tru
cks
(+31
)
Part
s fo
r lif
tin
g m
ach
ines
(+1
%)
Med
ical
inst
rum
ents
(+1
3%)
Pass
enge
r ve
hic
les
(+7%
)
Ph
arm
aceu
tica
ls in
dos
ages
(+1
%)
AD
P m
ach
ines
(-2
8%)
Bu
lldoz
ers,
gra
der
s (+
22%
)
Fert
ilize
r m
ixtu
res
(N/A
)
Tra
ctor
s (+
43%
)
8800
8704
8431
9018
8703
3004
8471
8429
3105
8701
HS
Com
mod
ity
Bill
ion
s of
dol
lars

42 U.S. Department of Commerce, International Trade Administration
COUNTRY FACT SHEET: THE BAHAMAS
U.S. Ambassador to the Bahamas: Nicole Avant Bahamas Ambassador to the United States: Cornelius Smith
PROFILEPopulation: 0.3 million Next Election Scheduled: 2012Capital: Nassau Head of Government: Hubert A. IngrahamGovernment: Parliamentary Democracy (Prime Minister)
ECONOMY• 2008 Nominal GDP (Current US$ billions): 7.6 • 2008 Nominal GDP Per Capita (Current US$): 22,359
2006 2007 2008Real GDP Growth Rate (%) 4.3 3.1 –1.7Real GDP Per Capita Growth Rate (%) 3.4 –0.6 –3.0CPI (%) 1.8 2.5 4.5Unemployment (%)
‡ 7.6 10.5 N/A
• Economic Mix in 2008: N/A
FOREIGN MERCHANDISE TRADE (US$ billions) 2006 2007 2008Bahamas Exports to World 0.5 0.7 0.7Bahamas Imports from World 3.0 3.1 3.2U.S. Exports to the Bahamas 2.3 2.5 2.8U.S. Imports from the Bahamas 0.5 0.5 0.6U.S. Trade Balance with the Bahamas 1.8 2.0 2.2
• Rank of the Bahamas as U.S. Export Market in 2008: 50th Largest (0.21% of U.S. exports).• Rank of the Bahamas as Source of U.S. Imports in 2008: 88th Largest (0.03% of U.S. imports).• Principal U.S. Exports to the Bahamas in 2008: Mineral Products (47%); Machinery (5%); Organic
Chemicals (4%); Electrical Machinery (3%); Vehicles (3%).• Principal U.S. Imports from the Bahamas in 2008: Plastics (23%); Mineral Fuel, Oil (19%); Seafood
(9%); Salt, Sulfur, Earth, Stone (8%); Beverages (1%); Boats (3%).
FOREIGN DIRECT INVESTMENT (US$ billions) 2006 2007 2008U.S. FDI in the Bahamas 13.7 17.8 19.5FDI into U.S. from the Bahamas 0.5 0.6 0.1• Principal Suppliers of Foreign Investment to the Bahamas: United States, Spain, Japan,
Singapore.
DOING BUSINESS RANKING• World Bank Doing Business in 2010 Rank: 68th of 183 (59 in 2009).
COMMERCIAL OFFICER INFORMATIONSenior Commercial Officer: Robert O. Jones (DR)Economic, Political Officer: Jefferson DubelCommerce Desk Officer: Michelle Brooks (202) 482-1658

43 Top U.S. Export Markets 2009
U.S
. Tra
de in
Goo
ds w
ith
Bah
amas
U.S
. Exp
orts
U.S
. Im
por
ts
0
0.51
1.52
2.53
1990
1992
1994
1996
1998
2000
2002
2004
2006
2008
Billio
ns of
dolla
rs
Bah
amas
' Im
por
ts R
elat
ive
to G
DP
6.0
6.5
6.9
7.2
7.5
012345678
2004
2005
2006
2007
2008
Billio
ns of
dolla
rs
GD
PTo
tal i
mp
orts
Imp
orts
from
the
Un
ited
Sta
tes
Billions of dollars
Billions of dollars Percent
U.S
. Mar
ket S
har
e of
Lead
ing
U.S
. Exp
orts
to th
e B
aham
as
0102030405060708090100
Re�
ned
pet
role
um
C
yclic
hyd
roca
rbon
sPa
ssen
ger
veh
icle
sFu
rnit
ure
/p
arts
Ir
on, s
teel
stru
ctu
res
2710
29
02
8703
94
03
7308
H
S C
omm
odit
y
Perc
ent
HS Commodity2106 8471 2707 0207 4407 7308 9403 8703 2902 2710
Lead
ing
U.S
. Exp
orts
to th
e B
aham
as in
200
8an
d C
han
ge fr
om 2
007
00.
20.
40.
60.
81
1.2
1.4
Re�
ned
pet
role
um
(+3
5%)
Cyc
lic h
ydro
carb
ons
(-5%
)
Pass
enge
r ve
hic
les
(-28
%)
Furn
itu
re/p
arts
(-2
6)
Iron
, ste
el s
tru
ctu
res
(+88
%)
Lum
ber
(-8
%)
Ed
ible
o�
al o
f pou
ltry
(-4
)
Oils
from
coa
l tar
(+3
,821
%)
AD
P m
ach
ines
(+3
%)
Mis
c. fo
od p
rep
arat
ion
s (+
60%
)
2710
2902
8703
9403
7308
4407
0207
2707
8471
2106
HS
Com
mod
ity
Bill
ion
s of
dol
lars

44 U.S. Department of Commerce, International Trade Administration
COUNTRY FACT SHEET: BELGIUM
U.S. Ambassador to Belgium: Howard GutmanBelgian Ambassador to the United States: Jan Matthysen
PROFILEPopulation: 10.7 million Next Election Scheduled: Spring 2012Capital: Brussels Head of Government: Yves LetermeGovernment: Constitutional Monarchy (Prime Minister)
ECONOMY• 2008 Nominal GDP (Current US$ billions): 506.2 • 2008 Nominal GDP Per Capita (Current US$): 47,289
2006 2007 2008Real GDP Growth Rate (%) 3.0 2.6 1.1Real GDP Per Capita Growth Rate (%) 2.3 1.8 0.6CPI (%) 2.3 1.8 4.5Unemployment (%) 8.3 7.5 7.0
• Economic Mix in 2006†: 17% Manufacturing; 75% Services; 1% Agriculture.
FOREIGN MERCHANDISE TRADE (US$ billions) 2006 2007 2008Belgium Exports to World 367.0 432.4 476.5Belgium Imports from World 352.0 413.7 470.1U.S. Exports to Belgium 21.3 25.3 28.9U.S. Imports from Belgium 14.4 15.3 17.3U.S. Trade Balance with Belgium 6.9 10.0 11.6
• Rank of Belgium as U.S. Export Market in 2008: 10th Largest (2.3% of U.S. exports).• Rank of Belgium as Source of U.S. Imports in 2008: 26th Largest (0.8% of U.S. imports).• Principal U.S. Exports to Belgium in 2008: Machinery (13%); Organic Chemicals (12%); Precious
Stones, Metals (10%); Optical, Medical Instruments (9%); Pharmaceuticals (8%).• Principal U.S. Imports from Belgium in 2008: Precious Stones, Metals (21%); Mineral Fuel, Oil
(18%); Organic Chemicals (13%); Pharmaceutical Products (9%); Machinery (8%).
FOREIGN DIRECT INVESTMENT (US$ billions) 2006 2007 2008U.S. FDI in Belgium 51.9 63.0 65.1FDI into U.S. from Belgium 11.7 23.7 18.6• Principal Suppliers of Foreign Investment to Belgium: United States, Germany, United Kingdom,
Netherlands, France, Switzerland.
DOING BUSINESS RANKING• World Bank Doing Business in 2010 Rank: 22 of 183 (20 in 2009).
COMMERCIAL OFFICER INFORMATIONSenior Commercial Officer: Paul KullmanCommerce Desk Officer: Jen Levine (202) 482-0431

45 Top U.S. Export Markets 2009
U.S
. Tra
de in
Goo
ds w
ith
Bel
giu
m
U.S
. Exp
orts
U.S
. Im
por
ts
05101520253035
1990
1992
1994
1996
1998
2000
2002
2004
2006
2008
Billio
ns of
dolla
rs
Bel
giu
m's
Imp
orts
Rel
ativ
e to
GD
P
359
377
400
459
506
0
100
200
300
400
500
600
2004
2005
2006
2007
2008
Billio
ns of
dolla
rs
GD
PTo
tal i
mp
orts
Imp
orts
from
the
Un
ited
Sta
tes
Billions of dollars
Billions of dollars Percent
U.S
. Mar
ket S
har
e of
Lead
ing
U.S
. Exp
orts
to B
elgi
um
0510152025303540
Dia
mon
ds
Med
ical
inst
rum
ents
Ph
arm
aceu
-ti
cals
ind
osag
es
Het
eroc
yc.
com
p.w
/nit
ro
Re�
ned
pet
role
um
7102
90
18
3004
29
33
2710
H
S C
omm
odit
y
Perc
ent
HS Commodity8711 3901 3824 2673 8800 2710 2933 3004 9018 7102
Lead
ing
U.S
. Exp
orts
to B
elgi
um
in 2
008
and
Ch
ange
from
200
70
0.5
11.
52
2.5
3
Dia
mon
ds
(+20
%)
Med
ical
inst
rum
ents
(+5
5%)
Ph
arm
aceu
tica
ls in
dos
ages
(+2
8%)
Het
eroc
yc. c
omp.
w/n
itro
(-2
9%)
Re�
ned
pet
role
um
(+1
80%
)
Civ
ilian
air
craf
t (+5
8%)
Mol
ybd
enu
m o
res,
con
c. (
+33%
)
Ch
emic
al b
ind
ers
(171
%)
Eth
ylen
e, p
rim
ary
form
(+5
%)
Mot
orcy
cles
(+1
4%)
7102
9018
3004
2933
2710
8800
2673
3824
3901
8711
HS
Com
mod
ity
Bill
ion
s of
dol
lars

46 U.S. Department of Commerce, International Trade Administration
COUNTRY FACT SHEET: BRAZIL
U.S. Ambassador to Brazil: Thomas ShannonBrazilian Ambassador to the United States: Mauro Vieira
PROFILEPopulation: 191.9 million* Next Election Scheduled: 2010Capital: Brasilia Head of Government: Luiz Inacio Lula da SilvaGovernment: Federative Republic (President)
ECONOMY• 2008 Nominal GDP (Current US$ billions): 1,572.8• 2008 Nominal GDP Per Capita (Current US$): 8,295*
2006 2007 2008Real GDP Growth Rate (%) 3.9 5.7 5.1Real GDP Per Capita Growth Rate (%)* 2.5 4.5 4.0CPI (%) 4.2 3.6 5.7Unemployment (%)
‡ 10.0 9.3 7.9
• Economic Mix in 2007†: 18% Manufacturing; 66% Services; 6% Agriculture.
FOREIGN MERCHANDISE TRADE (US$ billions) 2006 2007 2008Brazil Exports to World 137.5 160.6 197.9Brazil Imports from World 91.4 120.6 173.2U.S. Exports to Brazil 18.9 24.2 32.3U.S. Imports from Brazil 26.4 25.6 30.5U.S. Trade Balance with Brazil –7.5 –1.4 1.8
• Rank of Brazil as U.S. Export Market in 2008: 9th Largest (2.5% of U.S. exports).• Rank of Brazil as Source of U.S. Imports in 2008: 16th Largest (1.5% of U.S. imports).• Principal U.S. Exports to Brazil in 2008: Machinery (21%); Aircraft, Spacecraft (17%); Electric
Machinery (11%); Mineral Fuel, Oil (7%); Organic Chemicals (7%); Plastics (6%).• Principal U.S. Imports from Brazil in 2008: Mineral Fuel, Oil (29%); Iron, Steel (11%); Machinery
(9%); Aircraft, Spacecraft (8%); Wood (3%).
FOREIGN DIRECT INVESTMENT (US$ billions) 2006 2007 2008U.S. FDI in Brazil 33.1 47.8 45.5FDI into U.S. from Brazil 1.1 1.8 0.8• Principal Suppliers of Foreign Investment to Brazil: United States, Netherlands, Cayman Islands,
Switzerland, Spain, Canada.
DOING BUSINESS RANKING• World Bank Doing Business in 2010 Rank: 129 of 183 (127 in 2009).
COMMERCIAL OFFICER INFORMATIONSenior Commercial Officer: Danny DevitoCommerce Desk Officer: Maria Cameron (202) 482-0475 Lorrie Fussell (202) 482-4157
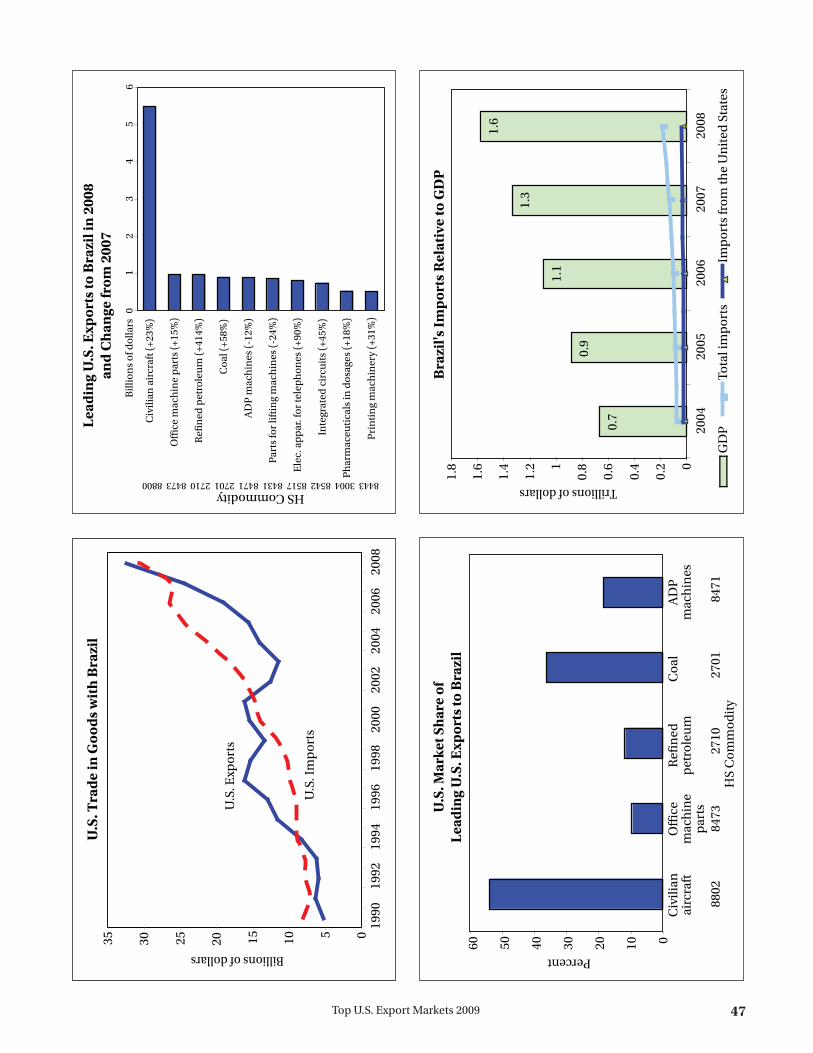
47 Top U.S. Export Markets 2009
U.S
. Tra
de in
Goo
ds w
ith
Bra
zil
U.S
. Exp
orts
U.S
. Im
por
ts
05101520253035
1990
1992
1994
1996
1998
2000
2002
2004
2006
2008
Billio
ns of
dolla
rs
Bra
zil's
Imp
orts
Rel
ativ
e to
GD
P
0.7
0.9
1.1
1.3
1.6
0
0.2
0.4
0.6
0.81
1.2
1.4
1.6
1.8
2004
2005
2006
2007
2008
Trilli
ons o
f doll
ars
GD
PTo
tal i
mp
orts
Imp
orts
from
the
Un
ited
Sta
tes
Trillions of dollars
Billions of dollars
HS Commodity8443 3004 8542 8517 8431 8471 2701 2710 8473 8800
Lead
ing
U.S
. Exp
orts
to B
razi
l in
200
8an
d C
han
ge fr
om 2
007
01
23
45
6
Civ
ilian
air
craf
t (+2
3%)
O�
ce m
ach
ine
par
ts (
+15%
)
Re�
ned
pet
role
um
(+4
14%
)
Coa
l (+5
8%)
AD
P m
ach
ines
(-1
2%)
Part
s fo
r lif
tin
g m
ach
ines
(-2
4%)
Ele
c. a
pp
ar. f
or te
lep
hon
es (
+90%
)
Inte
grat
ed c
ircu
its
(+45
%)
Ph
arm
aceu
tica
ls in
dos
ages
(+1
8%)
Pri
nti
ng
mac
hin
ery
(+31
%)
8800
8473
2710
2701
8471
8431
8517
8542
3004
8443
HS
Com
mod
ity
Bill
ion
s of
dol
lars
Percent
U.S
. Mar
ket S
hare
of
Lead
ing
U.S
. Exp
orts
to B
razi
l
0102030405060
Civ
ilian
airc
raft
O�
cem
ach
ine
par
ts
Re�
ned
pet
role
um
Coa
lA
DP
mac
hin
es
8802
8473
27
10
2701
84
71
HS
Com
mod
ity
Perc
ent

48 U.S. Department of Commerce, International Trade Administration
COUNTRY FACT SHEET: CANADA
U.S. Ambassador to Canada: David Jacobson Canadian Ambassador to the United States: Gary Doer
PROFILEPopulation: 33.3 million Next Election Scheduled: N/ACapital: Ottawa Head of Government: Stephen Harper Government: Constitutional Monarchy (Prime Minister)
ECONOMY• 2008 Nominal GDP (Current US$ billions): 1,499.6 • 2008 Nominal GDP Per Capita (Current US$): 45,085
2006 2007 2008Real GDP Growth Rate (%) 2.9 2.5 0.4Real GDP Per Capita Growth Rate (%) 2.1 1.4 –0.7CPI (%) 2.0 2.1 2.4Unemployment (%) 6.3 6.0 6.2
• Economic Mix in 2008§: 28% Manufacturing; 70% Services; 2% Agriculture.
FOREIGN MERCHANDISE TRADE (US$ billions) 2006 2007 2008Canada Exports to World 388.3 420.6 456.6Canada Imports from World 350.0 380.3 408.4U.S. Exports to Canada 230.7 248.9 261.1U.S. Imports from Canada 302.4 317.1 339.5U.S. Trade Balance with Canada –71.8 –68.2 –78.4
• Rank of Canada as U.S. Export Market in 2008: 1st Largest (20.3% of U.S. exports).• Rank of Canada as Source of U.S. Imports in 2008: 1st Largest (16.1% of U.S. imports).• Principal U.S. Exports to Canada in 2008: Vehicles and Parts (17%); Machinery (16%); Electrical
Machinery (9%); Mineral Fuel, Oil (6%); Plastics (4%).• Principal U.S. Imports from Canada in 2008: Mineral Fuel, Oil (34%); Vehicles (14%); Machinery
(6%); Plastics (3%); Electrical Machinery (3%).
FOREIGN DIRECT INVESTMENT (US$ billions) 2006 2007 2008U.S. FDI in Canada 205.1 234.0 227.3FDI into U.S. from Canada 165.3 207.9 221.9• Principal Suppliers of Foreign Investment to Canada: United States, European Union.
DOING BUSINESS RANKING• World Bank Doing Business in 2010 Rank: 8 of 183 (8 in 2009).
COMMERCIAL OFFICER INFORMATIONMinister Counselor for Commercial Affairs: Janice Corbett (acting)Commerce Desk Officer: Emily Barragan (202) 482-4705

49 Top U.S. Export Markets 2009
U.S
. Tra
de in
Goo
ds w
ith
Can
ada
U.S
. Exp
orts
U.S
. Im
por
ts
050100
150
200
250
300
350
400
1990
1992
1994
1996
1998
2000
2002
2004
2006
2008
Billio
ns of
dolla
rs
Can
ada'
s Im
por
ts R
elat
ive
to G
DP
1.0
1.1
1.3
1.4
1.5
0
0.2
0.4
0.6
0.81
1.2
1.4
1.6
2004
2005
2006
2007
2008
Trilli
ons o
f doll
ars
GD
PTo
tal i
mp
orts
Imp
orts
from
the
Un
ited
Sta
tes
Trillions of dollars
Billions of dollars Percent
U.S
. Mar
ket S
har
e of
Lead
ing
U.S
. Exp
orts
to C
anad
a
0102030405060708090100
Mot
orve
hic
le p
arts
Pass
enge
rve
hic
les
Tru
cks
Civ
ilian
airc
raft
Re�
ned
pet
role
um
8708
87
03
8704
88
0227
10
HS
Com
mod
ity
Perc
ent
HS Commodity8517 8429 8407 2711 8471 2710 8800 8704 8703 8708
Lead
ing
U.S
. Exp
orts
to C
anad
a in
200
8an
d C
han
ge fr
om 2
007
02
46
810
1214
1618
Mot
or v
ehic
le p
arts
(-1
5%)
Pass
enge
r ve
hic
les
(-3%
)
Tru
cks
(-17
%)
Civ
ilian
air
craf
t (+7
%)
Re�
ned
pet
role
um
(+7
7%)
AD
P m
ach
ines
(+4
%)
Pet
role
um
gas
es (
+43%
)
Pis
ton
en
gin
es (
-14%
)
TV,
rad
io p
arts
(+8
%)
Ele
c. a
pp
ar. f
or te
lep
hon
es (
+6%
)
8708
8703
8704
8800
2710
8471
2711
8407
8429
8517
HS
Com
mod
ity
Bill
ion
s of
dol
lars

50 U.S. Department of Commerce, International Trade Administration
COUNTRY FACT SHEET: CHILE
U.S. Ambassador to Chile: Paul SimonsChilean Ambassador to the United States: José Goñi
PROFILEPopulation: 16.8 million Next Election Scheduled: December 2013Capital: Santiago Head of Government: Michelle Bachelet (President)Government: Republic Sebastian Pinera (President-elect)
ECONOMY• 2008 Nominal GDP (Current US$ billions): 169.5 • 2008 Nominal GDP Per Capita (Current US$): 10,117
2006 2007 2008Real GDP Growth Rate (%) 4.6 4.7 3.2Real GDP Per Capita Growth Rate (%) 3.4 3.6 2.1CPI (%) 3.4 4.4 8.7Unemployment (%)
‡ 8.0 7.0 7.8‡•
• Economic Mix in 2007†: 14% Manufacturing; 49% Services; 4% Agriculture.
FOREIGN MERCHANDISE TRADE (US$ billions) 2006 2007 2008Chile Exports to World 55.9 65.8 69.6Chile Imports from World 34.7 42.7 56.5U.S. Exports to Chile 6.6 8.1 11.9U.S. Imports from Chile 9.6 9.0 8.2U.S. Trade Balance with Chile –3.0 –0.9 3.7
• Rank of Chile as U.S. Export Market in 2008: 25th Largest (0.9% of U.S. exports).• Rank of Chile as Source of U.S. Imports in 2008: 39th Largest (0.4% of U.S. imports).• Principal U.S. Exports to Chile in 2008: Mineral Fuel, Oil (30%); Machinery (18%); Vehicles (9%);
Electrical Machinery (7%); Aircraft (4%).• Principal U.S. Imports from Chile in 2008: Copper (34%); Edible Fruit, Nuts (17%); Fish,
Seafood (11%); Wood (8%); Precious Stones, Metals (7%).
FOREIGN DIRECT INVESTMENT (US$ billions) 2006 2007 2008U.S. FDI in Chile 10.9 11.6 12.6FDI into U.S. from Chile 0.3 0.3 0.4• Principal Suppliers of Foreign Investment to Chile: Spain, United States, Canada, United
Kingdom, Australia.
DOING BUSINESS RANKING• World Bank Doing Business in 2010 Rank: 49 of 183 (40 in 2009).
COMMERCIAL OFFICER INFORMATIONSenior Commercial Officer: Mitch LarsenCommerce Desk Officer: Kristen Mann (202) 482-4302

51 Top U.S. Export Markets 2009
U.S
. Tra
de in
Goo
ds w
ith
Ch
ile
U.S
. Exp
orts
U.S
. Im
por
ts
02468101214
1990
1992
1994
1996
1998
2000
2002
2004
2006
2008
Billio
ns of
dolla
rs
Ch
ile'
s Im
por
ts R
elat
ive
to G
DP
96
118
147
164
170
020406080100
120
140
160
180
2004
2005
2006
2007
2008
Billio
ns of
dolla
rs
GD
PTo
tal i
mp
orts
Imp
orts
from
the
Un
ited
Sta
tes
Billions of dollars
Billions of dollars Percent
U.S
. Mar
ket S
har
e of
Lea
din
gU
.S. E
xpor
ts to
Ch
ile
0102030405060708090
Re�
ned
pet
role
um
C
ivili
anai
rcra
ftT
ruck
s A
DP
mac
hin
esPa
rts
for
lifti
ng
mac
hin
es27
10
8802
87
04
8471
84
31
HS
Com
mod
ity
Per
cen
t
0 1
2 3
4
Re�
ned
pet
role
um
(+1
17%
)
Civ
ilian
air
craf
t (+2
4%)
Tru
cks
(+20
%)
AD
P m
ach
ines
(+1
%)
Par
ts fo
r lif
tin
g m
ach
ines
(+7
6%)
Pas
sen
ger
veh
icle
s (+
82%
)
Bu
lldoz
ers,
gra
der
s (+
46%
)
Ele
c. a
pp
ar. f
or te
lep
hon
es (
+40%
)
Eth
ylen
e, p
rim
ary
form
(+9
%)
Fert
ilize
r m
ixtu
res
(N/A
)
2710 8800 8704 8471 8431 8703 8429 8517 3901 3105
Bill
ion
s of
dol
lars
HS Commodity
Lead
ing
U.S
. Exp
orts
to C
hil
e in
200
8 an
d C
han
ge fr
om 2
007

52 U.S. Department of Commerce, International Trade Administration
COUNTRY FACT SHEET: CHINA
U.S. Ambassador to China: Jon HuntsmanChinese Ambassador to the United States: Zhou Wenzhong
PROFILEPopulation: 1.3 billion Next Election Scheduled: 2013Capital: Beijing Head of Government: Wen JiabaoGovernment: Communist State (Premier)
ECONOMY• 2008 Nominal GDP (Current US$ billions): 4,327.4 • 2008 Nominal GDP Per Capita (Current US$): 3,259
2006 2007 2008Real GDP Growth Rate (%) 11.6 13.0 9.0Real GDP Per Capita Growth Rate (%) 11.0 12.4 8.5CPI (%) 1.5 4.8 5.9Unemployment (%)
‡ 9.5 9.2 9.0
• Economic Mix in 2008†: 34% Manufacturing; 40% Services; 11% Agriculture.
FOREIGN MERCHANDISE TRADE (US$ billions) 2006 2007 2008China Exports to World 969.1 1,218.0 1,428.3China Imports from World 791.6 955.8 1,133.4U.S. Exports to China 53.7 62.9 69.7U.S. Imports from China 287.8 321.4 337.8U.S. Trade Balance with China –234.1 –258.5 –268.0
• Rank of China as U.S. Export Market in 2008: 3rd Largest (5.4% of U.S. exports).• Rank of China as Source of U.S. Imports in 2008: 2nd Largest (16.1% of U.S. imports).• Principal U.S. Exports to China in 2008: Electrical Machinery (16%); Machinery (14%); Grain,
Seed, Fruit (10%); Aircraft, Spacecraft (7%); Plastics (5%).• Principal U.S. Imports from China in 2008: Electrical Machinery (24%); Machinery (19%); Toys,
Sports Equipment (8%); Furniture, Bedding (6%); Footwear (4%).
FOREIGN DIRECT INVESTMENT (US$ billions) 2006 2007 2008U.S. FDI in China 26.5 28.6 45.7FDI into U.S. from China 0.8 0.9 1.2• Principal Suppliers of Foreign Investment to China: Hong Kong, Taiwan, British Virgin Islands,
Japan, South Korea, European Union, United States.
DOING BUSINESS RANKING• World Bank Doing Business in 2010 Rank: 89 of 183 (86 in 2009).
COMMERCIAL OFFICER INFORMATIONSenior Commercial Officer: William ZaritCommerce Desk Officer: Nicole Melcher (202) 482-2515

53 Top U.S. Export Markets 2009
U.S
. Tra
de in
Goo
ds w
ith
Ch
ina
U.S
. Exp
orts
U.S
. Im
por
ts
050100
150
200
250
300
350
400
1990
1992
1994
1996
1998
2000
2002
2004
2006
2008
Billio
ns of
dolla
rs
Ch
ina'
s Im
por
ts R
elat
ive
to G
DP
1.9
2.2
2.7
3.4
4.4
0
0.51
1.52
2.53
3.54
4.55
2004
2005
2006
2007
2008
Trilli
ons o
f doll
ars
GD
PTo
tal i
mp
orts
Imp
orts
from
the
Un
ited
Sta
tes
Trillions of dollars
Billions of dollars Percent
U.S
. Mar
ket S
har
e of
Lead
ing
U.S
. Exp
orts
to C
hin
a
051015202530354045
Soyb
ean
sIn
tegr
ated
circ
uit
sC
ivili
an
airc
raft
Ferr
ous
was
te, s
crap
C
opp
er w
aste
,sc
rap
1201
85
42
8802
7204
74
04
HS
Com
mod
ity
Perc
ent
0 2
4 6
8
Soyb
ean
s (+
76%
)
Inte
grat
ed c
ircu
its
(0%
)
Civ
ilian
air
craf
t (-2
5%)
Ferr
ous
was
te, s
crap
(-2
%)
Cop
per
was
te, s
crap
(-2
.5)
Alu
min
um
was
te, s
crap
(+9
%)
Cot
ton
(+1
1%)
Pap
er w
aste
, scr
ap (
+8%
)
Ele
c. a
pp
ar. f
or te
lep
hon
es (
+31%
)
Pas
sen
ger
veh
icle
s (+
31%
)
1201 8542 8800 7204 7404 7602 5201 4707 8517 8703
Bill
ion
s of
dol
lars
HS Commodity
Lead
ing
U.S
. Exp
orts
to C
hin
a in
200
8an
d C
han
ge fr
om 2
007

54 U.S. Department of Commerce, International Trade Administration
COUNTRY FACT SHEET: COLOMBIA
U.S. Ambassador to Colombia: William R. BrownfieldColombian Ambassador to the United States: Carolina Barco
PROFILEPopulation: 48.3 million Next Election Scheduled: 2010Capital: Santa Fe de Bogotá Head of Government: Alvaro UribeGovernment: Constitutional Democracy (President)
ECONOMY• 2008 Nominal GDP (Current US$ billions): 240.8• 2008 Nominal GDP Per Capita (Current US$): 4,989
2006 2007 2008Real GDP Growth Rate (%) 6.9 7.5 2.5Real GDP Per Capita Growth Rate (%) 5.3 5.9 0.9CPI (%) 4.3 5.5 7.0Unemployment (%)
‡ 12.0 11.2 11.3‡•
• Economic Mix in 2008†: 17% Manufacturing; 57% Services; 9% Agriculture.
FOREIGN MERCHANDISE TRADE (US$ billions) 2006 2007 2008Colombia Exports to World 23.7 29.1 37.1Colombia Imports from World 25.5 32.6 39.1U.S. Exports to Colombia 6.7 8.6 11.4U.S. Imports from Colombia 9.3 9.4 13.1U.S. Trade Balance with Colombia –2.6 –0.8 –1.7
• Rank of Colombia as U.S. Export Market in 2008: 26th Largest (0.9% of U.S. exports).• Rank of Colombia as Source of U.S. Imports in 2008: 29th Largest (0.6% of U.S. imports).• Principal U.S. Exports to Colombia in 2008: Machinery (23%); Mineral Fuel, Oil (8%); Organic
Chemicals (8%); Cereals (8%); Electrical Machinery (8%).• Principal U.S. Imports from Colombia in 2008: Mineral Fuel, Oil (64%); Spices, Coffee, Tea (6%);
Precious Stones, Metals (6%); Live Trees, Plants (4%); Fruits, Nuts (2%); Woven Apparel (2%).
FOREIGN DIRECT INVESTMENT (US$ billions) 2006 2007 2008U.S. FDI in Colombia 3.8 4.5 6.3FDI into U.S. from Colombia (D) (D) 0.3• Principal Suppliers of Foreign Investment to Colombia: United States, Spain, Anguilla, Panama.
DOING BUSINESS RANKING• World Bank Doing Business in 2010 Rank: 37 of 183 (49 in 2009).
COMMERCIAL OFFICER INFORMATIONSenior Commercial Officer: Margaret Hanson-MuseCommerce Desk Officer: Julie Anglin (202) 482-0428

55 Top U.S. Export Markets 2009
U.S
. Tra
de in
Goo
ds w
ith
Col
ombi
a
U.S
. Exp
orts
U.S
. Im
por
ts
02468101214
1990
1992
1994
1996
1998
2000
2002
2004
2006
2008
Billio
ns of
dolla
rs
Col
ombi
a's
Imp
orts
Rel
ativ
e to
GD
P
114
145
162
208
241
050100
150
200
250
300
2004
2005
2006
2007
2008
Billio
ns of
dolla
rs
GD
PTo
tal i
mp
orts
Imp
orts
from
the
Un
ited
Sta
tes
Billions of dollars
Billions of dollars
HS Commodity2903 3901 2901 8517 8429 1001 8471 8431 1005 2710
Lead
ing
U.S
. Exp
orts
to C
olom
bia
in 2
008
and
Ch
ange
from
200
70
0.2
0.4
0.6
0.8
11.
2
Re�
ned
pet
role
um
(+3
16%
)
Cor
n (
+21)
Part
s fo
r lif
tin
g m
ach
ines
(+1
9%)
AD
P m
ach
ines
(+1
9%)
Wh
eat,
mes
lin (
+58%
)
Bu
lldoz
ers,
gra
der
s (+
83%
)
Ele
c. a
pp
ar. f
or te
lep
hon
es (
+61%
)
Acy
clic
hyd
roca
rbon
s (+
17%
)
Eth
ylen
e, p
rim
ary
form
(+1
2%)
Hal
ogen
ated
hyd
roca
rbon
s (+
12%
)
2710
1005
8431
8471
1001
8429
8517
2901
3901
2903
HS
Com
mod
ity
Bill
ion
s of
dol
lars
Percent
U.S
. Mar
ket S
har
e of
Lead
ing
U.S
. Exp
orts
to C
olom
bia
0102030405060708090
Re�
ned
pet
role
um
Cor
nPa
rts
for
lifti
ng
mac
hin
es
AD
Pm
ach
ines
Wh
eat,
mes
lin
2710
10
05
8431
84
71
1001
H
S C
omm
odit
y
Perc
ent

56 U.S. Department of Commerce, International Trade Administration
COUNTRY FACT SHEET: COSTA RICA
U.S. Ambassador to Costa Rica: Anne Slaughter AndrewCosta Rican Ambassador to the United States: Luis Diego Escalante
PROFILEPopulation: 4.5 million* Next Election Scheduled: February 7, 2010Capital: San José Head of Government: Oscar AriasGovernment: Democratic Republic (President)
ECONOMY• 2008 Nominal GDP (Current US$ billions): 29.7 • 2008 Nominal GDP Per Capita (Current US$): 6,544*
2006 2007 2008
Real GDP Growth Rate (%) 8.8 7.8 2.6Real GDP Per Capita Growth Rate (%) 6.6 5.6 0.6*CPI (%) 11.5 9.4 13.4 Unemployment (%)
†† 6.0 4.6 4.9
• Economic Mix in 2007†: 21% Manufacturing; 63% Services; 9% Agriculture.
FOREIGN MERCHANDISE TRADE (US$ billions) 2006 2007 2008Costa Rica Exports to World 8.5 9.6 9.7Costa Rica Imports from World 12.7 14.1 15.3U.S. Exports to Costa Rica 4.1 4.6 5.7U.S. Imports from Costa Rica 3.8 3.9 3.9U.S. Trade Balance with Costa Rica 0.3 0.6 1.7
• Rank of Costa Rica as U.S. Export Market in 2008: 37th Largest (0.44% of U.S. exports).• Rank of Costa Rica as Source of U.S. Imports in 2008: 53rd Largest (0.19% of U.S. imports).• Principal U.S. Exports to Costa Rica in 2008: Electrical Machinery (30%); Machinery (11%);
Mineral Fuel, Oil (8%); Plastics (7%); Cereals (6%).• Principal U.S. Imports from Costa Rica in 2008: Optical, Medical Instruments (20%); Edible Fruit,
Nuts (18%); Machinery (11%); Electrical Machinery (11%).
FOREIGN DIRECT INVESTMENT (US$ billions) 2006 2007 2008U.S. FDI in Costa Rica 2.1 2.3 2.5FDI into U.S. from Costa Rica –0.1 –0.1 0.0• Principal Suppliers of Foreign Investment to Costa Rica: United States, Netherlands, Canada,
Mexico, Germany, Spain, Colombia.
DOING BUSINESS RANKING• World Bank Doing Business in 2010 Rank: 121 of 183 (121 in 2009).
COMMERCIAL OFFICER INFORMATIONSenior Commercial Officer: Bryan SmithCommerce Desk Officer: Mark Siegelman (202) 482-0704
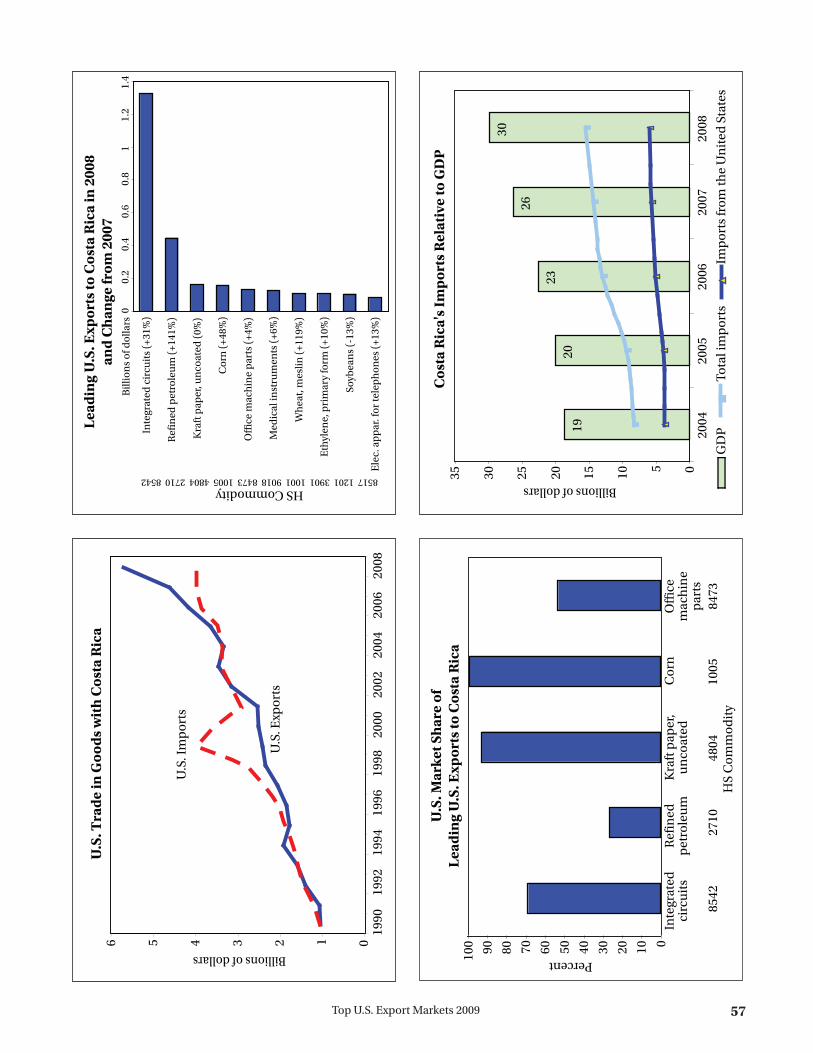
57 Top U.S. Export Markets 2009
U.S
. Tra
de in
Goo
ds w
ith
Cos
ta R
ica
U.S
. Exp
orts
U.S
. Im
por
ts
0123456
1990
1992
1994
1996
1998
2000
2002
2004
2006
2008
Billio
ns of
dolla
rs
Cos
ta R
ica'
s Im
por
ts R
elat
ive
to G
DP
1920
23
26
30
05101520253035
2004
2005
2006
2007
2008
Billio
ns of
dolla
rs
GD
PTo
tal i
mp
orts
Imp
orts
from
the
Un
ited
Sta
tes
Billions of dollars
Billions of dollars Percent
U.S
. Mar
ket S
har
e of
Lead
ing
U.S
. Exp
orts
to C
osta
Ric
a
0102030405060708090100
Inte
grat
edci
rcu
its
Re�
ned
pet
role
um
Kra
ft p
aper
,u
nco
ated
Cor
nO
�ce
mac
hin
ep
arts
8542
27
10
4804
10
05
8473
H
S C
omm
odit
y
Perc
ent
HS Commodity8517 1201 3901 1001 9018 8473 1005 4804 2710 8542
Lead
ing
U.S
. Exp
orts
to C
osta
Ric
a in
200
8an
d C
han
ge fr
om 2
007
00.
20.
40.
60.
81
1.2
1.4
Inte
grat
ed c
ircu
its
(+31
%)
Re�
ned
pet
role
um
(+1
41%
)
Kra
ft p
aper
, un
coat
ed (
0%)
Cor
n (
+48%
)
O�
ce m
ach
ine
par
ts (
+4%
)
Med
ical
inst
rum
ents
(+6
%)
Wh
eat,
mes
lin (
+119
%)
Eth
ylen
e, p
rim
ary
form
(+1
0%)
Soyb
ean
s (-
13%
)
Ele
c. a
pp
ar. f
or te
lep
hon
es (
+13%
)
8542
2710
4804
1005
8473
9018
1001
3901
1201
8517
HS
Com
mod
ity
Bill
ion
s of
dol
lars

58 U.S. Department of Commerce, International Trade Administration
COUNTRY FACT SHEET: DOMINICAN REPUBLIC
U.S. Ambassador to the Dominican Republic: Christopher Lambert (Chargé d’Affaires)Dominican Republic Ambassador to the United States: Roberto Saladin
PROFILEPopulation: 8.9 million* Next Election Scheduled: May 2012Capital: Santo Domingo Head of Government: Leonel FernandezGovernment: Representative Democracy (President)
ECONOMY• 2008 Nominal GDP (Current US$ billions): 44.4• 2008 Nominal GDP Per Capita (Current US$): 4,992*
2006 2007 2008Real GDP Growth Rate (%) 10.7 8.5 5.3Real GDP Per Capita Growth Rate (%) 9.1* 6.9* 3.8*CPI (%) 7.6 6.1 10.6Unemployment (%) N/A N/A 15.5§
• Economic Mix in 2007†: 13% Manufacturing; 60% Services; 12% Agriculture.
FOREIGN MERCHANDISE TRADE (US$ billions) 2006 2007 2008Dominican Republic Exports to the World 6.6 7.2 N/ADominican Republic Imports from the World 12.2 13.6 N/AU.S. Exports to the Dominican Republic 5.4 6.1 6.6U.S. Imports from the Dominican Republic 4.5 4.2 4.0U.S. Trade Balance with the Dominican Republic 0.9 1.9 2.6
• Rank of the Dominican Republic as U.S. Export Market in 2008: 33rd Largest (0.5% of U.S. exports).
• Rank of the Dominican Republic as Source of U.S. Imports in 2008: 52nd Largest (0.2% of U.S. imports).
• Principal U.S. Exports to the Dominican Republic in 2008: Electrical Machinery (16%); Mineral Fuel, Oil (10%); Machinery (7%); Cereals (6%); Vehicles (6%).
• Principal U.S. Imports from the Dominican Republic in 2008: Electrical Machinery (15%); Optical, Medical Instruments (13%); Precious Stones, Metals (12%); Knit Apparel (12%); Woven Apparel (9%).
FOREIGN DIRECT INVESTMENT (US$ millions) 2006 2007 2008U.S. FDI in the Dominican Republic 789.0 766.0 960.0FDI into U.S. from the Dominican Republic –105.0 –152.0 –135.0• Principal Suppliers of Foreign Investment to the Dominican Republic: United States, Japan,
European Union, Mexico, Venezuela.
DOING BUSINESS RANKING• World Bank Doing Business in 2010 Rank: 86 of 183 (102 in 2009).
COMMERCIAL OFFICER INFORMATIONSenior Commercial Officer: Robert JonesCommerce Desk Officer: Scott Smith (202) 482-1810

59 Top U.S. Export Markets 2009
U.S
. Tra
de in
Goo
ds w
ith
the
Dom
inic
an R
epu
blic
U.S
. Exp
orts
U.S
. Im
por
ts
01234567
1990
1992
1994
1996
1998
2000
2002
2004
2006
2008
Billio
ns of
dolla
rs
�e
Dom
inic
an R
epu
blic
's Im
por
ts R
elat
ive
to G
DP
22
3435
41
46
05101520253035404550
2004
2005
2006
2007
2008
Billio
ns of
dolla
rs
GD
PTo
tal i
mp
orts
Imp
orts
from
the
Un
ited
Sta
tes
Billions of dollars
Billions of dollars
HS Commodity8517 1001 2304 9018 5205 7113 1005 8703 8536 2710Le
adin
g U
.S. E
xpor
ts to
the
Dom
inic
an R
epu
blic
in 2
008
and
Ch
ange
from
200
70
100
200
300
400
500
600
700
Re�
ned
pet
role
um
(+1
4%)
Ele
c. a
pp
ar. f
or s
wit
chin
g (–
9%)
Pass
enge
r ve
hic
les
(+3%
)
Cor
n (
+34%
)
Jew
elry
w/p
reci
ous
met
als
(+5%
)
Cot
ton
yar
n (
+33%
)
Med
ical
inst
rum
ents
(+6
%)
Soyb
ean
oilc
ake
(+21
%)
Wh
eat,
mes
lin (
+38%
)
Ele
c. a
pp
ar. f
or te
lep
hon
es (
+18%
)
2710
8536
8703
1005
7113
5205
9018
2304
1001
8517
HS
Com
mod
ity
Mill
ion
s of
dol
lars
Percent
U.S
. Mar
ket S
har
e of
Lea
din
g U
.S. E
xpor
ts to
the
Dom
inic
an R
epu
blic
0102030405060708090100
Re�
ned
pet
role
um
Ele
c. a
pp
ar.
for
swit
chin
gPa
ssen
ger
veh
icle
sC
orn
Jew
elry
w/
pre
ciou
sm
etal
s27
10
8536
87
03
1005
71
13
HS
Com
mod
ity
Perc
ent

60 U.S. Department of Commerce, International Trade Administration
COUNTRY FACT SHEET: ECUADOR
U.S. Ambassador to Ecuador: Heather M. HodgesEcuadorian Ambassador to the United States: Luis Gallegos
PROFILEPopulation: 13.9 million* Next Election Scheduled: 2014Capital: Quito Head of Government: Rafael Correa Government: National Assembly (President)
ECONOMY• 2008 Nominal GDP (Current US$ billions): 54.7 • 2008 Nominal GDP Per Capita (Current US$): 3,928*
2006 2007 2008Real GDP Growth Rate (%) 3.9 2.5 6.5Real GDP Per Capita Growth Rate (%) 1.4 1.1 5.0*CPI (%) 3.3 2.3 8.4Unemployment (%)
‡‡ 9.7 9.7 N/A
• Economic Mix in 2007†: 9% Manufacturing; 58% Services; 7% Agriculture.
FOREIGN MERCHANDISE TRADE (US$ billions) 2006 2007 2008Ecuador Exports to World 12.7 14.3 18.5Ecuador Imports from World 12.1 13.5 18.6U.S. Exports to Ecuador 2.7 2.9 3.5U.S. Imports from Ecuador 7.1 6.1 9.0U.S. Trade Balance with Ecuador –4.4 –3.2 –5.5
• Rank of Ecuador as U.S. Export Market in 2008: 46th Largest (0.3% of U.S. exports).• Rank of Ecuador as Source of U.S. Imports in 2008: 35th Largest (0.4% of U.S. imports).• Principal U.S. Exports to Ecuador in 2008: Machinery (24%); Mineral Fuel, Oil (15%); Electrical
Machinery (10%); Plastics (9%); Paper (5%); Vehicles (3%).• Principal U.S. Imports from Ecuador in 2008: Mineral Fuel, Oil (81%); Fish, Seafood, Tuna, Shrimp
(5%); Edible Fruit, Bananas (4%); Cut Flowers, Roses (2%); Prepared Meat, Fish, Tuna, Shrimp (2%); Wood (1%).
FOREIGN DIRECT INVESTMENT (US$ millions) 2006 2007 2008U.S. FDI in Ecuador 904 977 1,276FDI into U.S. from Ecuador 19 12 –2• Principal Suppliers of Foreign Investment to Ecuador: United States, Germany, Colombia, Spain,
United Kingdom, France, Taiwan.
DOING BUSINESS RANKING• World Bank Doing Business in 2010 Rank: 138 of 183 (133 in 2009).
COMMERCIAL OFFICER INFORMATIONSenior Commercial Officer: Eric OlsonCommerce Desk Officer: Matt Gaisford (202) 482-0057

61 Top U.S. Export Markets 2009
U.S
. Tra
de in
Goo
ds w
ith
Ecu
ador
U.S
. Exp
orts
U.S
. Im
por
ts
012345678910
1990
1992
1994
1996
1998
2000
2002
2004
2006
2008
Billio
ns of
dolla
rs
Ecu
ador
's Im
por
ts R
elat
ive
to G
DP
3337
4146
53
0102030405060
2004
2005
2006
2007
2008
Billio
ns of
dolla
rs
GD
PTo
tal i
mp
orts
Imp
orts
from
the
Un
ited
Sta
tes
Billions of dollars
Billions of dollars
HS Commodity8800 8443 8429 2711 8517 4804 8431 8471 3901 2710
Lead
ing
U.S
. Exp
orts
to E
cuad
or in
200
8an
d C
han
ge fr
om 2
007
050
100
150
200
250
300
350
400
450
Re�
ned
pet
role
um
(-2
7%)
Eth
ylen
e, p
rim
ary
form
(+1
8%)
AD
P m
ach
ines
(+3
8%)
Part
s fo
r lif
tin
g m
ach
ines
(+2
6%)
Kra
ft p
aper
, un
coat
ed (
-9%
)
Ele
c. a
pp
ar. f
or te
lep
hon
es (
-57%
)
Pet
role
um
gas
es (
+252
%)
Bu
lldoz
ers,
gra
der
s (+
174%
)
Pri
nti
ng
mac
hin
ery
(+53
%)
Civ
ilian
air
craf
t (+1
42%
)
2710
3901
8471
8431
4804
8517
2711
8429
8443
8800
HS
Com
mod
ity
Mill
ion
s of
dol
lars
Percent
U.S
. Mar
ket S
har
e of
Lead
ing
U.S
. Exp
orts
to E
cuad
or
0102030405060708090
Re�
ned
pet
role
um
E
thyl
ene,
pri
mar
yfo
rm
A
DP
mac
hin
esPa
rts
for
lifti
ng
mac
hin
es
Kra
ft p
aper
,u
nco
ated
2710
39
01
8471
84
31
4804
H
S C
omm
odit
y
Perc
ent

62 U.S. Department of Commerce, International Trade Administration
COUNTRY FACT SHEET: EGYPT
U.S. Ambassador to Egypt: Margaret ScobeyEgyptian Ambassador to the United States: Sameh Shoukry
PROFILEPopulation: 75.2 million* Next Election Scheduled: 2011Capital: Cairo Head of Government: Mohammed Hosni MubarakGovernment: Republic (President)
ECONOMY• 2008 Nominal GDP (Current US$ billions): 162.6• 2008 Nominal GDP Per Capita (Current US$): 2,162*
2006 2007 2008Real GDP Growth Rate (%) 6.8 7.1 7.2Real GDP Per Capita Growth Rate (%) 4.8 3.7 4.9*CPI (%) 4.2 11.0 11.7Unemployment (%)
† 10.6 8.9 8.4
• Economic Mix in 2008†: 17% Manufacturing; 50% Services; 14% Agriculture.
FOREIGN MERCHANDISE TRADE (US$ billions) 2006 2007 2008Egypt Exports to World 13.8 16.1 24.0Egypt Imports from World 20.7 26.9 47.5U.S. Exports to Egypt 4.0 5.3 6.0U.S. Imports from Egypt 2.4 2.4 2.4U.S. Trade Balance with Egypt 1.6 2.9 3.6
• Rank of Egypt as U.S. Export Market in 2008: 36th Largest (0.5% of U.S. exports).• Rank of Egypt as Source of U.S. Imports in 2008: 66th Largest (0.1% of U.S. imports).• Principal U.S. Exports to Egypt in 2008: Cereals (21%); Machinery (17%); Mineral Fuel, Oil (8%);
Iron, Steel (7%); Soybeans (6%).• Principal U.S. Imports from Egypt in 2008: Mineral Fuel, Oil (40%); Woven Apparel (18%); Knit
Apparel (13%); Fertilizers (9%); Textile Floor Coverings (5%).
FOREIGN DIRECT INVESTMENT (US$ billions) 2006 2007 2008U.S. FDI in Egypt 6.5 7.5 8.8FDI into U.S. from Egypt –0.118 –0.176 –0.277• Principal Suppliers of Foreign Investment to Egypt: N/A.
DOING BUSINESS RANKING• World Bank Doing Business in 2010 Rank: 106 of 183 (118 in 2009).
COMMERCIAL OFFICER INFORMATIONSenior Commercial Officer: Margaret (Peggy) KeshishianCommerce Desk Officer: Nate Mason (202) 482-3752

63 Top U.S. Export Markets 2009
U.S
. Tra
de in
Goo
ds w
ith
Egy
pt
U.S
. Exp
orts
U.S
. Im
por
ts
01234567
1990
1992
1994
1996
1998
2000
2002
2004
2006
2008
Billio
ns of
dolla
rs
Egy
pt's
Imp
orts
Rel
ativ
e to
GD
P
7990
107
130
162
020406080100
120
140
160
180
2004
2005
2006
2007
2008
Billio
ns of
dolla
rs
GD
PTo
tal i
mp
orts
Imp
orts
from
the
Un
ited
Sta
tes
Billions of dollars
Billions of dollars Percent
U.S
. Mar
ket S
har
e of
Lea
din
g U
.S. E
xpor
ts to
Egy
pt
010203040506070
Wh
eat,
mes
linC
orn
Ferr
ous
was
te,
scra
p
Soyb
ean
sPa
rts
for
lifti
ng
mac
hin
es
1001
10
05
7204
12
01
8431
H
S C
omm
odit
y
Perc
ent
HS Commodity3901 8710 2707 8800 2701 8431 1201 7204 1005 1001
Lead
ing
U.S
. Exp
orts
to E
gypt
in 2
008
and
Ch
ange
from
200
70
100
200
300
400
500
600
700
Wh
eat,
mes
lin (
-13%
)
Cor
n (
-1%
)
Ferr
ous
was
te, s
crap
(+1
77%
)
Soyb
ean
s (+
177%
)
Part
s fo
r lif
tin
g m
ach
ines
(-1
%)
Coa
l (+1
06%
)
Civ
ilian
air
craf
t (-
34%
)
Oils
from
coa
l tar
(+4
8%)
Arm
ored
war
veh
icle
s (-
47%
)
Vin
yl c
hlo
rid
e p
olym
ers
(+51
%)
1001
1005
7204
1201
8431
2701
8800
2707
8710
3904
HS
Com
mod
ity
Mill
ion
s of
dol
lars

64 U.S. Department of Commerce, International Trade Administration
COUNTRY FACT SHEET: THE EUROPEAN UNION (EU-27)
U.S. Ambassador to the European Union: William E. KennardEuropean Union Ambassador to the United States: John Bruton
PROFILEPopulation: 494 million‡ Next Election Scheduled: European Capital: Brussels Parliament, 2014Government: Customs and Monetary Union Head of Government: José Manuel Barroso (President, European Commission)
ECONOMY• 2008 Nominal GDP (Current US$ billions): 18,388• 2008 Nominal GDP Per Capita (Current US$): 36,748
2006 2007 2008Real GDP Growth Rate (%) 3.4 3.1 1.0Real GDP Per Capita Growth Rate (%) 2.7 2.4 0.4CPI (%) 2.3 2.4 3.7Unemployment (%) 8.2 7.1 7.0
• Economic Mix in 2007‡: 20% Manufacturing; 72% Services; 2% Agriculture.
FOREIGN MERCHANDISE TRADE (US$ billions) 2006 2007 2008European Union Exports to World 1,457.9 1,703.6 1,928.4European Union Imports from World 1,698.7 1,967.3 2,306.4U.S. Exports to the European Union 212.7 244.2 271.8U.S. Imports from the European Union 332.1 354.4 367.6U.S. Trade Balance with the European Union –119.4 –110.2 –95.8
• Rank of European Union as U.S. Export Market in 2008: Largest customs union (21.1% of U.S. exports).
• Rank of European Union as Source of U.S. Imports in 2008: Largest customs union (17.5% of U.S. imports).
• Principal U.S. Exports to the European Union in 2008: Machinery (18%); Aircraft, Spacecraft (11%); Optical, Medical Instruments (9%); Electrical Machinery (8%); Pharmaceutical Products (7%).
• Principal U.S. Imports from the European Union in 2008: Non-Electrical Machinery (17%); Vehicles (11%); Pharmaceutical Products (9%); Mineral Fuel, Oil (9%); Organic Chemicals (8%).
FOREIGN DIRECT INVESTMENT (US$ billions) 2006 2007 2008U.S. FDI in the European Union 1,257.7 1,504.4 1,630.8FDI into U.S. from the European Union 1,165.6 1,333.0 1,434.1• Principal Suppliers of Foreign Investment to the European Union: United States, Switzerland,
Japan, Canada, Singapore.
DOING BUSINESS RANKING• World Bank Doing Business in 2010 Rank: N/A.
COMMERCIAL OFFICER INFORMATIONActing Senior Commercial Officer: Val HustonCommerce Desk Officer: David De Falco (202) 482-2178

65 Top U.S. Export Markets 2009
U.S
. Tra
de in
Goo
ds w
ith
the
Eu
rop
ean
Un
ion
U.S
. Exp
orts
U.S
. Im
por
ts
050100
150
200
250
300
350
400
1990
1992
1994
1996
1998
2000
2002
2004
2006
2008
Billio
ns of
dolla
rs
�e
Eu
rop
ean
Un
ion
's Im
por
ts R
elat
ive
to G
DP
1314
15
1718
02468101214161820
2004
2005
2006
2007
2008
Trilli
ons o
f doll
ars
GD
PTo
tal i
mp
orts
Imp
orts
from
the
Un
ited
Sta
tes
Trillions of dollars
Billions of dollars
HS Commodity9021 7108 8471 8517 3002 9018 2710 3004 8703 8800
Lead
ing
U.S
. Exp
orts
to th
e E
uro
pea
n U
nio
n in
200
8an
d C
han
ge fr
om 2
007
05
1015
2025
30
Civ
ilian
air
craf
t (+
4%)
Pass
enge
r ve
hic
les
(+11
%)
Ph
arm
aceu
tica
ls in
dos
ages
(+2
3%)
Re�
ned
pet
role
um
(+2
04%
)
Med
ical
inst
rum
ents
(+1
7%)
Blo
od, a
nti
sera
, vac
cin
es (
+27%
)
Ele
c. a
pp
ar. f
or te
lep
hon
es (
+8%
)
AD
P m
ach
ines
(-5
%)
Gol
d (
+23%
)
Ort
hop
edic
dev
ices
(+1
5%)
8800
8703
3004
2710
9018
3002
8517
8471
7108
9021
HS
Com
mod
ity
Bill
ion
s of
dol
lars
Percent
U.S
. Mar
ket S
har
e of
Lead
ing
U.S
. Exp
orts
to th
e E
uro
pea
n U
nio
n
0102030405060708090
Civ
ilian
airc
raft
Pa
ssen
ger
veh
icle
s P
har
mac
eu-
tica
ls in
dos
ages
Re�
ned
pet
role
um
Med
ical
inst
rum
ents
8802
8703
3004
2710
9018
HS
Com
mod
ity
Perc
ent

66 U.S. Department of Commerce, International Trade Administration
COUNTRY FACT SHEET: FINLAND
U.S. Ambassador to Finland: Bruce OreckFinnish Ambassador to the United States: Pekka Lintu
PROFILEPopulation: 5.3 million Next Election Scheduled: March 2011Capital: Helsinki Head of Government: Matti VanhanenGovernment: Constitutional Republic (Prime Minister)
ECONOMY• 2008 Nominal GDP (Current US$ billions): 271.9 • 2008 Nominal GDP Per Capita (Current US$): 51,588
2006 2007 2008Real GDP Growth Rate (%) 4.9 4.2 1.0Real GDP Per Capita Growth Rate (%) 4.5 4.4 0.8CPI (%) 1.3 1.6 3.9Unemployment (%) 7.7 6.8 6.4
• Economic Mix in 2006†: 24% Manufacturing; 65% Services; 3% Agriculture.
FOREIGN MERCHANDISE TRADE (US$ billions) 2006 2007 2008Finland Exports to World 77.3 90.1 96.8Finland Imports from World 69.5 81.8 92.1U.S. Exports to Finland 2.6 3.1 3.8U.S. Imports from Finland 5.0 5.3 5.9U.S. Trade Balance with Finland –2.3 –2.1 –2.1
• Rank of Finland as U.S. Export Market in 2008: 45th Largest (0.3% of U.S. exports).• Rank of Finland as Source of U.S. Imports in 2008: 44th Largest (0.3% of U.S. imports).• Principal U.S. Exports to Finland in 2008: Vehicles, Not Railway (42%); Machinery (12%);
Electrical Machinery (8%); Optical, Medical Instruments (5%); Special Other (5%).• Principal U.S. Imports from Finland in 2008: Mineral Fuel, Oil (23%); Paper, Paperboard (17%);
Machinery (13%); Electrical Machinery (8%); Optical, Medical Instruments (6%).
FOREIGN DIRECT INVESTMENT (US$ billions) 2006 2007 2008U.S. FDI in Finland 2.1 2.2 2.3FDI into U.S. from Finland 7.1 5.4 12.5• Principal Suppliers of Foreign Investment to Finland: Sweden, Netherlands, Denmark, United
Kingdom, Germany.
DOING BUSINESS RANKING• World Bank Doing Business in 2010 Rank: 16 of 183 (14 in 2009).
COMMERCIAL OFFICER INFORMATIONSenior Commercial Officer: Nick KuchovaCommerce Desk Officer: Jennifer Derstine (202) 482-4414

67 Top U.S. Export Markets 2009
U.S
. Tra
de in
Goo
ds w
ith
Fin
lan
d
U.S
. Exp
orts
U.S
. Im
por
ts
01234567 1990
1992
1994
1996
1998
2000
2002
2004
2006
2008
Billio
ns of
dolla
rs
Billions of dollars
Fin
lan
d's
Imp
orts
Rel
ativ
e to
GD
P
189
196
210
246
274
050100
150
200
250
300
2004
2005
2006
2007
2008
Billio
ns of
dolla
rs
GD
PTo
tal i
mp
orts
Imp
orts
from
the
Un
ited
Sta
tes
Billions of dollars
Lead
ing
U.S
. Exp
orts
to F
inla
nd
in 2
008
and
Ch
ange
from
200
70
0.2
0.4
0.6
0.8
11.
21.
41.
6
Pass
enge
r ve
hic
les
(+52
%)
Civ
ilian
air
craf
t (+7
4%)
Ferr
ous
was
te, s
crap
(-1
4%)
AD
P m
ach
ines
(-1
5%)
Coa
l (+2
05%
)
Kao
linic
cla
ys (
+8%
)
Ele
c. a
pp
ar. f
or te
lep
hon
es (
-23%
)
Vit
amin
s (+
57%
)
Med
ical
inst
rum
ents
(+1
%)
O�
ce m
ach
ine
par
ts (
-18%
)
8703
8800
7204
8471
2701
2507
8517
2936
9018
8473
HS
Com
mod
ity
Bill
ion
s of
dol
lars
HS Commodity8473 9018 2936 8517 2507 2701 8471 7204 8800 8703
U.S
. Mar
ket S
har
e of
Lea
din
g U
.S. E
xpor
ts to
Fin
lan
d
024681012141618
Pass
enge
rve
hic
les
Civ
ilian
ai
rcra
ftFe
rrou
s w
aste
, scr
apA
DP
m
ach
ines
Coa
l
870
388
0272
0484
7127
01H
S C
omm
odit
y
Perc
ent
Percent

68 U.S. Department of Commerce, International Trade Administration
COUNTRY FACT SHEET: FRANCE
U.S. Ambassador to France: Charles H. RivkinFrench Ambassador to the United States: Pierre Vimont
PROFILEPopulation: 62.3 million Next Election Scheduled: May 2012Capital: Paris Head of Government: Nicolas SarkozyGovernment: Federal Republic (President)
ECONOMY• 2008 Nominal GDP (Current US$ billions): 2,867.0 • 2008 Nominal GDP Per Capita (Current US$): 46,037
2006 2007 2008Real GDP Growth Rate (%) 2.4 2.3 0.3Real GDP Per Capita Growth Rate (%) 1.6 1.7 0.2CPI (%) 1.9 1.6 3.2Unemployment (%) 9.3 8.3 7.9
• Economic Mix in 2007†: 12% Manufacturing; 77% Services; 2% Agriculture.
FOREIGN MERCHANDISE TRADE (US$ billions) 2006 2007 2008France Exports to World 495.9 552.3 606.8France Imports from World 542.0 620.3 705.5U.S. Exports to France 23.5 26.7 28.8U.S. Imports from France 37.0 41.6 44.0U.S. Trade Balance with France –13.5 –14.9 –15.2
• Rank of France as U.S. Export Market in 2008: 11th Largest (2.2% of U.S. exports).• Rank of France as Source of U.S. Imports in 2008: 10th Largest (2.1% of U.S. imports).• Principal U.S. Exports to France in 2008: Aircraft, Spacecraft (25%); Machinery (12%); Optical,
Medical Instruments (8%); Electrical Machinery (7%); Organic Chemicals (6%).• Principal U.S. Imports from France in 2008: Machinery (17%); Pharmaceuticals (12%); Aircraft,
Spacecraft (11%); Mineral Fuels (8%); Beverages (7%).
FOREIGN DIRECT INVESTMENT (US$ billions) 2006 2007 2008U.S. FDI in France 63.0 70.1 75.0FDI into U.S. from France 147.8 160.1 163.4• Principal Suppliers of Foreign Investment to France: United States, Germany, United Kingdom.
DOING BUSINESS RANKING• World Bank Doing Business in 2010 Rank: 31 of 183 (31 in 2009).
COMMERCIAL OFFICER INFORMATIONSenior Commercial Officer: Daniel HarrisCommerce Desk Officer: Jen Levine (202) 482-0431

69 Top U.S. Export Markets 2009
Percent
U.S
. Mar
ket S
har
e of
Lead
ing
U.S
. Exp
orts
to F
ran
ce
0102030405060
Civ
ilian
airc
raft
P
har
mac
eu-
tica
ls in
dos
ages
Pain
tin
gs,
dra
win
gsH
orm
ones
,d
eriv
ativ
esR
e�n
edp
etro
leu
m
880
2 3
004
970
1 2
937
271
0H
S C
omm
odit
y
Perc
ent
U.S
. Tra
de in
Goo
ds w
ith
Fra
nce
U.S
. Exp
orts
U.S
. Im
por
ts
05101520253035404550
1990
1992
1994
1996
1998
2000
2002
2004
2006
2008
Billio
ns of
dolla
rs
Fran
ce's
Imp
orts
Rel
ativ
e to
GD
P
2.06
2.15
2.27
2.59
2.87
0
0.51
1.52
2.53
3.5
2004
2005
2006
2007
2008
Trilli
ons o
f doll
ars
GD
PTo
tal i
mp
orts
Imp
orts
from
the
Un
ited
Sta
tes
Trillions of dollars
Billions of dollars
HS Commodity2701 8111 3822 8471 9018 2710 2937 9701 3004 8800
Lead
ing
U.S
. Exp
orts
to F
ran
ce in
200
8an
d C
han
ge fr
om 2
007
01
23
45
67
8
Civ
ilian
air
craf
t (-5
%)
Ph
arm
aceu
tica
ls in
dos
ages
(+8
%)
Pain
tin
gs, d
raw
ings
(+1
86%
)
Hor
mon
es, d
eriv
ativ
es (
-14%
)
Re�
ned
pet
role
um
(+2
29%
)
Med
ical
inst
rum
ents
(+2
0%)
AD
P m
ach
ines
(-1
2%)
Dia
gnos
tic
reag
ents
(+4
4%)
Gas
turb
ines
(+8
5%)
Coa
l (+7
9%)
8800
3004
9701
2937
2710
9018
8471
3822
8411
2701
HS
Com
mod
ity
Bill
ion
s of
dol
lars

70 U.S. Department of Commerce, International Trade Administration
COUNTRY FACT SHEET: GERMANY
U.S. Ambassador to Germany: Philip D. MurphyGerman Ambassador to the United States: Klaus Scharioth
PROFILEPopulation: 82.1 million Next Election Scheduled: September 2013Capital: Berlin Head of Government: Angela MerkelGovernment: Federal Republic (Chancellor)
ECONOMY• 2008 Nominal GDP (Current US$ billion): 3,673.1• 2008 Nominal GDP Per Capita (Current US$): 44,729
2006 2007 2008 Real GDP Growth Rate (%) 3.2 2.5 1.2 Real GDP Per Capita Growth Rate (%) 3.1 2.6 1.4 CPI (%) 1.8 2.3 2.8 Unemployment (%) 9.8 8.4 7.4
• Economic Mix in 2006†: 23% Manufacturing; 70% Services; 1% Agriculture.
FOREIGN MERCHANDISE TRADE (US$ billions) 2006 2007 2008 Germany Exports to World 1,109.2 1,322.5 1,464.2 Germany Imports from World 907.7 1,056.1 1,206.1 U.S. Exports to Germany 41.2 49.4 54.5 U.S. Imports from Germany 89.1 94.2 97.5 U.S. Trade Balance with Germany –47.9 –44.8 –43.0
• Rank of Germany as U.S. Export Market in 2008: 5th Largest (4.2% of U.S. exports).• Rank of Germany as Source of U.S. Imports in 2008: 5th Largest (4.6% of U.S. imports).• Principal U.S. Exports to Germany in 2008: Vehicles (18%); Machinery (12%); Aircraft, Spacecraft
(10%); Optical, Medical Instruments (10%); Electrical Machinery (10%).• Principal U.S. Imports from Germany in 2008: Vehicles (24%); Machinery (22%); Optical, Medical
Instruments (8%); Electrical Machinery (7%); Pharmaceuticals (7%).
FOREIGN DIRECT INVESTMENT (US$ billions) 2006 2007 2008U.S. FDI in Germany 93.6 100.8 110.7FDI into U.S. from Germany 206.0 214.5 211.5• Principal Suppliers of Foreign Investment to Germany: United States, Netherlands, Switzerland.
DOING BUSINESS RANKING• World Bank Doing Business in 2010 Rank: 25 of 183 (27 in 2009).
COMMERCIAL OFFICER INFORMATIONSenior Commercial Officer: George RuffnerCommerce Desk Officer: Alexander Gorshenin (202) 482-2434

71 Top U.S. Export Markets 2009
U.S
. Tra
de in
Goo
ds w
ith
Ger
man
y U.S
. Exp
orts
U.S
. Im
por
ts
020406080100
120
1990
1992
1994
1996
1998
2000
2002
2004
2006
2008
Billio
ns of
dolla
rs
Ger
man
y's
Imp
orts
Rel
ativ
e to
GD
P
2.7
2.8
2.9
3.3
3.7
00.511.522.533.54
2004
2005
2006
2007
2008
Trilli
ons o
f doll
ars
GD
PTo
tal i
mp
orts
Imp
orts
from
the
Un
ited
Sta
tes
Trillions of dollars
Billions of dollars
HS Commodity7112 8708 8471 2937 9027 8542 9018 3002 8800 8703
Lead
ing
U.S
. Exp
orts
to G
erm
any
in 2
008
and
Ch
ange
from
200
70
12
34
56
78
9
Pass
enge
r ve
hic
les
(+19
%)
Civ
ilian
air
craf
t (+1
0%)
Blo
od, a
nti
sera
, vac
cin
es (
+41%
)
Med
ical
inst
rum
ents
(+6
%)
Inte
grat
ed c
ircu
its
(-16
%)
Inst
. for
ph
ysic
al a
nal
ysis
(+7
%)
Hor
mon
es, d
eriv
ativ
es (
+5%
)
AD
P m
ach
ines
(-1
8%)
Mot
or v
ehic
le p
arts
(-1
%)
Pre
ciou
s m
etal
s sc
rap
(+3
%)
8703
8800
3002
9018
8542
9027
2937
8471
8708
7112
HS
Com
mod
ity
Bill
ion
s of
dol
lars
Percent
U.S
. Mar
ket S
har
e of
Lead
ing
U.S
. Exp
orts
to G
erm
any
0510152025
Pass
enge
rve
hic
les
Civ
ilian
airc
raft
Blo
od,
anti
sera
,va
ccin
es
Med
ical
inst
rum
ents
Inte
grat
edci
rcu
its
870
3 8
802
300
2 9
018
854
2H
S C
omm
odit
y
Perc
ent

72 U.S. Department of Commerce, International Trade Administration
COUNTRY FACT SHEET: GUATEMALA
U.S. Ambassador to Guatemala: Stephen G. McFarlandGuatemalan Ambassador to the United States: Francisco Villagrán de León
PROFILEPopulation: 13.7 million* Next Election Scheduled: Sept 2011Capital: Guatemala City Head of Government: Álvaro ColomGovernment: Democratic Republic (President)
ECONOMY• 2008 Nominal GDP (Current US$ billions): 39.0 • 2008 Nominal GDP Per Capita (Current US$): 2,850*
2006 2007 2008Real GDP Growth Rate (%) 5.4 6.3 4.0Real GDP Per Capita Growth Rate (%)* 2.7 3.7 1.5CPI (%) 6.6 6.8 11.4Unemployment (%) N/A N/A N/A
• Economic Mix in 2007†: 18% Manufacturing; 61% Services; 11% Agriculture.
FOREIGN MERCHANDISE TRADE (US$ billions) 2006 2007 2008Guatemala Exports to World 6.0 6.9 7.7Guatemala Imports from World 11.9 13.6 14.5U.S. Exports to Guatemala 3.5 4.1 4.7U.S. Imports from Guatemala 3.1 3.0 3.5U.S. Trade Balance with Guatemala 0.4 1.0 1.3
• Rank of Guatemala as U.S. Export Market in 2008: 42nd Largest (0.37% of U.S. exports).• Rank of Guatemala among Importers to the U.S. in 2008: 56th Largest (0.17% of U.S. imports).• Principal U.S. Exports to Guatemala in 2008: Mineral Fuel, Oil (22%); Machinery (10%); Cereals
(7%); Electrical Machinery (6%); Plastics (6%); Cotton Yarn, Fabric (4%).• Principal U.S. Imports from Guatemala in 2008: Knit Apparel (30%); Edible Fruit, Nuts (15%);
Mineral Fuel, Oil (11%); Coffee (11%); Woven Apparel (10%).
FOREIGN DIRECT INVESTMENT (US$ billions) 2006 2007 2008U.S. FDI in Guatemala 0.4 0.6 0.9FDI into U.S. from Guatemala N/A N/A –0.04• Principal Suppliers of Foreign Investment to Guatemala: United States, Spain, Mexico, Central
America.
DOING BUSINESS RANKING• World Bank Doing Business in 2010 Rank: 110 of 183 (117 in 2009).
COMMERCIAL OFFICER INFORMATIONSenior Commercial Officer: Patricia WagnerCommerce Desk Officer: Mark Siegelman (202) 482-0704

73 Top U.S. Export Markets 2009
U.S
. Tra
de in
Goo
ds w
ith
Gu
atem
ala
U.S
. Exp
orts
U.S
. Im
por
ts
00.511.522.533.544.55
1990
1992
1994
1996
1998
2000
2002
2004
2006
2008
Billio
ns of
dolla
rs
Gu
atem
ala'
s Im
por
ts R
elat
ive
to G
DP
2427
30
34
39
051015202530354045
2004
2005
2006
2007
2008
Billio
ns of
dolla
rs GD
PTo
tal i
mp
orts
Imp
orts
from
the
Un
ited
Sta
tes
Billions of dollars
Billions of dollars Percent
U.S
. Mar
ket S
har
e of
Lead
ing
U.S
. Exp
orts
to G
uat
emal
a
0102030405060708090100
Re�
ned
pet
role
um
Wh
eat,
mes
linC
orn
Eth
ylen
e,p
rim
ary
form
So
ybea
noi
lcak
e
271
0 1
001
100
5 3
901
230
4H
S C
omm
odit
y
Perc
ent
HS Commodity2401 8703 8471 4804 8517 2304 3901 1005 1001 2710
Lead
ing
U.S
. Exp
orts
to G
uat
emal
a in
200
8an
d C
han
ge fr
om 2
007
00.
20.
40.
60.
81
1.2
Re�
ned
pet
role
um
(+5
8%)
Wh
eat,
mes
lin (
+26%
)
Cor
n (
+33%
)
Eth
ylen
e, p
rim
ary
form
(-1
%)
Soyb
ean
oilc
ake
(+42
%)
Ele
c. a
pp
ar. f
or te
lep
hon
es (
+30%
)
Kra
ft p
aper
, un
coat
ed (
+20%
)
AD
P m
ach
ines
(-6
%)
Pass
enge
r ve
hic
les
(+32
%)
Un
man
ufa
ctu
red
tob
acco
(+7
7%)
2710
1001
1005
3901
2304
8517
4804
8471
8703
2401
HS
Com
mod
ity
Bill
ion
s of
dol
lars
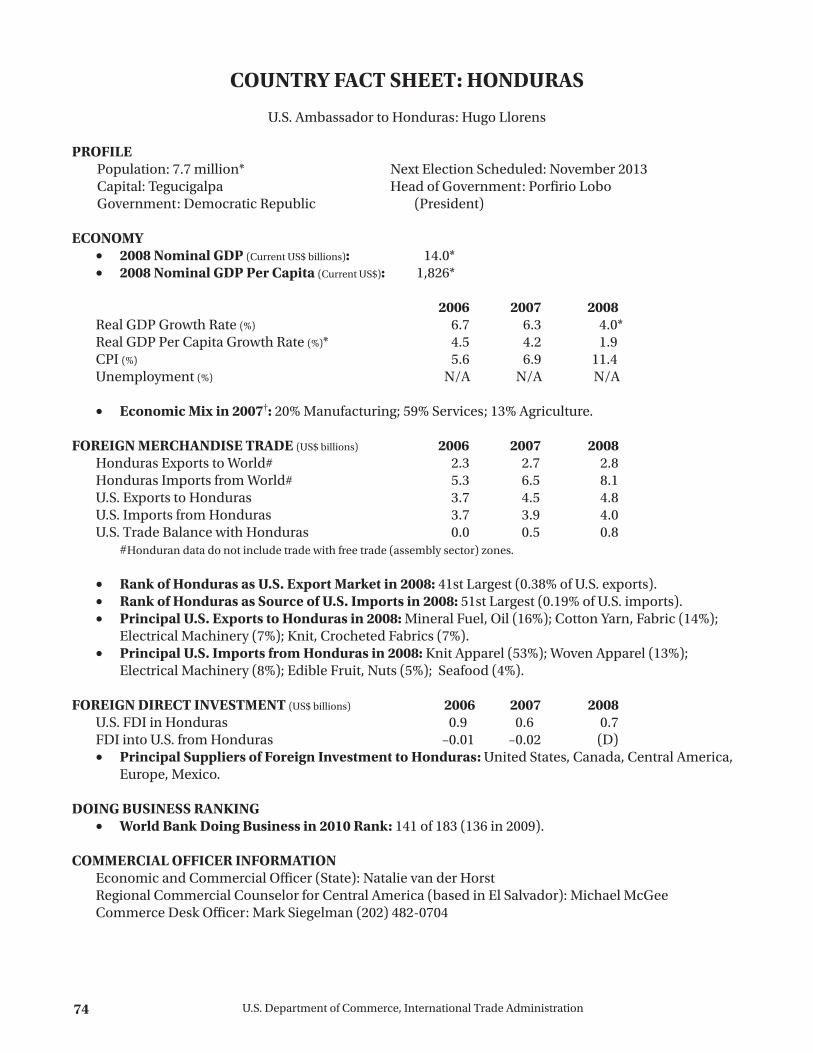
74 U.S. Department of Commerce, International Trade Administration
COUNTRY FACT SHEET: HONDURAS
U.S. Ambassador to Honduras: Hugo Llorens
PROFILEPopulation: 7.7 million* Next Election Scheduled: November 2013Capital: Tegucigalpa Head of Government: Porfirio LoboGovernment: Democratic Republic (President)
ECONOMY• 2008 Nominal GDP (Current US$ billions): 14.0* • 2008 Nominal GDP Per Capita (Current US$): 1,826*
2006 2007 2008Real GDP Growth Rate (%) 6.7 6.3 4.0*Real GDP Per Capita Growth Rate (%)* 4.5 4.2 1.9CPI (%) 5.6 6.9 11.4Unemployment (%) N/A N/A N/A
• Economic Mix in 2007†: 20% Manufacturing; 59% Services; 13% Agriculture.
FOREIGN MERCHANDISE TRADE (US$ billions) 2006 2007 2008Honduras Exports to World# 2.3 2.7 2.8Honduras Imports from World# 5.3 6.5 8.1U.S. Exports to Honduras 3.7 4.5 4.8U.S. Imports from Honduras 3.7 3.9 4.0U.S. Trade Balance with Honduras 0.0 0.5 0.8
#Honduran data do not include trade with free trade (assembly sector) zones.
• Rank of Honduras as U.S. Export Market in 2008: 41st Largest (0.38% of U.S. exports).• Rank of Honduras as Source of U.S. Imports in 2008: 51st Largest (0.19% of U.S. imports).• Principal U.S. Exports to Honduras in 2008: Mineral Fuel, Oil (16%); Cotton Yarn, Fabric (14%);
Electrical Machinery (7%); Knit, Crocheted Fabrics (7%).• Principal U.S. Imports from Honduras in 2008: Knit Apparel (53%); Woven Apparel (13%);
Electrical Machinery (8%); Edible Fruit, Nuts (5%); Seafood (4%).
FOREIGN DIRECT INVESTMENT (US$ billions) 2006 2007 2008U.S. FDI in Honduras 0.9 0.6 0.7FDI into U.S. from Honduras –0.01 –0.02 (D)• Principal Suppliers of Foreign Investment to Honduras: United States, Canada, Central America,
Europe, Mexico.
DOING BUSINESS RANKING• World Bank Doing Business in 2010 Rank: 141 of 183 (136 in 2009).
COMMERCIAL OFFICER INFORMATIONEconomic and Commercial Officer (State): Natalie van der HorstRegional Commercial Counselor for Central America (based in El Salvador): Michael McGee Commerce Desk Officer: Mark Siegelman (202) 482-0704

75 Top U.S. Export Markets 2009
U.S
. Tra
de in
Goo
ds w
ith
Hon
dura
s
U.S
. Exp
orts
U.S
. Im
por
ts
0123456
1990
1992
1994
1996
1998
2000
2002
2004
2006
2008
Billio
ns of
dolla
rs
Hon
dura
s's
Imp
orts
Rel
ativ
e to
GD
P
8.8
9.7
10.8
12.4
14.1
0246810121416
2004
2005
2006
2007
2008
Billio
ns of
dolla
rs
GD
PTo
tal i
mp
orts
Imp
orts
from
the
Un
ited
Sta
tes
Billions of dollars
Billions of dollars
HS Commodity2304 4804 1005 8517 6004 8544 5509 6006 5205 2710
Lead
ing
U.S
. Exp
orts
to H
ondu
ras
in 2
008
and
Ch
ange
from
200
70
100
200
300
400
500
600
700
800
Re�
ned
pet
role
um
(-4
%)
Cot
ton
yar
n (
+25%
)
Kn
itte
d fa
bri
cs (
-6%
)
Syn
thet
ic y
arn
(+1
36%
)
Insu
late
d w
ire,
cab
le (
-34%
)
Kn
it, c
roch
eted
ela
stic
fab
rics
(+2
6%)
Ele
c. a
pp
ar. f
or te
lep
hon
es (
+22%
)
Cor
n (
+34%
)
Kra
ft p
aper
, un
coat
ed (
+28%
)
Soyb
ean
oilc
ake
(+68
%)
2710
5205
6006
5509
8544
6004
8517
1005
4804
2304
HS
Com
mod
ity
Mill
ion
s of
dol
lars
Percent
U.S
. Mar
ket S
har
e of
Lead
ing
U.S
. Exp
orts
to H
ondu
ras
0102030405060
Re�
ned
pet
role
um
Cot
ton
yarn
Kn
itte
dfa
bri
csSy
nth
etic
yarn
Insu
late
dw
ire,
cab
le
2710
52
05
6006
55
09
8544
H
S C
omm
odit
y
Perc
ent

76 U.S. Department of Commerce, International Trade Administration
COUNTRY FACT SHEET: HONG KONG
U.S. Consul General to Hong Kong: Christopher J. Marut, ActingHong Kong Commissioner for Economic and Trade Affairs in the United States: Donald Tong
PROFILE Population: 7 million Next Election Scheduled: 2012 Capital: Dependency Status (Special Head of Government: Donald Tsang Administrative Region of China) (Chief Executive) Government: Limited Democracy
ECONOMY
• 2008 Nominal GDP (Current US$ billions): 215.3 • 2008 Nominal GDP Per Capita (Current US$): 30,726
2006 2007 2008Real GDP Growth Rate (%) 7.0 6.4 2.4Real GDP Per Capita Growth Rate (%) 5.9 5.7 1.5 CPI (%) 2.0 2.0 4.3Unemployment (%) 4.8 4.0 3.5
• Economic Mix in 2007†: 3% Manufacturing; 92% Services; 0% Agriculture.
FOREIGN MERCHANDISE TRADE (US$ billions) 2006 2007 2008Hong Kong Exports to World 322.7 349.7 370.7Hong Kong Imports from World 335.8 370.7 393.4U.S. Exports to Hong Kong 17.7 19.9 21.5U.S. Imports from Hong Kong 7.9 7.0 6.5U.S. Trade Balance with Hong Kong 9.8 12.9 15.0
• Rank of Hong Kong as U.S. Export Market in 2008: 16th Largest (1.7% of U.S. exports).• Rank of Hong Kong as Source of U.S. Imports in 2008: 42nd Largest (0.3% of U.S. imports).• Principal U.S. Exports to Hong Kong in 2008: Electrical Machinery (27%); Precious Stones (16%);
Machinery, Reactors, Boilers (10%); Plastics (6%); Optical, Medical Instruments (6%).• Principal U.S. Imports from Hong Kong in 2008: Electrical Machinery (16%); Precious Stones,
Metals (14 %); Knit Apparel (13%); Woven Apparel (10%); Machinery (5%).
FOREIGN DIRECT INVESTMENT (US$ billions) 2006 2007 2008U.S. FDI in Hong Kong 39.6 50.2 51.5FDI into U.S. from Hong Kong 3.0 3.7 4.0• Principal Suppliers of Foreign Investment to Hong Kong: Mainland China, Netherlands, United
States, Japan.
DOING BUSINESS RANKING• World Bank Doing Business in 2010 Rank: 3 of 183 (3 in 2009).
COMMERCIAL OFFICER INFORMATIONSenior Commercial Officer: Andrew WylegalaCommerce Desk Officer: Tom Dycus (202) 482-2295

77 Top U.S. Export Markets 2009
U.S
. Tra
de in
Goo
ds w
ith
Hon
g K
ong
U.S
. Exp
orts
U.S
. Im
por
ts
0510152025
1990
1992
1994
1996
1998
2000
2002
2004
2006
2008
Billio
ns of
dolla
rs
Hon
g K
ong'
s Im
por
ts R
elat
ive
to G
DP
166
178
190
207
216
050100
150
200
250
300
350
400
450
2004
2005
2006
2007
2008
Billio
ns of
dolla
rs
GD
PTo
tal i
mp
orts
Imp
orts
from
the
Un
ited
Sta
tes
Billions of dollars
Billions of dollars
HS Commodity0802 8536 8473 8471 8541 7113 8517 8800 7102 8542
Lead
ing
U.S
. Exp
orts
to H
ong
Kon
g in
200
8an
d C
han
ge fr
om 2
007
00.
10.
20.
30.
40.
50.
60.
70.
80.
91
Inte
grat
ed c
ircu
its
(-11
%)
Dia
mon
ds
(-7%
)
Civ
ilian
air
craf
t (+8
2%)
Ele
c. a
pp
ar. f
or te
lep
hon
es (
-13%
)
Jew
elry
w/p
reci
ous
met
als
(+37
%)
Sem
icon
du
ctor
s (+
60%
)
AD
P m
ach
ines
(+9
9%)
O�
ce m
ach
ine
par
ts (
+557
%)
Ele
c. a
pp
ar. f
or s
wit
chin
g (+
37%
)
Alm
ond
s, o
ther
nu
ts (
+19%
)
8542
7102
8800
8517
7113
8541
8471
8473
8536
0802
HS
Com
mod
ity
Bill
ion
s of
dol
lars
Percent
U.S
. Mar
ket S
har
e of
Lead
ing
U.S
. Exp
orts
to H
ong
Kon
g
0102030405060708090100
Inte
grat
edci
rcu
its
Dia
mon
ds
Civ
ilian
airc
raft
Ele
c. a
pp
ar.
for
tele
ph
ones
Jew
elry
w/
pre
ciou
sm
etal
s85
42
7102
88
0285
17
7113
H
S C
omm
odit
y
Perc
ent

78 U.S. Department of Commerce, International Trade Administration
COUNTRY FACT SHEET: INDIA
U.S. Ambassador to India: Timothy J. RoemerIndian Ambassador to the United States: Meera Shankar
PROFILEPopulation: 1.2 billion Next Election Scheduled: No later than 2014Capital: New Delhi Head of Government: Manmohan SinghGovernment: Federal Republic (Prime Minister)
ECONOMY• 2008 Nominal GDP (Current US$ billions): 1,206.7 • 2008 Nominal GDP Per Capita (Current US$): 1,017
2006 2007 2008Real GDP Growth Rate (%) 9.8 9.4 7.3Real GDP Per Capita Growth Rate (%) 8.2 7.8 5.8CPI (%) 6.2 6.4 8.3Unemployment (%) 7.0 6.7 6.8‡
• Economic Mix in 2007†: 30% Manufacturing; 52% Services; 18% Agriculture.
FOREIGN MERCHANDISE TRADE (US$ billions) 2006 2007 2008 India Exports to World 121.3 147.6 178.0 India Imports from World 172.9 217.5 292.8 U.S. Exports to India 9.7 15.0 17.7 U.S. Imports from India 21.8 24.1 25.7 U.S. Trade Balance with India –12.1 –9.1 –8.0
• Rank of India as U.S. Export Market in 2008: 17th Largest (1.4% of U.S. exports).• Rank of India as Source of U.S. Imports in 2008: 18th Largest (1.2% of U.S. imports).• Principal U.S. Exports to India in 2008: Fertilizer (16%); Precious Stones, Metals (14%); Machinery
(13%); Aircraft, Spacecraft (10%); Electrical Machinery (8%).• Principal U.S. Imports from India in 2008: Precious Stones (22%); Woven Apparel (7%); Iron, Steel
Products (7%); Organic Chemicals (6%); Machinery (6%).
FOREIGN DIRECT INVESTMENT (US$ billions) 2006 2007 2008U.S. FDI in India 9.7 14.5 16.1FDI into U.S. from India 1.4 2.8 4.5• Principal Suppliers of Foreign Investment to India: Mauritius, United States, United Kingdom,
Singapore, Netherlands.
DOING BUSINESS RANKING• World Bank Doing Business in 2010 Rank: 133 of 183 (122 in 2009).
COMMERCIAL OFFICER INFORMATIONSenior Commercial Officer: Carmine D’AloisioCommerce Desk Officer: Art Stern (202) 482-3423

79 Top U.S. Export Markets 2009
U.S
. Tra
de in
Goo
ds w
ith
Indi
a
U.S
. Exp
orts
U.S
. Im
por
ts
051015202530
1990
1992
1994
1996
1998
2000
2002
2004
2006
2008
Billio
ns of
dolla
rs
Indi
a's
Imp
orts
Rel
ativ
e to
GD
P
0.7
0.8
0.9
1.1
1.2
0
0.2
0.4
0.6
0.81
1.2
1.4
2004
2005
2006
2007
2008
Trilli
ons o
f doll
ars
GD
PTo
tal i
mp
orts
Imp
orts
from
the
Un
ited
Sta
tes
Trillions of dollars
Billions of dollars
HS Commodity8431 8471 2701 7204 2707 8517 7108 7102 8800 3105
Lead
ing
U.S
. Exp
orts
to In
dia
in 2
008
and
Ch
ange
from
200
70
0.5
11.
52
2.5
3
Fert
ilize
r m
ixtu
res
(N/A
)
Civ
ilian
air
craf
t (-5
1%)
Dia
mon
ds
(+67
%)
Gol
d (
+31%
)
Ele
c. a
pp
ar. f
or te
lep
hon
es (
+15%
)
Oils
from
coa
l tar
(+9
3%)
Ferr
ous
was
te, s
crap
(+8
%)
Coa
l (+2
98%
)
AD
P m
ach
ines
(-1
4%)
Part
s fo
r lif
tin
g m
ach
ines
(+3
%)
3105
8800
7102
7108
8517
2707
7204
2701
8471
8431
HS
Com
mod
ity
Bill
ion
s of
dol
lars
Percent
U.S
. Mar
ket S
har
e of
Lead
ing
U.S
. Exp
orts
to In
dia
0102030405060
Fert
ilize
rm
ixtu
res
Civ
ilian
airc
raft
Dia
mon
ds
Gol
dE
lec.
ap
par
.fo
r te
lep
hon
es
3105
88
0271
02
7108
85
17
HS
Com
mod
ity
Perc
ent

80 U.S. Department of Commerce, International Trade Administration
COUNTRY FACT SHEET: INDONESIA
U.S. Ambassador to Indonesia: Cameron R. HumeIndonesian Ambassador to the United States: Sudjadnan Parnohadiningrat
PROFILEPopulation: 228.6 million* Next Election Scheduled: 2014Capital: Jakarta Head of Government: Susilo Bambang YudhoyonoGovernment: Republic (President)
ECONOMY• 2008 Nominal GDP (Current US$ billions): 511.8• 2008 Nominal GDP Per Capita (Current US$): 2,239*
2006 2007 2008Real GDP Growth Rate (%) 5.5 6.3 6.1Real GDP Per Capita Growth Rate (%) 4.1 4.9 4.7*CPI (%) 13.1 6.0 9.8Unemployment (%)
‡ 9.1 8.4‡• 8.7‡•
• Economic Mix in 2007†: 27% Manufacturing; 39% Services; 14% Agriculture.
FOREIGN MERCHANDISE TRADE (US$ billions) 2006 2007 2008Indonesia Exports to World 100.8 114.1 137.0Indonesia Imports from World 61.1 74.5 129.2U.S. Exports to Indonesia 3.1 4.0 5.6U.S. Imports from Indonesia 13.4 14.3 15.8U.S. Trade Balance with Indonesia –10.3 –10.3 –10.2
• Rank of Indonesia as U.S. Export Market in 2008: 38th Largest (0.4% of U.S. exports).• Rank of Indonesia as Source of U.S. Imports in 2008: 28th Largest (0.8% of U.S. imports).• Principal U.S. Exports to Indonesia in 2008: Machinery (12%); Grain, Seed, Fruit (11%); Aircraft,
Spacecraft (10%); Cotton Yarn, Fabric (8%); Cereals (7%).• Principal U.S. Imports from Indonesia in 2008: Rubber (13%); Woven Apparel (13%); Knit Apparel
(13%); Electrical Machinery (11%); Mineral Fuel, Oil (5%).
FOREIGN DIRECT INVESTMENT (US$ millions) 2006 2007 2008U.S. FDI in Indonesia 9,484 17,679 17,909FDI into U.S. from Indonesia N/A 125 129• Principal Suppliers of Foreign Investment to Indonesia: Singapore, United Kingdom, Japan,
Malaysia, Canada.
DOING BUSINESS RANKING• World Bank Doing Business in 2010 Rank: 122 of 183 (129 in 2009).
COMMERCIAL OFFICER INFORMATIONSenior Commercial Officer: Joe KaesshaeferCommerce Desk Officer: Shalizeh Nadjmi (202) 482-3832

81 Top U.S. Export Markets 2009
U.S
. Tra
de in
Goo
ds w
ith
Indo
nes
ia
U.S
. Exp
orts
U.S
. Im
por
ts
024681012141618
1990
1992
1994
1996
1998
2000
2002
2004
2006
2008
Billio
ns of
dolla
rs
Indo
nes
ia's
Imp
orts
Rel
ativ
e to
GD
P
257
286
364
432
512
0
100
200
300
400
500
600
2004
2005
2006
2007
2008
Billio
ns of
dolla
rs
GD
PTo
tal i
mp
orts
Imp
orts
from
the
Un
ited
Sta
tes
Billions of dollars
Billions of dollars Percent
U.S
. Mar
ket S
har
e of
Lead
ing
U.S
. Exp
orts
to In
don
esia
0
102030405060708090100
Soyb
ean
sC
ivili
anai
rcra
ftC
otto
nW
hea
t,m
eslin
Ferr
ous
was
te,
scra
p12
01
8802
52
01
1001
72
04
HS
Com
mod
ity
Perc
ent
8800
8473
2710
2701
8471
8431
8517
8542
3004
8443
HS
Com
mod
ity
0 10
0 20
0 30
0 40
0 50
0 60
0 70
0
Soyb
ean
s (+
47%
)
Civ
ilian
air
craf
t (+4
4%)
Cot
ton
(+3
3%)
Wh
eat,
mes
lin (
+54%
)
Ferr
ous
was
te, s
crap
(+1
27%
)
Milk
, cre
am, c
once
ntr
ated
(+7
6%)
Par
ts fo
r lif
tin
g m
ach
ines
(+6
8%)
Star
ch, s
uga
r m
rf. r
esid
ues
(+5
5%)
Lub
rica
tin
g, a
nti
rust
pre
p. (
+34%
)
Art
i�ci
al �
lam
ent t
ow (
+45%
)
1201 8800 5201 1001 7204 0402 8431 2303 3403 5502
Mill
ion
s of
dol
lars
HS Commodity
Lead
ing
U.S
. Exp
orts
to In
don
esia
in 2
008
and
Ch
ange
from
200
7

82 U.S. Department of Commerce, International Trade Administration
COUNTRY FACT SHEET: IRELAND
U.S. Ambassador to Ireland: Daniel M. Rooney Irish Ambassador to the United States: Michael Collins
PROFILEPopulation: 4.4 million Next Election Scheduled: 2011 Capital: Dublin Head of Government: Brian Cowan Government: Republic (Prime Minister)
ECONOMY
• 2008 Nominal GDP (Current US$ billions): 267.6• 2008 Nominal GDP Per Capita (Current US$): 60,510
2006 2007 2008Real GDP Growth Rate (%) 5.4 6.0 –3.0Real GDP Per Capita Growth Rate (%) 3.1 3.6 4.9CPI (%) 2.7 2.9 3.1Unemployment (%) 4.4 4.5 6.1
• Economic Mix in 2006†: 23% Manufacturing; 63% Services; 2% Agriculture.
FOREIGN MERCHANDISE TRADE (US$ billions) 2006 2007 2008 Ireland Exports to World 108.8 121.5 125.6Ireland Imports from World 73.2 83.9 84.1U.S. Exports to Ireland 7.6 7.8 7.6U.S. Imports from Ireland 28.5 30.4 31.3U.S. Trade Balance with Ireland –20.9 –22.6 –23.7
• Rank of Ireland as U.S. Export Market in 2008: 31st largest (0.6% of U.S. exports).• Rank of Ireland as Source of U.S. Imports in 2008: 14th largest (1.5% of U.S. imports).• Principal U.S. Exports to Ireland in 2008: Aircraft, Spacecraft (18%); Machinery (17%); Optical,
Medical Instruments (15%); Pharmaceutical Products (11%); Electrical Machinery (9%).• Principal U.S. Imports from Ireland in 2008: Organic Chemicals (41%); Pharmaceutical Products
(21%); Optical, Medical Instruments (16%); Perfumes, Cosmetics (7%); Machinery (5%).
FOREIGN DIRECT INVESTMENT (US$ billions) 2006 2007 2008U.S. FDI in Ireland 86.4 114.9 146.2FDI into U.S. from Ireland 25.5 32.7 34.1 • Principal Suppliers of Foreign Investment to Ireland: United States, United Kingdom, Germany.
DOING BUSINESS RANKING• World Bank Doing Business in 2010 Rank: 7 of 183 (7 in 2009).
Commercial Officer InformationSenior Commercial Officer: Stephen AndersonCommerce Desk Officer: Robert McLaughlin (202) 482-3748

83 Top U.S. Export Markets 2009
U.S
. Tra
de in
Goo
ds w
ith
Irel
and
U.S
. Exp
orts
U.S
. Im
por
ts
05101520253035
1990
1992
1994
1996
1998
2000
2002
2004
2006
2008
Billio
ns of
dolla
rs
Irel
and'
s Im
por
ts R
elat
ive
to G
DP
185
202
223
261
273
050100
150
200
250
300
2004
2005
2006
2007
2008
Billio
ns of
dolla
rs
GD
PTo
tal i
mp
orts
Imp
orts
from
the
Un
ited
Sta
tes
Billions of dollars
Billions of dollars
HS Commodity2933 8517 8542 3003 9018 8471 8473 3004 9021 8800
Lead
ing
U.S
. Exp
orts
to Ir
elan
d 20
08an
d C
han
ge fr
om 2
007
00.
20.
40.
60.
81
1.2
1.4
1.6
Civ
ilian
air
craf
t (-3
%)
Ort
hop
edic
dev
ices
(-2
4%)
Ph
arm
aceu
tica
ls in
dos
ages
(+4
0%)
O�
ce m
ach
ine
par
ts (
-18)
AD
P m
ach
ines
(+2
4%)
Med
ical
inst
rum
ents
(+2
0%)
Ph
arm
aceu
tica
ls, n
o d
osag
es (
-39%
)
Inte
grat
ed c
ircu
its
(+1%
)
Ele
c. a
pp
ar. f
or te
lep
hon
es (
+6%
)
Het
eroc
yc. c
omp.
w/n
itro
(+1
18%
)
8800
9021
3004
8473
8471
9018
3003
8542
8517
2933
HS
Com
mod
ity
Bill
ion
s of
dol
lars
Percent
U.S
. Mar
ket S
har
e of
Lead
ing
U.S
. Exp
orts
to Ir
elan
d
010203040506070809010
0
Civ
ilian
airc
raft
Ort
hop
edic
dev
ices
Ph
arm
aceu
-ti
cals
ind
osag
es
O�
cem
ach
ine
par
ts
AD
Pm
ach
ines
8802
9021
30
04
8473
84
71
HS
Com
mod
ity
Perc
ent

84 U.S. Department of Commerce, International Trade Administration
COUNTRY FACT SHEET: ISRAEL
U.S. Ambassador to Israel: James B. CunninghamIsraeli Ambassador to the United States: Michael Oren
PROFILEPopulation: 7.1 million Next Election Scheduled: N/ACapital: Jerusalem Head of Government: Benjamin NetanyahuGovernment: Parliamentary Democracy (Prime Minister)
ECONOMY• 2008 Nominal GDP (Current US$ billions): 202.1 • 2008 Nominal GDP Per Capita (Current US$): 28,409
2006 2007 2008Real GDP Growth Rate (%) 5.3 5.2 4.0Real GDP Per Capita Growth Rate (%) 3.1 2.9 1.8CPI (%) 2.1 0.5 4.6Unemployment (%) 8.4 7.3 6.2
• Economic Mix in 2006‡: 32% Manufacturing; 64% Services; 3% Agriculture.
FOREIGN MERCHANDISE TRADE (US$ billions) 2006 2007 2008Israel Exports to World 46.8 54.1 61.3Israel Imports from World 47.8 56.6 65.2U.S. Exports to Israel 11.0 12.9 14.5U.S. Imports from Israel 19.2 20.8 22.3U.S. Trade Balance with Israel –8.2 –7.9 –7.8
• Rank of Israel as U.S. Export Market in 2008: 19th Largest (1.11% of U.S. exports).• Rank of Israel as Source of U.S Imports in 2008: 20th Largest (1.06% of U.S. imports).• Principal U.S. Exports to Israel in 2008: Precious Stones, Metals (38%); Machinery (10%); Aircraft,
Spacecraft (9%); Electrical Machinery (7%).• Principal U.S. Imports from Israel in 2008: Precious Stones, Metals (43%); Pharmaceutical
Products (17%); Electrical Machinery (7%); Machinery (6%).
FOREIGN DIRECT INVESTMENT (US$ billions) 2006 2007 2008U.S. FDI in Israel 9.2 9.5 10.2FDI into U.S. from Israel (D) 6.6 6.1• Principal Suppliers of Foreign Investment to Israel: N/A
DOING BUSINESS RANKING• World Bank Doing Business in 2010 Rank: 29 of 183 (29 in 2009).
COMMERCIAL OFFICER INFORMATIONSenior Commercial Officer: Jonathan HeimerCommerce Desk Officer: Naomi Wiegler (202) 482-1870

85 Top U.S. Export Markets 2009
HS Commodity1005 8542 8703 8471 8803 8486 8802 2710 8800 7102
Lead
ing
U.S
. Exp
orts
to Is
rael
in 2
008
and
Ch
ange
from
200
70
12
34
56
Dia
mon
ds
(+14
%)
Civ
ilian
air
craf
t (-2
1%)
Re�
ned
pet
role
um
(+8
0%)
Air
craf
t, sp
acec
raft
(+2
6%)
Sem
icon
du
ctor
mfr
. mac
h. (
+69%
)
Air
craf
t par
ts (
-1%
)
AD
P m
ach
ines
(-1
9%)
Pass
enge
r ve
hic
les
(+85
%)
Inte
grat
ed c
ircu
its
(-1%
)
Cor
n (
+17%
)
7102
8800
2710
8802
8486
8803
8471
8703
8542
1005
HS
Com
mod
ity
Bill
ion
s of
dol
lars
PercentU
.S. T
rade
in G
oods
wit
h Is
rael
U.S
. Exp
orts
U.S
. Im
por
ts
0510152025
1990
1992
1994
1996
1998
2000
2002
2004
2006
2008
Billio
ns of
dolla
rs
Isra
el's
Imp
orts
Rel
ativ
e to
GD
P
126
133
144
164
202
050100
150
200
250
2004
2005
2006
2007
2008
Billio
ns of
dolla
rs
GD
PTo
tal i
mp
orts
Imp
orts
from
the
Un
ited
Sta
tes
Billions of dollars
Billions of dollars
0 10
20
30
40
50
60
Dia
mon
ds
Civ
ilian
airc
raft
R
e�n
edp
etro
leu
m
Sem
i-co
nd
uct
or
mfr
. mac
h.
Air
craf
tp
arts
7102
88
02
2710
84
86
8803
H
S C
omm
odit
y
U.S
. Mar
ket S
har
e of
Lead
ing
U.S
. Exp
orts
to Is
rael

86 U.S. Department of Commerce, International Trade Administration
COUNTRY FACT SHEET: ITALY
U.S. Ambassador to Italy: David ThorneItalian Ambassador to the United States: Giulio Terzi di Sant’Agata
PROFILEPopulation: 59.3 million Next Election Scheduled: April 2013Capital: Rome Head of Government: Silvio BerlusconiGovernment: Republic (Parliamentary Democracy) (Prime Minister)
ECONOMY• 2008 Nominal GDP (Current US$ billions): 2,313.9• 2008 Nominal GDP Per Capita (Current US$): 38,996
2006 2007 2008 Real GDP Growth Rate (%) 2.0 1.6 –1.0 Real GDP Per Capita Growth Rate (%) 1.4 0.8 –1.8 CPI (%) 2.2 2.0 3.5 Unemployment (%) 6.8 6.1 6.8
• Economic Mix in 2006†: 18% Manufacturing; 71% Services; 2% Agriculture. FOREIGN MERCHANDISE TRADE (US$ billions) 2006 2007 2008 Italy Exports to World 417.3 500.4 539.6 Italy Imports from World 442.7 512.0 556.2 U.S. Exports to Italy 12.5 14.2 15.5 U.S. Imports from Italy 32.7 35.0 36.1 U.S. Trade Balance with Italy –20.2 –20.9 –20.6
• Rank of Italy as U.S. Export Market in 2008: 18th largest (1.2% of U.S. exports).• Rank of Italy as Source of U.S. Imports in 2008: 13th largest (1.7% of U.S. imports).• Principal U.S. Exports to Italy in 2008: Machinery (14%); Optical, Medical Instruments (9%);
Precious Stones (8%); Electrical Machinery (8%); Mineral Fuels, Oils (8%).• Principal U.S. Imports from Italy in 2008: Machinery (20%); Mineral Fuels (6%); Vehicles, Not
Railway (6%); Pharmaceutical Products (6%); Beverages (5%).
FOREIGN DIRECT INVESTMENT (US$ billions) 2006 2007 2008 U.S. FDI in Italy 25.4 26.7 28.7 FDI into U.S. from Italy 9.3 13.3 17.6
• Principal Suppliers of Foreign Investment to Italy: United States, United Kingdom, Germany, France.
DOING BUSINESS RANKING• World Bank Doing Business in 2010 Rank: 78 of 183 (74 in 2009).
COMMERCIAL OFFICER INFORMATIONSenior Commercial Officer: Thomas MooreCommerce Desk Officer: Robert McLaughlin (202) 482-3748
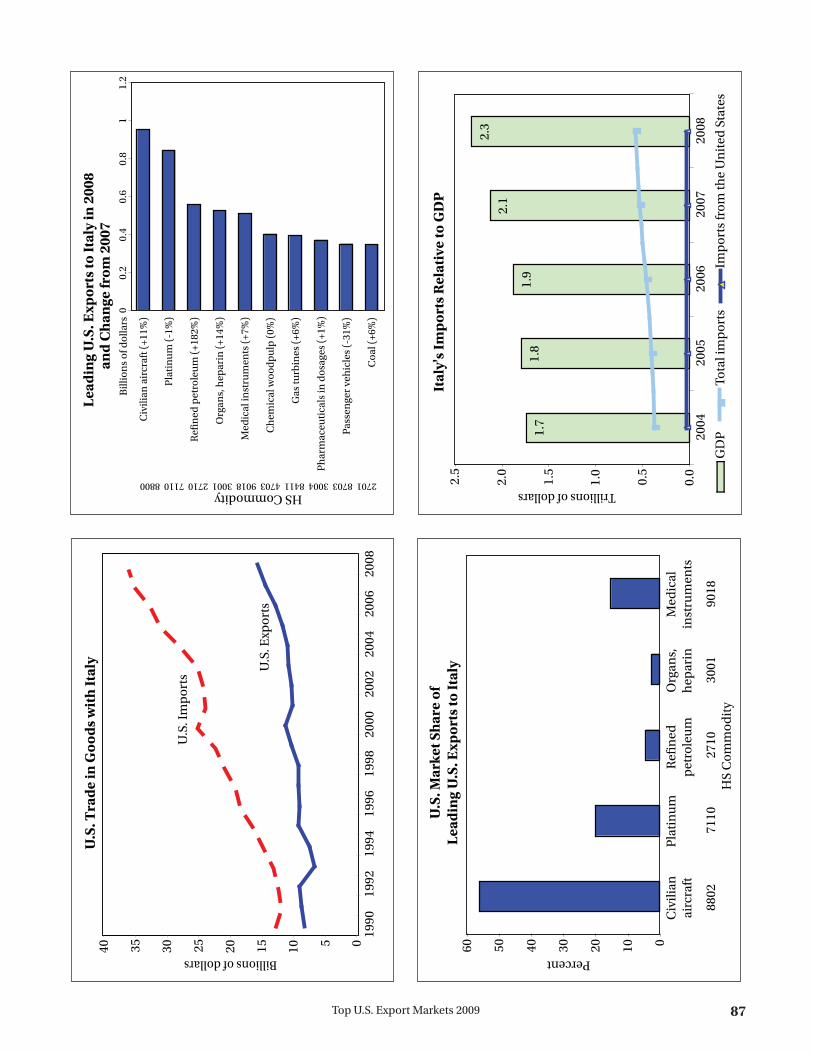
87 Top U.S. Export Markets 2009
HS Commodity2701 8703 3004 8411 4703 9018 3001 2710 7110 8800
Lead
ing
U.S
. Exp
orts
to It
aly
in 2
008
and
Ch
ange
from
200
70
0.2
0.4
0.6
0.8
11.
2
Civ
ilian
air
craf
t (+1
1%)
Pla
tin
um
(-1
%)
Re�
ned
pet
role
um
(+1
82%
)
Org
ans,
hep
arin
(+1
4%)
Med
ical
inst
rum
ents
(+7
%)
Ch
emic
al w
ood
pu
lp (
0%)
Gas
turb
ines
(+6
%)
Ph
arm
aceu
tica
ls in
dos
ages
(+1
%)
Pass
enge
r ve
hic
les
(-31
%)
Coa
l (+6
%)
8800
7110
2710
3001
9018
4703
8411
3004
8703
2701
HS
Com
mod
ity
Bill
ion
s of
dol
lars
Percent
U.S
. Mar
ket S
har
e of
Lead
ing
U.S
. Exp
orts
to It
aly
0102030405060
Civ
ilian
airc
raft
Pla
tin
um
Re�
ned
pet
role
um
Org
ans,
hep
arin
Med
ical
inst
rum
ents
8802
71
10
2710
30
01
9018
H
S C
omm
odit
y
Perc
ent
U.S
. Tra
de in
Goo
ds w
ith
Ital
y U.S
. Exp
orts
U.S
. Im
por
ts
0510152025303540
1990
1992
1994
1996
1998
2000
2002
2004
2006
2008
Billio
ns of
dolla
rs
Ital
y's
Imp
orts
Rel
ativ
e to
GD
P
1.7
1.8
1.9
2.1
2.3
0.0
0.5
1.0
1.5
2.0
2.5
2004
2005
2006
2007
2008
Trilli
ons o
f doll
ars
GD
PTo
tal i
mp
orts
Imp
orts
from
the
Un
ited
Sta
tes
Trillions of dollars
Billions of dollars
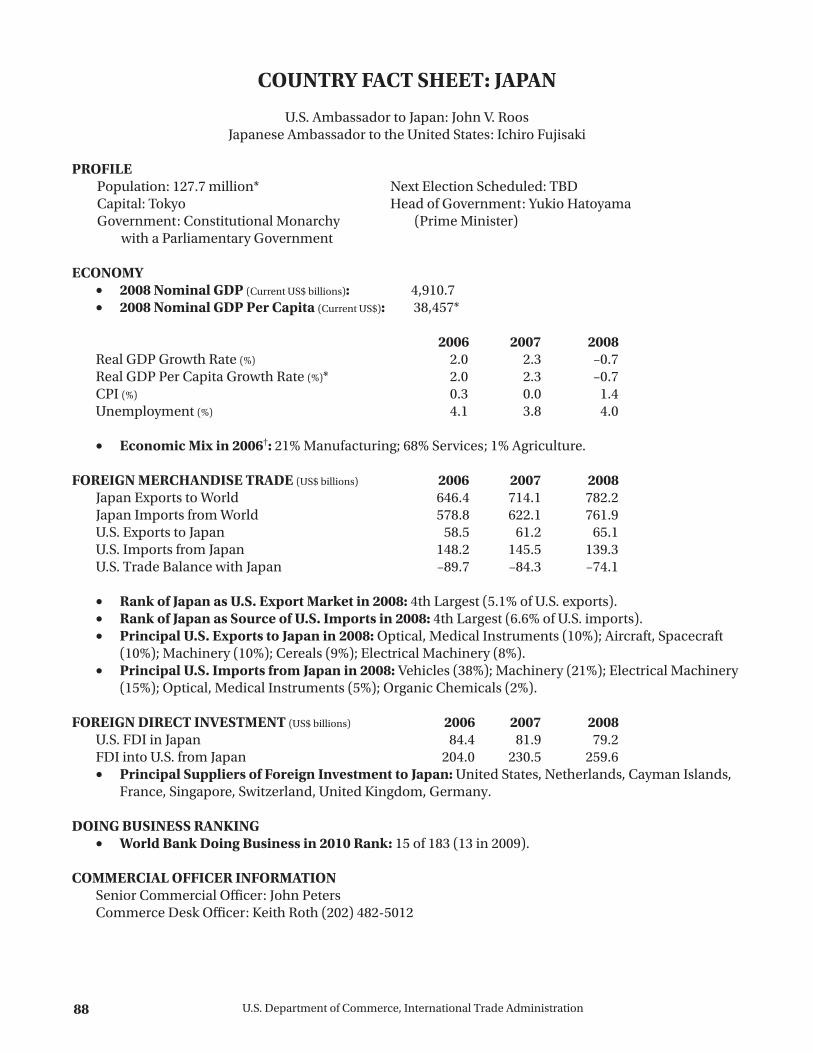
88 U.S. Department of Commerce, International Trade Administration
COUNTRY FACT SHEET: JAPAN
U.S. Ambassador to Japan: John V. RoosJapanese Ambassador to the United States: Ichiro Fujisaki
PROFILEPopulation: 127.7 million* Next Election Scheduled: TBDCapital: Tokyo Head of Government: Yukio HatoyamaGovernment: Constitutional Monarchy (Prime Minister) with a Parliamentary Government
ECONOMY• 2008 Nominal GDP (Current US$ billions): 4,910.7 • 2008 Nominal GDP Per Capita (Current US$): 38,457*
2006 2007 2008Real GDP Growth Rate (%) 2.0 2.3 –0.7Real GDP Per Capita Growth Rate (%)* 2.0 2.3 –0.7CPI (%) 0.3 0.0 1.4Unemployment (%) 4.1 3.8 4.0
• Economic Mix in 2006†: 21% Manufacturing; 68% Services; 1% Agriculture.
FOREIGN MERCHANDISE TRADE (US$ billions) 2006 2007 2008Japan Exports to World 646.4 714.1 782.2Japan Imports from World 578.8 622.1 761.9U.S. Exports to Japan 58.5 61.2 65.1U.S. Imports from Japan 148.2 145.5 139.3U.S. Trade Balance with Japan –89.7 –84.3 –74.1
• Rank of Japan as U.S. Export Market in 2008: 4th Largest (5.1% of U.S. exports).• Rank of Japan as Source of U.S. Imports in 2008: 4th Largest (6.6% of U.S. imports).• Principal U.S. Exports to Japan in 2008: Optical, Medical Instruments (10%); Aircraft, Spacecraft
(10%); Machinery (10%); Cereals (9%); Electrical Machinery (8%).• Principal U.S. Imports from Japan in 2008: Vehicles (38%); Machinery (21%); Electrical Machinery
(15%); Optical, Medical Instruments (5%); Organic Chemicals (2%).
FOREIGN DIRECT INVESTMENT (US$ billions) 2006 2007 2008U.S. FDI in Japan 84.4 81.9 79.2FDI into U.S. from Japan 204.0 230.5 259.6• Principal Suppliers of Foreign Investment to Japan: United States, Netherlands, Cayman Islands,
France, Singapore, Switzerland, United Kingdom, Germany.
DOING BUSINESS RANKING• World Bank Doing Business in 2010 Rank: 15 of 183 (13 in 2009).
COMMERCIAL OFFICER INFORMATIONSenior Commercial Officer: John PetersCommerce Desk Officer: Keith Roth (202) 482-5012

89 Top U.S. Export Markets 2009
HS Commodity8471 9021 8486 8542 1201 0203 1001 9018 1005 8800
Lead
ing
U.S
. Exp
orts
to Ja
pan
in 2
008
and
Ch
ange
from
200
70
12
34
56
Civ
ilian
air
craf
t (-
2%)
Cor
n (
+46%
)
Med
ical
inst
rum
ents
(+1
2%)
Wh
eat,
mes
lin (
+103
%)
Por
k, fr
esh
or
froz
en (
+32%
)
Soyb
ean
s (+
24%
)
Inte
grat
ed c
ircu
its
(-13
%)
Sem
icon
du
ctor
mfr
. mac
h. (
-23%
)
Ort
hop
edic
dev
ices
(+4
2%)
AD
P m
ach
ines
(-2
0%)
8800
1005
9018
1001
0203
1201
8542
8486
9021
8471
HS
Com
mod
ity
Bill
ion
s of
dol
lars
Percent
U.S
. Mar
ket S
har
e of
Lead
ing
U.S
. Exp
orts
to Ja
pan
0102030405060708090100
Civ
ilian
airc
raft
Cor
nM
edic
alin
stru
men
tsW
hea
t,m
eslin
Por
k, fr
esh
or fr
ozen
8802
10
05
9018
10
01
0203
H
S C
omm
odit
y
Perc
ent
GD
PTo
tal i
mp
orts
Imp
orts
from
the
Un
ited
Sta
tes
U.S
. Exp
orts
U.S
. Im
por
ts
0 20
40
60
80
100
120
140
160
1990
19
92
1994
19
96
1998
20
00
2002
20
04
2006
20
08
Billions of dollars U
.S. T
rade
in G
oods
wit
h Ja
pan
4.61
4.
56
4.36
4.
38
4.92
0 1 2 3 4 5 6
2004
20
05
2006
20
07
2008
Trillions of dollars
Japa
n's
Impo
rts
Rel
ativ
e to
GD
P

90 U.S. Department of Commerce, International Trade Administration
COUNTRY FACT SHEET: MALAYSIA
U.S. Ambassador to Malaysia: James KeithMalaysian Ambassador to the United States: Jamaluddin Jarjis
PROFILEPopulation: 27.3 million Next Election Scheduled: June 2013Capital: Kuala Lumpur Head of Government: Najib Tun RazakGovernment: Constitutional Monarchy (Prime Minister) with Parliamentary Structure
ECONOMY• 2008 Nominal GDP (Current US$ billions): 222.2 • 2008 Nominal GDP Per Capita (Current US$): 8,118
2006 2007 2008Real GDP Growth Rate (%) 5.8 6.2 4.6Real GDP Per Capita Growth Rate (%) 4.1 4.4 2.9CPI (%) 3.6 2.0 5.4Unemployment (%)
‡ 3.3 3.2 3.3
• Economic Mix in 2007†: 28% Manufacturing; 42% Services; 10% Agriculture.
FOREIGN MERCHANDISE TRADE (US$ billions) 2006 2007 2008Malaysia Exports to World 160.8 176.3 199.8Malaysia Imports from World 131.2 147.1 157.1U.S. Exports to Malaysia 12.4 11.7 12.9U.S. Imports from Malaysia 36.5 32.6 30.7U.S. Trade Balance with Malaysia –24.1 –20.9 –17.8
• Rank of Malaysia as U.S. Export Market in 2008: 21st Largest (1.0% of U.S. exports).• Rank of Malaysia as Source of U.S. Imports in 2008: 15th Largest (1.5% of U.S. imports).• Principal U.S. Exports to Malaysia in 2008: Electrical Machinery (57%); Machinery (12%); Optical,
Medical Instruments (5%); Iron and Steel (4%); Aircraft, Spacecraft (3%).• Principal U.S. Imports from Malaysia in 2008: Machinery (39%); Electrical Machinery (34%); Fats
and Oils (4%); Optical, Medical Instruments (4%); Rubber (3%).
FOREIGN DIRECT INVESTMENT (US$ millions) 2006 2007 2008U.S. FDI in Malaysia 11,185 13,037 13,291FDI into U.S. from Malaysia 488 490 395• Principal Foreign Investors in Malaysia: United States, Singapore, Netherlands, Japan, Australia.
DOING BUSINESS Ranking• World Bank Doing Business in 2010 Rank: 23 of 183 (20 in 2009).
COMMERCIAL OFFICER INFORMATION Senior Commercial Officer: Nasir Abbasi Commerce Desk Officer: Michael Hogge (202) 482-1405

91 Top U.S. Export Markets 2009
U.S
. Tra
de in
Goo
ds w
ith
Mal
aysi
a
U.S
. Exp
orts
U.S
. Im
por
ts
0510152025303540
1990
1992
1994
1996
1998
2000
2002
2004
2006
2008
Billio
ns of
dolla
rs
Mal
aysi
a's
Imp
orts
Rel
ativ
e to
GD
P
125
138
157
187
222
050100
150
200
250
2004
2005
2006
2007
2008
Billio
ns of
dolla
rs
GD
PTo
tal i
mp
orts
Imp
orts
from
the
Un
ited
Sta
tes
Billions of dollars
Percent
U.S
. Mar
ket S
har
e of
Lead
ing
U.S
. Exp
orts
to M
alay
sia
0510152025303540
Inte
grat
edci
rcu
its
Ferr
ous
was
te, s
crap
Sem
i-co
nd
uct
ors
O�
cem
ach
ine
par
ts
Civ
ilian
airc
raft
8542
7204
8541
8473
8802
HS
Com
mod
ity
Perc
ent
8800
8473
2710
2701
8471
8431
8517
8542
3004
8443
HS
Com
mod
ity
0 2
4 6
Inte
grat
ed c
ircu
its
(+23
%)
Ferr
ous
was
te, s
crap
(+4
5%)
Sem
icon
du
ctor
s (+
6%)
O�
ce m
ach
ine
par
ts (
+7%
)
Non
-pow
ered
air
craf
t (-3
2%)
Osc
illos
cop
es, s
pec
tru
m a
nal
. (-1
7%)
AD
P m
ach
ines
(-1
5%)
Ele
c. a
pp
ar. f
or te
lep
hon
es (
-12%
)
Ele
ctri
c ge
ner
atin
g se
ts (
+370
%)
Ele
c. m
ach
. w/i
nd
iv. f
un
ctio
ns
(-42
%)
8542 7204 8541 8473 8800 9030 8471 8517 8502 8543
Bill
ion
s of
dol
lars
HS Commodity
Lead
ing
U.S
. Exp
orts
to M
alay
sia
in 2
008
and
Ch
ange
from
200
7
Billions of dollars

92 U.S. Department of Commerce, International Trade Administration
COUNTRY FACT SHEET: MEXICO
U.S. Ambassador to Mexico: Carlos Pascual Mexican Ambassador to the United States: Arturo Sarukhán
PROFILEPopulation: 106.7 million Next Election Scheduled: 2012Capital: Mexico City Head of Government: Felipe Calderón Government: Federal Republic (President)
ECONOMY• 2008 Nominal GDP (Current US$ billions): 1,088.1• 2008 Nominal GDP Per Capita (Current US$): 10,200
2006 2007 2008Real GDP Growth Rate (%) 5.1 3.3 1.3Real GDP Per Capita Growth Rate (%) 4.0 2.4 0.5CPI (%) 3.6 4.0 5.1Unemployment (%)
‡ 3.6 3.7 4.0
• Economic Mix in 2007†: 19% Manufacturing; 60% Services; 4% Agriculture.
FOREIGN MERCHANDISE TRADE (US$ billions) 2006 2007 2008Mexico Exports to World 250.0 272.0 292.7Mexico Imports from World 256.1 282.0 308.8U.S. Exports to Mexico 133.7 135.9 151.2U.S. Imports from Mexico 198.3 210.7 215.9U.S. Trade Balance with Mexico –64.6 –74.8 –64.7
• Rank of Mexico as U.S. Export Market in 2008: 2nd Largest (11.8% of U.S. exports).• Rank of Mexico as Source of U.S. Imports in 2008: 3rd Largest (10.3% of U.S. imports).• Principal U.S. Exports to Mexico in 2008: Electrical Machinery (16%); Nuclear Reactors, Boilers,
Machinery (15%); Vehicles (9%); Mineral Fuel, Oil (7%).• Principal U.S. Imports from Mexico in 2008: Electrical Machinery (25%); Mineral Fuel, Oil (19%);
Vehicles (15%); Nuclear Reactors, Boilers, Machinery (11%).
FOREIGN DIRECT INVESTMENT (US$ billions) 2006 2007 2008U.S. FDI in Mexico 83.0 91.3 95.6FDI into U.S. from Mexico 5.3 6.3 7.9• Principal Suppliers of Foreign Investment to Mexico: United States, Spain, Netherlands, Canada,
United Kingdom.
DOING BUSINESS RANKING• World Bank Doing Business in 2010 Rank: 51 of 183 (55 in 2009).
COMMERCIAL OFFICER INFORMATIONSenior Commercial Officer: Ann BacherCommerce Desk Officer: David Olsen (202) 482-0507

93 Top U.S. Export Markets 2009
U.S
. Tra
de in
Goo
ds w
ith
Mex
ico
U.S
. Exp
orts
U.S
. Im
por
ts
050100
150
200
250
1990
1992
1994
1996
1998
2000
2002
2004
2006
2008
Billio
ns of
dolla
rs
Mex
ico'
s Im
por
ts R
elat
ive
to G
DP
0.8
0.8
1.0
1.0
1.1
0
0.2
0.4
0.6
0.81
1.2
2004
2005
2006
2007
2008
Trilli
ons o
f doll
ars
GD
PTo
tal i
mp
orts
Imp
orts
from
the
Un
ited
Sta
tes
Billions of dollars
Trillions of dollarsHS Commodity8544 1005 8536 8471 8517 8473 8542 8703 8708 2710
Lead
ing
U.S
. Exp
orts
to M
exic
o in
200
8an
d C
han
ge fr
om 2
007
01
23
45
67
89
10
Re�
ned
pet
role
um
(+7
1%)
Mot
or v
ehic
le p
arts
(+3
%)
Pass
enge
r ve
hic
les
(+10
%)
Inte
grat
ed c
ircu
its
(+1%
)
O�
ce m
ach
ine
par
ts (
+15%
)
Ele
c. a
pp
ar. f
or te
lep
hon
es (
+37%
)
AD
P m
ach
ines
(+2
%)
Ele
c. a
pp
ar. f
or s
wit
chin
g (-
4%)
Cor
n (
+52%
)
Insu
late
d w
ire,
cab
le (
-5%
)
2710
8708
8703
8542
8473
8517
8471
8536
1005
8544
HS
Com
mod
ity
Bill
ion
s of
dol
lars
Percent
U.S
. Mar
ket S
har
e of
Lead
ing
U.S
. Exp
orts
to M
exic
o
010203040506070
Re�
ned
pet
role
um
M
otor
veh
icle
par
ts
Pass
enge
rve
hic
les
Inte
grat
edci
rcu
its
O�
cem
ach
ine
par
ts
271
0 8
708
870
3 8
542
847
3H
S C
omm
odit
y
Perc
ent

94 U.S. Department of Commerce, International Trade Administration
COUNTRY FACT SHEET: THE NETHERLANDS
U.S. Ambassador to the Netherlands: Fay Hartog LevinAmbassador of the Netherlands to the United States: Renée Jones-Bos
PROFILEPopulation: 16.7 million Next Election Scheduled: May 2011Capital: The Hague Head of Government: Jan Peter BalkenendeGovernment: Constitutional Monarchy (Prime Minister)
ECONOMY• 2008 Nominal GDP (Current US$ billions): 877.0 • 2008 Nominal GDP Per Capita (Current US$): 52,500
2006 2007 2008Real GDP Growth Rate (%) 3.4 3.6 2.0Real GDP Per Capita Growth Rate (%) 4.9 1.9 1.5CPI (%) 1.7 1.6 2.2Unemployment (%) 3.9 3.2 2.8
• Economic Mix in 2006†: 74% Services; 13% Manufacturing; 2% Agriculture.
FOREIGN MERCHANDISE TRADE (US$ billions) 2006 2007 2008 Netherlands Exports to World 464.0 551.8 638.5 Netherlands Imports from World 417.2 493.4 581.5 U.S. Exports to the Netherlands 31.0 32.8 39.7 U.S. Imports from the Netherlands 17.3 18.4 21.1 U.S. Trade Balance with the Netherlands 13.7 14.4 18.6
• Rank of the Netherlands as U.S. Export Market in 2008: 7th Largest (3.1% of U.S. exports).• Rank of the Netherlands as Source of U.S. Imports in 2008: 22nd Largest (1% of U.S. imports).• Principal U.S. Exports to the Netherlands in 2008: Mineral Fuel (14%); Optical, Medical
Instruments (13%); Machinery (12%); Pharmaceuticals (11%); Electrical Machinery (9%).• Principal U.S. Imports from the Netherlands in 2008: Minerals Fuels, Oils (27%); Special Other
(15%); Machinery (12%); Beverages (7%); Inorganic Chemicals (5%).
FOREIGN DIRECT INVESTMENT (US$ billions) 2006 2007 2008 U.S. FDI in the Netherlands 279.4 389.4 442.9 FDI into U.S. from the Netherlands 182.0 208.2 259.4 • Principal Suppliers of Foreign Investment to the Netherlands: United States, Japan, United
Kingdom, Germany, Sweden.
DOING BUSINESS RANKING• World Bank Doing Business in 2010 Rank: 30 of 183 (28 in 2009).
COMMERCIAL OFFICER INFORMATIONSenior Commercial Officer: Maria AndrewsCommerce Desk Officer: Donald Calvert (202) 482-9128

95 Top U.S. Export Markets 2009
U.S
. Tra
de in
Goo
ds w
ith
the
Net
her
lan
ds
U.S
. Exp
orts
U.S
. Im
por
ts
051015202530354045
1990
1992
1994
1996
1998
2000
2002
2004
2006
2008
Billio
ns of
dolla
rs
�e
Net
her
lan
ds’ I
mp
orts
Rel
ativ
e to
GD
P
611
640
678
777
869
0
100
200
300
400
500
600
700
800
900
1,00
0
2004
2005
2006
2007
2008
Billio
ns of
dolla
rs
GD
PTo
tal i
mp
orts
Imp
orts
from
the
Un
ited
Sta
tes
Billions of dollars
Billions of dollars
HS Commodity8473 8471 9021 3002 3824 8800 9018 8517 3004 2710
Lead
ing
U.S
. Exp
orts
to th
e N
eth
erla
nds
in 2
008
and
Ch
ange
from
200
70
12
34
56
Re�
ned
pet
role
um
(+1
94%
)
Ph
arm
aceu
tica
ls in
dos
ages
(+1
0%)
Ele
c. a
pp
ar. f
or te
lep
hon
es (
-1%
)
Med
ical
inst
rum
ents
(+1
1%)
Non
-pow
ered
air
craf
t (+
16%
)
Ch
emic
al b
ind
ers
(+18
6%)
Blo
od, a
nti
sera
, vac
cin
es (
+24%
)
Ort
hop
edic
dev
ices
(+6
7%)
AD
P m
ach
ines
(+5
%)
O�
ce m
ach
ine
par
ts (
+41%
)
2710
3004
8517
9018
8800
3824
3002
9021
8471
8473
HS
Com
mod
ity
Bill
ion
s of
dol
lars
Percent
U.S
. Mar
ket S
har
e of
Lead
ing
U.S
. Exp
orts
to th
e N
eth
erla
nds
0
102030405060708090
Re�
ned
pet
role
um
P
har
mac
eu-
tica
ls in
dos
ages
Ele
c. a
pp
ar.
for
tele
ph
ones
M
edic
alin
stru
men
ts
Civ
ilian
airc
raft
2710
3004
8517
9018
8802
HS
Com
mod
ity
Perc
ent

96 U.S. Department of Commerce, International Trade Administration
COUNTRY FACT SHEET: NETHERLANDS ANTILLES
U.S. Consulate General to the Netherlands Antilles: Timothy J. DunnNetherlands Antilles Minister Plenipotentiary to the United States: Norberto Vieira-Ribeiro
PROFILEPopulation: 0.2 million* Next Election Scheduled: 2010Capital: Willemstad Head of Government: Emily S. de Jongh-ElhageGovernment: Parliamentary (Prime Minister)
ECONOMY• 2008 Nominal GDP (Current US$ billions): 4.0‡• • 2008 Nominal GDP Per Capita (Current US$): 20,408‡•
2006 2007 2008Real GDP Growth Rate (%)
‡ 2.4 3.7 1.9‡•
Real GDP Per Capita Growth Rate (%)‡
0.1 6.2 6.1‡•
CPI (%)‡ 3.1 3.0 6.9
Unemployment (%)‡ 11.3 9.9 N/A
• Economic Mix in 2006: N/A
FOREIGN MERCHANDISE TRADE (US$ billions) 2006 2007 2008Netherlands Antilles Exports to World‡ 0.7 1.0 0.7Netherlands Antilles Imports from World‡ 2.2 3.0 3.1U.S. Exports to the Netherlands Antilles 1.5 2.1 3.0U.S. Imports from the Netherlands Antilles 1.1 0.8 0.8U.S. Trade Balance with the Netherlands Antilles 0.4 1.3 2.2
• Rank of the Netherlands Antilles as U.S. Export Market in 2008: 48th Largest (0.23% of U.S. exports).
• Rank of the Netherlands Antilles as Source of U.S. Imports in 2008: 83rd Largest (0.04% of U.S. imports).
• Principal Exports to the Netherlands Antilles in 2008: Mineral Fuel, Oil (49%); Precious Stones (18%); Machinery (5%); Electrical Machinery (3%); Ships and Boats (3%).
• Principal Imports from the Netherlands Antilles in 2008: Mineral Fuel, Oil (72%); Precious Stones (3%); Organic Chemicals (1%); Electrical Machinery (1%); Salt, Sulfur, Earth, Stones (0.4%).
FOREIGN DIRECT INVESTMENT (US$ billions) 2006 2007 2008U.S. FDI in the Netherlands Antilles 3.9 6.5 11.5FDI into U.S. from the Netherlands Antilles 4.7 5.6 6.3
• Principal Suppliers of Foreign Investment to Netherlands Antilles: United States, Netherlands, Cayman Islands, Switzerland, Spain, Canada.
DOING BUSINESS RANKING• World Bank Doing Business in 2009 Rank: N/A
COMMERCIAL OFFICER INFORMATIONConsular, Political, Economic Officer: James E. HoganCommerce Desk Officer: Michelle Brooks (202) 482-4157

97 Top U.S. Export Markets 2009
GD
PTo
tal i
mp
orts
Imp
orts
from
the
Un
ited
Sta
tes
HS Commodity8517 8471 8703 8525 2909 7102 8903 7116 7113 2710
Lead
ing
U.S
. Exp
orts
to th
e N
eth
erla
nds
An
till
es in
200
8 an
d C
han
ge fr
om 2
007
00.
20.
40.
60.
81
1.2
1.4
1.6
Re�
ned
pet
role
um
(+7
2%)
Jew
elry
w/p
reci
ous
met
als
(+18
%)
Jew
elry
w/p
earl
s (+
5%)
Ple
asu
re b
oats
(+1
66%
)
Dia
mon
ds
(-14
%)
Eth
ers,
alc
ohol
s (-
12%
)
Tra
nsm
issi
on e
qp
t. fo
r te
leco
m (
-14%
)
Pass
enge
r ve
hic
les
(-11
%)
AD
P m
ach
ines
(+3
3%)
Ele
c. a
pp
ar. f
or te
lep
hon
es (
+16%
)
271
0
711
3
711
6
890
3
7102
290
9
852
5
870
3
847
1
851
7
HS
Com
mod
ity
Bill
ion
s of
dol
lars
Percent
U.S
. Mar
ket S
har
e of
Lead
ing
U.S
. Exp
orts
to th
e N
eth
erla
nds
An
till
es
0102030405060708090100
Re�
ned
pet
role
um
Jew
elry
w/
pre
ciou
sm
etal
s Je
wel
ry w
/p
earl
s P
leas
ure
boa
ts
Dia
mon
ds
2710
7113
7116
8903
7102
HS
Com
mod
ity
Perc
ent
8800
8473
2710
2701
8471
8431
8517
8542
3004
8443
HS
Com
mod
ity
U.S
. Exp
orts
U.S
. Im
por
ts
0
0.5 1
1.5 2
2.5 3
3.5
1990
19
92
1994
19
96
1998
20
00
2002
20
04
2006
20
08
Billions of dollars U
.S. T
rade
in G
oods
wit
h th
e N
eth
erla
nds
An
till
es
3.1
3.3
3.4
3.7
4.0
0 2 4 6 8 10
12
14
16
18
2004
20
05
2006
20
07
2008
Billions of dollars
�e
Net
her
lan
ds A
nti
lles
' Im
port
s R
elat
ive
to G
DP

98 U.S. Department of Commerce, International Trade Administration
COUNTRY FACT SHEET: NIGERIA
U.S. Ambassador to Nigeria: Robin Renèe Sanders Nigerian Chargé d’Affaires to the United States: Babagana Wakil
PROFILEPopulation: 147.8 million* Next Election Scheduled: Spring 2011Capital: Abuja Head of Government: Umaru Yar’AduaGovernment: Federal Republic (President)
ECONOMY• 2008 Nominal GDP (Current US$ billions): 207.1• 2008 Nominal GDP Per Capita (Current US$): 1,401*
2006 2007 2008Real GDP Growth Rate (%) 6.2 7.0 6.0Real GDP Per Capita Growth Rate (%) 3.4 4.1* 3.1*CPI (%) 8.2 5.4 11.6Unemployment (%) N/A N/A N/A
• Economic Mix in 2008†: N/A Manufacturing; 28% Services; 31% Agriculture.
FOREIGN MERCHANDISE TRADE (US$ billions) 2006 2007 2008 Nigeria Exports to World 59.2 54.0 80.8Nigeria Imports from World 22.9 32.4 27.8U.S. Exports to Nigeria 2.2 2.8 4.1U.S. Imports from Nigeria 27.9 32.8 38.1U.S. Trade Balance with Nigeria –25.7 –30.0 –34.0
• Rank of Nigeria as U.S. Export Market in 2008: 44th Largest (0.3% of U.S. exports).• Rank of Nigeria as Source of U.S. Imports in 2008: 11th Largest (1.8% of U.S. imports).• Principal U.S. Exports to Nigeria in 2008: Vehicles (24%); Cereals (23%); Machinery (19%); Mineral
Fuel, Oil (10%); Electrical Machinery (5%).• Principal U.S. Imports from Nigeria in 2008: Mineral Fuel, Oil (99%).
FOREIGN DIRECT INVESTMENT (US$ billions) 2006 2007 2008U.S. FDI in Nigeria 1.7 1.4 3.4FDI into U.S. from Nigeria N/A N/A N/A• Principal Suppliers of Foreign Investment to Nigeria: United States, China, United Kingdom.
DOING BUSINESS RANKING• World Bank Doing Business in 2010 Rank: 125 of 183 (120 in 2009).
COMMERCIAL OFFICER INFORMATIONSenior Commercial Officer: Larry FarrisCommerce Desk Officer: Karen Burress (202) 482-5149

99 Top U.S. Export Markets 2009
U.S
. Tra
de in
Goo
ds w
ith
Nig
eria U
.S. E
xpor
ts
U.S
. Im
por
ts
05
10152025303540
1990
1992
1994
1996
1998
2000
2002
2004
2006
2008
Billio
ns of
dolla
rs
Nig
eria
's Im
por
ts R
elat
ive
to G
DP
87
112
147
167
214
050100
150
200
250
2004
2005
2006
2007
2008
Billio
ns of
dolla
rs
GD
PTo
tal i
mp
orts
Imp
orts
from
the
Un
ited
Sta
tes
Billions of dollars
Billions of dollars
HS Commodity8502 8800 8704 1502 8429 8701 8431 2710 8703 1001
Lead
ing
U.S
. Exp
orts
to N
iger
ia in
200
8an
d C
han
ge fr
om 2
007
00.
10.
20.
30.
40.
50.
60.
70.
80.
91
Wh
eat,
mes
lin (
+43%
)
Pass
enge
r ve
hic
les
(+86
%)
Re�
ned
pet
role
um
(+5
53%
)
Part
s fo
r lif
tin
g m
ach
ines
(-2
9%)
Tra
ctor
s (+
100%
)
Bu
lldoz
ers,
gra
der
s (+
118%
)
An
imal
fats
, oils
(+1
52%
)
Tru
cks
(+20
3%)
Non
-pow
ered
air
craf
t (-
56%
)
Ele
ctri
c ge
ner
atin
g se
ts (
+1,1
59%
)
100
1
870
3
271
0
843
1
870
1
842
9
150
2
870
4
8800
850
2
HS
Com
mod
ity
Bill
ion
s of
dol
lars
Percent
U.S
. Mar
ket S
har
e of
Lead
ing
U.S
. Exp
orts
to N
iger
ia
05101520253035404550
Wh
eat,
mes
lin
Pass
enge
rve
hic
les
Re�
ned
pet
role
um
Part
s fo
rlif
tin
gm
ach
ines
Tra
ctor
s
100
1 8
703
271
0 8
431
870
1H
S C
omm
odit
y
Perc
ent
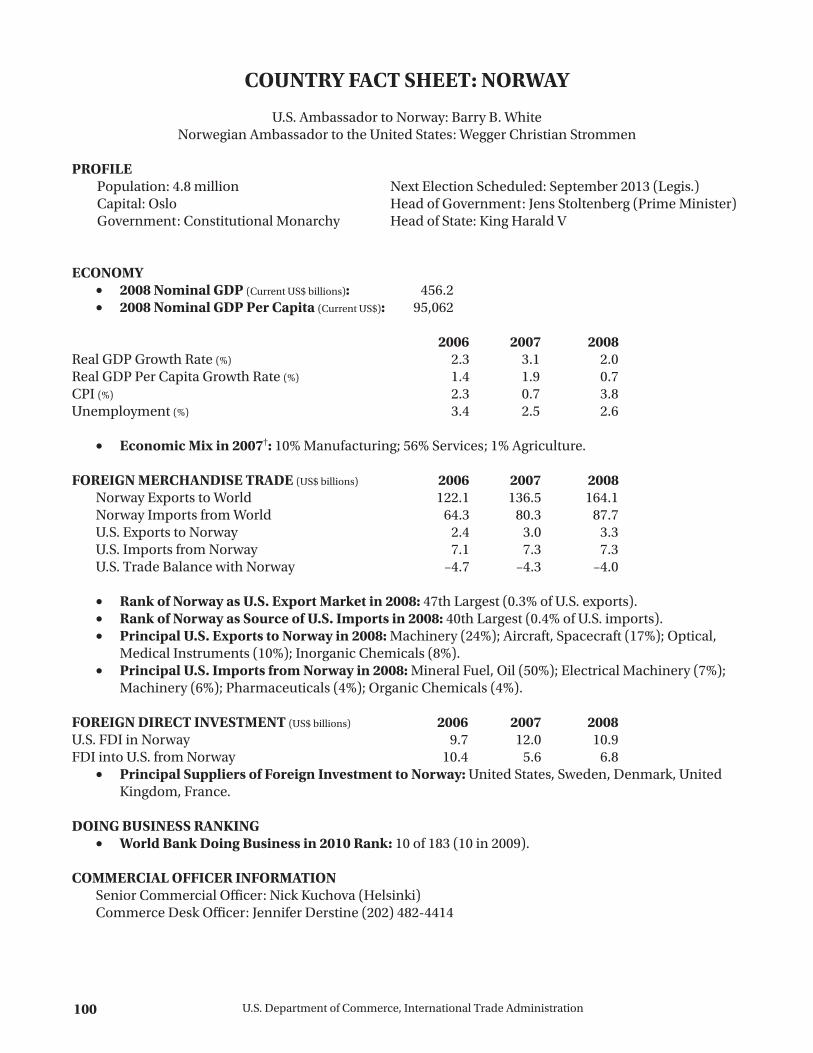
100 U.S. Department of Commerce, International Trade Administration
COUNTRY FACT SHEET: NORWAY
U.S. Ambassador to Norway: Barry B. WhiteNorwegian Ambassador to the United States: Wegger Christian Strommen
PROFILEPopulation: 4.8 million Next Election Scheduled: September 2013 (Legis.) Capital: Oslo Head of Government: Jens Stoltenberg (Prime Minister)Government: Constitutional Monarchy Head of State: King Harald V
ECONOMY• 2008 Nominal GDP (Current US$ billions): 456.2 • 2008 Nominal GDP Per Capita (Current US$): 95,062
2006 2007 2008Real GDP Growth Rate (%) 2.3 3.1 2.0Real GDP Per Capita Growth Rate (%) 1.4 1.9 0.7CPI (%) 2.3 0.7 3.8Unemployment (%) 3.4 2.5 2.6
• Economic Mix in 2007†: 10% Manufacturing; 56% Services; 1% Agriculture.
FOREIGN MERCHANDISE TRADE (US$ billions) 2006 2007 2008Norway Exports to World 122.1 136.5 164.1Norway Imports from World 64.3 80.3 87.7U.S. Exports to Norway 2.4 3.0 3.3U.S. Imports from Norway 7.1 7.3 7.3U.S. Trade Balance with Norway –4.7 –4.3 –4.0
• Rank of Norway as U.S. Export Market in 2008: 47th Largest (0.3% of U.S. exports).• Rank of Norway as Source of U.S. Imports in 2008: 40th Largest (0.4% of U.S. imports).• Principal U.S. Exports to Norway in 2008: Machinery (24%); Aircraft, Spacecraft (17%); Optical,
Medical Instruments (10%); Inorganic Chemicals (8%).• Principal U.S. Imports from Norway in 2008: Mineral Fuel, Oil (50%); Electrical Machinery (7%);
Machinery (6%); Pharmaceuticals (4%); Organic Chemicals (4%).
FOREIGN DIRECT INVESTMENT (US$ billions) 2006 2007 2008U.S. FDI in Norway 9.7 12.0 10.9FDI into U.S. from Norway 10.4 5.6 6.8
• Principal Suppliers of Foreign Investment to Norway: United States, Sweden, Denmark, United Kingdom, France.
DOING BUSINESS RANKING• World Bank Doing Business in 2010 Rank: 10 of 183 (10 in 2009).
COMMERCIAL OFFICER INFORMATIONSenior Commercial Officer: Nick Kuchova (Helsinki)Commerce Desk Officer: Jennifer Derstine (202) 482-4414
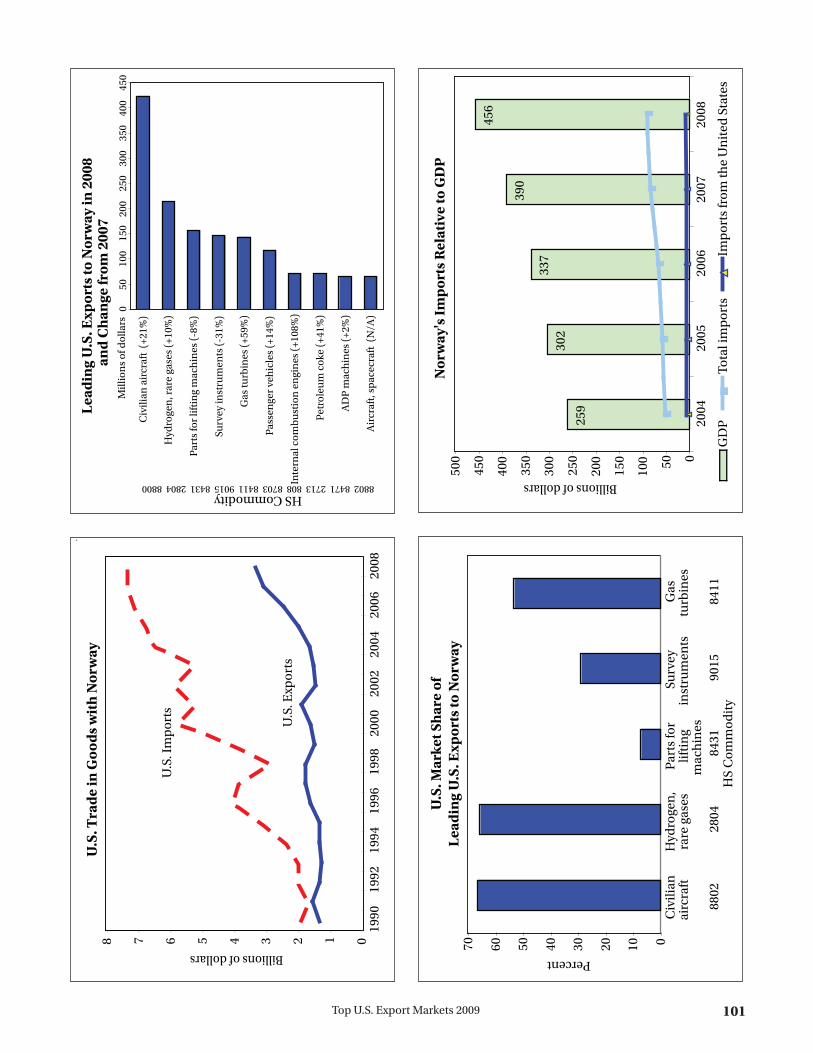
101 Top U.S. Export Markets 2009
U.S
. Tra
de in
Goo
ds w
ith
Nor
way
U.S
. Exp
orts
U.S
. Im
por
ts
012345678
1990
1992
1994
1996
1998
2000
2002
2004
2006
2008
Billio
ns of
dolla
rs
Nor
way
's Im
por
ts R
elat
ive
to G
DP
259
302
337
390
456
050
100
150
200
250
300
350
400
450
500
2004
2005
2006
2007
2008
Billio
ns of
dolla
rs
GD
PTo
tal i
mp
orts
Imp
orts
from
the
Un
ited
Sta
tes
Billions of dollars
Billions of dollars
HS Commodity8802 8471 2713 808 8703 8411 9015 8431 2804 8800
Lead
ing
U.S
. Exp
orts
to N
orw
ay in
200
8an
d C
han
ge fr
om 2
007
050
100
150
200
250
300
350
400
450
Civ
ilian
air
craf
t (+
21%
)
Hyd
roge
n, r
are
gase
s (+
10%
)
Part
s fo
r lif
tin
g m
ach
ines
(-8
%)
Surv
ey in
stru
men
ts (
-31%
)
Gas
turb
ines
(+5
9%)
Pass
enge
r ve
hic
les
(+14
%)
Inte
rnal
com
bust
ion
en
gin
es (
+108
%)
Pet
role
um
cok
e (+
41%
)
AD
P m
ach
ines
(+2
%)
Air
craf
t, sp
acec
raft
(N
/A)
8800
2804
8431
9015
8411
8703
8408
2713
8471
8802
HS
Com
mod
ity
Mill
ion
s of
dol
lars
Percent
U.S
. Mar
ket S
har
e of
Lead
ing
U.S
. Exp
orts
to N
orw
ay
010203040506070
Civ
ilian
airc
raft
H
ydro
gen
,ra
re g
ases
Part
s fo
rlif
tin
gm
ach
ines
Surv
eyin
stru
men
ts
Gas
turb
ines
8802
280
4 8
431
901
5 8
411
HS
Com
mod
ity
Perc
ent

102 U.S. Department of Commerce, International Trade Administration
COUNTRY FACT SHEET: PANAMA
U.S. Ambassador to Panama: Barbara J. StephensonPanamanian Ambassador to the United States: Jaime Aleman
PROFILEPopulation: 3.4 million* Next Election Scheduled: May 3, 2013Capital: Panama City Head of Government: Ricardo Martinelli Government: Constitutional Democracy (President)
ECONOMY• 2008 Nominal GDP (Current US$ billions): 23.1*• 2008 Nominal GDP Per Capita (Current US$): 6,784*
2006 2007 2008Real GDP Growth Rate (%) 8.5 11.5 9.2Real GDP Per Capita Growth Rate (%)* 6.7 9.6 7.3CPI (%) 2.5 4.2 8.8Unemployment (%) 8.2 5.7 5.6§§
• Economic Mix in 2007†: 7% Manufacturing; 77% Services; 7% Agriculture.
FOREIGN MERCHANDISE TRADE (US$ billions) 2006 2007 2008Panama Exports to World 1.0 1.1 1.1Panama Imports from World 4.7 6.7 8.9U.S. Exports to Panama 2.7 3.7 4.9U.S. Imports from Panama 0.4 0.4 0.4U.S. Trade Balance with Panama 2.3 3.3 4.5
• Rank of Panama as U.S. Export Market in 2008: 40th Largest (0.38% of U.S. exports).• Rank of Panama as Source of U.S. Imports in 2008: 97th Largest (0.02% of U.S. imports).• Principal U.S. Exports to Panama in 2008: Mineral Fuel, Oil (37%); Machinery (11%); Electrical
Machinery (7%); Vehicles (5%); Aircraft (4%).• Principal U.S. Imports from Panama in 2008: Fish, Seafood (26%); Precious Stones (12%); Mineral
Fuel, Oil (9%); Sugars (4%); Coffee, Tea (4%); Edible Fruit, Nuts (3%); Aluminum (2%); Electrical Machinery (2%).
FOREIGN DIRECT INVESTMENT (US$ billions) 2006 2007 2008U.S. FDI in Panama 4.6 6.5 7.2FDI into U.S. from Panama 11.9 1.0 0.9• Principal Suppliers of Foreign Investment to Panama: Spain, Hong Kong, United States, South
Korea, Japan.
DOING BUSINESS RANKING• World Bank Doing Business in 2010 Rank: 77 of 183 (83 in 2009).
COMMERCIAL OFFICER INFORMATIONSenior Commercial Officer: Daniel CrockerCommerce Desk Officer: Leah Markowitz (202) 482-0621

103 Top U.S. Export Markets 2009
U.S
. Tra
de in
Goo
ds w
ith
Pan
ama
U.S
. Exp
orts
U.S
. Im
por
ts
0123456
1990
1992
1994
1996
1998
2000
2002
2004
2006
2008
Billio
ns of
dolla
rs
Pan
ama'
s Im
por
ts R
elat
ive
to G
DP
1415
17
19
23
0510152025
2004
2005
2006
2007
2008
Billio
ns of
dolla
rs
GD
PTo
tal i
mp
orts
Imp
orts
from
the
Un
ited
Sta
tes
Billions of dollars
Billions of dollars
HS Commodity8525 2304 8517 9504 3303 8471 1005 8703 8800 2710
Lead
ing
U.S
. Exp
orts
to P
anam
a in
200
8an
d C
han
ge fr
om 2
007
00.
20.
40.
60.
81
1.2
1.4
1.6
1.8
2
Re�
ned
pet
role
um
(+5
5%)
Civ
ilian
air
craf
t (-9
%)
Pass
enge
r ve
hic
les
(+53
%)
Cor
n (
+50%
)
AD
P m
ach
ines
(+1
0%)
Per
fum
e, to
ilet w
ater
s (+
12%
)
Gam
es (
+81%
)
Ele
c. a
pp
ar. f
or te
lep
hon
es (
+59%
)
Soyb
ean
oilc
ake
(+43
%)
Tra
nsm
issi
on e
qp
t. fo
r te
leco
m (
+73%
)
2710
8800
8703
1005
8471
3303
9504
8517
2304
8525
HS
Com
mod
ity
Bill
ion
s of
dol
lars
Percent
U.S
. Mar
ket S
har
e of
Lead
ing
U.S
. Exp
orts
to P
anam
a
0102030405060708090100
Re�
ned
pet
role
um
Civ
ilian
airc
raft
Pa
ssen
ger
veh
icle
s C
orn
A
DP
mac
hin
es
2710
8802
8703
1005
8471
HS
Com
mod
ity
Perc
ent

104 U.S. Department of Commerce, International Trade Administration
COUNTRY FACT SHEET: PERU
U.S. Ambassador to Peru: P. Michael McKinleyPeruvian Ambassador to the United States: Luis Valdivieso Montano
PROFILEPopulation: 28.7 million* Next Election Scheduled: Spring 2011Capital: Lima Head of Government: Alan García PérezGovernment: Constitutional Republic (President)
ECONOMY• 2008 Nominal GDP (Current US$ billions): 127.5• 2008 Nominal GDP Per Capita (Current US$): 4,448*
2006 2007 2008 Real GDP Growth Rate (%) 7.7 8.9 9.8 Real GDP Per Capita Growth Rate (%) 6.1 6.6 8.2* CPI (%) 2.0 1.8 5.8 Unemployment (%)
‡ 7.5 6.9 8.1
• Economic Mix in 2008†: 16% Manufacturing; 55% Services; 7% Agriculture.
FOREIGN MERCHANDISE TRADE (US$ billions) 2006 2007 2008 Peru Exports to World 23.4 27.6 31.2 Peru Imports from World 15.3 20.5 30.0 U.S. Exports to Peru 2.9 4.1 6.2 U.S. Imports from Peru 5.9 5.3 5.8 U.S. Trade Balance with Peru –3.0 –1.2 0.4
• Rank of Peru as U.S. Export Market in 2008: 35th Largest (0.5% of U.S. exports).• Rank of Peru as Source of U.S. Imports in 2008: 46th Largest (0.3% of U.S. imports).• Principal U.S. Exports to Peru in 2008: Machinery (26%); Mineral Fuel, Oil (19%); Plastics (8%);
Electrical Machinery (9%); Vehicles (4%).• Principal U.S. Imports from Peru in 2007: Copper (16%); Precious Stones, Metals (17%); Mineral
Fuel, Oil (21%); Knit Apparel (13%); Tin (5%).
FOREIGN DIRECT INVESTMENT (US$ billions) 2006 2007 2008U.S. FDI in Peru 5.6 7.6 8.5FDI into U.S. from Peru (D) –0.1 0.0• Principal Suppliers of Foreign Investment to Peru: Spain, United Kingdom, United States,
Netherlands.
DOING BUSINESS RANKING• World Bank Doing Business in 2010 Rank: 56 of 183 (65 in 2009)
COMMERCIAL OFFICER INFORMATIONSenior Commercial Officer: John SimmonsCommerce Desk Officer: Judy Lao (202) 482-1536

105 Top U.S. Export Markets 2009
U.S
. Tra
de in
Goo
ds w
ith
Per
u
U.S
. Exp
orts
U.S
. Im
por
ts
01234567
1990
1992
1994
1996
1998
2000
2002
2004
2006
2008
Billio
ns of
dolla
rs
Per
u's
Imp
orts
Rel
ativ
e to
GD
P
7079
92
107
128
020406080100
120
140
2004
2005
2006
2007
2008
Billio
ns of
dolla
rs
GD
PTo
tal i
mp
orts
Imp
orts
from
the
Un
ited
Sta
tes
Billions of dollarsHS Commodity3902 3904 1001 8473 3901 8429 8517 8471 8431 2710
Lead
ing
U.S
. Exp
orts
to P
eru
in 2
008
and
Ch
ange
from
200
70
0.2
0.4
0.6
0.8
11.
21.
4
Re�
ned
pet
role
um
(+1
37%
)
Part
s fo
r lif
tin
g m
ach
ines
(+8
4%)
AD
P m
ach
ines
(+4
9%)
Ele
c. a
pp
ar. f
or te
lep
hon
es (
+47%
)
Bu
lldoz
ers,
gra
der
s (+
57%
)
Eth
ylen
e, p
rim
ary
form
(+1
8%)
O�
ce m
ach
ine
par
ts (
+26%
)
Wh
eat,
mes
lin (
-21%
)
Vin
yl c
hlo
rid
e p
olym
ers
(+14
6%)
Ole
�n
pol
ymer
s (+
36%
)
271
0
843
1
847
1
851
7
842
9
390
1
847
3
100
1
390
4
390
2
HS
Com
mod
ity
Bill
ion
s of
dol
lars
Percent
U.S
. Mar
ket S
har
e of
Lead
ing
U.S
. Exp
orts
to P
eru
0102030405060708090
Re�
ned
pet
role
um
Pa
rts
for
lifti
ng
mac
hin
es
AD
Pm
ach
ines
E
lec.
ap
par
.fo
rte
lep
hon
es
Bu
lldoz
ers,
grad
ers
271
0 8
431
847
1 8
517
842
9H
S C
omm
odit
y
Perc
ent
Billions of dollars

106 U.S. Department of Commerce, International Trade Administration
COUNTRY FACT SHEET: THE PHILIPPINES
U.S. Ambassador to the Philippines: Kristie A. KenneyPhilippine Ambassador to the United States: Willy C. Gaa
PROFILEPopulation: 90.5 million Next Election Scheduled: May 2010Capital: Manila Head of Government: Gloria Macapagal-ArroyoGovernment: Republic (President)
ECONOMY• 2008 Nominal GDP (Current US$ billions): 166.9• 2008 Nominal GDP Per Capita (Current US$): 1,845
2006 2007 2008Real GDP Growth Rate (%) 5.3 7.1 3.8Real GDP Per Capita Growth Rate (%) 3.3 5.0 1.8CPI (%) 6.2 2.8 9.3Unemployment (%)
‡ 8.0 7.3 7.4‡•
• Economic Mix in 2008†: 22% Manufacturing; 53% Services; 15% Agriculture.
FOREIGN MERCHANDISE TRADE (US$ billions) 2006 2007 2008Philippine Exports to World 47.0 50.3 49.0Philippine Imports from World 51.5 55.3 56.6U.S. Exports to the Philippines 7.6 7.7 8.3U.S. Imports from the Philippines 9.7 9.4 8.7U.S. Trade Balance with the Philippines –2.1 –1.7 –0.4
• Rank of the Philippines as U.S. Export Market in 2008: 30th Largest (0.6% of U.S. exports).• Rank of the Philippines as Source of U.S. Imports in 2008: 37th Largest (0.4% of U.S. imports).• Principal U.S. Exports to the Philippines in 2008: Electrical Machinery (50%); Cereals (9%);
Machinery (8%); Optical, Medical Instruments (4%); Food Waste, Animal Feed (3%).• Principal U.S. Imports from the Philippines in 2008: Electrical Machinery (41%); Machinery
(12%); Knit Apparel (8%); Woven Apparel (7%); Fats, Oils (5%).
FOREIGN DIRECT INVESTMENT (US$ millions) 2006 2007 2008U.S. FDI in the Philippines 6,948 7,066 5,914FDI into U.S. from the Philippines 55 75 21• Principal Suppliers of Foreign Investment to the Philippines: United States, Japan, United
Kingdom, South Korea.
DOING BUSINESS Ranking• World Bank Doing Business in 2010 Rank: 144 of 183 (140 in 2009).
COMMERCIAL OFFICER INFORMATION Senior Commercial Officer: Patrick Wall Commerce Desk Officer: Michael Hogge (202) 482-1405

107 Top U.S. Export Markets 2009
U.S
. Tra
de in
Goo
ds w
ith
the
Ph
ilip
pin
es
U.S
. Exp
orts
U.S
. Im
por
ts
0246810121416
1990
1992
1994
1996
1998
2000
2002
2004
2006
2008
Billio
ns of
dolla
rs
�e
Ph
ilip
pin
es' I
mp
orts
Rel
ativ
e to
GD
P
8799
118
144
169
020406080100
120
140
160
180
2004
2005
2006
2007
2008
Billio
ns of
dolla
rs
GD
PTo
tal i
mp
orts
Imp
orts
from
the
Un
ited
Sta
tes
Billions of dollars
Billions of dollars
HS Commodity4804 8517 8800 9030 2304 0402 8473 8541 1001 8542
Lead
ing
U.S
. Exp
orts
to th
e P
hil
ippi
nes
in 2
008
and
Ch
ange
from
200
70
0.5
11.
52
2.5
33.
5
Inte
grat
ed c
ircu
its
(-8%
)
Wh
eat,
mes
lin (
+100
%)
Sem
icon
du
ctor
s (-
12%
)
O�
ce m
ach
ine
par
ts (
+90%
)
Milk
, cre
am, c
once
ntr
ated
(+7
2%)
Soyb
ean
oilc
ake
(+35
%)
Osc
illos
cop
es, s
pec
tru
m a
nal
. (-2
3%)
Civ
ilian
air
craf
t (+1
22%
)
Ele
c. a
pp
ar. f
or te
lep
hon
es (
+74%
)
Kra
ft p
aper
, un
coat
ed (
+26%
)
8542
1001
8541
8473
402
2304
9030
8800
8517
4804
HS
Com
mod
ity
Bill
ion
s of
dol
lars
Percent
U.S
. Mar
ket S
har
e of
Lead
ing
U.S
. Exp
orts
to th
e P
hil
ippi
nes
0102030405060708090
Inte
grat
edci
rcu
its
Wh
eat,
mes
lin
Sem
i-co
nd
uct
ors
O�
cem
ach
ine
par
ts
Milk
& c
ream
,co
nce
ntr
ated
854
2 1
001
854
1 8
473
040
2H
S C
omm
odit
y
Perc
ent

108 U.S. Department of Commerce, International Trade Administration
COUNTRY FACT SHEET: POLAND
U.S. Ambassador to Poland: Lee A. FeinsteinPolish Ambassador to the United States: Robert Kupiecki
PROFILEPopulation: 38.1 million Next Election Scheduled: Fall 2010Capital: Warsaw Head of Government: Donald TuskGovernment: Parliamentary Democracy (Prime Minister)
ECONOMY• 2008 Nominal GDP (Current US$ billions): 527.9 • 2008 Nominal GDP Per Capita (Current US$): 13,846
2006 2007 2008Real GDP Growth Rate (%) 6.2 6.8 4.9Real GDP Per Capita Growth Rate (%) 7.9 6.8 4.9CPI (%) 1.0 2.5 4.2Unemployment (%)
‡ 16.2 12.7 9.8
• Economic Mix in 2008†: 17% Manufacturing; 65% Services; 4% Agriculture.
FOREIGN MERCHANDISE TRADE (US$ billions) 2006 2007 2008Poland Exports to World 110.9 140.4 168.7Poland Imports from World 127.2 166.2 205.0U.S. Exports to Poland 2.0 3.1 4.1U.S. Imports from Poland 2.3 2.2 2.6U.S. Trade Balance with Poland –0.3 0.9 1.5
• Rank of Poland as U.S. Export Market in 2008: 43rd Largest (0.3% of U.S. exports).• Rank of Poland as Source of U.S. Imports in 2008: 62nd Largest (0.1% of U.S. imports).• Principal U.S. Exports to Poland in 2008: Aircraft, Spacecraft (30%); Machinery (12%); Vehicles
(11%); Medical Instruments (7%); Mineral Fuel, Oil (6%); Electrical Machinery (6%).• Principal U.S. Imports from Poland in 2008: Machinery (21%); Electrical Machinery (15%);
Furniture, Bedding (8%); Medical Instruments (5%); Beverages (4%).
FOREIGN DIRECT INVESTMENT (US$ billions) 2006 2007 2008U.S. FDI in Poland 6.9 15.2 15.6FDI into U.S. from Poland 4.2 N/A N/A• Principal Suppliers of Foreign Investment to Poland: Netherlands, Germany, France,
Luxembourg, United States.
DOING BUSINESS RANKING• World Bank Doing Business in 2010 Rank: 72 of 183 (72 in 2009).
COMMERCIAL OFFICER INFORMATIONSenior Commercial Officer: Jim WilsonCommerce Desk Officer: Hilleary Smith (202) 482-3684

109 Top U.S. Export Markets 2009
U.S
. Tra
de in
Goo
ds w
ith
Pol
and U
.S. E
xpor
ts
U.S
. Im
por
ts
0
0.51
1.52
2.53
3.54
4.5
1990
1992
1994
1996
1998
2000
2002
2004
2006
2008
Billio
ns of
dolla
rs
Pol
and'
s Im
por
ts R
elat
ive
to G
DP
253
304
342
425
526
0
100
200
300
400
500
600
2004
2005
2006
2007
2008
Billio
ns of
dolla
rs
GD
PTo
tal i
mp
orts
Imp
orts
from
the
Un
ited
Sta
tes
Billions of dollars
Billions of dollars
HS Commodity8517 9018 8708 8471 3004 4703 8800 2701 8703 8802
Lead
ing
U.S
. Exp
orts
to P
olan
d in
200
8an
d C
han
ge fr
om 2
007
00.
20.
40.
60.
81
1.2
Air
craf
t, sp
acec
raft
(+1
7%)
Pass
enge
r ve
hic
les
(+12
1%)
Coa
l (+5
75%
)
Civ
ilian
air
craf
t (+
36%
)
Ch
emic
al w
ood
pu
lp (
+16%
)
Ph
arm
aceu
tica
ls in
dos
ages
(+1
21%
)
AD
P m
ach
ines
(+1
5%)
Mot
or v
ehic
le p
arts
(+2
5%)
Med
ical
inst
rum
ents
(+2
0%)
Ele
c. a
pp
ar. f
or te
lep
hon
es (
+19%
)
880
2
870
3
270
1
880
0
470
3
300
4
8471
870
8
9018
8517
HS
Com
mod
ity
Bill
ion
s of
dol
lars
8800
8473
2710
2701
8471
8431
8517
8542
3004
8443
HS
Com
mod
ity
0 5 10
15
20
25
30
35
Air
craf
t,sp
acec
raft
P
asse
nge
rve
hic
les
C
oal
Ch
emic
alw
ood
pu
lp
Ph
arm
aceu
-ti
cals
ind
osag
es
8802
87
03
2701
47
03
3004
Percent
HS
Com
mod
ity
U.S
. Mar
ket S
har
e of
Lead
ing
U.S
. Exp
orts
to P
olan
d

110 U.S. Department of Commerce, International Trade Administration
COUNTRY FACT SHEET: RUSSIA
U.S. Ambassador to Russia: John R. BeyrleRussian Ambassador to the United States: Sergey I. Kislyak
PROFILEPopulation: 142 million Next Election Scheduled: December 2011Capital: Moscow Head of Government: Vladimir Putin (Prime Minister)Government: Federal Republic Head of State: Dmitry Medvedev (President)
ECONOMY• 2008 Nominal GDP (Current US$ billions): 1,676.6 • 2008 Nominal GDP Per Capita (Current US$): 11,807
2006 2007 2008Real GDP Growth Rate (%) 7.7 8.1 5.6Real GDP Per Capita Growth Rate (%) 8.2 8.6* 5.7*CPI (%) 9.7 9.0 14.1Unemployment (%)‡ 7.2 6.2 6.3
• Economic Mix in 2007†: 19% Manufacturing; 57% Services; 5% Agriculture.
FOREIGN MERCHANDISE TRADE (US$ billions) 2006 2007 2008Russia Exports to World 226.5 279.7 367.6Russia Imports from World 128.2 189.6 255.6U.S. Exports to Russia 4.7 7.3 9.3U.S. Imports from Russia 19.8 19.3 26.8U.S. Trade Balance with Russia –15.1 –12.0 –17.5
• Rank of Russia as U.S. Export Market in 2008: 28th Largest (0.7% of U.S. exports).• Rank of Russia as Source of U.S. Imports in 2008: 17th Largest (1.3% of U.S. imports).• Principal U.S. Exports to Russia in 2008: Vehicles (22%); Machinery (22%); Meat (14%); Electrical
Machinery (6%); Aircraft, Spacecraft (6%).• Principal U.S. Imports from Russia in 2008: Mineral Fuel, Oil (64%); Inorganic Chemicals (6%);
Precious Stones, Metals (6%); Iron, Steel (6%); Fertilizers (4%).
FOREIGN DIRECT INVESTMENT (US$ billions) 2006 2007 2008U.S. FDI in Russia 11.4 14.4 9.2FDI into U.S. from Russia 0.8 0.9 1.7• Principal Suppliers of Foreign Investment to Russia: Luxembourg, Cyprus, Netherlands, United
Kingdom, Germany, United States. DOING BUSINESS RANKING
• World Bank Doing Business in 2010 Rank: 120 of 183 (118 in 2009).
COMMERCIAL OFFICER INFORMATIONSenior Commercial Officer: Beryl BlecherCommerce Desk Officer: Matthew Edwards (202) 482-4365

111 Top U.S. Export Markets 2009
U.S
. Tra
de in
Goo
ds w
ith
Ru
ssia
U.S
. Exp
orts
U.S
. Im
por
ts
051015202530
1990
1992
1994
1996
1998
2000
2002
2004
2006
2008
Billio
ns of
dolla
rs
Ru
ssia
's Im
por
ts R
elat
ive
to G
DP
0.6
0.8
1.0
1.3
1.7
0
0.2
0.4
0.6
0.81
1.2
1.4
1.6
1.8
2004
2005
2006
2007
2008
Trilli
ons o
f doll
ars
GD
PTo
tal i
mp
orts
Imp
orts
from
the
Un
ited
Sta
tes
Trillions of dollars
Billions of dollars
HS Commodity8433 8708 8407 8502 0203 8431 8800 8701 0207 8703
Lead
ing
U.S
. Exp
orts
to R
uss
ia in
200
8an
d C
han
ge fr
om 2
007
00.
20.
40.
60.
81
1.2
Pass
enge
r ve
hic
les
(+42
%)
Pou
ltry
mea
t (+7
%)
Tra
ctor
s (+
48%
)
Civ
ilian
air
craf
t (-2
2%)
Part
s fo
r lif
tin
g m
ach
ines
(+3
%)
Por
k, fr
esh
or
froz
en (
+94%
)
Ele
ctri
c ge
ner
atin
g se
ts (
-19%
)
Han
d to
ols
(+30
%)
Mot
or v
ehic
le p
arts
(+1
80%
)
Har
vest
ing
mac
hin
ery
(+49
%)
870
3
020
7
870
1
88
00
843
1
020
3
850
2
846
7
870
8
843
3
HS
Com
mod
ity
Bill
ion
s of
dol
lars
Percent
U.S
. Mar
ket S
har
e of
Lead
ing
U.S
. Exp
orts
to R
uss
ia
010203040506070
Pass
enge
rve
hic
les
Pou
ltry
mea
t T
ract
ors
Civ
ilian
airc
raft
Pa
rts
for
lifti
ng
mac
hin
es
870
3 0
207
870
188
02 8
431
HS
Com
mod
ity
Perc
ent

112 U.S. Department of Commerce, International Trade Administration
COUNTRY FACT SHEET: SAUDI ARABIA
U.S. Ambassador to Saudi Arabia: James B. Smith Saudi Arabian Ambassador to the United States: Adel Al-Jubeir
PROFILEPopulation: 24.9 million Next Election Scheduled: To Be DeterminedCapital: Riyadh Head of Government: King Abdullah Al-SaudGovernment: Monarchy
ECONOMY• 2008 Nominal GDP (Current US$ billions): 469.4 • 2008 Nominal GDP Per Capita (Current US$): 18,855
2006 2007 2008Real GDP Growth Rate (%) 3.2 3.3 4.4Real GDP Per Capita Growth Rate (%) 0.5 0.8 1.9CPI (%) 2.3 4.1 9.9Unemployment (%) 13.0 13.0 13.0
• Economic Mix in 2008†: 8% Manufacturing; 27% Services; 2% Agriculture.
FOREIGN MERCHANDISE TRADE (US$ billions) 2006 2007 2008Saudi Arabia Exports to World 211.3 234.9 N/ASaudi Arabia Imports from World 69.8 90.2 N/AU.S. Exports to Saudi Arabia 7.6 10.4 12.5U.S. Imports from Saudi Arabia 31.7 35.6 54.7U.S. Trade Balance with Saudi Arabia –24.1 –25.2 –42.3
• Rank of Saudi Arabia as U.S. Export Market in 2008: 23rd Largest (0.97% of U.S. exports).• Rank of Saudi Arabia as Source of U.S. Imports in 2008: 7th Largest (2.6% of U.S. imports).• Principal U.S. Exports to Saudi Arabia in 2008: Vehicles (30%); Machinery (27%); Electrical
Machinery (7%); Aircraft (6%); Medical Instruments (4%).• Principal U.S. Imports from Saudi Arabia in 2008: Mineral Fuel, Oil (99%); Organic Chemicals
(0.4%); Fertilizers (0.4%); Inorganic Chemicals, Rare Earth Metals (0.1%).
FOREIGN DIRECT INVESTMENT (US$ billions) 2006 2007 2008U.S. FDI in Saudi Arabia 4.4 5.0 5.4FDI into U.S. from Saudi Arabia (D) (D) (D)• Principal Suppliers of Foreign Investment to Saudi Arabia: United States, Japan, European Union.
DOING BUSINESS RANKING• World Bank Doing Business in 2010 Rank: 13 of 183 (15 in 2009).
COMMERCIAL OFFICER INFORMATIONSenior Commercial Officer: Amer KayaniCommerce Desk Officer: Steven Garrett (202) 482-2680

113 Top U.S. Export Markets 2009
U.S
. Tra
de in
Goo
ds w
ith
Sau
di A
rabi
a U.S
. Exp
orts
U.S
. Im
por
ts
0102030405060
1990
1992
1994
1996
1998
2000
2002
2004
2006
2008
Billio
ns of
dolla
rs
Sau
di A
rabi
a's
Imp
orts
Rel
ativ
e to
GD
P
251
316
357
382
482
0
100
200
300
400
500
600
2004
2005
2006
2007
2008
Billio
ns of
dolla
rs
GD
PTo
tal i
mp
orts
Imp
orts
from
the
Un
ited
Sta
tes
Billions of dollars
Billions of dollars
HS Commodity8429 8413 7606 8415 8414 8803 8800 8431 8411 8703
Lead
ing
U.S
. Exp
orts
to S
audi
Ara
bia
in 2
008
and
Ch
ange
from
200
70
0.5
11.
52
2.5
33.
5
Pass
enge
r ve
hic
les
(+54
%)
Gas
turb
ines
(-3
7%)
Part
s fo
r lif
tin
g m
ach
ines
(0%
)
Civ
ilian
air
craf
t (+2
7%)
Air
craf
t par
ts (
+285
%)
Pu
mp
s, c
omp
ress
ors,
fan
s (+
41%
)
Air
con
dit
ion
ing
mac
h, p
arts
(+8
2%)
Alu
min
um
pla
tes,
sh
eets
(+8
8%)
Pu
mp
s fo
r liq
uid
s (+
55%
)
Bu
lldoz
ers,
gra
der
s (+
71%
)
8703
8411
8431
8800
8803
8414
8415
7606
8413
8429
HS
Com
mod
ity
Bill
ion
s of
dol
lars
Percent
U.S
. Mar
ket S
har
e of
Lead
ing
U.S
. Exp
orts
to S
audi
Ara
bia
01020304050607080
Pass
enge
rve
hic
les
Gas
turb
ines
Pa
rts
for
lifti
ng
mac
hin
es
Civ
ilian
airc
raft
A
ircr
aft
par
ts
870
3 8
411
843
188
02 8
803
HS
Com
mod
ity
Perc
ent

114 U.S. Department of Commerce, International Trade Administration
COUNTRY FACT SHEET: SINGAPOREU.S. Ambassador to Singapore: Vacant
Singaporean Ambassador to the United States: Chan Heng Chee
PROFILEPopulation: 4.7 million* Next Election Scheduled: August 2011Capital: Singapore Head of Government: Lee Hsien Loong Government: Parliamentary Republic (Prime Minister)
ECONOMY• 2008 Nominal GDP (Current US$ billions): 181.9• 2008 Nominal GDP Per Capita (Current US$): 38,972*
2006 2007 2008Real GDP Growth Rate (%) 8.4 7.8 1.1 Real GDP Per Capita Growth Rate (%) 5.0 3.4 –0.6* CPI (%) 1.0 2.1 6.5 Unemployment (%) 2.7 2.1 2.2
• Economic Mix in 2008†: 21% Manufacturing; 72% Services; 0% Agriculture.
FOREIGN MERCHANDISE TRADE (US$ billions) 2006 2007 2008Singapore Exports to World 271.9 299.4 338.1Singapore Imports from World 238.9 263.2 319.7U.S. Exports to Singapore 23.8 25.6 27.9U.S. Imports from Singapore 17.8 18.4 15.9U.S. Trade Balance with Singapore 6.1 7.2 12.0
• Rank of Singapore as U.S. Export Market in 2008: 12th Largest (2.16% of U.S. exports).• Rank of Singapore as Source of U.S. Imports in 2008: 27th Largest (0.76% of U.S. imports).• Principal U.S. Exports to Singapore in 2008: Machinery (22%); Electrical Machinery (24%);
Aircraft, Spacecraft (14%); Mineral Fuel, Oil (8%); Optical, Medical Instruments (6%).• Principal U.S. Imports from Singapore in 2008: Machinery (34%); Electrical Machinery (19%);
Pharmaceutical Products (12%); Organic Chemicals (9%).
FOREIGN DIRECT INVESTMENT (US$ billions) 2006 2007 2008U.S. FDI in Singapore 81.9 94.8 106.5FDI into U.S. from Singapore 6.5 11.7 12.7• Principal Suppliers of Foreign Investment to Singapore: United Kingdom, United States, Japan.
DOING BUSINESS Ranking• World Bank Doing Business in 2010 Rank: 1 of 183 (1 in 2009).
COMMERCIAL OFFICER INFORMATION Senior Commercial Officer: Daniel Thompson Commerce Desk Officer: Michael Hogge (202) 482-1405

115 Top U.S. Export Markets 2009
U.S
. Tra
de in
Goo
ds w
ith
Sin
gap
ore
U.S
. Exp
orts
U.S
. Im
por
ts
051015202530
1990
1992
1994
1996
1998
2000
2002
2004
2006
2008
Billio
ns of
dolla
rs
Sin
gap
ore'
s Im
por
ts R
elat
ive
to G
DP
110
121
139
167
182
050100
150
200
250
300
350
2004
2005
2006
2007
2008
Billio
ns of
dolla
rs
GD
PTo
tal i
mp
orts
Imp
orts
from
the
Un
ited
Sta
tes
Billions of dollars
Billions of dollars
HS Commodity8541 8517 8543 8471 8486 8473 8431 2710 8542 8800
Lead
ing
U.S
. Exp
orts
to S
inga
por
e in
200
8an
d C
han
ge fr
om 2
007
00.
51
1.5
22.
53
3.5
4
Civ
ilian
air
craf
t (+8
%)
Inte
grat
ed c
ircu
its
(-6%
)
Re�
ned
pet
role
um
(+4
4%)
Part
s fo
r lif
tin
g m
ach
ines
(+2
2%)
O�
ce m
ach
ine
par
ts (
+23%
)
Sem
icon
du
ctor
mfr
. mac
h. (
+14%
)
AD
P m
ach
ines
(-7
%)
Ele
ct. m
ach
. w/i
nd
iv. f
un
ctio
ns
(-9%
)
Ele
c. a
pp
ar. f
or te
lep
hon
es (
+14%
)
Sem
icon
du
ctor
s (-
14%
)
8800
8542
2710
8431
8473
8486
8471
8543
8517
8541
HS
Com
mod
ity
Bill
ion
s of
dol
lars
Percent
U.S
. Mar
ket S
har
e of
Lead
ing
U.S
. Exp
orts
to S
inga
por
e
0102030405060
Civ
ilian
airc
raft
In
tegr
ated
circ
uit
s R
e�n
edp
etro
leu
m
Part
s fo
rlif
tin
gm
ach
ines
O�
cem
ach
ine
par
ts88
02 8
542
271
0 8
431
847
3H
S C
omm
odit
y
Perc
ent

116 U.S. Department of Commerce, International Trade Administration
COUNTRY FACT SHEET: SOUTH AFRICA
U.S. Ambassador to South Africa: Donald H. Gips South African Ambassador to the United States: Johnny Moloto (Acting)
PROFILEPopulation: 48.7 million Next Election Scheduled: April 2014 (Parliament Capital: Pretoria and President)Government: Republic—Parliamentary Head of Government: Jacob Zuma Democracy (President)
ECONOMY• 2008 Nominal GDP (Current US$ billions): 276.8 • 2008 Nominal GDP Per Capita (Current US$): 5,684
2006 2007 2008Real GDP Growth Rate (%) 5.3 5.1 3.1Real GDP Per Capita Growth Rate (%) 4.2 4.1 1.3CPI (%) 4.7 7.1 11.5Unemployment (%)
‡ 23.9 23.3 22.9
• Economic Mix in 2008†: 19% Manufacturing; 66% Services; 3% Agriculture.
FOREIGN MERCHANDISE TRADE (US$ billions) 2006 2007 2008 South Africa Exports to World 57.9 69.9 80.2South Africa Imports from World 68.2 79.9 91.1U.S. Exports to South Africa 4.5 5.5 6.5U.S. Imports from South Africa 7.5 9.1 9.9U.S. Trade Balance with South Africa –3.0 –3.6 –3.4
• Rank of South Africa as U.S. Export Market in 2008: 34th Largest (0.5% of U.S. exports).• Rank of South Africa as Source of U.S. Imports in 2008: 34th Largest (0.5% of U.S. imports).• Principal U.S. Exports to South Africa in 2008: Machinery (21%); Vehicles (16%); Electrical
Machinery (8%); Aircraft, Spacecraft (7%); Precious Stones, Metals (5%).• Principal U.S. Imports from South Africa in 2008: Precious Stones, Metals (42%); Vehicles (19%);
Iron, Steel (12%); Ores, Slag, Ash (4%); Machinery (4%).
FOREIGN DIRECT INVESTMENT (US$ billions) 2006 2007 2008U.S. FDI in South Africa 4.0 5.2 4.9FDI into U.S. from South Africa 0.6 0.2 0.6• Principal Suppliers of Foreign Investment to South Africa: United Kingdom, United States,
Germany, Netherlands, Switzerland.
DOING BUSINESS RANKING• World Bank Doing Business in 2010 Rank: 34 of 183 (32 in 2009).
COMMERCIAL OFFICER INFORMATIONSenior Commercial Officer: Craig AllenCommerce Desk Officer: Robert Telchin (202) 482-4564

117 Top U.S. Export Markets 2009
U.S
. Tra
de in
Goo
ds w
ith
Sou
th A
fric
a
U.S
. Exp
orts
U.S
. Im
por
ts
024681012
1990
1992
1994
1996
1998
2000
2002
2004
2006
2008
Billio
ns of
dolla
rs
Sou
th A
fric
a's
Imp
orts
Rel
ativ
e to
GD
P
216
243
258
283
277
050100
150
200
250
300
2004
2005
2006
2007
2008
Billio
ns of
dolla
rs
GD
PTo
tal i
mp
orts
Imp
orts
from
the
Un
ited
Sta
tes
Billions of dollars
Billions of dollars
HS Commodity1001 7108 8517 8708 8429 8431 8704 8703 8701 8800
Lead
ing
U.S
. Exp
orts
to S
outh
Afr
ica
in 2
008
and
Ch
ange
from
200
70
5010
015
020
025
030
035
040
045
050
0
Civ
ilian
air
craf
t (+4
0%)
Tra
ctor
s (+
15%
)
Pass
enge
r ve
hic
les
(-33
%)
Tru
cks
(+22
%)
Part
s fo
r lif
tin
g m
ach
ines
(-3
%)
Bu
lldoz
ers,
gra
der
s (+
27%
)
Mot
or v
ehic
le p
arts
(+6
%)
Ele
c. a
pp
ar. f
or te
lep
hon
es (
+13%
)
Gol
d (
-79%
)
Wh
eat,
mes
lin (
-17%
)
8800
8701
8703
8704
8431
8429
8708
8517
7108
1001
HS
Com
mod
ity
Mill
ion
s of
dol
lars
Percent
U.S
. Mar
ket S
har
e of
Lead
ing
U.S
. Exp
orts
to S
outh
Afr
ica
0510152025303540
Civ
ilian
airc
raft
T
ract
ors
Pass
enge
rve
hic
les
Tru
cks
Part
s fo
r lif
tin
gm
ach
ines
8802
8701
8703
8704
8431
HS
Com
mod
ity
Perc
ent

118 U.S. Department of Commerce, International Trade Administration
COUNTRY FACT SHEET: SOUTH KOREA
U.S. Ambassador to South Korea: Kathleen StephensSouth Korean Ambassador to the United States: Han Duk-soo
PROFILEPopulation: 48.6 million Next Election Scheduled: December 2012Capital: Seoul Head of Government: Lee Myung-bakGovernment: Republic (President) ECONOMY
• 2008 Nominal GDP (Current US$ billions): 929.1• 2008 Nominal GDP Per Capita (Current US$): 19,136*
2006 2007 2008Real GDP Growth Rate (%) 5.2 5.1 2.2Real GDP Per Capita Growth Rate (%) 4.8 4.8 2.0*CPI (%) 2.2 2.5 4.7Unemployment Rate (%) 3.5 3.3 3.2
• Economic Mix in 2007‡: 28% Manufacturing; 60% Services; 3% Agriculture.
FOREIGN MERCHANDISE TRADE (US$ billions) 2006 2007 2008 South Korea Exports to World 325.5 371.5 422.0 South Korea Imports from World 309.4 356.8 435.3 U.S. Exports to South Korea 32.2 34.4 34.7 U.S. Imports from South Korea 45.8 47.6 48.1 U.S. Trade Balance with South Korea –13.6 –13.2 –13.4
• Rank of South Korea as U.S. Export Market in 2008: 8th Largest (2.7% of U.S. exports).• Rank of South Korea as Source of U.S. Imports in 2008: 9th Largest (2.3% of U.S. imports). • Principal U.S. Exports to South Korea in 2008: Electrical Machinery (15%); Machinery (15%);
Cereals (8%); Medical Instruments (7%); Aircraft, Spacecraft (7%).• Principal U.S. Imports from South Korea in 2008: Electrical Machinery (32%); Vehicles (20%);
Machinery (15%); Mineral Fuel, Oil (4%); Iron, Steel Products (4%).
FOREIGN DIRECT INVESTMENT (US$ billions) 2006 2007 2008U.S. FDI in South Korea 27.3 26.9 27.7FDI into U.S. from South Korea 9.5 15.1 15.6• Principal Suppliers of Foreign Investment to South Korea: United States, United Kingdom, Japan.
DOING BUSINESS RANKING• World Bank Doing Business in 2010 Rank: 19 of 183 (23 in 2009).
COMMERCIAL OFFICER INFORMATION Senior Commercial Officer: John Fogarasi Commerce Desk Officer: Joshua Pierce (202) 482-0961

119 Top U.S. Export Markets 2009
U.S
. Tra
de in
Goo
ds w
ith
Sou
th K
orea
U.S
. Exp
orts
U.S
. Im
por
ts
0102030405060
1990
1992
1994
1996
1998
2000
2002
2004
2006
2008
Billio
ns of
dolla
rs
GD
PTo
tal i
mp
orts
Imp
orts
from
the
Un
ited
Sta
tes
Percent
U.S
. Mar
ket S
har
e of
Lead
ing
U.S
. Exp
orts
to S
outh
Kor
ea
0102030405060708090100
Cor
n
Sem
i-co
nd
uct
ors
Inte
grat
edci
rcu
its
Sem
i-co
nd
uct
or
mfr
. mac
h.
C
ivili
an
airc
raft
100
5 8
541
854
2 8
486
8802
HS
Com
mod
ity
Perc
ent
Billions of dollars
8800
8473
2710
2701
8471
8431
8517
8542
3004
8443
HS
Com
mod
ity
0 0.
5 1
1.5
2 2.
5
Cor
n (
+157
%)
Sem
icon
du
ctor
s (+
26%
)
Inte
grat
ed c
ircu
its
(-40
%)
Sem
icon
du
ctor
mfr
. mac
h. (
-4%
)
Civ
ilian
air
craf
t (-3
1%)
Ferr
ous
was
te, s
crap
(+1
16%
)
Air
craf
t, s
pac
ecra
ft (
-16%
)
Ele
c. a
pp
ar. f
or te
lep
hon
es (
+12%
)
Wh
eat,
mes
lin (
+58%
)
Air
craf
t par
ts (
-16%
)
1005 8541 8542 8486 8800 7204 8802 8517 1001 8803
Bill
ion
s of
dol
lars
HS Commodity
Lead
ing
U.S
. Exp
orts
to S
outh
Kor
ea in
200
8an
d C
han
ge fr
om 2
007
8800
8473
2710
2701
8471
8431
8517
8542
3004
8443
HS
Com
mod
ity
0.72
0.85
0.95
1.
05
0.95
0
0.2
0.4
0.6
0.8 1
1.2
2004
20
05
2006
20
07
2008
Trillions of dollars
Sou
th K
orea
's Im
port
s R
elat
ive
to G
DP

120 U.S. Department of Commerce, International Trade Administration
COUNTRY FACT SHEET: SPAIN
U.S. Ambassador to Spain: Alan D. SolomontSpanish Ambassador to the United States: Jorge Dezcallar
PROFILEPopulation: 45.6 million* Next Election Scheduled: March 2012
Capital: Madrid Head of Government: José Luis Rodríguez Government: Parliamentary Monarchy Zapatero (Prime Minister)
ECONOMY• 2008 Nominal GDP (Current US$ billions): 1,602.0• 2008 Nominal GDP Per Capita (Current US$): 35,117
2006 2007 2008Real GDP Growth Rate (%) 4.0 3.6 0.9GDP Per Capita Growth Rate (%) 6.4 1.8 0.8CPI (%) 3.6 2.8 4.1Unemployment (%) 8.5 8.3 11.3
• Economic Mix in 2006†: 67% Services; 16% Manufacturing; 3% Agriculture.
FOREIGN MERCHANDISE TRADE (US$ billions) 2006 2007 2008Spain Exports to World 213.8 253.4 269.0Spain Imports from World 328.9 389.7 403.0U.S. Exports to Spain 7.4 9.8 12.2U.S. Imports from Spain 9.8 10.5 11.1U.S. Trade Balance with Spain –2.4 –0.7 1.1
• Rank of Spain as U.S. Export Market in 2008: 24th Largest (0.95% of U.S. exports).• Rank of Spain as Source of U.S. Imports in 2008: 32nd Largest (0.53% of U.S. imports).• Principal U.S. Exports to Spain in 2008: Pharmaceutical Products (17%); Mineral Fuel, Oils (12%);
Machinery (9%); Aircraft, Spacecraft, Parts (8%); Electrical Machinery (6.8%); Optical, Photo, Medical Instruments (6%).
• Principal U.S. Imports from Spain in 2008: Mineral Fuel, Oil (17%); Electrical Machinery (11%); Pharmaceutical Products (8%); Iron, Steel Products (5%).
FOREIGN DIRECT INVESTMENT (US$ billions) 2006 2007 2008U.S. FDI in Spain 49.4 66.6 69.6 FDI into U.S. from Spain 14.0 27.5 38.7• Principal Suppliers of Foreign Investment to Spain: United States, Germany, France,
United Kingdom, Japan.
DOING BUSINESS RANKING• World Bank Doing Business in 2010 Rank: 62 of 183 (51 in 2009).
COMMERCIAL OFFICER INFORMATIONSenior Commercial Officer: Ellen Lenny-PessagnoCommerce Desk Officer: Donald Calvert (202) 482-9128

121 Top U.S. Export Markets 2009
U.S
. Tra
de in
Goo
ds w
ith
Spa
in
U.S
. Exp
orts
U.S
. Im
por
ts
02468101214
1990
1992
1994
1996
1998
2000
2002
2004
2006
2008
Billio
ns of
dolla
rs
Spai
n's
Imp
orts
Rel
ativ
e to
GD
P
1.0
1.1
1.2
1.4
1.6
0
0.2
0.4
0.6
0.81
1.2
1.4
1.6
1.8
2004
2005
2006
2007
2008
Trilli
ons o
f doll
ars
GD
PTo
tal i
mp
orts
Imp
orts
from
the
Un
ited
Sta
tes
Billions of dollars
Billions of dollars
HS Commodity2713 2701 3002 1201 1007 9018 802 8800 2710 3004
Lead
ing
U.S
. Exp
orts
to S
pain
in 2
008
and
Ch
ange
from
200
70
0.2
0.4
0.6
0.8
11.
21.
41.
61.
82
Ph
arm
aceu
tica
ls in
dos
ages
(+1
36%
)
Re�
ned
pet
role
um
(+4
79%
)
Civ
ilian
air
craf
t (+2
%)
Alm
ond
s, o
ther
nu
ts (
+10%
)
Med
ical
inst
rum
ents
(+3
%)
Gra
in s
orgh
um
(+2
%)
Soyb
ean
s (+
223%
)
Blo
od, a
nti
sera
, vac
cin
es (
+51%
)
Coa
l (+6
5%)
Pet
role
um
cok
e (+
17%
)
3004
2710
8800
802
9018
1007
1201
3002
2701
2713
HS
Com
mod
ity
Bill
ion
s of
dol
lars
Percent
U.S
. Mar
ket S
har
e of
Lead
ing
U.S
. Exp
orts
to S
pain
010203040506070
Ph
arm
aceu
-ti
cals
ind
osag
es
Re�
ned
pet
role
um
Civ
ilian
airc
raft
A
lmon
ds,
oth
er n
uts
Med
ical
inst
rum
ents
3004
2710
8802
0802
9018
HS
Com
mod
ity
Perc
ent

122 U.S. Department of Commerce, International Trade Administration
COUNTRY FACT SHEET: SWEDEN
U.S. Ambassador to Sweden: Matthew W. BarzunSwedish Ambassador to the United States: Jonas Hafström
PROFILEPopulation: 9.2 million Next Election Scheduled: September 2010Capital: Stockholm Head of Government: Fredrik ReinfeldtGovernment: Constitutional Monarchy (Prime Minister)
ECONOMY• 2008 Nominal GDP (Current US$ billions): 479.0• 2008 Nominal GDP Per Capita (Current US$): 52,181
2006 2007 2008Real GDP Growth Rate (%) 4.2 2.6 –0.2Real GDP Per Capita Growth Rate (%) 5.5 1.8 –0.5CPI (%) 1.5 1.7 3.3Unemployment (%) 7.0 6.1 6.2
• Economic Mix in 2007†: N/A Manufacturing; 70% Services; 2% Agriculture.
FOREIGN MERCHANDISE TRADE (US$ billions) 2006 2007 2008Sweden Exports to World 147.9 169.1 184.0Sweden Imports from World 127.7 152.8 167.6U.S. Exports to Sweden 4.1 4.5 5.0U.S. Imports from Sweden 13.9 13.0 12.5U.S. Trade Balance with Sweden –9.7 –8.6 –7.5
• Rank of Sweden as U.S. Export Market in 2008: 39th Largest (0.4% of U.S. exports).• Rank of Sweden as Source of U.S. Imports in 2008: 31st Largest (0.6% of U.S. imports).• Principal U.S. Exports to Sweden in 2008: Machinery (18%); Optical, Medical Instruments (16%);
Electrical Machinery (13%); Vehicles, Not Railway (8%).• Principal U.S. Imports from Sweden in 2008: Machinery (21%); Vehicles, Not Railway (15%);
Pharmaceuticals (10%); Electrical Machinery (9%); Mineral Fuel, Oil (7%).
FOREIGN DIRECT INVESTMENT (US$ billions) 2006 2007 2008U.S. FDI in Sweden 33.9 35.1 43.4FDI into U.S. from Sweden 20.1 42.1 35.0• Principal Suppliers of Foreign Investment to Sweden: United Kingdom, Netherlands, United
States, Luxembourg, Finland.
DOING BUSINESS RANKING• World Bank Doing Business in 2010 Rank: 18 of 183 (17 in 2009).
COMMERCIAL OFFICER INFORMATIONSenior Commercial Officer: Frank CarricoCommerce Desk Officer: Jennifer Derstine (202) 482-4414

123 Top U.S. Export Markets 2009
U.S
. Tra
de in
Goo
ds w
ith
Sw
eden
U.S
. Exp
orts
U.S
. Im
por
ts
0246810121416
1990
1992
1994
1996
1998
2000
2002
2004
2006
2008
Billio
ns of
dolla
rs
Swed
en's
Imp
orts
Rel
ativ
e to
GD
P
358
367
394
454
485
0
100
200
300
400
500
600
2004
2005
2006
2007
2008
Billio
ns of
dolla
rs
GD
PTo
tal i
mp
orts
Imp
orts
from
the
Un
ited
Sta
tes
Billions of dollars
Billions of dollars
HS Commodity9027 8413 9018 8542 8708 8703 8517 2710 8800 9021
Lead
ing
U.S
. Exp
orts
to S
wed
en in
200
8an
d C
han
ge fr
om 2
007
050
100
150
200
250
300
350
400
450
Ort
hop
edic
dev
ices
(+1
1%)
Civ
ilian
air
craf
t (+2
3%)
Re�
ned
pet
role
um
(+5
,888
%)
Ele
c. a
pp
ar. f
or te
lep
hon
es (
+14%
)
Pass
enge
r ve
hic
les
(+16
%)
Mot
or v
ehic
le p
arts
(0%
)
Inte
grat
ed c
ircu
its
(-43
%)
Med
ical
inst
rum
ents
(-1
3%)
Pu
mp
s fo
r liq
uid
s (+
18%
)
Inst
. for
ph
ysic
al a
nal
ysis
(-6
%)
9021
8800
2710
8517
8703
8708
8542
9018
8413
9027
HS
Com
mod
ity
Mill
ion
s of
dol
lars
Percent
U.S
. Mar
ket S
har
e of
Lead
ing
U.S
. Exp
orts
to S
wed
en
010203040506070
Ort
hop
edic
dev
ices
Civ
ilian
airc
raft
R
e�n
edp
etro
leu
mE
lec.
ap
par
.fo
rte
lep
hon
es
Pass
enge
rve
hic
les
902
1 8
802
271
0 8
517
870
3H
S C
omm
odit
y
Perc
ent

124 U.S. Department of Commerce, International Trade Administration
COUNTRY FACT SHEET: SWITZERLAND
U.S. Ambassador to Switzerland: Donald S. Beyer Swiss Ambassador to the United States: Urs Ziswiler
PROFILEPopulation: 7.3 million* Next Election Scheduled: October 2011Capital: Bern Head of Government: Hans-Rudolph MerzGovernment: Confederation–Federal Republic (President)
ECONOMY• 2008 Nominal GDP (Current US$ billions): 500.3 • 2008 Nominal GDP Per Capita (Current US$): 68,433
2006 2007 2008Real GDP Growth Rate (%) 3.6 3.6 1.8Real GDP Per Capita Growth Rate (%) 5.0 3.4 1.6CPI (%) 1.0 0.7 2.4Unemployment (%) 3.0 2.5 2.7
• Economic Mix in 2007†: N/A Manufacturing; 70% Services; 2% Agriculture.
FOREIGN MERCHANDISE TRADE (US$ billions) 2006 2007 2008Switzerland Exports to World 147.9 172.1 200.3Switzerland Imports from World 141.5 161.3 183.2U.S. Exports to Switzerland 14.4 17.0 22.0U.S. Imports from Switzerland 14.2 14.8 17.8U.S. Trade Balance with Switzerland 0.02 2.3 4.2
• Rank of Switzerland as U.S. Export Market in 2008: 15th Largest (1.7% of U.S. exports).• Rank of Switzerland as Source of U.S. Imports in 2008: 25th Largest (0.9% of U.S. imports).• Principal U.S. Exports to Switzerland in 2008: Precious Stones, Metals (54%); Pharmaceuticals
(11%); Art, Antiques (7%); Optical, Medical Instruments (5%); Machinery (3%).• Principal U.S. Imports from Switzerland in 2008: Pharmaceuticals (17%); Clocks, Watches (14%);
Machinery (13%); Optical, Medical Instruments (12%); Organic Chemicals (9%).
FOREIGN DIRECT INVESTMENT (US$ billions) 2006 2007 2008U.S. FDI in Switzerland 102.0 97.9 123.4FDI into U.S. from Switzerland 134.6 153.3 165.7• Principal Suppliers of Foreign Investment to Switzerland: United States, Netherlands, Germany,
France.
DOING BUSINESS RANKING• World Bank Doing Business in 2010 Rank: 21 of 183 (19 in 2009).
COMMERCIAL OFFICER INFORMATIONSenior Commercial Officer: Donald BusingerCommerce Desk Officer: Donald Calvert (202) 482-9128

125 Top U.S. Export Markets 2009
Percent
U.S
. Mar
ket S
har
e of
Lead
ing
U.S
. Exp
orts
to S
wit
zerl
and
051015202530354045
Gol
d
Pre
ciou
sm
etal
ssc
rap
Pain
tin
gsan
dd
raw
ings
Ph
arm
aceu
-ti
cals
ind
osag
es
Civ
ilian
airc
raft
7108
7112
9701
3004
8802
HS
Com
mod
ity
Perc
ent
U.S
. Tra
de in
Goo
ds w
ith
Sw
itze
rlan
d
U.S
. Exp
orts
U.S
. Im
por
ts
0510152025
1990
1992
1994
1996
1998
2000
2002
2004
2006
2008
Billio
ns of
dolla
rs
Swit
zerl
and'
s Im
por
ts R
elat
ive
to G
DP
363
373
389
427
493
0
100
200
300
400
500
600
2004
2005
2006
2007
2008
Billio
ns of
dolla
rs
GD
PTo
tal i
mp
orts
Imp
orts
from
the
Un
ited
Sta
tes
Billions of dollars
Billions of dollars
8800
8473
2710
2701
8471
8431
8517
8542
3004
8443
HS
Com
mod
ity
0 1
2 3
4 5
6 7
8 9
Gol
d (
+43%
)
Pre
ciou
s m
etal
s sc
rap
(+2
64%
)
Pai
nti
ngs
, dra
win
gs (
-12%
)
Ph
arm
aceu
tica
ls in
dos
ages
(+4
%)
Civ
ilian
air
craf
t (+8
6%)
Blo
od, a
nti
sera
, vac
cin
es (
+20%
)
Dia
mon
ds
(+22
%)
Ort
hop
edic
dev
ices
(+1
0%)
Jew
elry
w/p
reci
ous
met
als
(+28
%)
Ph
arm
aceu
tica
ls, n
o d
osag
es (
+4%
)
7108 7112 9701 3004 8800 3002 7102 9021 7113 3003
Bill
ion
s of
dol
lars
HS Commodity
Lead
ing
U.S
. Exp
orts
to S
wit
zerl
and
in 2
008
and
Ch
ange
from
200
7

126 U.S. Department of Commerce, International Trade Administration
COUNTRY FACT SHEET: TAIWAN
Director of the American Institute in Taiwan: William A. StantonRepresentative, Taipei Economic and Cultural Representative Office: Jason C. Yuan
PROFILEPopulation: 23 million Next Election Scheduled: Spring 2012Capital: Taipei Head of Government: Ma Ying-jeouGovernment: Multiparty Democracy (President)
ECONOMY• 2008 Nominal GDP (Current US$ billions): 391.4• 2008 Nominal GDP Per Capita (Current US$): 16,988
2006 2007 2008 Real GDP Growth Rate (%) 4.8 5.7 0.1 Real GDP Per Capita Growth Rate (%) 4.3 5.3 –0.3 CPI (%) 0.6 1.8 3.5 Unemployment (%) 3.9 3.9 4.1
• Economic Mix in 2008‡: 25% Manufacturing; 73% Services; 2% Agriculture.
FOREIGN MERCHANDISE TRADE (US$ billions) 2006 2007 2008 Taiwan Exports to World 213.0 234.7 243.2 Taiwan Imports from World 202.0 218.6 239.7 U.S. Exports to Taiwan 22.7 25.8 24.9 U.S. Imports from Taiwan 38.2 38.3 36.3 U.S. Trade Balance with Taiwan –15.5 –12.5 –11.4
• Rank of Taiwan as U.S. Export Market in 2008: 13th Largest (1.9% of U.S. exports).• Rank of Taiwan as Source of U.S. Imports in 2008: 12th Largest (1.7% of U.S. imports).• Principal U.S. Exports to Taiwan in 2008: Electrical Machinery (26%); Machinery (16%); Iron,
Steel (5%); Medical Instruments (5%); Organic Chemicals (5%).• Principal U.S. Imports from Taiwan in 2008: Electrical Machinery (40%); Machinery (15%); Iron,
Steel Products (6%); Vehicles (5%); Plastics (4%).
FOREIGN DIRECT INVESTMENT (US$ billions) 2006 2007 2008U.S. FDI in Taiwan 17.0 15.7 16.6FDI into U.S. from Taiwan 4.1 4.7 3.9• Principal Suppliers of Foreign Investment to Taiwan: United States, United Kingdom, Japan.
DOING BUSINESS RANKING• World Bank Doing Business in 2010 Rank: 46 of 183 (61 in 2009).
COMMERCIAL OFFICER INFORMATIONSenior Commercial Officer: Gregory WongCommerce Desk Officer: Brenda Carter-Nixon (202) 482-4009

127 Top U.S. Export Markets 2009
U.S
. Tra
de in
Goo
ds w
ith
Tai
wan
U.S
. Exp
orts
U.S
. Im
por
ts
051015202530354045
1990
1992
1994
1996
1998
2000
2002
2004
2006
2008
Billio
ns of
dolla
rs
Taiw
an's
Imp
orts
Rel
ativ
e to
GD
P
331
356
366
385
393
050100
150
200
250
300
350
400
450
2004
2005
2006
2007
2008
Billio
ns of
dolla
rs
GD
PTo
tal i
mp
orts
Imp
orts
from
the
Un
ited
Sta
tes
Billions of dollars
Billions of dollars
HS Commodity8517 2902 1001 9030 1005 1201 8800 7204 8486 8542
Lead
ing
U.S
. Exp
orts
to T
aiw
an in
200
8an
d C
han
ge fr
om 2
007
00.
51
1.5
22.
53
3.5
44.
55
Inte
grat
ed c
ircu
its
(+13
%)
Sem
icon
du
ctor
mfr
. mac
h. (
-42%
)
Ferr
ous
was
te, s
crap
(+6
5%)
Civ
ilian
air
craf
t (-2
2%)
Soyb
ean
s (+
34%
)
Cor
n (
+7%
)
Osc
illos
cop
es, s
pec
tru
m a
nal
. (-2
9%)
Wh
eat,
mes
lin (
+5%
)
Cyc
lic h
ydro
carb
ons
(-24
%)
Ele
c. a
pp
ar. f
or te
lep
hon
es (
0%)
8542
8486
7204
8800
1201
1005
9030
1001
2902
8517
HS
Com
mod
ity
Bill
ion
s of
dol
lars
Percent
U.S
. Mar
ket S
har
e of
Lead
ing
U.S
. Exp
orts
to T
aiw
an
0102030405060708090100
Inte
grat
edci
rcu
its
Sem
i-co
nd
uct
orm
fr. m
ach
.
Ferr
ous
was
te,
scra
p
Civ
ilian
airc
raft
Soyb
ean
s
8542
8486
7204
8802
1201
HS
Com
mod
ity
Perc
ent
N/A

128 U.S. Department of Commerce, International Trade Administration
COUNTRY FACT SHEET: THAILAND
U.S. Ambassador to Thailand: Eric G. JohnThai Ambassador to the United States: Don Pramudwinai
PROFILEPopulation: 66.4 million Next Election Scheduled: December 2011Capital: Bangkok Head of Government: Abhisit Vejjajiva Government: Constitutional Monarchy (Prime Minister) with a Parliamentary Government
ECONOMY• 2008 Nominal GDP (Current US$ billions): 273.3• 2008 Nominal GDP Per Capita (Current US$): 4,116
2006 2007 2008Real GDP Growth Rate (%) 5.2 4.9 2.6Real GDP Per Capita Growth Rate (%) 4.5 4.2 1.6CPI (%) 4.6 2.2 5.5Unemployment (%)
‡ 1.0 1.4 1.4
• Economic Mix in 2007†: 35% Manufacturing; 45% Services; 11% Agriculture.
FOREIGN MERCHANDISE TRADE (US$ billions) 2006 2007 2008Thailand Exports to World 130.6 163.1 177.8Thailand Imports from World 128.7 151.7 180.6U.S. Exports to Thailand 7.9 8.3 9.1U.S. Imports from Thailand 22.5 22.8 23.5U.S. Trade Balance with Thailand –14.6 –14.4 –14.5
• Rank of Thailand as U.S. Export Market in 2008: 29th Largest (0.7% of U.S. exports).• Rank of Thailand as Source of U.S. Imports in 2008: 19th Largest (1.1% of U.S. imports).• Principal U.S. Exports to Thailand in 2008: Electrical Machinery (21%); Machinery (18%); Iron,
Steel (5%); Precious Stones, Metals (5%); Optical, Medical Instruments (5%).• Principal U.S. Imports from Thailand in 2008: Electrical Machinery (24%); Machinery (21%);
Rubber (7%); Precious Stones, Metals (5%); Prepared Meat, Fish (5%).
FOREIGN DIRECT INVESTMENT (US$ millions) 2006 2007 2008U.S. FDI in Thailand 10,642 8,850 9,128FDI into U.S. from Thailand 289 354 206• Principal Suppliers of Foreign Investment to Thailand: Japan, Germany, United States.
DOING BUSINESS RANKING• World Bank Doing Business in 2010 Rank: 12 of 183 (13 in 2009).
COMMERCIAL OFFICER INFORMATIONSenior Commercial Officer: Cynthia Griffin Commerce Desk Officer: Jean Kelly (202) 482-3448

129 Top U.S. Export Markets 2009
U.S
. Tra
de in
Goo
ds w
ith
�ai
lan
d
U.S
. Exp
orts
U.S
. Im
por
ts
0510152025
1990
1992
1994
1996
1998
2000
2002
2004
2006
2008
Billio
ns of
dolla
rs
�ai
lan
d's
Imp
orts
Rel
ativ
e to
GD
P
161
176
207
246
273
050100
150
200
250
300
2004
2005
2006
2007
2008
Billio
ns of
dolla
rs
GD
PTo
tal i
mp
orts
Imp
orts
from
the
Un
ited
Sta
tes
Billions of dollars
Billions of dollars
HS Commodity1001 8800 7108 2707 8517 5201 8541 7204 8473 8542
Lead
ing
U.S
. Exp
orts
to �
aila
nd
in 2
008
and
Ch
ange
from
200
70
0.1
0.2
0.3
0.4
0.5
0.6
0.7
0.8
0.9
1
Inte
grat
ed c
ircu
its
(-11
%)
O�
ce m
ach
ine
par
ts (
-7%
)
Ferr
ous
was
te, s
crap
(+8
2%)
Sem
icon
du
ctor
s (-
13%
)
Cot
ton
(+3
7%)
Ele
c. a
pp
ar. f
or te
lep
hon
es (
+61%
)
Oils
from
coa
l tar
(+9
9%)
Gol
d (
+557
%)
Civ
ilian
air
craf
t (-6
5%)
Wh
eat,
mes
lin (
+37%
)
8542
8473
7204
8541
5201
8517
2707
7108
8800
1001
HS
Com
mod
ity
Bill
ion
s of
dol
lars
Percent
U.S
. Mar
ket S
har
e of
Lead
ing
U.S
. Exp
orts
to �
aila
nd
05101520253035404550
Inte
grat
edci
rcu
its
O
�ce
mac
hin
ep
arts
Ferr
ous
was
te,
scra
p Se
mi-
con
du
ctor
s C
otto
n
854
2 8
473
720
4 8
541
520
1H
S C
omm
odit
y
Perc
ent

130 U.S. Department of Commerce, International Trade Administration
COUNTRY FACT SHEET: TURKEY
U.S. Ambassador to Turkey: James F. JeffreyTurkish Ambassador to the United States: Nabi Sensoy
PROFILEPopulation: 69.7 million Next Election Scheduled: 2012 (Parliamentary)Capital: Ankara Head of Government: Recep Tayyip Erdogan Government: Parliamentary Democracy (Prime Minister)
ECONOMY• 2008 Nominal GDP (Current US$ billions): 730.0• 2008 Nominal GDP Per Capita (Current US$): 10,480
2006 2007 2008Real GDP Growth Rate (%) 6.9 4.7 1.1Real GDP Per Capita Growth Rate (%) 6.5 3.5 –0.2CPI (%) 9.6 8.8 10.4Unemployment (%)
‡ 9.8 9.9 10.7
• Economic Mix in 2007†: 19% Manufacturing; 63% Services; 9% Agriculture.
FOREIGN MERCHANDISE TRADE (US$ billions) 2006 2007 2008Turkey Exports to World 85.6 107.4 132.0Turkey Imports from World 139.8 170.4 201.7U.S. Exports to Turkey 5.3 6.5 10.0U.S. Imports from Turkey 5.4 4.6 4.6U.S. Trade Balance with Turkey –0.1 1.9 5.4
• Rank of Turkey as U.S. Export Market in 2008: 27th Largest (0.8% of U.S. exports).• Rank of Turkey as Source of U.S. Imports in 2008: 48th Largest (0.2% of U.S. imports).• Principal U.S. Exports to Turkey in 2008: Iron, Steel (21%); Aircraft, Spacecraft (14%); Mineral Fuel,
Oil (13%); Machinery (9%); Cotton, Yarn Fabric (5%); Electrical Machinery (4%).• Principal U.S. Imports from Turkey in 2008: Iron, Steel (13%); Machinery (8%); Stone, Plaster,
Cement (8%); Mineral Fuel, Oil (7%); Miscellaneous Textiles (6%); Woven Apparel (5%).
FOREIGN DIRECT INVESTMENT (US$ billions) 2005 2006 2007U.S. FDI in Turkey 2.6 3.1 6.0FDI into U.S. from Turkey 0.2 0.2 0.2• Principal Suppliers of Foreign Investment to Turkey: Netherlands, United Kingdom, France,
Germany, Belgium, Finland, United States, Italy.
DOING BUSINESS RANKING• World Bank Doing Business in 2010 Rank: 73 of 183 (63 in 2009).
COMMERCIAL OFFICER INFORMATIONSenior Commercial Officer: James FlukerCommerce Desk Officer: Kristin Najdi (202) 482-2908

131 Top U.S. Export Markets 2009
U.S
. Tra
de in
Goo
ds w
ith
Tu
rkey
U.S
. Exp
orts U.S
. Im
por
ts
024681012
1990
1992
1994
1996
1998
2000
2002
2004
2006
2008
Billio
ns of
dolla
rs
Turk
ey's
Imp
orts
Rel
ativ
e to
GD
P
392
483
529
649
729
0
100
200
300
400
500
600
700
800
2004
2005
2006
2007
2008
Billio
ns of
dolla
rs
GD
PTo
tal i
mp
orts
Imp
orts
from
the
Un
ited
Sta
tes
Billions of dollars
Billions of dollars
HS Commodity9018 8411 1201 2303 8803 2701 5201 2710 8800 7204
Lead
ing
U.S
. Exp
orts
to T
urk
ey in
200
8an
d C
han
ge fr
om 2
007
00.
51
1.5
22.
5
Ferr
ous
was
te, s
crap
(+1
22%
)
Civ
ilian
air
craf
t (+1
54%
)
Re�
ned
pet
role
um
(+6
99%
)
Cot
ton
(-3
0%)
Coa
l (+2
04%
)
Air
craf
t par
ts (
+44%
)
Star
ch/s
uga
r m
rf. r
esid
ues
(+1
51%
)
Soyb
ean
s (7
0%)
Gas
turb
ines
(+1
13%
)
Med
ical
inst
rum
ents
(+1
5%)
7204
8800
2710
5201
2701
8803
2303
1201
8411
9018
HS
Com
mod
ity
Bill
ion
s of
dol
lars
Percent
U.S
. Mar
ket S
har
e of
Lead
ing
U.S
. Exp
orts
to T
urk
ey
010203040506070
Ferr
ous
was
te, s
crap
Civ
ilian
airc
raft
Re�
ned
pet
role
um
C
otto
n
Coa
l
7204
8800
2710
5201
2701
HS
Com
mod
ity
Perc
ent

132 U.S. Department of Commerce, International Trade Administration
COUNTRY FACT SHEET: UNITED ARAB EMIRATES
U.S. Ambassador to the United Arab Emirates: Richard OlsonUAE Ambassador to the United States: Yousef Al-Otaiba
PROFILEPopulation: 4.8 million Next Election Scheduled: February 2011Capital: Abu Dhabi Head of Government: Khalifa bin Government: Federation Zayid Al-Nuhayyan (President)
ECONOMY• 2008 Nominal GDP (Current US$ billions): 262.2 • 2008 Nominal GDP Per Capita (Current US$): 55,028
2006 2007 2008 Real GDP Growth Rate (%) 9.4 6.3 7.4 Real GDP Per Capita Growth Rate (%) 6.2 0.2 1.2 CPI (%) 9.3 11.1 12.3 Unemployment (%) N/A N/A N/A
• Economic Mix in 2006†: 12% Manufacturing; 39% Services; 2% Agriculture.
FOREIGN MERCHANDISE TRADE (US$ billions) 2006 2007 2008 UAE Exports to World 142.5 156.6 210.0 UAE Imports from World 98.8 127.0 175.5 U.S. Exports to the UAE 10.3 10.8 14.4 U.S. Imports from the UAE 1.4 1.3 1.3 U.S. Trade Balance with the UAE 8.9 9.4 13.1
• Rank of the UAE as U.S. Export Market in 2008: 20th Largest (1.1% of U.S. exports).• Rank of the UAE as Source of U.S. Imports in 2008: 74th Largest (0.6% of U.S. imports).• Principal U.S. Exports to the UAE in 2008: Machinery (21%); Vehicles (19%); Aircraft (19%);
Precious Stones, Metals (9%); Electrical Machinery (8%).• Principal U.S. Imports from the UAE in 2008: Aluminum (19%); Mineral Fuel, Oil (16%); Precious
Stones, Metals (13%); Iron, Steel Products (8%).
FOREIGN DIRECT INVESTMENT (US$ billions) 2006 2007 2008U.S. FDI in the UAE 2.67 2.97 3.42FDI into U.S. from the UAE (D) 1.53 2.74• Principal Supplier of Foreign Investment to the UAE: United States.
DOING BUSINESS RANKING• World Bank Doing Business in 2010 Rank: 33 of 183 (47 in 2009).
COMMERCIAL OFFICER INFORMATIONSenior Commercial Officer: Laurie FarrisCommerce Desk Officer: Steven Garrett (202) 482-2680

133 Top U.S. Export Markets 2009
U.S
. Tra
de in
Goo
ds w
ith
Un
ited
Ara
b E
mir
ates
U.S
. Exp
orts
U.S
. Im
por
ts
0246810121416
1990
1992
1994
1996
1998
2000
2002
2004
2006
2008
Billio
ns of
dolla
rs
�e
Un
ited
Ara
b E
mir
ates
’ Im
por
ts R
elat
ive
to G
DP
107
135
164
180
260
050100
150
200
250
300
2004
2005
2006
2007
2008
Billio
ns of
dolla
rs
GD
PTo
tal i
mp
orts
Imp
orts
from
the
Un
ited
Sta
tes
Billions of dollars
Billions of dollars
HS Commodity8411 8429 8517 7113 8471 7102 7108 8431 8703 8800
Lead
ing
U.S
. Exp
orts
to U
nit
ed A
rab
Em
irat
es in
200
8an
d C
han
ge fr
om 2
007
00.
51
1.5
22.
53
Civ
ilian
air
craf
t (+8
%)
Pass
enge
r ve
hic
les
(+66
%)
Part
s fo
r lif
tin
g m
ach
ines
(+3
2%)
Gol
d (
+29%
)
Dia
mon
ds
(+66
%)
AD
P m
ach
ines
(+4
3%)
Jew
elry
w/p
reci
ous
met
als
(+24
3%)
Ele
c. a
pp
ar. f
or te
lep
hon
es (
+42%
)
Bu
lldoz
ers,
gra
der
s (+
99%
)
Gas
turb
ines
(+3
6%)
8800
8703
8431
7108
7102
8471
7113
8517
8429
8411
HS
Com
mod
ity
Bill
ion
s of
dol
lars
Percent
U.S
. Mar
ket S
har
e of
Lead
ing
U.S
. Exp
orts
to U
nit
ed A
rab
Em
irat
es
010203040506070
Civ
ilian
airc
raft
Pass
enge
rve
hic
les
Part
s fo
rlif
tin
gm
ach
ines
Gol
d
Dia
mon
ds
8802
8703
8431
7108
7102
HS
Com
mod
ity
Perc
ent

134 U.S. Department of Commerce, International Trade Administration
COUNTRY FACT SHEET: THE UNITED KINGDOM
U.S. Ambassador to the United Kingdom: Louis B. SusmanU.K. Ambassador to United States: Nigel Sheinwald
PROFILEPopulation: 61.3 million Next Election Scheduled: Spring 2010Capital: London Head of Government: Gordon BrownGovernment: Constitutional Monarchy (Prime Minister)
ECONOMY• 2008 Nominal GDP (Current US$ billions): 2,680 • 2008 Nominal GDP Per Capita (Current US$): 43,734
2006 2007 2008Real GDP Growth Rate (%) 2.9 2.6 0.7Real GDP Per Capita Growth Rate (%) 4.9 1.9 0.2CPI (%) 2.3 2.3 3.6Unemployment (%) 5.4 5.4 5.5
• Economic Mix in 2007†: N/A Manufacturing; 76% Services; 1% Agriculture.
FOREIGN MERCHANDISE TRADE (US$ billions) 2006 2007 2008U.K. Exports to World 447.2 438.4 483.8U.K. Imports from World 566.1 636.1 669.9U.S. Exports to the United Kingdom 45.4 50.0 53.6U.S. Imports from the United Kingdom 53.5 56.9 58.6U.S. Trade Balance with the United Kingdom –8.1 –6.9 –5.0
• Rank of the United Kingdom as U.S. Export Market in 2008: 6th Largest (4.2% of U.S. exports).• Rank of the United Kingdom as Source of U.S. Imports in 2008: 6th Largest (2.9% of U.S. imports).• Principal U.S. Exports to the United Kingdom in 2008: Precious Stones, Metals (16%); Machinery
(13%); Aircraft, Spacecraft (13%); Electrical Machinery (8%); Pharmaceutical Products (7%).• Principal U.S. Imports from the United Kingdom in 2008: Mineral Fuel, Oil (14%); Machinery
(13%); Pharmaceutical Products (13%); Vehicle, Not Railway (9%); Organic Chemicals (7%).
FOREIGN DIRECT INVESTMENT (US$ billions) 2006 2007 2008U.S. FDI in the United Kingdom 406.4 424.6 420.9FDI into U.S. from the United Kingdom 414.6 426.5 454.1• Principal Suppliers of Foreign Investment to the United Kingdom: United States, Germany,
Japan, France.
DOING BUSINESS RANKING• World Bank Doing Business in 2010 Rank: 5 of 183 (6 in 2009).
COMMERCIAL OFFICER INFORMATIONSenior Commercial Officer: Dorothy LutterCommerce Desk Officer: Robert McLaughlin (202) 482-3748

135 Top U.S. Export Markets 2009
U.S
. Tra
de in
Goo
ds w
ith
Un
ited
Kin
gdom
U.S
. Exp
orts
U.S
. Im
por
ts
010203040506070
1990
1992
1994
1996
1998
2000
2002
2004
2006
2008
Billio
ns of
dolla
rs
Un
ited
Kin
gdom
's Im
por
ts R
elat
ive
to G
DP
2.2
2.3
2.4
2.8
2.7
0
0.51
1.52
2.53
2004
2005
2006
2007
2008
Trilli
ons o
f doll
ars
GD
PTo
tal i
mp
orts
Imp
orts
from
the
Un
ited
Sta
tes
Trillions of dollars
Billions of dollars
HS Commodity9018 8517 8471 8703 3002 7112 9701 3004 7108 8800
Lead
ing
U.S
. Exp
orts
to th
e U
nit
ed K
ingd
om in
200
8an
d C
han
ge fr
om 2
007
01
23
45
67
Civ
ilian
air
craf
t (+3
%)
Gol
d (
+23%
)
Ph
arm
aceu
tica
ls in
dos
ages
(+1
%)
Pain
tin
gs a
nd
dra
win
gs (
+27%
)
Pre
ciou
s m
etal
s sc
rap
(+4
5%)
Blo
od, a
nti
sera
, vac
cin
es (
+19%
)
Pass
enge
r ve
hic
les
(-18
%)
AD
P m
ach
ines
(-5
%)
Ele
c. a
pp
ar. f
or te
lep
hon
es (
+5%
)
Med
ical
inst
rum
ents
(+1
1%)
8800
710
8
300
4
970
1
7112
300
2
870
3
847
1
851
7
901
8
HS
Com
mod
ity
Bill
ion
s of
dol
lars
Percent
U.S
. Mar
ket S
har
e of
Lead
ing
U.S
. Exp
orts
to th
e U
nit
ed K
ingd
om
0102030405060708090
Civ
ilian
airc
raft
G
old
P
har
mac
eu-
tica
ls in
dos
ages
Pain
tin
gsan
dd
raw
ings
Pre
ciou
sm
etal
ssc
rap
88
0271
0830
0497
0171
12H
S C
omm
odit
y
Perc
ent

136 U.S. Department of Commerce, International Trade Administration
COUNTRY FACT SHEET: VENEZUELA
U.S. Ambassador in Venezuela: Patrick DuddyVenezuelan Ambassador to the United States: Bernardo Álvarez Herrera
PROFILEPopulation: 28.1 million Next Election Scheduled: 2012Capital: Caracas Head of Government: Hugo Chávez Government: Constitutional Republic (President)
ECONOMY• 2008 Nominal GDP (Current US$ billions): 319.4 • 2008 Nominal GDP Per Capita (Current US$): 11,388
2006 2007 2008Real GDP Growth Rate (%) 10.3 8.4 4.8Real GDP Per Capita Growth Rate (%) 8.2 6.3 2.8CPI (%) 13.7 18.7 30.4Unemployment (%)
‡ 10.0 8.5 7.4
• Economic Mix in 2005†: 16% Manufacturing; 38% Services; 4% Agriculture.
FOREIGN MERCHANDISE TRADE (US$ billions) 2006 2007 2008Venezuela Exports to World 15.8 16.2 5.4Venezuela Imports from World 30.6 41.9 45.1U.S. Exports to Venezuela 9.0 10.2 12.6U.S. Imports from Venezuela 37.1 39.9 51.4U.S. Trade Balance with Venezuela –28.1 –29.7 –38.8
• Rank of Venezuela as U.S. Export Market in 2008: 22nd Largest (1.0% of U.S. exports).• Rank of Venezuela as Source of U.S. Imports in 2008: 8th Largest (2.4% of U.S. imports).• Principal U.S. Exports to Venezuela in 2008: Machinery (27%); Electrical Machinery (12%);
Organic Chemicals (8%); Vehicles (7%); Cereals (7%).• Principal U.S. Imports from Venezuela in 2008: Mineral Fuel (95%); Iron, Steel (1%); Aluminum
(1%); Organic Chemicals (1%).
FOREIGN DIRECT INVESTMENT (US$ billions) 2006 2007 2008U.S. FDI in Venezuela 10.9 15.7 17.3FDI into U.S. from Venezuela 5.4 4.2 4.6• Principal Suppliers of Foreign Investment to Venezuela: United States, Switzerland, France,
Colombia.
DOING BUSINESS RANKING• World Bank Doing Business in 2010 Rank: 177 of 183 (178 in 2009).
COMMERCIAL OFFICER INFORMATIONSenior Commercial Officer: James KoloditchCommerce Desk Officer: Matthew Gaisford (202) 482-0057

137 Top U.S. Export Markets 2009
U.S
. Tra
de in
Goo
ds w
ith
Ven
ezu
ela
U.S
. Exp
orts
U.S
. Im
por
ts
0102030405060
1990
1992
1994
1996
1998
2000
2002
2004
2006
2008
Billio
ns of
dolla
rs
Ven
ezu
ela'
s Im
por
ts R
elat
ive
to G
DP
113
144
184
228
319
050100
150
200
250
300
350
2004
2005
2006
2007
2008
Billio
ns of
dolla
rs
GD
PTo
tal i
mp
orts
Imp
orts
from
the
Un
ited
Sta
tes
Billions of dollars
Billions of dollars
HS Commodity8471 9018 1005 8429 1001 2710 8517 8708 8431 2909
Lead
ing
U.S
. Exp
orts
to V
enez
uel
a in
200
8an
d C
han
ge fr
om 2
007
010
020
030
040
050
060
070
0
Eth
ers,
alc
ohol
s (+
45%
)
Part
s fo
r lif
tin
g m
ach
ines
(+3
5%)
Mot
or v
ehic
le p
arts
(+2
8%)
Ele
c. a
pp
ar. f
or te
lep
hon
es (
+91%
)
Re�
ned
pet
role
um
(-1
9%)
Wh
eat,
mes
lin (
+74%
)
Bu
lldoz
ers,
gra
der
s (+
36%
)
Cor
n (
+236
%)
Med
ical
inst
rum
ents
(+1
02%
)
AD
P m
ach
ines
(-2
8%)
290
9
843
1
870
8
851
7
271
0
100
1
842
9
100
5
901
8
847
1
HS
Com
mod
ity
Mill
ion
s of
dol
lars
Percent
U.S
. Mar
ket S
har
e of
Lead
ing
U.S
. Exp
orts
to V
enez
uel
a
0102030405060708090
Eth
ers,
alco
hol
s Pa
rts
for
lifti
ng
mac
hin
es M
otor
veh
icle
par
ts
Ele
c. a
pp
ar.
for
tele
ph
ones
Re�
ned
pet
role
um
290
9 8
431
870
8 8
517
271
0H
S C
omm
odit
y
Perc
ent

138 U.S. Department of Commerce, International Trade Administration
COUNTRY FACT SHEET: VIETNAM
U.S. Ambassador to Vietnam: Michael W. MichalakVietnamese Ambassador to the United States: Le Cong Phung
PROFILEPopulation: 86.2 million* Next Election Scheduled: May 2012 Capital: Hanoi (National Assembly)Government: Communist State Head of Government: Nguyen Tan Dung
(Prime Minister)
ECONOMY• 2008 Nominal GDP (Current US$ billions): 89.8• 2008 Nominal GDP Per Capita (Current US$): 1.042*
2006 2007 2008Real GDP Growth Rate (%) 8.2 8.5 6.2Real GDP Per Capita Growth Rate (%) 6.9 7.2 4.9*CPI (%) 7.5 8.3 23.1Unemployment (%)
‡ 4.8 4.6 4.7
• Economic Mix in 2007†: 21% Manufacturing; 38% Services; 20% Agriculture.
FOREIGN MERCHANDISE TRADE (US$ billions) 2006 2007 2008Vietnam Exports to World† 39.8 48.4 N/AVietnam Imports from World† 44.9 60.8 N/AU.S. Exports to Vietnam 1.1 1.9 2.8U.S. Imports from Vietnam 8.6 10.6 12.9U.S. Trade Balance with Vietnam –7.5 –8.7 –10.1
• Rank of Vietnam as U.S. Export Market in 2008: 49th Largest (0.2% of U.S. exports).• Rank of Vietnam as Source of U.S. Imports in 2008: 30th Largest (0.6% of U.S. imports).• Principal U.S. Exports to Vietnam in 2008: Machinery (12%); Vehicles (12%); Meat (8%); Cotton,
Fabric (7%); Plastic (6%).• Principal U.S. Imports from Vietnam in 2008: Knit Apparel (22%); Woven Apparel (18%);
Furniture, Bedding (11%); Footwear (9%); Mineral Fuel, Oil (8%).
FOREIGN DIRECT INVESTMENT (US$ millions) 2006 2007 2008U.S. FDI in Vietnam 261 426 473FDI into U.S. from Vietnam –7 1 6• Principal Suppliers of Foreign Investment to Vietnam: Malaysia, Taiwan, Japan, Singapore,
Brunei, Canada, Thailand, British Virgin Islands, Cyprus, South Korea.
DOING BUSINESS RANKING• World Bank Doing Business in 2010 Rank: 93 of 183 (92 in 2009).
COMMERCIAL OFFICER INFORMATIONSenior Commercial Officer: Donald NayCommerce Desk Officer: Hong-Phong Pho (202) 482-3877

139 Top U.S. Export Markets 2009
U.S
. Tra
de in
Goo
ds w
ith
Vie
tnam U
.S. E
xpor
ts
U.S
. Im
por
ts
02468101214
1990
1992
1994
1996
1998
2000
2002
2004
2006
2008
Billio
ns of
dolla
rs
Vie
tnam
's Im
por
ts R
elat
ive
to G
DP
4553
61
71
90
0102030405060708090100
2004
2005
2006
2007
2008
Billio
ns of
dolla
rs
GD
PTo
tal i
mp
orts
Imp
orts
from
the
Un
ited
Sta
tes
Billions of dollarsHS Commodity8471 4407 4101 0207 3902 8802 7204 0202 5201 8703
Lead
ing
U.S
. Exp
orts
to V
ietn
am in
200
8an
d C
han
ge fr
om 2
007
050
100
150
200
250
300
Pass
enge
r ve
hic
les
(+21
%)
Cot
ton
(+1
19%
)
Bee
f, fr
ozen
(+3
38%
)
Ferr
ous
was
te, s
crap
(+1
19%
)
Air
craf
t, sp
acec
raft
(N
/A)
Ole
�n
pol
ymer
s (-
4%)
Pou
ltry
mea
t (+1
71%
)
Hid
es, s
kin
s (+
11%
)
Lum
ber
(-5
%)
AD
P m
ach
ines
(+5
8%)
8703
5201
0202
7204
8802
3902
0207
4101
4407
8471
HS
Com
mod
ity
Mill
ion
s of
dol
lars
Percent
U.S
. Mar
ket S
har
e of
Lead
ing
U.S
. Exp
orts
to V
ietn
am
0102030405060
Pass
enge
rve
hic
les
Cot
ton
Bee
f,fr
ozen
Fe
rrou
sw
aste
,sc
rap
Air
craf
t,sp
acec
raft
8703
5201
0202
7204
8802
HS
Com
mod
ity
Perc
ent
N/A
Billions of dollars
