top 10 business risks in 2016 1 top 10 business ... - … 10 business risks in 2016 ... does your...
TRANSCRIPT

Top 10 Business Risks in 2016 | 1
© 2016 KPMG Advisory Services, a partnership registered in Nigeria, and a member of the KPMG network of independent member firms affiliated with KPMG International Cooperative (“KPMG International”), a Swiss entity. All rights reserved.
Top 10BusinessRisks in2016March 2016
kpmg.com/ng
KPMG in Nigeria

© 2016 KPMG Advisory Services, a partnership registered in Nigeria, and a member of the KPMG network of independent member firms affiliated with KPMG International Cooperative (“KPMG International”), a Swiss entity. All rights reserved.
2 | Top 10 Business Risks in 2016
ContentsExecutive Summary 4
About this Survey 8
Risk Survey Results 12
Way Forward 22
Appendix: Glossary of Terms 26

Top 10 Business Risks in 2016 | 3
© 2016 KPMG Advisory Services, a partnership registered in Nigeria, and a member of the KPMG network of independent member firms affiliated with KPMG International Cooperative (“KPMG International”), a Swiss entity. All rights reserved.
ForewordI am pleased to present to you the maiden edition of our Report on the Top 10 Business Risks in 2016 which represents a momentous year in the history of the Nigerian economy. The economic outlook is currently challenged due to our vulnerability to the continuous decline in the price of crude oil, volatility in the stock markets, tight monetary & fiscal policies, rising inflation, currency depreciation, insecurity & insurgency across the country. All these together with increased regulatory pressure have created ripples in the hearts of many Nigerian businesses.
Consequently, the Risk Consulting practice of KPMG Nigeria conducted a Risk Management survey (‘the survey’) aimed at identifying the key risks that stakeholders believe will impact organisations in the non-financial sector in 2016. The survey was used to obtain and aggregate the perspectives of several Executive Directors and Senior Management Staff on the key risks likely to affect businesses in the manufacturing, energy and telecommunications sectors. The rich and diverse representation of our respondents helped us to reach logical conclusions on the top 10 risks including capturing notable differences in viewpoints.
The survey results were synthesized into this flagship report which seeks to enable companies to compare their own views on the key risks with those of their peers. The report also aims to provide an empirical foundation, against which results of subsequent risk surveys can be compared, to monitor trends and key changes in risk rating over time.
The need for organisations to strengthen their risk management practices cannot be over-emphasized, as the results of the risk management survey show that the business environment in 2016 will be quite challenging for all sectors of the economy. However, with the right risk management strategies, organisations stand a chance of transforming risks into a competitive advantage and sustaining their performance in the face of significant changes in the operating environment.
I want to sincerely thank all the survey respondents for their invaluable time and insights. We hope to periodically conduct this survey in order to stay abreast of key risk issues on the minds of executives and observe trends in risk concerns over time. We also hope this report provides a healthy platform for comparing perspectives on the principal risk exposures for businesses in the non-financial sector, as well as key risk management imperatives for the boards and senior management, to enable them to optimise their organisational risks while minimizing their losses.
Tomi AdepojuPartner, Risk ConsultingKPMG Nigeria

© 2016 KPMG Advisory Services, a partnership registered in Nigeria, and a member of the KPMG network of independent member firms affiliated with KPMG International Cooperative (“KPMG International”), a Swiss entity. All rights reserved.
4 | Top 10 Business Risks in 2016
This report presents the top 10 risks for businesses operating in the non-financial sector of the Nigerian economy in 2016. The objective of the report is to enable companies compare their own views on the key risks with those of their peers. In order to achieve this, the Risk Consulting practice of KPMG Nigeria deployed a web-based survey to risk decision makers and obtained responses from more than
70 Senior Executives and Management Staff across various organisations. Based on the average scores across respondents, we ranked the risks from highest to lowest.
The list of the top 10 business risks in 2016 is as follows:
1. Executive Summary
Macro-economic risk
Capital availability risk
Political risk Energy riskCrude oilprice risk
Security risk
Business continuity & disaster recovery risk
1
6
32
Supplychain risk
9
4
Competition risk
8
5
10
Regulatory risk
7

Top 10 Business Risks in 2016 | 5
© 2016 KPMG Advisory Services, a partnership registered in Nigeria, and a member of the KPMG network of independent member firms affiliated with KPMG International Cooperative (“KPMG International”), a Swiss entity. All rights reserved.
An overview of the top 10 risks, from an industry perspective, is as follows:
0 1 2 3 4
0.00 1.00 2.00 3.00 4.00 5.00
Macro-economic risk
3.853.933.703.83
3.763.584.093.83
3.333.403.263.17
3.213.263.262.67
3.193.472.872.50
3.073.163.002.67
2.973.012.912.89
2.963.092.653.17
2.913.242.482.17
2.862.982.742.50
Crude Oil Price
Ploitical Risk
Energy Risk
Security
Capital Availability
Supply Chain
Overall Manufacturing Energy Telecommunications
Risk Rating
Regulatory risk
Competition
Business continuity & disaster recovery
E
E
E
E
E
I
I&E
I&E
E
E - External Risk I - Internal Risk
I
Macro-economic risk
Crude oil price risk
Political risk
Energy risk
Security risk
Capital availability risk
Regulatory risk
Competition risk
Supply chain risk
Business continuity & disaster recovery risk
3.853.933.703.83
3.763.584.093.83
3.333.403.263.17
3.213.263.262.67
3.193.472.872.50
E
E
E
E
E
3.073.163.002.67
2.973.012.912.89
2.963.092.653.17
2.913.242.482.17
2.862.982.742.50
I&E
E
I&E
I
I
Overall
Manufacturing
Energy
Telecommunications
E - External Risk I - Internal Risk
Macro-economic Risk
Crude Oil Price
Political Risk
Energy Risk
Security
Capital Availability
Supply Chain
Regulatory risk
Competition
Business continuity & disaster recovery
3.853.933.703.83
3.763.584.093.83
3.333.403.263.17
3.213.263.262.67
3.193.472.872.50
E
E
E
E
E
3.073.163.002.67
2.973.012.912.89
2.963.092.653.17
2.913.242.482.17
2.862.982.742.50
I
I&E
I&E
E
I
Overall Manufacturing Energy Telecommunications
E - External Risk I - Internal Risk

© 2016 KPMG Advisory Services, a partnership registered in Nigeria, and a member of the KPMG network of independent member firms affiliated with KPMG International Cooperative (“KPMG International”), a Swiss entity. All rights reserved.
6 | Top 10 Business Risks in 2016
Uncertainty due to recession and financial crisis is number one factor leading to increased risks over the last couple of years.
# 1for organisations in 2016 is
arising from changes in economic factors such as currency exchange rates, interest rates, equity price, inflation, recession, and unfavourable fiscal policies.
MACRO-ECONOMIC RISK
THE TOP 10 RISKS
RISK
RISK95%
$5Billion.
of the respondents believed that their organisation has been exposed to increased risks over the last two (2) to three (3) years.
of respondents believed that an unstable socio-political environment and increased pressure from regulators have increased the risks faced by organisations. Additionally, onerous and often overlapping regulations & compliance requirements have also given rise to increased risks over the years. Consequently, most respondents noted that regulatory risk was a key risk to manage this year.
There is a strong relationship between the way professionals perceive risks and their areas of responsibility. Generally, CROs and CEOs perceived a riskier environment, as they rate a greater number of risk to be ‘high’, relative to other respondents; while CFOs ranked risks with probable significant financial implications as ‘high’.
More than
50%
Key Findings
Respondents in the manufacturing industry considered supply chain risk to be medium, while those in the energy and telecommunication industries considered it low. The results reflect the relative significance of an effective supply chain in the manufacturing industry.
appear to be lower for multinational companies in Nigeria, which suggests that a higher control environment significantly contributes to lower risk exposures.
Also Nigerian companies appear to be most impacted by energy risk. They also viewed governance risk as a higher risk than other companies.
There was no significant difference in the way public and private companies perceived risks inferring that the probability and impact of an event on an organisation's objectives do not depend on its ownership structure.
of the respondents noted that their organisations are likely to devote more time and resources to risk management in 2016.
We also observed that as the revenue of companies decreased, the risk of limited access to capital increased, indicating that smaller companies have relatively limited access to capital, which may in turn hinder their ability to expand.
The risk of capital availability was remarkably lower for companies whose revenue exceeded
of this percentage,are almost certain that they would.53%
81%
1 2
4
6
87
109
5
3

Top 10 Business Risks in 2016 | 7
© 2016 KPMG Advisory Services, a partnership registered in Nigeria, and a member of the KPMG network of independent member firms affiliated with KPMG International Cooperative (“KPMG International”), a Swiss entity. All rights reserved.
Based on the above results, it is clear that a high proportion of companies have plans to invest in risk management for sustainable performance and competitive advantage.
If your organisation has commenced its risk management journey, it is essential for the board and
senior management to determine which aspects of the process require enhancement and take active steps in addressing them by asking the following questions:
“There are two types of managers or organisations: the quick and the dead” – Jack Welch
Way Forward
1. Does your risk profile reflect your current and emerging risks?
2. Is there adequate oversight on critical risks facing your company?
3. Have you established early warning mechanisms to alert your company on emerging risks?
4. Are you satisfied with the quality of the risk reports you receive?
5. Have you defined the accountabilities and responsibilities for managing risks in your company?
6. Does your existing risk culture encourage the right organisational behaviours?
7. Is your company prepared to respond to extreme events?
8. Does risk management constitute an integral part of your organisation’s strategic planning process?

© 2016 KPMG Advisory Services, a partnership registered in Nigeria, and a member of the KPMG network of independent member firms affiliated with KPMG International Cooperative (“KPMG International”), a Swiss entity. All rights reserved.
8 | Top 10 Business Risks in 2016
2. About this SurveyBackground and Objectives
The Nigerian 2016 economic outlook is currently challenged due to our vulnerability to the continuous decline in the price of crude oil, volatility in the stock markets, tight monetary & fiscal policies, rising inflation, currency depreciation, insecurity & insurgency across the country. All these together with increased regulatory pressure have created ripples in the hearts of many Nigerian businesses. Consequently, the Risk Consulting practice of KPMG Nigeria conducted a Risk Management survey (‘the survey’) aimed at gauging how business professionals view the key risks that will impact organisations operating in the non-financial sector of Nigeria, in 2016.
This report presents the top 10 risks on the horizon for businesses in the Nigerian economy. It captures the perspectives of Executive Directors and Senior Management across the manufacturing, energy and telecommunications industries in Nigeria.
The objective of the survey is to enable companies compare their own views on the key risks with those of their peers. It also aims to provide an empirical
foundation, against which results of subsequent risk surveys can be compared, to monitor trends and key changes in risk rating over time.
Methodology
We deployed a web-based survey to target respondents between December 2015 and February 2016. Our target respondents comprised a healthy mix of risk decision makers such as Chief Executive Officers (CEOs), Chief Operating Officers (COOs), Chief Finance Officers (CFOs), Chief Audit Executives (CAEs), Chief Risk Officers (CROs) and their equivalents across publicly and privately owned large scale organisations. More than 70 Senior Executives and Management Staff participated in the online survey.
Each respondent assessed an array of 28 risks across strategic, macro-economic, socio-political and operational dimensions. Each respondent ranked the risks using a 5-point scale, where 1 represented ‘Insignificant Impact’ and 5 represented ‘Extreme Impact’. For each of the 28 risks, we computed the average of the scores reported by all the respondents. Based on the average scores across

Top 10 Business Risks in 2016 | 9
© 2016 KPMG Advisory Services, a partnership registered in Nigeria, and a member of the KPMG network of independent member firms affiliated with KPMG International Cooperative (“KPMG International”), a Swiss entity. All rights reserved.
Respondents Profile
The respondents comprised 72 risk decision makers across the manufacturing, telecommunications and energy industries.
50% 40% 50%50% 50%
More than
represent publicly held companies
realize more than $1billion in global revenue
have operations within and outside Nigeria
have their headquarters based in Nigeria
have more than 1,000 employees
About More than Almost Almost
respondents, we ranked the risks from highest to lowest. We also conducted further analysis to identify trends and key differences among respondents.
The details of the respondents’ profile, survey results and key next steps are presented in the accompanying pages.
Designation
A profile of the respondents and their organisations are as follows:
CEO/ COO/Managing Director
CRO/ Head of Risk
CAE/ Head of Internal Audit
CFO/ Head of Finance
11% 29% 25% 35%
Some of the notable demographics of the respondents are as follows:

© 2016 KPMG Advisory Services, a partnership registered in Nigeria, and a member of the KPMG network of independent member firms affiliated with KPMG International Cooperative (“KPMG International”), a Swiss entity. All rights reserved.
10 | Top 10 Business Risks in 2016
Companies withForeign Headquaters
Companies withNigerian Headquaters
24%
57%
76%
24%
19%
Nigerian Operations Only
Nigerian headquarters with operations outside Nigeria
Foreign headquarters with operations in Nigeria
Industry
Geographic Span
Ownership Structure
8%
60%32%ManufacturingEnergy
Telecommunications
43%
57%Listed
Non-listed

Top 10 Business Risks in 2016 | 11
© 2016 KPMG Advisory Services, a partnership registered in Nigeria, and a member of the KPMG network of independent member firms affiliated with KPMG International Cooperative (“KPMG International”), a Swiss entity. All rights reserved.
33%
27%
22%18%
$$$L O R E M I P S U M D O L O RLorem ipsum dolor sit amet, consectetur adipiscing elit.
Donec tincidunt mi id hendrerit iaculis.
RRRRRRRR EEEEEEEE MMMMMMMM PPPPPPPPPPPPPPPP SSSSSSSS UUUUUUUUUUUUUUU MMMMMMMMMMMMMMMMM OOOOOOOOOOOO LLLLLLLL OOOOOOOOOO RRRRRRRRL OO RLLLoLooorrreeemem ipsum
Don
LLLLLLL OOOOOOO RRRRRRRR
24%
22%
54%
Less than 1,000 employees
1,000 to less than 10,000 employees
More than 10,000 employees
less than $ 100 million
$ 100 million to less than $ 1 billion
$ 1 billion to less than $ 5 billion
More than $ 5 billion
Annual Turnover for 2014
Employee Strength

© 2016 KPMG Advisory Services, a partnership registered in Nigeria, and a member of the KPMG network of independent member firms affiliated with KPMG International Cooperative (“KPMG International”), a Swiss entity. All rights reserved.
12 | Top 10 Business Risks in 2016
3. Risk Survey ResultsRisk Survey Results
The survey respondents assessed an array of 28 risks across macro-economic, socio-political, strategic and operational dimensions. We classified
the risks into the following three (3) categories, based on their average scores on a scale of 1.00 to 5.00 as follows:
3.85
Macro-economic risk
3.76 3.33 3.21 3.19 3.07 2.97
2.96 2.91 2.86 2.85 2.78 2.76 2.71
2.61 2.58 2.56 2.56 2.54 2.50 2.49
2.47 2.46 2.42 2.38 2.33 2.28 2.25
1 Securityrisk5
Supply chainrisk9 Strategy &
budget managementrisk
13
IT infrastructurerisk
17 Third-party defaultsrisk
21
Reputation risk25
Crude oilprice risk2 Capital
availabilityrisk
6
Businesscontinuity & disaster recovery risk
10 Governancerisk14
Financial reportingrisk
18
Talent managementrisk
22 Data analyticsrisk
26
PoliticalRisk3 Regulatory
risk7
Health, safety & environmentrisk
11
Marketingrisk15 Product
qualityrisk
19
Strategic partner/ JV managementrisk
23 Social media impact risk
27
Energyrisk4
Competitionrisk8 Customer
satisfactionrisk
12
Cybersecurityrisk
16 Tax managementrisk
20
Disruptive charges risk24 Outsourcing
risk28
3.50 - 5.00High Risk Medium Risk
The level of each risk (1 - 28) and their value on a scale of 1.00 - 5.00 is presented below:
Low Risk2.50 - 3.49 2.49 or lower
Impact
Riskx Risk
Risk Ranking
Impact

Top 10 Business Risks in 2016 | 13
© 2016 KPMG Advisory Services, a partnership registered in Nigeria, and a member of the KPMG network of independent member firms affiliated with KPMG International Cooperative (“KPMG International”), a Swiss entity. All rights reserved.
The robust representation of survey participants enabled us to provide insight based on the industry, responsibility, ownership structure and annual turnover of organisations. In order to identify differences in risk concerns across various respondent types, we computed the standard deviation (“Std Dev”) to measure the level of variation of the responses provided by each of the respondent type for each risk. The results are as follows:
Results Based on Industry
We analysed the responses to determine the most significant difference in opinion of respondents across the three (3) industries. The results of responses across the industries are given below:
3.85Macro-economic risk
Crude oil price risk
Political risk
Energy risk
Security risk
Capital availability risk
Regulatory risk
Competition risk
Supply chain risk
Business continuity & disaster recovery risk
2
1
OverallRiskOverallRanking
3
4
5
6
7
8
9
10
3.76
3.33
3.21
3.19
3.07
2.97
2.96
2.91
2.86
3.70
Energy
4.09
3.26
3.26
2.87
3.00
2.91
2.65
2.48
2.74
3.93
Manufacturing
3.58
3.40
3.26
3.47
3.16
3.01
3.09
3.24
2.98
3.83
Telecommunications
3.83
3.17
2.67
2.50
2.67
2.89
3.17
2.17
2.50
0.10
Std.Dev.
0.22
0.11
0.32
0.47
0.24
0.06
0.23
0.53
0.23
Source: KPMG Analysis of survey results

© 2016 KPMG Advisory Services, a partnership registered in Nigeria, and a member of the KPMG network of independent member firms affiliated with KPMG International Cooperative (“KPMG International”), a Swiss entity. All rights reserved.
14 | Top 10 Business Risks in 2016
• The most significant variance was observed in the perception of respondents regarding the risk of supply chain failure, with a standard deviation of 0.53. The results reflect the significance of effective supply chain on the business models operated by the respective industries in Nigeria. Respondents in the manufacturing industry, considered the risk to be medium, while those in the energy and telecommunication industries considered it low. This may have resulted from the fact that manufacturing companies heavily depend on the sustainable supply of raw materials, packaging materials, warehouse services and other utilities for their operations. They also require effective distribution channels to convey their finished products to end-users.
• The second highest variance (0.47) was observed in the assessment of the risk of insecurity, with respondents in the
manufacturing industry assessing the risk as high, while those in the energy and telecommunication industries assessed it as medium. The results reflect the impact of the insecurity on the physical operations and value chain of the respective industries in Nigeria. For instance, the northern insurgency would be of high impact to organisations that depend on raw materials from the north or sell finished products to customers in the North or neighboring countries, such as Niger, Chad and Cameroon.
• Finally, respondents in the manufacturing and energy industries perceived energy risk to be higher than those in the telecommunication industry. This may not be unconnected to the fact that most of the telecommunication service providers rely on cheaper and more sustainable means of energy, such as inverters, to power their infrastructure including masts.
Key Findings

Top 10 Business Risks in 2016 | 15
© 2016 KPMG Advisory Services, a partnership registered in Nigeria, and a member of the KPMG network of independent member firms affiliated with KPMG International Cooperative (“KPMG International”), a Swiss entity. All rights reserved.
Results Based on Area of Responsibility
We analysed the responses to determine the most significant difference in opinion of respondents across
3.85Macro-economic risk
Crude oil price risk
Political risk
Energy risk
Security risk
Capital availability risk
Regulatory risk
Competition risk
Supply chain risk
Business continuity & disaster recovery risk
2
1
OverallRiskOverallRanking
3
4
5
6
7
8
9
10
3.76
3.33
3.21
3.19
3.07
2.97
2.96
2.91
2.86
4.25
3.75
3.88
2.88
3.00
3.00
2.83
2.88
3.13
2.75
3.88
CFO CAE CROCEO/COO
3.64
3.20
3.12
3.08
3.12
2.95
2.88
2.98
2.64
3.72
3.67
3.17
3.28
2.83
2.89
2.81
2.78
2.67
2.67
3.76
4.00
3.43
3.38
3.71
3.19
3.17
3.24
2.95
3.33
0.22
Std.Dev.
0.14
0.29
0.20
0.34
0.12
0.15
0.18
0.17
0.28
• The results of the risk survey reflected the respondents’ core focus areas. Generally, CROs and CEOs perceived a riskier environment, as they rate a greater number of risk to be ‘high’, relative to other respondents; while CFOs ranked risks with probable significant financial implications as ‘high’.
• The most significant variance noted was with the security risk, which had a standard deviation of 0.34. The Heads of Risk Management considered security risk as high (3.71), while Heads of Internal Audit and other respondents considered it as medium.
Key Findings
the four (4) areas of responsibility. The results of responses across the areas of responsibility are given below:
Source: KPMG Analysis of survey results

© 2016 KPMG Advisory Services, a partnership registered in Nigeria, and a member of the KPMG network of independent member firms affiliated with KPMG International Cooperative (“KPMG International”), a Swiss entity. All rights reserved.
16 | Top 10 Business Risks in 2016
Results Based on Ownership Structure
We analysed the responses to determine the most significant difference in publicly listed and privately
3.85Macro-economic risk
Crude oil price risk
Political risk
Energy risk
Security risk
Capital availability risk
Regulatory risk
Competition risk
Supply chain risk
Business continuity & disaster recovery risk
2
1
OverallRiskOverallRanking
3
4
5
6
7
8
9
10
3.76
3.33
3.21
3.19
3.07
2.97
2.96
2.91
2.86
3.95
Publicly Held Companies
3.71
3.27
3.20
3.24
3.12
2.94
3.02
3.07
2.80
3.71
3.84
3.42
3.23
3.13
3.00
3.00
2.87
2.69
2.94
0.12
Std.Dev.
0.07
0.08
0.02
0.06
0.06
0.03
0.08
0.19
0.07
Privately Held Companies
• There was no significant difference in the way public and private companies perceived risks, as the risk assessment results from respondents in both types of companies were fairly consistent. Additionally, the
standard deviation of their results ranged from 0.02 to 0.19. This suggests that the probability and impact of an event on an organisation’s objectives does not depend on its ownership structure.
Key Findings
owned companies. The results of responses for both types of companies are given below:
Source: KPMG Analysis of survey results

Top 10 Business Risks in 2016 | 17
© 2016 KPMG Advisory Services, a partnership registered in Nigeria, and a member of the KPMG network of independent member firms affiliated with KPMG International Cooperative (“KPMG International”), a Swiss entity. All rights reserved.
Source: KPMG Analysis of survey results
Results Based on Geographic Span
We analysed the responses to determine the most significant difference in opinion of respondents, based on the geographic presence of their companies globally.
3.85Macro-economic risk
Crude oil price risk
Political risk
Energy risk
Security risk
Capital availability risk
Regulatory risk
Competition risk
Supply chain risk
Business continuity & disaster recovery risk
2
1
OverallRiskOverallRanking
3
4
5
6
7
8
9
10
3.76
3.33
3.21
3.19
3.07
2.97
2.96
2.91
2.86
4.29
Nigeria headquarters with Operations outside Nigeria
Nigeria Operations Only
Non-Nigeria headquarters withoperations in Nigeria
4.21
3.50
3.79
3.43
3.14
3.26
3.14
3.25
3.07
3.78
3.73
3.41
3.22
3.27
3.27
2.93
2.90
2.84
2.95
3.65
3.47
3.00
2.71
2.82
2.53
2.82
2.94
2.79
2.47
0.28
Std.Dev.
0.31
0.22
0.44
0.26
0.33
0.19
0.11
0.21
0.26
3.85Macro-economic risk
Crude Oil price
Political risk
Energy risk
Security
Capital Availability
Supply Chain
Regulatory risk
Competition
Business continuity & disaster recovery
2
1
OverallRiskOverallRanking
3
4
5
6
7
8
9
10
3.76
3.33
3.21
3.19
3.07
2.91
2.99
2.96
2.86
4.25
CEO/ COO
3.75
3.88
2.88
3.00
3.00
2.83
2.88
3.13
2.75
3.88
CFO
3.64
3.20
3.12
3.08
3.12
2.95
2.88
2.98
2.64
3.72
CAE
3.67
3.17
3.28
2.83
2.89
2.81
2.78
2.67
2.67
3.76
CRO
4.00
3.43
3.38
3.71
3.19
3.17
3.24
2.95
3.33
0.22
Std.Dev.
0.14
0.29
0.20
0.34
0.12
0.15
0.18
0.17
0.28
• Generally, the top 10 risks appear to be lower for multinational companies in Nigeria. The risks increased as the geographic diversification of the organisations reduced. This may be due to the fact that multinational companies implement standardised processes and robust assurance mechanisms, in order to manage their operations globally in line with leading practices. To this end, multinationals tend to have stronger control environments. The results clearly suggests an inverse relationship between the control
environment and residual risk exposure of an organisation. In other words, a higher control environment significantly contributes to lower risk exposures.
• Energy risk had the highest standard deviation of 0.44. Nigerian companies appear to be most impacted by the irregular supply of power, while foreign companies operating in Nigeria seem to be least impacted. This suggests that energy risk has a more profound effect on companies domiciled in Nigeria and vice versa.
Key Findings
The results of responses for the various types of companies are given below:
© 2016 KPMG Advisory Services, a partnership registered in Nigeria, and a member of the KPMG network of independent member firms affiliated with KPMG International Cooperative (“KPMG International”), a Swiss entity. All rights reserved.
18 | Top 10 Business Risks in 2016
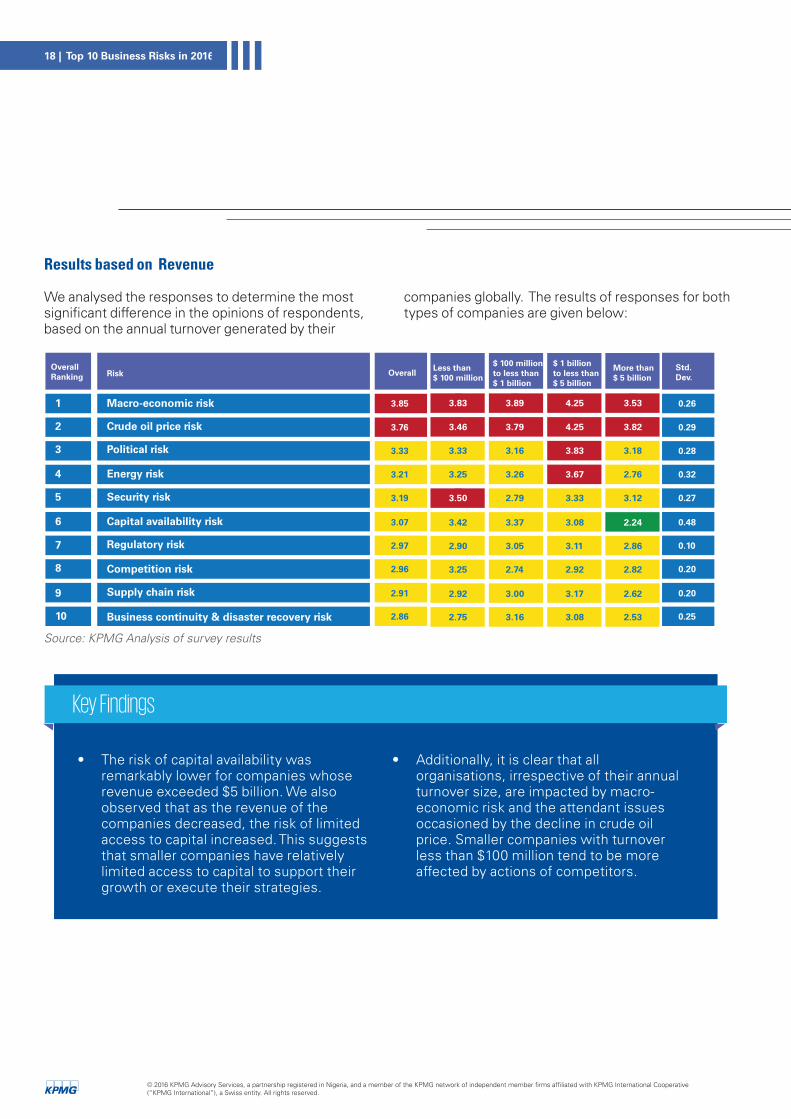
Results based on Revenue
We analysed the responses to determine the most significant difference in the opinions of respondents, based on the annual turnover generated by their
3.85Macro-economic risk
Crude oil price risk
Political risk
Energy risk
Security risk
Capital availability risk
Regulatory risk
Competition risk
Supply chain risk
Business continuity & disaster recovery risk
2
1
OverallRiskOverallRanking
3
4
5
6
7
8
9
10
3.76
3.33
3.21
3.19
3.07
2.97
2.96
2.91
2.86
3.83
3.46
3.33
3.25
3.50
3.42
2.90
3.25
2.92
2.75
3.89
$ 100 million to less than $ 1 billion
$ 1 billion to less than $ 5 billion
More than $ 5 billion
Less than $ 100 million
3.79
3.16
3.26
2.79
3.37
3.05
2.74
3.00
3.16
4.25
4.25
3.83
3.67
3.33
3.08
3.11
2.92
3.17
3.08
3.53
3.82
3.18
2.76
3.12
2.24
2.86
2.82
2.62
2.53
0.26
Std.Dev.
0.29
0.28
0.32
0.27
0.48
0.10
0.20
0.20
0.25
• The risk of capital availability was remarkably lower for companies whose revenue exceeded $5 billion. We also observed that as the revenue of the companies decreased, the risk of limited access to capital increased. This suggests that smaller companies have relatively limited access to capital to support their growth or execute their strategies.
• Additionally, it is clear that all organisations, irrespective of their annual turnover size, are impacted by macro-economic risk and the attendant issues occasioned by the decline in crude oil price. Smaller companies with turnover less than $100 million tend to be more affected by actions of competitors.
Key Findings
companies globally. The results of responses for both types of companies are given below:
Source: KPMG Analysis of survey results

Top 10 Business Risks in 2016 | 19
© 2016 KPMG Advisory Services, a partnership registered in Nigeria, and a member of the KPMG network of independent member firms affiliated with KPMG International Cooperative (“KPMG International”), a Swiss entity. All rights reserved.
Risk Trends
Generally, 95% of the respondents believed that their organisation has been exposed to increased risks, over the last two (2) to three (3) years. See below for details:
Companies Not exposedto increased risks
No response
95%
1%
4%
Companies exposedto increased risks
© 2016 KPMG Advisory Services, a partnership registered in Nigeria, and a member of the KPMG network of independent member firms affiliated with KPMG International Cooperative (“KPMG International”), a Swiss entity. All rights reserved.
20 | Top 10 Business Risks in 2016
0
10
20
30
40
50
29 30
1
179 7 4
16 11
20
54
2
6
4
34
11
1
Uncertainty caused by recession & financial crisis
Unstable geopolitical environment
Pressure from regulators& regulatory compliance
requirements
Corporaterestructuring M&Aactivity & business
transformationinitiatives
Recent reputationalevent
Manufacturing Energy Telecommunications
International Operators
Investors’ demandfor greater disclosures
& accountability
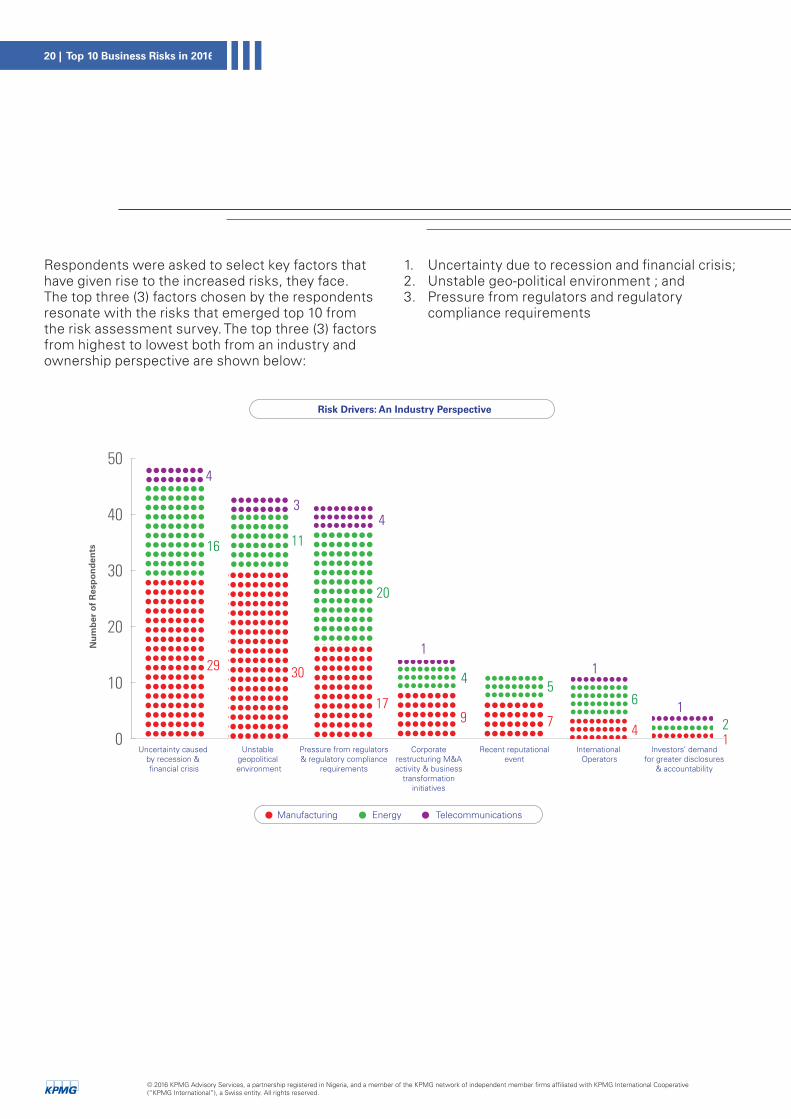
Risk Drivers: An Industry Perspective
Nu
mb
er o
f R
esp
on
den
ts
Respondents were asked to select key factors that have given rise to the increased risks, they face. The top three (3) factors chosen by the respondents resonate with the risks that emerged top 10 from the risk assessment survey. The top three (3) factors from highest to lowest both from an industry and ownership perspective are shown below:
1. Uncertainty due to recession and financial crisis;2. Unstable geo-political environment ; and3. Pressure from regulators and regulatory
compliance requirements

Top 10 Business Risks in 2016 | 21
© 2016 KPMG Advisory Services, a partnership registered in Nigeria, and a member of the KPMG network of independent member firms affiliated with KPMG International Cooperative (“KPMG International”), a Swiss entity. All rights reserved.
The perception of respondents on the key factors based on industry is given below:
0
10
20
30
40
50
Uncertainty caused by recession & financial crisis
Unstable geopolitical environment
Pressure from regulators& regulatory compliance
requirements
Corporaterestructuring M&Aactivity & business
transformationinitiatives
Recent reputationalevent
International Operators
Investors’ demandfor greater disclosures
& accountability
Publicly Held Companies Privately Held Companies
Risk Drivers: An Ownership Perspective
Nu
mb
er o
f R
esp
on
den
ts
19
2020
3
3
8 7 144
11
212430

© 2016 KPMG Advisory Services, a partnership registered in Nigeria, and a member of the KPMG network of independent member firms affiliated with KPMG International Cooperative (“KPMG International”), a Swiss entity. All rights reserved.
22 | Top 10 Business Risks in 2016
No response
Almost Certain
Likely
Possible
Unlikely
53%
28%
15%
3%1%
%
4. The Way ForwardGiven the increase in risks faced by businesses in 2016, 81% of the respondents noted that they were likely to devote more time and resources to risk
management this year. 53% out of 81% were almost certain that they would. See below for details:
Increased Commitment to Risk Management this Year.

Top 10 Business Risks in 2016 | 23
© 2016 KPMG Advisory Services, a partnership registered in Nigeria, and a member of the KPMG network of independent member firms affiliated with KPMG International Cooperative (“KPMG International”), a Swiss entity. All rights reserved.
Almost certain to devote resources to risk management
No Response
No Increase in Risks
Increase inRisks
Likely to devote resources to risk management
May possibly devote resources to risk management
Unlikely to devote resources to risk management
No response
Level of Risk & Commitment to Risk Management
Number of Respondents
0 10 20 30 40 50 60 70 80
KPMG’s View....Walking the Talk
The high proportion of companies planning to invest in risk management for competitive advantage could be likened to an old story, where a huge bear appeared in front of two campers in the woods and began to run towards them. The first camper dropped his bag and put on a pair of sneakers. The second camper asked, “What are you doing? Sneakers won’t help you outrun that bear.” The first camper replied: “I know I can’t run faster than the bear. I just have to run faster than you.”
The reality is that only few companies can sustain their performance in the face of significant
changes in their operating environments, and risk management is one of the factors they all seem to have in common. The significance of enterprise risk management in helping organisations anticipate and respond quicker to risk events, cannot be over-emphasized.
To this end, the key question is, how can organisations successfully implement an effective risk management process? Depending on the maturity of your existing risk management framework, leading practices suggest that the following actions should be top priorities, over the next few months:

© 2016 KPMG Advisory Services, a partnership registered in Nigeria, and a member of the KPMG network of independent member firms affiliated with KPMG International Cooperative (“KPMG International”), a Swiss entity. All rights reserved.
24 | Top 10 Business Risks in 2016
1. Review the current state of risk management within your organisation: This review involves taking a fresh and holistic look at your risk management goals, structures, processes and strategies, in order to identify opportunities for improvement.
2. Facilitate regular risk assessments: This is to enable your organisation identify, assess and prioritise, its known and emerging risk exposures that may impact the achievement of organisational objectives. It is also imperative to develop mitigating strategies that define actions to be taken to address the identified risks, identify risk owners and assign responsibilities to them.
3. Establish an effective risk management process: The following activities are essential in implementing an effective risk management process:
• Establishariskgovernancestructurethroughwhich an organisation directs, monitors and reports its risk management activities. Where risk management practices within your organisation is at its infancy and quite informal, it may be appropriate to lay the right foundation this year by clearly defining the governance structure & process for identifying, assessing, monitoring and reporting on risks, defining roles and responsibilities and reporting lines within the organisation up to the board level.
• Designkeyriskindicatorsthatprovideearlywarning signals for potential risk events. Their effectiveness depends on their ability to predict risks in a timely and accurate manner.
• Definetheriskappetiteandthresholdlimits which reflect the amount of risk your organisation is willing to accept in pursuit of value. This may vary with strategic objectives, stakeholder expectations, evolving industry and market conditions, organisational culture and external factors.
• Continuouslymonitorandreportrisklevelsagainst established risk limits, as well as the status of implementation of mitigating strategies developed for risks identified within your organisation. It is imperative to have a risk reporting framework, which defines the content, frequency and responsibility for risk related reports.
4. Reinforce existing risk culture: Risk culture comprises the values and behaviours within your organisation that shape risk decisions. A strong risk culture helps to encourage stakeholders to carefully weigh the risk and benefit of their actions, and take decisions that are in the long-term interest of the organisation.
5. Enhance regulatory compliance process: In the light of increased regulatory scrutiny, regulatory risk has clearly become a top risk, given its reputational and financial impact on organisations. To this end, the need for mechanisms to effectively monitor regulatory compliance risk cannot be over-emphasized. Some of the mechanisms include facilitation of periodic regulatory risk assessments and maintaining an up-to-date compliance rule book as a comprehensive repository of all regulations impacting an organisation. The rule book may be further enhanced by automating the process for notifying responsible officers of their compliance obligations and escalating non-compliance to supervisors in a timely manner. Lastly, obtaining independent assurance on the level of compliance with applicable laws and regulations is imperative.
6. Increase board oversight and involvement:The overarching responsibility for risk management lies with the board. In order to ensure continuous stakeholder value in view of the challenging times ahead, risk management constitutes a critical component in the oversight provided by the board. The board, with the support of management, should lead the way forward by setting an overall risk culture at the top and ensuring the

Top 10 Business Risks in 2016 | 25
© 2016 KPMG Advisory Services, a partnership registered in Nigeria, and a member of the KPMG network of independent member firms affiliated with KPMG International Cooperative (“KPMG International”), a Swiss entity. All rights reserved.
establishment and implementation of an effective risk management framework.
Some of the key questions that would enable directors assess the current state of risk management in their organisation include
Based on the foregoing, it is imperative for each organisation to carefully evaluate and put an effective risk management structure and process in place. If you have begun the risk management journey, it is essential
to determine which aspects of your risk management process require enhancements and take active steps in addressing them.
1. Does your risk profile reflect your current and emerging risks?
2. Is there adequate oversight on critical risks facing your company?
3. Have you established early warning mechanisms to alert your company on emerging risks?
4. Are you satisfied with the quality of the risk reports you receive?
5. Have you defined the accountabilities and responsibilities for managing risks in your company?
6. Does your existing risk culture encourage the right organisational behaviours?
7. Is your company prepared to respond to extreme events?
8. Does risk management constitute an integral part of your organisation’s strategic planning process?
“The only alternative to Risk Management is Crisis Management – and crisis management is much more expensive, time consuming and embarrassing.”
- James Lam, Enterprise Risk Management, Wiley Finance © 2003

© 2016 KPMG Advisory Services, a partnership registered in Nigeria, and a member of the KPMG network of independent member firms affiliated with KPMG International Cooperative (“KPMG International”), a Swiss entity. All rights reserved.
26 | Top 10 Business Risks in 2016
AppendixGlossary of Terms
CAE Chief Audit Executive or Equivalent
CFO Chef Finance Officer or Equivalent
CEO Chief Executive Officer or Equivalent
CRO Chief Risk Officer
ERM Enterprise Risk Management
COO Chief Operating Officer
Std. Dev Standard Deviation

Top 10 Business Risks in 2016 | 27
© 2016 KPMG Advisory Services, a partnership registered in Nigeria, and a member of the KPMG network of independent member firms affiliated with KPMG International Cooperative (“KPMG International”), a Swiss entity. All rights reserved.

Olumide Olayinka Partner & Head, Risk Consulting T: +234 803 402 0977E: [email protected]
Dimeji Salaudeen Partner, Risk Consulting T: +234 803 402 0991 E: [email protected]
Tomi Adepoju Partner, Risk ConsultingT: +234 803 402 0952E: tomi [email protected]
Tolu Odukale Associate Director, Risk Consulting T: +234 803 403 5541 E: [email protected]
Seun Olaniyan Assistant Manager, Risk Consulting T: +234 812 831 8821 E: [email protected]
Contact us
kpmg.com/ng
The views and opinions expressed herein are those of the survey respondents and do not necessarily represent the views and opinions of KPMG.The information contained herein is of a general nature and is not intended to address the circumstances of any particular individual or entity.Although we endeavour to provide accurate and timely information, there can be no guarantee that such information is accurate as of the date it isreceived or that it will continue to be accurate in the future. No one should act on such information without appropriate professional advice after athorough examination of the particular situation.
© 2016 KPMG Advisory Services, a Nigerian partnership, member firm of the KPMG network of independent firms affiliated with KPMGInternational Cooperative (“KPMG International”), a Swiss entity. KPMG International provides no client services. No member firm has anyauthority to obligate or bind KPMG International or any other member firm vis-à-vis third parties, nor does KPMG International have any suchauthority to obligate or bind any member firm. All rights reserved.Any trademarks or service marks identified in this document are the property of their respective owner(s).The KPMG name and logo are registered trademarks or trademarks of KPMG International.
kpmg.com/socialmedia