tools for determining yield stress of in-service...
TRANSCRIPT

Highway IDEA Program
Tools for Determining Yield Stress of In-Service Gusset Plates
Final Report for Highway IDEA Project 161
Prepared by:
Christopher Higgins and Therese M. Pflaum
Oregon State University
June, 2014
Innovations Deserving Exploratory Analysis (IDEA) Programs Managed by the Transportation Research Board
This IDEA project was funded by the NCHRP IDEA Program.
The TRB currently manages the following three IDEA programs:
• The NCHRP IDEA Program, which focuses on advances in the design, construction, and maintenance of highway systems, is funded by American Association of State Highway and Transportation Officials (AASHTO) as part of the National Cooperative Highway Research Program (NCHRP).
• The Safety IDEA Program currently focuses on innovative approaches for improving railroad safety or performance. The program is currently funded by the Federal Railroad Administration (FRA). The program was previously jointly funded by the Federal Motor Carrier Safety Administration (FMCSA) and the FRA.
• The Transit IDEA Program, which supports development and testing of innovative concepts and methods for advancing transit practice, is funded by the Federal Transit Administration (FTA) as part of the Transit Cooperative Research Program (TCRP).
Management of the three IDEA programs is coordinated to promote the development and testing of innovative concepts, methods, and technologies.
For information on the IDEA programs, check the IDEA website (www.trb.org/idea). For questions, contact the IDEA programs office by telephone at (202) 334-3310.
IDEA Programs Transportation Research Board 500 Fifth Street, NW Washington, DC 20001
The project that is the subject of this contractor-authored report was a part of the Innovations Deserving Exploratory Analysis (IDEA) Programs, which are managed by the Transportation Research Board (TRB) with the approval of the Governing Board of the National Research Council. The members of the oversight committee that monitored the project and reviewed the report were chosen for their special competencies and with regard for appropriate balance. The views expressed in this report are those of the contractor who conducted the investigation documented in this report and do not necessarily reflect those of the Transportation Research Board, the National Research Council, or the sponsors of the IDEA Programs. This document has not been edited by TRB.
The Transportation Research Board of the National Academies, the National Research Council, and the organizations that sponsor the IDEA Programs do not endorse products or manufacturers. Trade or manufacturers' names appear herein solely because they are considered essential to the object of the investigation.

Tools for Determining Yield Stress of In-Service Gusset Plates
IDEA Program Final Report
NCHRP-IDEA 161
Prepared for the IDEA Program
Transportation Research Board
The National Academies
Christopher Higgins, Ph.D., P.E.
and
Therese M. Pflaum
School of Civil and Construction Engineering
Oregon State University
Corvallis, OR 97331
6/9/2014

NCHRP IDEA PROGRAM COMMITTEE
CHAIR SANDRA Q. LARSON Iowa DOT
MEMBERS DUANE BRAUTIGAM Florida DOT ANNE ELLIS Arizona DOT GARY A. FREDERICK New York State DOT LAWERENCE HARMAN Bridgewater State University JOE HORTON California DOT MAGDY MIKHAIL Texas DOT TOMMY NANTUNG Indiana DOT MARTIN PIETRUCHA Pennsylvania State University VALERIE SHUMAN Shuman Consulting Group LLC L.DAVID SUITS North American Geosynthetics Society JOYCE TAYLOR Maine DOT
FHWA LIAISON DAVID KUEHN Federal Highway Administration
TRB LIAISON RICHARD CUNARD Transportation Research Board
COOPERATIVE RESEARCH PROGRAM STAFF STEPHEN PARKER Senior Program Officer
IDEA PROGRAMS STAFF STEPHEN R. GODWIN Director for Studies and Special Programs JON M. WILLIAMS Program Director, IDEA and Synthesis Studies INAM JAWED Senior Program Officer DEMISHA WILLIAMS Senior Program Assistant
EXPERT REVIEW PANEL JUSTIN ONCIL, Federal Highway Administration AHMAD ABOU HAWASH, Iowa DOT SANDRA LARSON, Iowa DOT MICHAEL SPRINKEL, Virginia DOT
TABLE OF CONTENTS
Executive Summary 1
1.0 Idea Product 3
2.0 Concept and Innovation 3
3.0 Investigation 4
3.1 Prototype Design 5
3.2 Plate Specimen Descriptions 7
3.3 Reference Tensile Material Properties 9
3.4 Experimental Tests of Plate Samples with Prototype Device 12
3.4.1 Beam Specimens 12
3.4.2 Stress-Free Rectangular Plate Specimens 13
3.4.3 Axially-Stressed Plate Specimens 14
3.5 Experimental Results from Plate Samples with Prototype Device 15
3.5.1 Prototype Device Load Correlation to Mill Scale Flaking 16
3.5.2 Prototype Device Load Time-History Response 17
3.5.3 Prototype Device Load vs. Plate Deflection 18
3.5.4 Prototype Device Load Correlation with Finite Element Models 19
3.5.5 Demonstration of Offset Method 20
3.5.5.1 Blind Prediction of Yield Stress on Full-Size Gusset Plate 26
4.0 Plans for Implementation 27
5.0 References 29
EXECUTIVE SUMMARY
On August 1, 2007 the I-35W Bridge in Minneapolis, MN suddenly collapsed. An investigation conducted by the
National Transportation Safety Board (NTSB) concluded that the bridge collapse was due to an under-designed gusset
plate and stockpiled materials that over-stressed the deficient connections (1). In response, the Federal Highway
Administration (FHWA) mandated rating of gusset plate connections for truss bridges (2).
Currently, most transportation agencies conduct connection ratings using specified material properties and design
drawings as the analysis inputs. Yet, to produce the intended outcome of bridge safety without excessive and costly
conservatism, connection ratings are best performed using as-built data. These include both geometrical and material
properties. While geometrical dimensions can be obtained in the field, there is no recognized nondestructive testing
method currently available to establish the yield stress of plate materials in the field. Typically, the minimum yield stress
of steel is obtained using tensile coupons tested in accordance with American Society for Testing and Materials (ASTM)
E8 (3). However, to collect samples for testing is destructive and most bridge owners are reluctant to remove samples
from in-service guest plates.
To overcome this limitation, a practical device that can estimate the yield stress of bridge steel plates was
developed in this research program. The prototype device is shown in Fig. 1. The prototype device is fabricated from
titanium which has very high strength and relatively low weight to facilitate field portability. The hand-held device uses a
manually actuated hydraulic cylinder to apply an out-of-plane load to the free edge of a steel plate as illustrated in Fig. 2.
The applied load, measured with a load cell, creates bending deflection of the plate that is measured with a displacement
sensor. The applied load and plate displacement measurements are collected with a portable data acquisition system. Both
the prototype device and data collection system are self-contained and require no external power source. This portability
allows a bridge inspector to collect and analyze data in the field. The acquired load and deformation data are used to
estimate the yield stress as the deflections become nonlinear at the onset of plate yielding. The load and deformation
responses are calibrated to finite element (FE) analyses and empirical reference tests. Based on statistical analysis of
results with the prototype device over a range of plate materials and thicknesses, a yield stress reduction factor of 0.85
was developed to ensure that the predicted yield stress would not exceed the actual yield stress with 1/10,000 probability
when three (3) replicate tests are performed. The device is capable of testing mild steel plates up to 1 in. thick. After
testing, there are imperceptible residual displacements on the plate at the defined yielding threshold. These characteristics
provide a nondestructive method to estimate the yield stress of bridge steel plates in the field which was previously not
possible and as such is a technological breakthrough.
1

FIGURE 0 Prototype device to nondestructively determine the yield stress of steel connection plates.
FIGURE 2 Prototype device applied to full-scale gusset plate in the laboratory.
FIGURE 3 Close-up view of prototype device attached to the edge of a steel plate.
2

1.0 IDEA PRODUCT
The product of this IDEA project is a prototype device that is hand portable and can be applied by bridge inspectors to
non-destructively estimate the yield stress of in-situ gusset plates on truss bridges. The prototype device was shown
previously in Figs. 1 to 3. The development of this prototype device and the testing methods serve three major roles for
improving the practice of connection evaluations for truss bridges. It will 1) allow bridge owners to establish the material
properties for bridges that do not have documentation of the materials used in construction, 2) allow rating engineers to
determine if the yield stress is above the minimum required for the connection to achieve a specific rating, or 3) enable
rating engineers to use the actual yield stress of the plate to extract the most capacity from the connection. The research
outcome enables bridge owners to establish connection capacity with greater certainty and can thereby prevent
unnecessary and costly bridge posting, rehabilitation, or replacement. The broader application of the device to existing
steel infrastructure systems (not only bridges, but transit and building structures) enables higher fidelity evaluation by
providing the analyst with more precise material input parameters for conducting assessments.
2.0 CONCEPT AND INNOVATION
To perform connection ratings according to new regulations that require evaluation of steel truss bridge gusset plates,
transportation agencies need to know the yield stress of the connection plate materials. Many owners rely on the nominal
yield stress that is shown in design drawings or, when unknown, make assumptions based on materials available at the
time of construction. For engineers to perform accurate and therefore economic analyses of gusset plates, the actual yield
stress of the connections is ideal. The universally accepted method to obtain the yield stress is to perform tensile tests of
sample coupons in conformance with ASTM E8 (2). However, this method is destructive because samples must be
collected from the bridge and owners are reluctant to remove them.
One way in which researches have tried to non-destructively determine the yield stress of metals is through the use
of hardness testing. Hardness is a measure of the material resistance to localized plastic deformation. Previous work in
this area includes that by (4), (5), (6), (7), (8), and (9). While some approaches have related hardness to yield stress, it is
mostly used for assessing ultimate stress and most data are from metals with relatively high strength or processing
methods that are different than those of bridge steels considered in this research. There are therefore, no currently
available, non-destructive methods of determining yield stress for in-situ bridge gusset plates.
The yield stress of steel as determined by uniaxial tension tests of coupon samples can be described in many
different ways, as illustrated in Fig. 4 (10). The current research focus is on the dynamic and static yield stress, with the
dynamic yield stress used for most analysis purposes. Dynamic yield stress (σyd) is the average stress during actual
yielding in the plastic range, which remains fairly constant, provided that the strain rate remains constant. Static yield
stress (σys) is the average stress during actual yielding in the plastic range at a zero strain rate (11).
3

Figure 4 Different definitions of yield stress reproduced from Rao, Lohrman, and Tall (10).
It is difficult and costly to remove material samples from in-situ steel plates to perform the uniaxial tension tests
required to conventionally establish yield stress. Further, owners are reluctant to remove materials from in service
bridges. Therefore an alternative approach was devised by the research team to determine yield stress of steel gusset
plates. Rather than rely on uniaxial tension to establish yield stress, the approach relies on thin plate bending theory (12)
to induce bending at the free edge of the plate that produces flexural yielding in the material. To produce bending of the
plates required development of a self-reacting system for applying and reacting the forces on the plate, as well as
measurement of the plate deformations. The device needed to be strong, lightweight, self-powered, and robust to enable
field portability. The plate bending measurements needed to be empirically calibrated to uniaxial tension test results over
a range of plate thickness, nominal yield stresses, and locked-in plate stresses. Further, to extend the range of
applicability for the device, finite element analyses were required over a wider range of plate variables.
3.0 INVESTIGATION
A prototype device was designed that could apply a point force to the edge of a steel plate. The device and corresponding
finite element models were first calibrated with steel plate samples having only one-way bending across the plate (beam
tests). Then the device and corresponding finite element models were calibrated to larger-sized steel plate samples that
4

were representative of gusset plates which produce a two-dimensional plate bending. Two types of large-sized samples
were investigated: 1) stress-free plates without externally applied stresses and 2) axially-stressed plates to quantify the
effects of dead load plate stresses. The results from the prototype device were compared with yield stress results
determined according to ASTM E8 (3). Finally, using statistical data from the test program, a methodology was
developed to estimate the in-situ yield stress of steel gusset plates with a very low probability of overestimating the actual
yield stress. It is noted here that additional details of the research conducted for this project are reported by Pflaum (13).
3.1 PROTOTYPE DESIGN
The prototype device was designed to apply out-of plane bending deformations to the free edge of a steel plate. It
required high strength and lightweight. A 44.5 kN (10 kips) capacity, manually-operated, hydraulic mini-bottle jack was
selected to apply force to the free edge of the plate. A 44.5 kN (10 kip) capacity load cell was placed in-line with
hydraulic jack to directly measure the applied load. The span length for the device was selected to be 254 mm (10 in.) to
meet the requirements of thin plate theory considering plate thicknesses up to 25 mm (1 in.). Other dimensions were
designed around the force capacity and 63.5 mm (2.5 in.) tall mini-bottle jack. The loading and reaction points occur 12.7
mm (1/2 in.) in from the free edge of the plate being tested. To minimize weight, the prototype device was fabricated
from ASTM B265 Grade 5 (13) titanium plate having a yield stress of 896 MPa (130 ksi). Structural analysis of the
device components verified it would remain elastic at the maximum applied force. Hemispherically-shaped hardened-
steel supports were designed to be interchangeable allowing for testing of plates with various thicknesses. The prototype
device is illustrated schematically in Fig. 5. The weight of the prototype was just under 4.5 kg (10 lbs) and the total cost
to produce the device was approximately $4,000. The proposed weight and size of the prototype device would make it
applicable to a wide range of in situ connections.
5
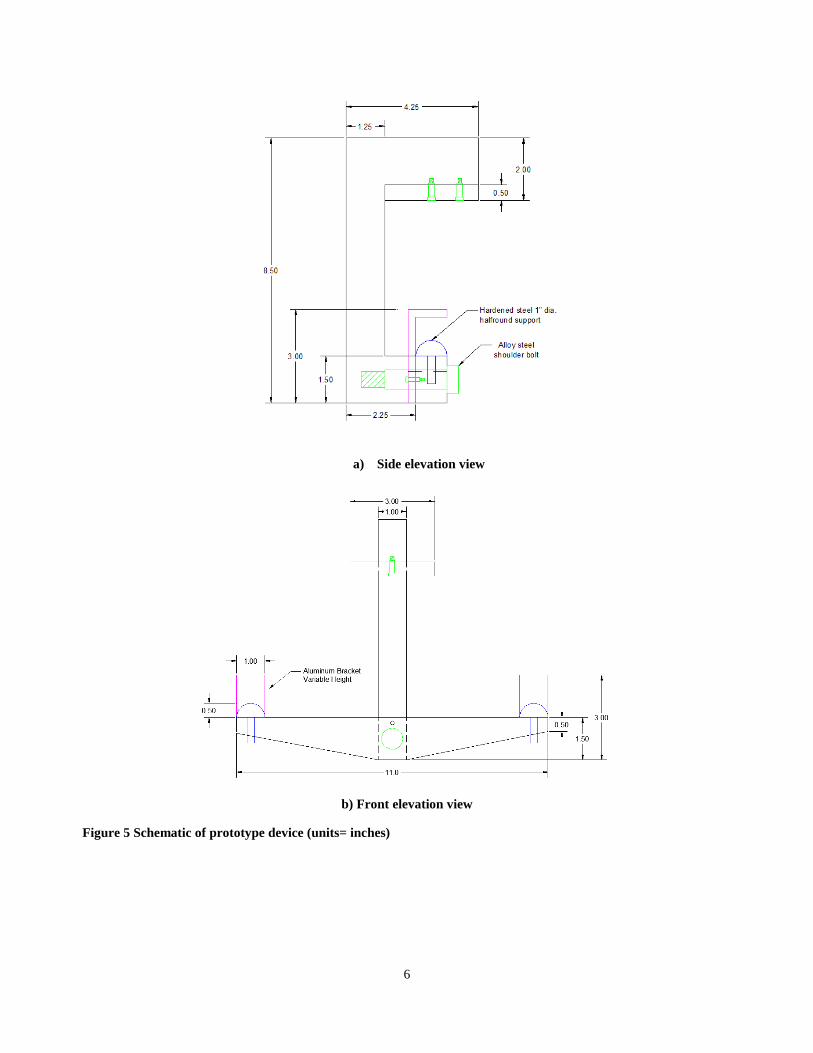
a) Side elevation view
b) Front elevation view
Figure 5 Schematic of prototype device (units= inches)
6
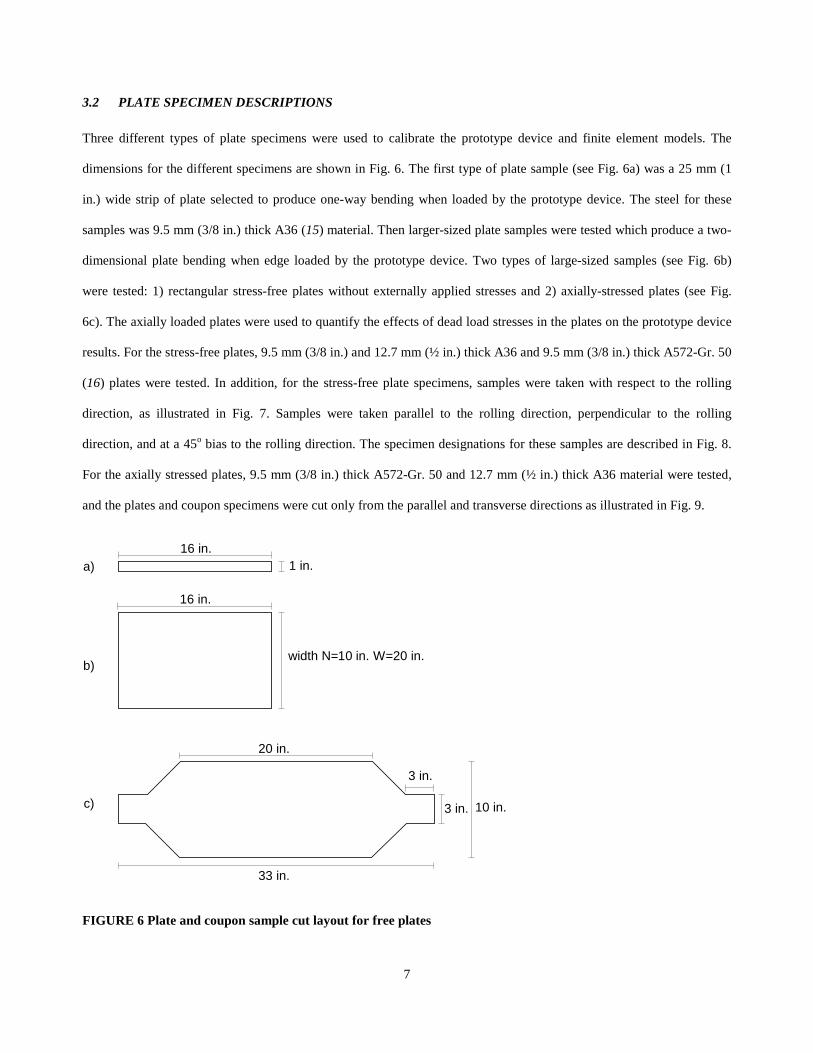
3.2 PLATE SPECIMEN DESCRIPTIONS
Three different types of plate specimens were used to calibrate the prototype device and finite element models. The
dimensions for the different specimens are shown in Fig. 6. The first type of plate sample (see Fig. 6a) was a 25 mm (1
in.) wide strip of plate selected to produce one-way bending when loaded by the prototype device. The steel for these
samples was 9.5 mm (3/8 in.) thick A36 (15) material. Then larger-sized plate samples were tested which produce a two-
dimensional plate bending when edge loaded by the prototype device. Two types of large-sized samples (see Fig. 6b)
were tested: 1) rectangular stress-free plates without externally applied stresses and 2) axially-stressed plates (see Fig.
6c). The axially loaded plates were used to quantify the effects of dead load stresses in the plates on the prototype device
results. For the stress-free plates, 9.5 mm (3/8 in.) and 12.7 mm (½ in.) thick A36 and 9.5 mm (3/8 in.) thick A572-Gr. 50
(16) plates were tested. In addition, for the stress-free plate specimens, samples were taken with respect to the rolling
direction, as illustrated in Fig. 7. Samples were taken parallel to the rolling direction, perpendicular to the rolling
direction, and at a 45o bias to the rolling direction. The specimen designations for these samples are described in Fig. 8.
For the axially stressed plates, 9.5 mm (3/8 in.) thick A572-Gr. 50 and 12.7 mm (½ in.) thick A36 material were tested,
and the plates and coupon specimens were cut only from the parallel and transverse directions as illustrated in Fig. 9.
width N=10 in. W=20 in.
16 in.
16 in.
1 in.a)
b)
c)
33 in.
20 in.
3 in.
3 in. 10 in.
FIGURE 6 Plate and coupon sample cut layout for free plates
7

FIGURE 7 Plate and coupon sample cut layout for stress-free plates
PN1aRolling Direction: P=Parallel
T=TransverseB=45 deg. Bias
N=10 in. wideW=20 in. wide
Repetitive Plate Sample: 1-3
Side: a=:Leftb=Right
FIGURE 8 Specimen designations for plate samples
8

FIGURE 9 Plate and coupon sample cut layout for axially stressed plates
3.3 REFERENCE TENSILE MATERIAL PROPERTIES
To establish the reference material properties for the plate materials used in the program, tensile tests were performed on
coupon samples in accordance with ASTM E8 (3). For each plate type tested, three (3) replicate coupon samples were
machined from the plate material in close proximity to the specimens tested with the prototype device. A total of fifty-
four (54) tension coupons were tested. The dog-bone or sheet type specimen with a 2 in. gage length was used for the
material testing, as illustrated in Fig. 8. This specimen type is permitted by ASTM E8 (3) for material thickness up to 19
mm (0.75 in.) All pretest measurements and markings were also performed in accordance with this specification. As
indicated previously, the coupons were also taken with respect to the rolling direction to assess this influence on the
mechanical properties.
9

FIGURE 10 Dimensions for typical dog-bone style tension coupon for reference material property tests
Tension tests were performed with a two-post 489 kN (110 kip) capacity universal testing machine with top-
loading hydraulic wedge grips. Coupons were initially loaded at a rate of 0.0076 mm/sec. (0.0003 in./sec.). Once the
specimen reached the upper yield point, the static yield was attained by holding the displacement for a period of 60
seconds, at three (3) regions along the yield plateau. When strain hardening began, the loading rate was gradually
increased to 0.127 mm/sec. (0.005 in./sec.) until the coupon fractured.
The coupon test results were measured in engineering stress and engineering strain. However for use in FEA the
material inputs of true stress and true plastic strain are required. Unlike engineering stress, true stress accounts for the
instantaneous area reduction of a sample throughout the test. Conversions from engineering stress (σ) and strain (ε) to
true stress (σT) and true plastic strain (εT) (17) were performed as:
𝜀𝑇 = ln (1 + 𝜀) [1]
𝜎𝑇 = σ(1 + 𝜀) [2]
𝜀𝑝𝑙𝑎𝑠𝑡𝑖𝑐 = 𝜀𝑇 −(𝜎𝑇 /𝐸) [3]
A summary of the coupon test data is presented in Table 1. Reported data includes the average dynamic yield at
0.2 % offset (Fyd), average static yield (Fys), stress reduction from dynamic to static yield, average tensile strength (Fu), as
well as the mean and standard deviation for coupons taken from each of the rolling directions. Average engineering
stress-strain responses for the coupon data sets are shown in Fig. 11.
10

TABLE 1 Measured tensile engineering material properties results for coupon samples per ASTM E8 (3).
Rolling Direction
Average Dynamic Yield Stress at 0.2%
Offset
Fyd
(ksi)
Average Static Yield Stress
Fys
(ksi)
Difference between
Dynamic and Static Yield
Stress
(ksi)
Average Ultimate
Stress
Fu
(ksi)
3/8 in. thick A36 steel
Parallel 41.73 39.60 2.13 65.90
Transverse 41.61 39.34 2.27 66.17
45 ͦ Bias 42.01 39.57 2.44 66.30
Mean 41.79 39.50 2.29 66.12
Std. Dev. 1.02 1.26 0.64 0.55
½ in. thick A36 steel
Parallel 42.13 39.39 2.74 66.05
Transverse 44.89 42.92 1.97 65.92
Mean 43.51 41.16 2.36 65.99
Std. Dev. 2.03 1.70 0.59 1.09
3/8 in. thick A572-Gr. 50 steel
Parallel 56.84 53.52 3.32 66.63
Transverse 58.72 55.79 2.93 68.2
Mean 57.72 54.66 3.13 67.42
Std. Dev. 2.54 2.10 0.97 1.19
11

FIGURE 11 Average engineering stress-strain response of coupon samples by material , thickness, and rolling
direction.
3.4 EXPERIMENTAL TESTS OF PLATE SAMPLES WITH PROTOTYPE DEVICE
To calibrate the prototype device and FE models to the canonical tension coupon yield material properties determined
previously, several different tests were performed. Four (4) beam specimens, twenty (20) stress-free two-way bending
tests were conducted, and eight (8) tests were conducted on the axially stressed plate specimens. The test methods and
results are described below.
3.4.1 Beam Specimens
Four (4) beam-type plate specimens were tested. These were narrow strips of uniform width taken from the steel plate
material (see Fig. 6a). The material for these specimens was 9.5 mm (3/8 in.) thick A36 plate taken from the parallel to
rolling direction. Specimens were proportioned such that the prototype device loading produced uniform being across the
plate width (negligible transverse curvature). This corresponds to beam behavior rather than plate behavior and enables
test results to be compared directly with classical beam theory. The tests were used to establish support and loading
boundary conditions required for the FE model to best predict the overall load-deformation response.
A FE model of the beam-type plate specimen was developed using ABAQUS/Standard Version 6.12-2. (18).To
mesh the model, the structured quad element S4R was used. This is a 4-node, reduced integration, doubly curved shell
with hourglass control and finite membrane strains (19). Partitions were made in the part module to help simplify the
Engineering Strain
Engi
neer
ing
Stre
ss (k
si)
0 0.05 0.1 0.15 0.20
10
20
30
40
50
60
70
80
Average Rolling DirectionsParallel 3/8 in A36Transverse 3/8 in A3645° Bias 3/8 in A36Parallel 1/2 in A36Transverse 1/2 in A36Parallel 3/8 in Gr. 50Transverse 3/8 in Gr. 50
12
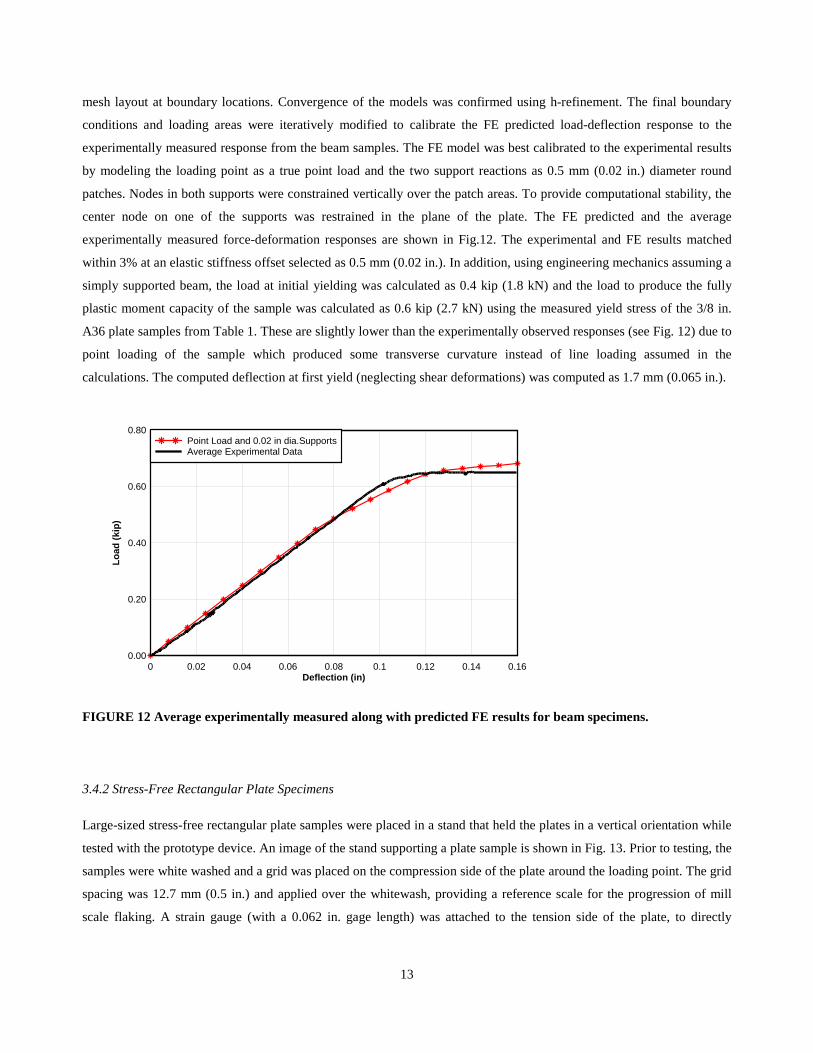
mesh layout at boundary locations. Convergence of the models was confirmed using h-refinement. The final boundary
conditions and loading areas were iteratively modified to calibrate the FE predicted load-deflection response to the
experimentally measured response from the beam samples. The FE model was best calibrated to the experimental results
by modeling the loading point as a true point load and the two support reactions as 0.5 mm (0.02 in.) diameter round
patches. Nodes in both supports were constrained vertically over the patch areas. To provide computational stability, the
center node on one of the supports was restrained in the plane of the plate. The FE predicted and the average
experimentally measured force-deformation responses are shown in Fig.12. The experimental and FE results matched
within 3% at an elastic stiffness offset selected as 0.5 mm (0.02 in.). In addition, using engineering mechanics assuming a
simply supported beam, the load at initial yielding was calculated as 0.4 kip (1.8 kN) and the load to produce the fully
plastic moment capacity of the sample was calculated as 0.6 kip (2.7 kN) using the measured yield stress of the 3/8 in.
A36 plate samples from Table 1. These are slightly lower than the experimentally observed responses (see Fig. 12) due to
point loading of the sample which produced some transverse curvature instead of line loading assumed in the
calculations. The computed deflection at first yield (neglecting shear deformations) was computed as 1.7 mm (0.065 in.).
FIGURE 12 Average experimentally measured along with predicted FE results for beam specimens.
3.4.2 Stress-Free Rectangular Plate Specimens
Large-sized stress-free rectangular plate samples were placed in a stand that held the plates in a vertical orientation while
tested with the prototype device. An image of the stand supporting a plate sample is shown in Fig. 13. Prior to testing, the
samples were white washed and a grid was placed on the compression side of the plate around the loading point. The grid
spacing was 12.7 mm (0.5 in.) and applied over the whitewash, providing a reference scale for the progression of mill
scale flaking. A strain gauge (with a 0.062 in. gage length) was attached to the tension side of the plate, to directly
Deflection (in)
Load
(kip
)
0 0.02 0.04 0.06 0.08 0.1 0.12 0.14 0.160.00
0.20
0.40
0.60
0.80Point Load and 0.02 in dia.SupportsAverage Experimental Data
13

measure the plate strain. Displacement sensors were positioned to capture the plate deflections relative to the prototype
device. Load was measured with the load cell placed in the load train of the hydraulic cylinder.
FIGURE 13 Test stand with stress-free plate specimen and attached prototype device.
Once the plate was secured in the stand, the prototype device was placed on the plate and held in place by
applying a small initial load of approximately 1.3 kN (0.3 kips). This allowed the device to be self-supported during the
rest of the experimental setup. The prototype device was loaded and unloaded three times to approximately 4.4 kN (1.0
kip) which allowed for seating of the supports which helped remove slight variations in displacement measurements due
to local imperfections of the plate surface at the load and reaction points. Subsequently, the prototype device was loaded
until well past the predicted yielding load. After completion of the test, a straight edge ruler was placed along the face of
the plate to measure any residual deformations at the loaded region of the sample. Without the ruler, no macro-
measurable residual deformations were discernable for any of the specimens after testing. With the ruler as a reference,
the largest residual deformation measured was no larger than a 0.8 mm (0.03 in.). Present specifications allow a deviation
from flatness of up to 6.4 mm (0.25 in.) (20). Therefore, because the measured residual deformations after testing were
much smaller than those permitted for new construction, the test can be considered nondestructive.
3.4.3 Axially-Stressed Plate Specimens
After testing the stress-free rectangular plate specimens, refinements were made when conducting the axially-stressed
large plate specimens. This included measurement of the time-history response of the applied load from the prototype
device. Twelve (12) tests of the geometry shown in Fig. 6c were conducted in this phase. The plates for each of the
different steel materials were tested at membrane stress levels of zero, 69 MPa (10 ksi), and 138 MPa (20 ksi). Because
14
the specimen shape was different, the zero stress level was used to directly compare results with the axially stressed
specimens. The higher stress level would be considered close to the allowable working stress (live and dead load effects)
in lower-yield stress plate materials.
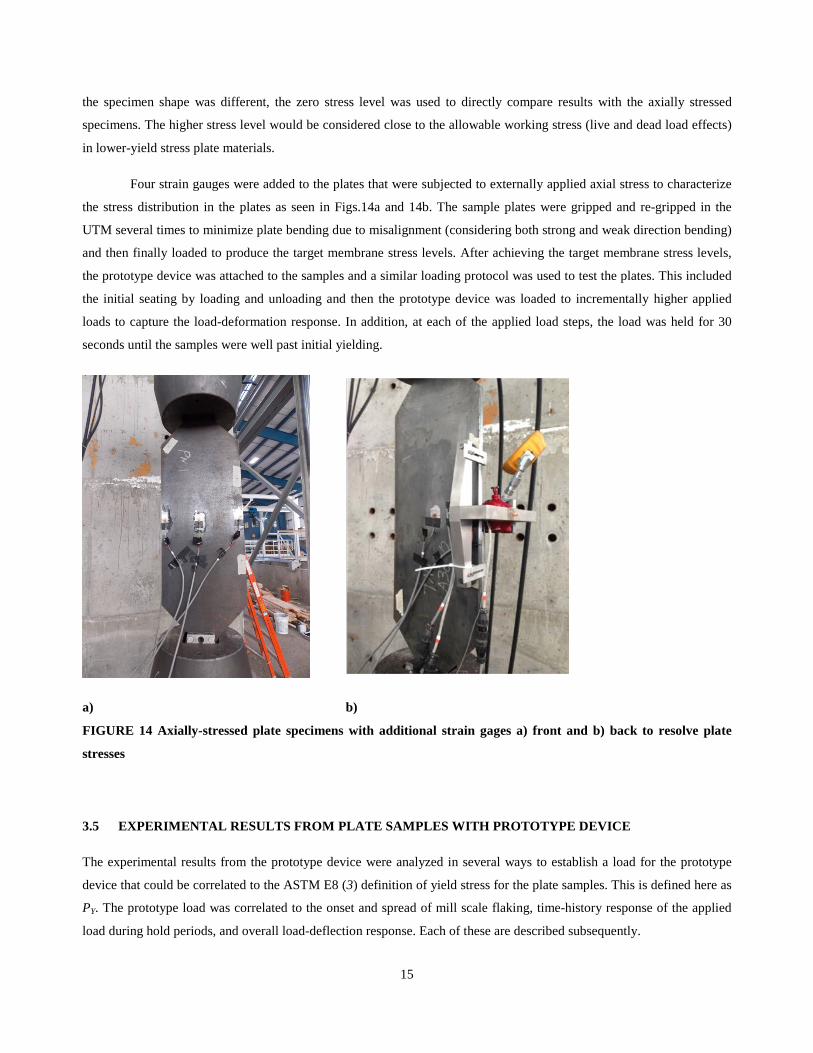
Four strain gauges were added to the plates that were subjected to externally applied axial stress to characterize
the stress distribution in the plates as seen in Figs.14a and 14b. The sample plates were gripped and re-gripped in the
UTM several times to minimize plate bending due to misalignment (considering both strong and weak direction bending)
and then finally loaded to produce the target membrane stress levels. After achieving the target membrane stress levels,
the prototype device was attached to the samples and a similar loading protocol was used to test the plates. This included
the initial seating by loading and unloading and then the prototype device was loaded to incrementally higher applied
loads to capture the load-deformation response. In addition, at each of the applied load steps, the load was held for 30
seconds until the samples were well past initial yielding.
a) b)
FIGURE 14 Axially-stressed plate specimens with additional strain gages a) front and b) back to resolve plate
stresses
3.5 EXPERIMENTAL RESULTS FROM PLATE SAMPLES WITH PROTOTYPE DEVICE
The experimental results from the prototype device were analyzed in several ways to establish a load for the prototype
device that could be correlated to the ASTM E8 (3) definition of yield stress for the plate samples. This is defined here as
PY. The prototype load was correlated to the onset and spread of mill scale flaking, time-history response of the applied
load during hold periods, and overall load-deflection response. Each of these are described subsequently.
15

3.5.1 Prototype Device Load Correlation to Mill Scale Flaking
As the prototype load was applied above the yield stress of the plate, the mill scale, which acts as a brittle coating on the
steel, flakes off the plate. The typical progression of mill scale flaking is described here for plate sample TW3b and is
shown in Fig. 15. These images are referenced to the load-deflection response in Fig. 16. As seen in Figs 15 and 16, mill
scale flaking occurs after the load-deflection response has deviated substantially from the linear elastic region. While mill
scale flaking serves as a visual indication of plate yielding, it is impractical to use as a reliable indicator of yield stress for
practice. However by correlating mill scale flaking with the load-displacement response from the prototype device it will
be seen that the yielding definition that was established corresponded to macro-yielding of the plate in the region of the
load point rather than first yielding of the plate.
a) Mill scale flaking at (A)
b) Mill scale flaking at (B)
c) Mill scale flaking at (C)
d) Mill scale flaking at (D)
FIGURE 15 Progression of mill scale flaking on flexural compression side of plate specimen
16

FIGURE 16 Load-deformation response and corresponding progression of mill scale flaking in Fig. 15
3.5.2 Prototype Device Load Time-History Response
After initial reduction of test data, it was observed that the applied prototype load dropped if the loading was held after
yielding was observed. To investigate the potential of using this characteristic to identify yielding, the test protocol was
modified to include prescribed hold periods of 30 seconds for each load step. When the plate was in the elastic range
there was no change in the load magnitude over the hold time interval. However, after the plate yielded, the applied load
decreased during the hold period due to plastic flow of the steel material. The magnitude of the load drop occurring over
the hold interval increased as yielding spread across the plate around the load point. An example time-history response of
the prototype device applied load is shown in Fig. 17 for specimen PN2a. As seen here, the load dropped during the hold
periods once the plate experienced yielding as highlighted in the expanded regions (initial yielding at center of the plot
and substantial yielding at upper right of the plot). Similar responses were observed with the uniaxial tensile test
specimens during static holds, when the rate of change of the load with time was initially rapid and then slowed. While
this response is a tell-tale sign that yielding has occurred, there was no direct way to correlate the load drop that would
occur for various plate materials and thicknesses using FEA and thus it could only be a purely empirical approach. It was
determined that this method was more easily used as a secondary method to verify the yielding load of the prototype
device.
Deflection (in)
Load
(kip
)
0.00 0.02 0.04 0.06 0.08 0.10 0.12 0.14 0.16 0.180.0
0.5
1.0
1.5
2.0
2.5
3.0
3.5
4.0
(A) 2.72 kip
(B) 2.94 kip (yielding)
(C) 3.15 kip
(D) 3.85 kip
17

FIGURE 17 Load vs. time for 3/8 in. thick A36 plate specimen PN2a
3.5.3 Prototype Device Load vs. Plate Deflection
The load-deflection responses for each of the specimens were recorded when testing with the prototype device. A typical
load-deflection response is shown in Fig. 18. As seen in this figure, the load-deformation response was initially linear
when the plate was elastic and then became progressively nonlinear as the plate yielded due to bending. A line was fit to
the elastic response where the applied load was below 8.9 kN (2 kips). The exact location where the change from linear to
nonlinear response (indicating yielding) occurs can be difficult to detect, particularly with random noise present in data.
Further, the change from linear to nonlinear response was gradual without an abrupt transition because of the elastic
bending core and adjacent plate material that remains elastic. Thus, a definition was required for the prototype device
load magnitude to be correlated with the yield stress of the plate, as is described subsequently.
Time (seconds)
Loa
d (k
ip)
0 200 400 600 800 1000 11930.0
0.5
1.0
1.5
2.0
2.5
3.0
3.5
4.0
18

FIGURE 18 Typical experimentally measured load-deflection response for 3/8 in. thick A36 plate sample
3.5.4 Prototype Device Load Correlation with Finite Element Models
Once all of the various experimental measurements were collected, they were correlated with FE results. The 9.5 mm (3/8
in.) thick, A36 plate results are used here to describe the methodology. FE models of the test samples were developed, as
described previously. The explicit yield stress of the plate material, taken from material tests as reported in Table 1, were
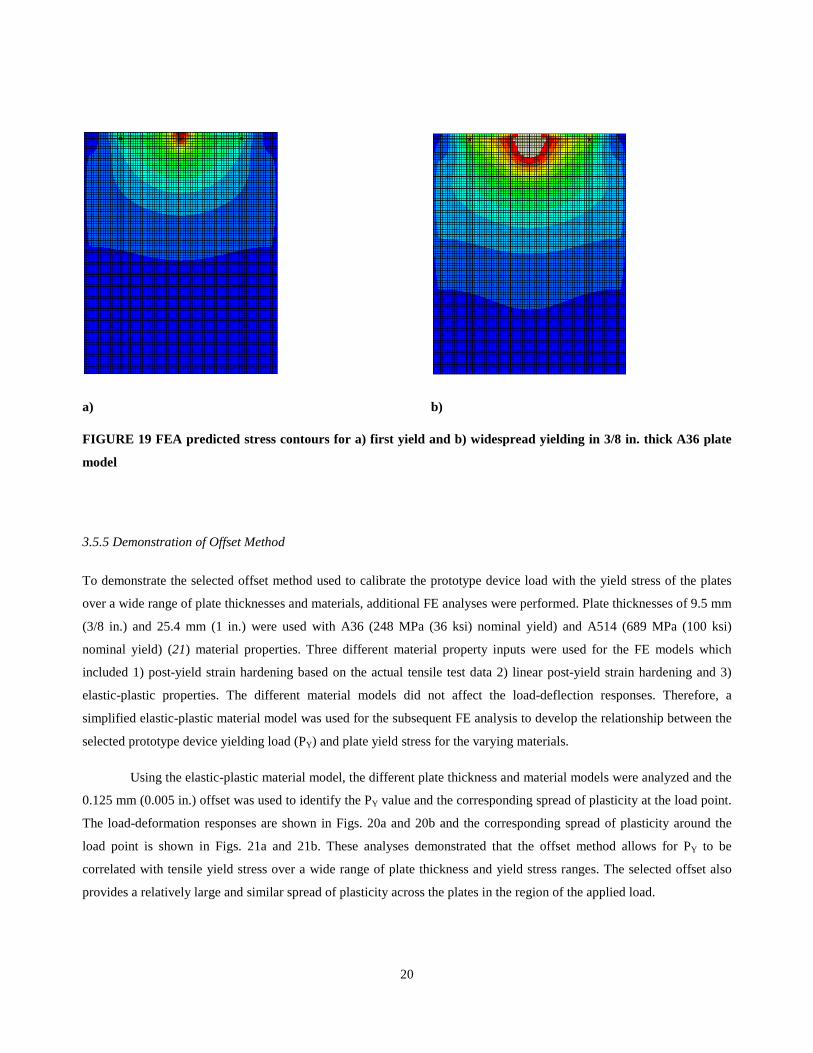
used for each of the samples. Based on the FE analysis, first yielding of the plate was identified when the computed stress
achieved the von Mises yield criterion. The applied prototype device load corresponding to first yield was 7.1 kN (1.6
kips), and the stress contours in the plate are shown in Fig. 19a. This load is relatively low compared to when the
nonlinear load-deflection response was observed or when white-wash flaking occurred. Indeed, there were no empirically
distinguishing characteristics observed at this load level. Thus, the load at first-yield of the plate is not a practical
defining point for establishing yield stress of the plates. A higher load which produced observable changes in response
was more desireable. A load which corresponded to a spread of plasticity that produced visual flaking of the mill scale,
abrupt drops in the load vs. time response, and sufficient deviation from elastic response of the load-deflection response
was selected. As the prototype device applied load increased in the FE model, the spread of plasticity along the free edge
of the plate increased. When the spread of plasticity was roughly 51 mm (2 in.) at the load point, as shown in Fig. 19b,
the corresponding load was approximately 12.9 kN (2.9 kips) and coincided with an elastic offset of 0.125 mm (0.005
in.). This location was sufficient to distinguish the change from elastic to inelastic behavior and could be used as a
characteristic load to identify yielding of the plate. This offset method is similar to that used in ASTM E8 (3) for
materials that do not have well-defined yield stress.
Deflection (in)
Load
(kip
)
0.00 0.02 0.04 0.06 0.08 0.10 0.12 0.14 0.160.0
1.0
2.0
3.0
4.0Experimental ResultsElastic Curve Fit
19
a)
b)
FIGURE 19 FEA predicted stress contours for a) first yield and b) widespread yielding in 3/8 in. thick A36 plate
model
3.5.5 Demonstration of Offset Method
To demonstrate the selected offset method used to calibrate the prototype device load with the yield stress of the plates
over a wide range of plate thicknesses and materials, additional FE analyses were performed. Plate thicknesses of 9.5 mm
(3/8 in.) and 25.4 mm (1 in.) were used with A36 (248 MPa (36 ksi) nominal yield) and A514 (689 MPa (100 ksi)
nominal yield) (21) material properties. Three different material property inputs were used for the FE models which
included 1) post-yield strain hardening based on the actual tensile test data 2) linear post-yield strain hardening and 3)
elastic-plastic properties. The different material models did not affect the load-deflection responses. Therefore, a
simplified elastic-plastic material model was used for the subsequent FE analysis to develop the relationship between the
selected prototype device yielding load (PY) and plate yield stress for the varying materials.
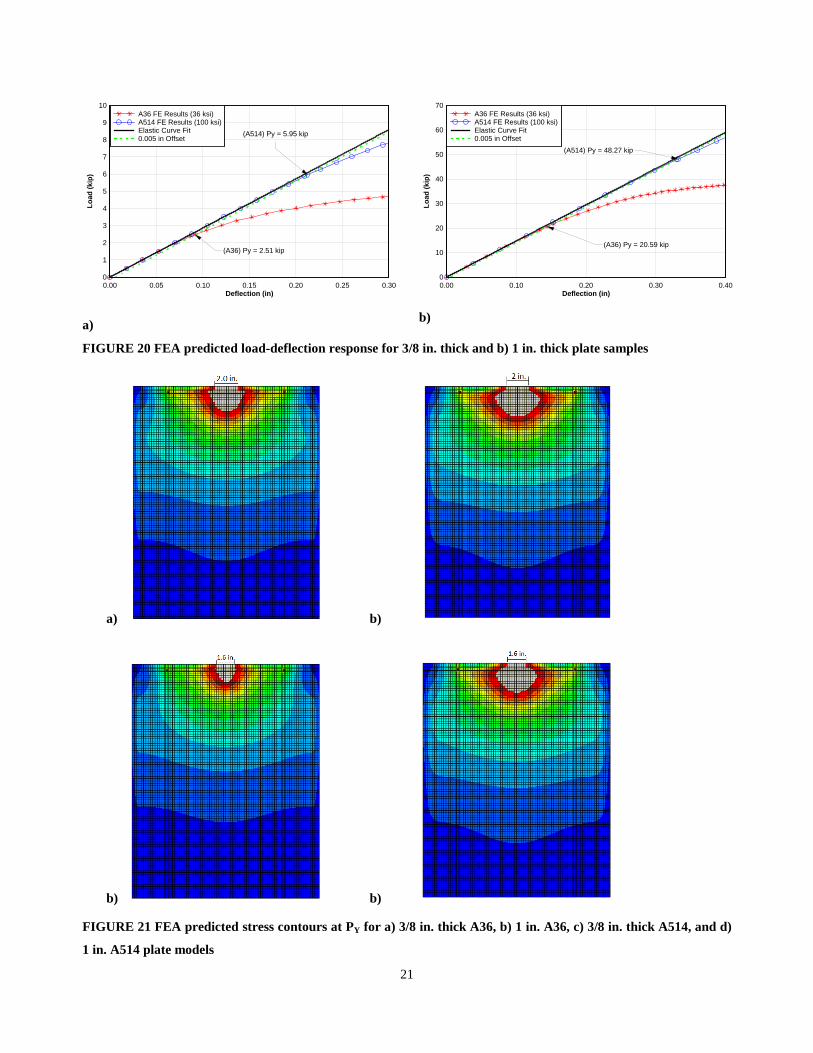
Using the elastic-plastic material model, the different plate thickness and material models were analyzed and the
0.125 mm (0.005 in.) offset was used to identify the PY value and the corresponding spread of plasticity at the load point.
The load-deformation responses are shown in Figs. 20a and 20b and the corresponding spread of plasticity around the
load point is shown in Figs. 21a and 21b. These analyses demonstrated that the offset method allows for PY to be
correlated with tensile yield stress over a wide range of plate thickness and yield stress ranges. The selected offset also
provides a relatively large and similar spread of plasticity across the plates in the region of the applied load.
20
a)
b)
FIGURE 20 FEA predicted load-deflection response for 3/8 in. thick and b) 1 in. thick plate samples
a) b)
b) b)
FIGURE 21 FEA predicted stress contours at PY for a) 3/8 in. thick A36, b) 1 in. A36, c) 3/8 in. thick A514, and d)
1 in. A514 plate models
Deflection (in)
Load
(kip
)
0.00 0.05 0.10 0.15 0.20 0.25 0.300
1
2
3
4
5
6
7
8
9
10
(A514) Py = 5.95 kip
(A36) Py = 2.51 kip
A36 FE Results (36 ksi)A514 FE Results (100 ksi)Elastic Curve Fit0.005 in Offset
Deflection (in)
Load
(kip
)
0.00 0.10 0.20 0.30 0.400
10
20
30
40
50
60
70
(A36) Py = 20.59 kip
(A514) Py = 48.27 kip
A36 FE Results (36 ksi)A514 FE Results (100 ksi)Elastic Curve Fit0.005 in Offset
21

To develop the relationship between the PY values and the tensile dynamic yield stress for different plate
thicknesses at the prescribed 0.125 mm (0.005 in.) offset, additional FE analyses were performed. The plate models were
similar to those shown in Fig. 21. The PY values were collected from the predicted load-deformation response from FE
analysis of plate specimens having a range of dynamic yield stresses as illustrated in Fig. 22 for 9.5 mm (3/8 in.) thick
plate. The relationship between PY and the tensile dynamic yield stress was developed for 9.5 mm (3/8 in.) thick plates as
shown in Fig. 23 by extracting the applied load value at the 0.125 mm (0.005 in.) offset from each analysis. The predicted
prototype device load at an offset of 0.125 mm (0.005 in.) for a range of plate thicknesses and yield stresses is shown in
Fig. 24.
FIGURE 22 Load-deformation responses for 3/8 in. thick plates with different dynamic tensile yield stresses using
a 0.005 in. offset to identify the characteristic prototype device applied load
Deflection (in)
Load
(kip
)
0 0.02 0.04 0.06 0.08 0.1 0.12 0.14 0.16 0.18 0.20.0
1.0
2.0
3.0
4.0
5.0
6.0Yield Stress
30 ksi34 ksi38 ksi42 ksi
46 ksi50 ksi54 ksi0.005 in Offset
22
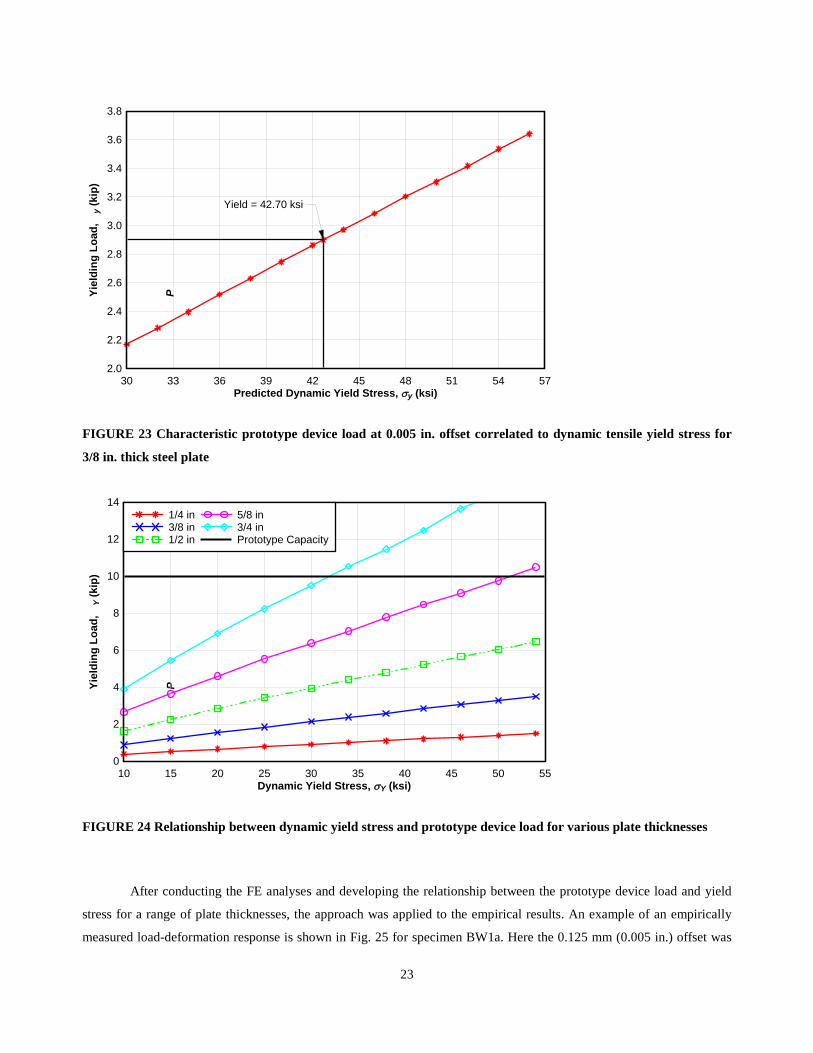
FIGURE 23 Characteristic prototype device load at 0.005 in. offset correlated to dynamic tensile yield stress for
3/8 in. thick steel plate
FIGURE 24 Relationship between dynamic yield stress and prototype device load for various plate thicknesses
After conducting the FE analyses and developing the relationship between the prototype device load and yield
stress for a range of plate thicknesses, the approach was applied to the empirical results. An example of an empirically
measured load-deformation response is shown in Fig. 25 for specimen BW1a. Here the 0.125 mm (0.005 in.) offset was
Predicted Dynamic Yield Stress, σy (ksi)
Yiel
ding
Loa
d,
P
y (ki
p)
30 33 36 39 42 45 48 51 54 572.0
2.2
2.4
2.6
2.8
3.0
3.2
3.4
3.6
3.8
Yield = 42.70 ksi
Dynamic Yield Stress, σY (ksi)
Yiel
ding
Loa
d,
P
Y (k
ip)
10 15 20 25 30 35 40 45 50 550
2
4
6
8
10
12
141/4 in3/8 in1/2 in
5/8 in3/4 inPrototype Capacity
23

used to identify the characteristic prototype device applied load of 12.9 kN (2.9 kips) in present case. Using results in Fig.
23, the yield stress could be estimated as 294 MPa (42.7 ksi). This was performed for each of the plate samples and the
results are reported in Table 2.
FIGURE 25 Prototype device load-deformation response and load at 0.005 in. offset for 3/8 in. thick A36 plate
(specimen BW1a)
Deflection (in)
Load
(kip
)
0.00 0.02 0.04 0.06 0.08 0.10 0.12 0.14 0.16 0.180.0
0.5
1.0
1.5
2.0
2.5
3.0
3.5
4.0
Pyd = 2.9 kip
Experimental ResultsElastic Curve Fit.005 in Offset
24
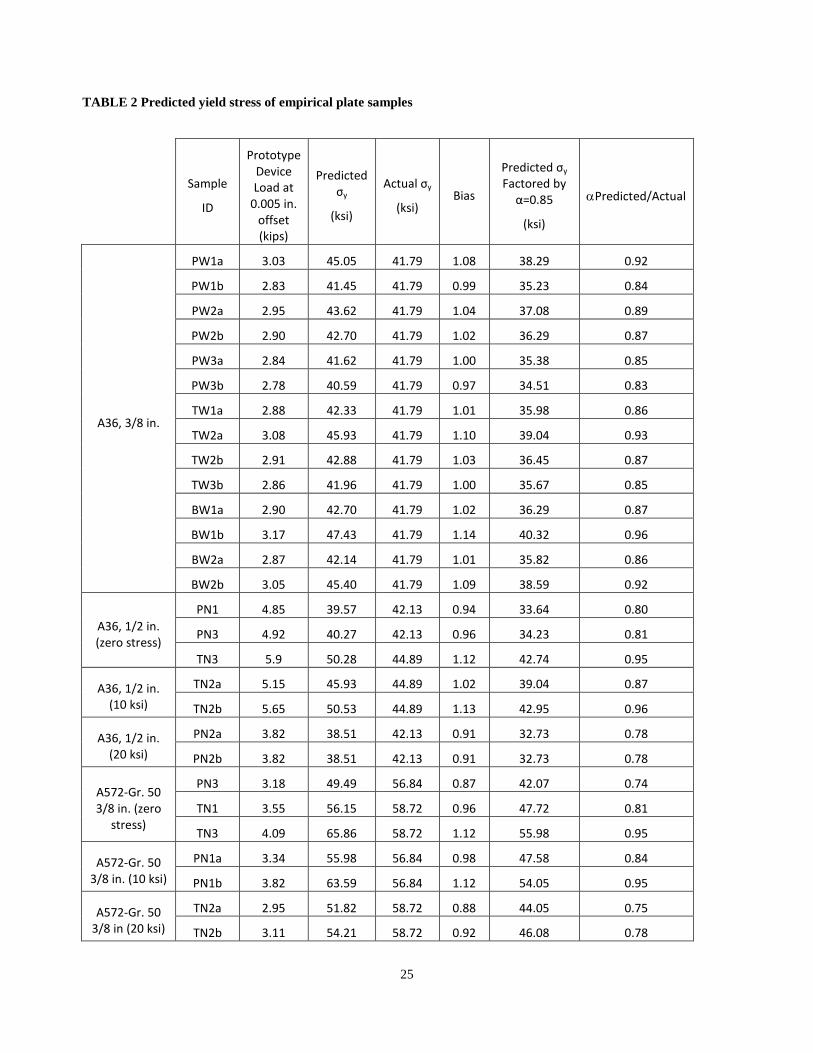
TABLE 2 Predicted yield stress of empirical plate samples
Sample
ID
Prototype Device Load at
0.005 in. offset (kips)
Predicted σy
(ksi)
Actual σy
(ksi) Bias
Predicted σy Factored by
α=0.85
(ksi)
αPredicted/Actual
A36, 3/8 in.
PW1a 3.03 45.05 41.79 1.08 38.29 0.92
PW1b 2.83 41.45 41.79 0.99 35.23 0.84
PW2a 2.95 43.62 41.79 1.04 37.08 0.89
PW2b 2.90 42.70 41.79 1.02 36.29 0.87
PW3a 2.84 41.62 41.79 1.00 35.38 0.85
PW3b 2.78 40.59 41.79 0.97 34.51 0.83
TW1a 2.88 42.33 41.79 1.01 35.98 0.86
TW2a 3.08 45.93 41.79 1.10 39.04 0.93
TW2b 2.91 42.88 41.79 1.03 36.45 0.87
TW3b 2.86 41.96 41.79 1.00 35.67 0.85
BW1a 2.90 42.70 41.79 1.02 36.29 0.87
BW1b 3.17 47.43 41.79 1.14 40.32 0.96
BW2a 2.87 42.14 41.79 1.01 35.82 0.86
BW2b 3.05 45.40 41.79 1.09 38.59 0.92
A36, 1/2 in. (zero stress)
PN1 4.85 39.57 42.13 0.94 33.64 0.80
PN3 4.92 40.27 42.13 0.96 34.23 0.81
TN3 5.9 50.28 44.89 1.12 42.74 0.95
A36, 1/2 in. (10 ksi)
TN2a 5.15 45.93 44.89 1.02 39.04 0.87
TN2b 5.65 50.53 44.89 1.13 42.95 0.96
A36, 1/2 in. (20 ksi)
PN2a 3.82 38.51 42.13 0.91 32.73 0.78
PN2b 3.82 38.51 42.13 0.91 32.73 0.78
A572-Gr. 50 3/8 in. (zero
stress)
PN3 3.18 49.49 56.84 0.87 42.07 0.74
TN1 3.55 56.15 58.72 0.96 47.72 0.81
TN3 4.09 65.86 58.72 1.12 55.98 0.95
A572-Gr. 50 3/8 in. (10 ksi)
PN1a 3.34 55.98 56.84 0.98 47.58 0.84
PN1b 3.82 63.59 56.84 1.12 54.05 0.95
A572-Gr. 50 3/8 in (20 ksi)
TN2a 2.95 51.82 58.72 0.88 44.05 0.75
TN2b 3.11 54.21 58.72 0.92 46.08 0.78
25

Statistical analysis was performed on the data to calculate the mean and standard deviation of the predicted yield
stress using the prototype device compared with the yield stress from uniaxial tension tests. Based on the observed
distribution, the data was reasonably modeled as Gaussian. Using the statistical variability observed in the data, a yield
stress prediction safety factor, α, was introduced to account for the uncertainty in the test method and to reduce the
likelihood of overestimating the yield stress of the plate. This was calculated by normalizing all the predicted yield stress
results from the prototype device in relation to the measured yield stress from the coupon samples. A very low
probability of overestimating the yield stress was selected as 1/10,000 (~3.5 standard deviations from the mean) and for
the bias and standard deviation (normalized standard deviation = 0.076 and mean = 1.023) resulted in an α of 0.74 if only
one test was performed with the prototype device. This significantly reduces the predicted yield stress compared to the
likely actual yield stress. This may provide excessive conservatism that could result in low connection ratings when the
intended use of this device is to determine the in-situ yield stress of a plate to obtain greater accuracy during bridge
evaluation. Therefore multiple replicate measurements with the prototype device can be taken to reduce the standard
deviation and therefore increase α. If three replicate tests are made on a plate, α increases to 0.86. A value of 0.85 was
chosen as the final factor when three (3) replicate measurements are made on a plate. Using this value would predict a
higher but still conservative yield stress for the plates relative to the expected yield stress from coupon samples as shown
in Table 2. While this report recommends a factor of 0.85 for three (3) replicate measurements, there is flexibility for
bridge owners and rating engineers to decide what probability of over-estimation of the tensile dynamic yield stress they
are willing to accept and thus the factor could be adjusted accordingly.
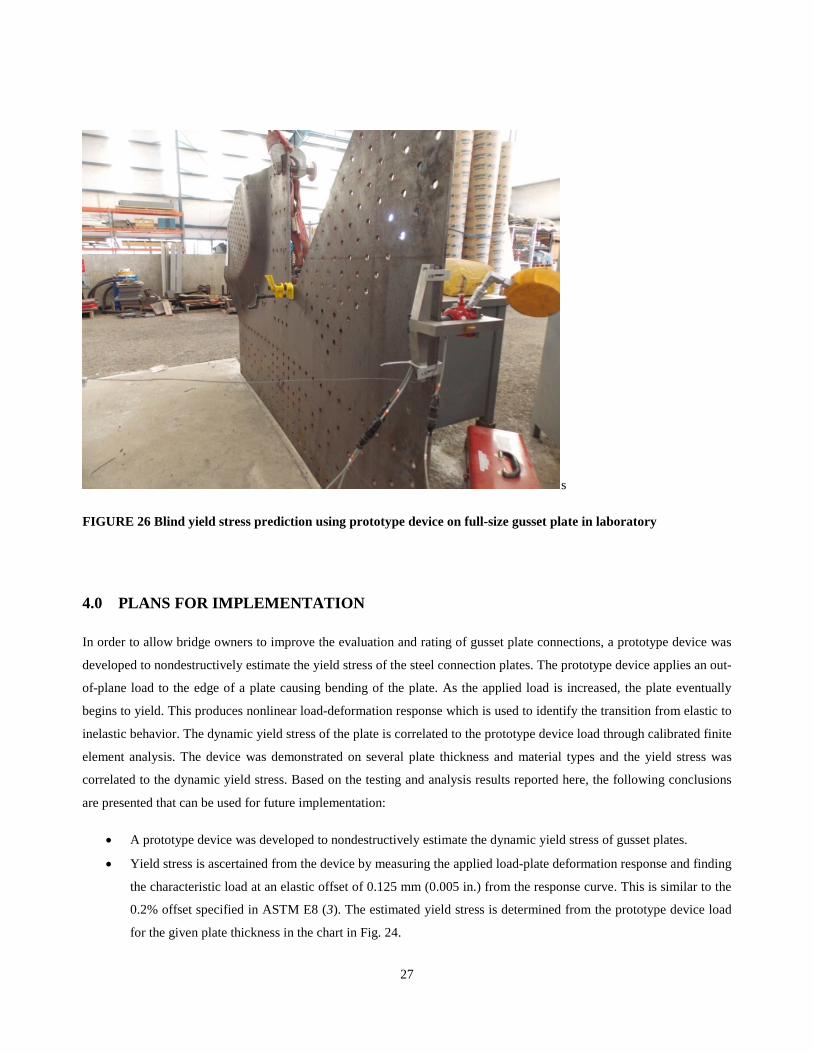
3.5.5.1 Blind Prediction of Yield Stress on Full-Size Gusset Plate
A blind prediction of the yield stress for a full-size 9.5 mm (3/8 in.) thick gusset plate in the laboratory was
conducted using the prototype device and the methods described previously. The plate was one that was previously tested
to investigate the sway-buckling response of bridge gusset plate connections. The prototype device was applied to the
free-edge of the plate as shown in Fig. 26 and three (3) replicate measurements were taken. The average of the three
measurements produced a PY of 14.4 kN (3.23 kips). From Fig. 24, the yield stress associated with this load for a 9.5 mm
(3/8 in.) thick plate was determined to be 338 MPa (49.0 ksi). Multiplying the yield stress by the prediction safety factor
of 0.85, the estimated dynamic yield stress was calculated to be 287 MPa (41.6 ksi). After conducting the prototype
device tests, the coupon samples were revealed and the dynamic yield stress was observed to be 347 MPa (50.3 ksi). This
is within 2% of the non-factored yield stress estimated using the prototype device. This indicates that the prototype
device can be effectively used to non-destructively estimate the yield stress of a large-size gusset plate in the laboratory.
Further, the specified material for the plate was A36, with 248 MPa (36 ksi) nominal yield stress. The prototype device
results would allow the engineer to perform load ratings with a yield stress (reduced for uncertainty) of 287 MPa (41.6
ksi) instead of the nominal 248 MPa (36 ksi), which is a 15% increase. This would reliably increase the bridge
connection rating and diminish the chance of unnecessary posting or retrofit.
26
s
FIGURE 26 Blind yield stress prediction using prototype device on full-size gusset plate in laboratory
4.0 PLANS FOR IMPLEMENTATION
In order to allow bridge owners to improve the evaluation and rating of gusset plate connections, a prototype device was
developed to nondestructively estimate the yield stress of the steel connection plates. The prototype device applies an out-
of-plane load to the edge of a plate causing bending of the plate. As the applied load is increased, the plate eventually
begins to yield. This produces nonlinear load-deformation response which is used to identify the transition from elastic to
inelastic behavior. The dynamic yield stress of the plate is correlated to the prototype device load through calibrated finite
element analysis. The device was demonstrated on several plate thickness and material types and the yield stress was
correlated to the dynamic yield stress. Based on the testing and analysis results reported here, the following conclusions
are presented that can be used for future implementation:
• A prototype device was developed to nondestructively estimate the dynamic yield stress of gusset plates.
• Yield stress is ascertained from the device by measuring the applied load-plate deformation response and finding
the characteristic load at an elastic offset of 0.125 mm (0.005 in.) from the response curve. This is similar to the
0.2% offset specified in ASTM E8 (3). The estimated yield stress is determined from the prototype device load
for the given plate thickness in the chart in Fig. 24.
27

• The characteristic applied load at the specified offset produces macro-yielding of the plate and an area of
plasticity around the loading point.
• Secondary identification of yielding can also be detected by observing when the load magnitude drops when the
device loading is paused at each loading interval due to plastic flow of the plate material.
• Only the highest internal stresses from possible dead loads in the plates influenced the device by producing a
yielding load earlier then when no external membrane stresses were applied to the plate. At the free-edge of an
in service plate, the service level stresses should be close to zero and thus should not influence the results.
• After testing, the residual deformations are substantially below allowable plate flatness tolerances and as such
the technique is nondestructive.
• Based on the statistical analysis of the data, a yield stress prediction safety factor is applied to the results to
ensure the estimated yield stress is not higher than the actual yield stress with a 1/10,000 probability (the safety
factor is 0.85when three (3) replicate tests are performed).
The load-deflection measurement is fundamental to identifying the change in linear to nonlinear response and
correlation to uniaxial yield stress. The most sensitive measurement is the plate displacement. Care must be taken to
accurately and repeatedly capture this response. Several alternative measurement devices were studied and implemented,
with an extensometer providing the best repeatability. Future and emerging sensor technologies may further improve this
measurement. Additional plate thicknesses and materials need to be investigated to develop a larger database to
characterize the performance of the device and to provide statistical data which can more robustly characterize the yield
stress prediction uncertainty. Portable hardness should also be considered in future work to correlation with yield stress
on lower yield stress bridge steels. After these additional refinements, the prototype device can be implemented in the
field on actual bridges and should continue to be correlated with other methods (portable hardness and coupon samples)
for estimating yield stress until robustness can be ascertained for routine use.
28

5.0 REFERENCES
(1) Federal Highway Administration, (2008). “Load-carrying Capacity Considerations of Gusset Plates in Non-load-
path-redundant Steel Truss Bridges,” Technical Advisory 5140.29,
www.fhwa.dot.gov/bridge/t514029.cfm.
(2) National Transportation Safety Board, (2008). “Collapse of I-35W Highway Bridge Minneapolis, Minnesota,
August 1, 2007,” Accident Report NTSB/HAR-08/03, PB2008-916203, Notation 7975C,
https://www.ntsb.gov/doclib/reports/2008/HAR0803.pdf.
(3) American Society for Testing and Materials (ASTM) E8/E8M - 11 (2011) “Standard Test Method for Tension
Testing of Metallic Materials,” ASTM International, West Conshohocken, PA.
(4) Tabor, D., (1951). The Hardness of Metals, Oxford University Press, New York.
(5) Speich, G.R. and H. Warlimont, (1968). “Yield stress and Transformation Substructure of Low-Carbon Martensite,”
Journal of Iron and Steel Institute, V. 206, April, pp. 385-392.
(6) Cahoon, J.R., Broughton, W.H., and A.R. Kutzak, (1971). “The Determination of Yield stress from Hardness
Measurements,” Journal of Metallurgical Transactions, V. 2, No. 7, July, pp. 1979-1983.
(7) Datsko, J., Hartwig, L., and B. McClory, (2001). “On the Tensile Strength and Hardness Relation for Metals,”
Journal of Materials Engineering and Performance, V. 10, No. 6, December, pp. 718-722.
(8) Kowalkowski, K.J., and A. H. Varma, (2007). “Structural Properties of Steels Subjected to Multiple Cycles of
Damage Followed by Heating Repair,” Journal of Structural Engineering, V. 133, pp. 283-296.
(9) Pavlina, E.J., and C.J. Van Tyne, (2008). “Correlation of Yield stress and Tensile Strength with Hardness for
Steels,” Journal of Materials Engineering and Performance, V. 17, No. 6, December, pp. 888-893.
(10) Nagaraja Rao, N., Lohrmann, M., and L. Tall, (1966). “Effect of strain rate on the yield stress of structural steel.”
ASTM Journal of Materials, Vol. 1, No. 1, March. http://preserve.lehigh.edu/engr-civil-environmental-fritz-lab-
reports/1684.
(11) ASTM E6–09 (2009). “Standard Terminology Relating to Methods of Mechanical Testing,” ASTM International,
West Conshohocken, PA.
(12) Szilard, R., (1974). Theory and Analysis of Plates: Classical and Numerical Methods, Prentice-
Hall, New Jersey.
(13) Plaum, T. M. (2013). “Non-destructive determination of yield stress for in-situ gusset plates,” M.S. Thesis, Oregon
State University, Corvallis, OR. http://hdl.handle.net/1957/42386.
(14) ASTM B265–13 (2013). “Standard Specification for Titanium and Titanium Alloy Strip, Sheet, and Plate,” ASTM
International, West Conshohocken, PA.
(15) ASTM A36/A36M – 08 (2008) “Standard Specification for Carbon Structural Steel,” ASTM International, West
Conshohocken, PA.
(16) ASTM A572/A572M - 12 (2012) “Standard Specification for High-Strength Low-Alloy Columbium-Vanadium
Structural Steel,” ASTM International, West Conshohocken, PA.
(17) Callister Jr.,W.D., (2000). Materials Science and Engineering, Oxford University Press, New York.
(18) Hibbitt, Karlsson & Sorensen, Inc. (2002). ABAQUS/Standard (Version 6.3-8) [Computer Software]
29

(19) Abaqus Theory Manual (6.11), Simulia, Web. 05 Sept. 2013.
(20) ASTM A6/A6M-13, (2013). “Standard Specification for General Requirements for Rolled Structural Steel Bars,
Plates, Shapes, and Sheet Piling,” ASTM International, West Conshohocken, PA.
(21) ASTM A514/A514M - 05 (2009) “Standard Specification for High-Yield stress, Quenched and tempered Alloy
Steel Plate, Suitable for Welding,” ASTM International, West Conshohocken, PA.
30