tools for assessing fall risk in the elderly: a …(0123456789)1 3 aging clin exp res (2018)...
TRANSCRIPT

Vol.:(0123456789)1 3
Aging Clin Exp Res (2018) 30:1–16 DOI 10.1007/s40520-017-0749-0
REVIEW
Tools for assessing fall risk in the elderly: a systematic review and meta-analysis
Seong-Hi Park1
Received: 13 January 2017 / Accepted: 10 March 2017 / Published online: 3 April 2017 © Springer International Publishing Switzerland 2017
Keywords Accidental falls · Older adults · Sensitivity and specificity · Meta-analysis
Introduction
The world comprises aging societies [1]. Falls are second only to traffic accidents as the leading cause of injury-related deaths among the elderly worldwide [2, 3], and they are a major cause of both death and injury in people over 65 years of age [4, 5]. According to the World Health Organization (WHO) report, 28–35% of the population over age 65 fall each year, and the percentage of fallers among people over age 70 is 32–42%, suggesting an age-related increase in fall risk [6]. Falls cause 20–30% of mild-to-severe injuries [7], and >50% of those involve treatment requiring hospitalization [8]. Falls can limit daily activities and induce post-fall syndromes, such as dependence, loss of autonomy, immobilization, and depression [9, 10]. The WHO has warned that the number of injuries caused by falls will double by 2030 if a fall prevention strategy does not have a short-term effect [11].
Falls can occur in any setting; hence, fall prevention should start by considering environmental conditions and factoring them into the fall risk assessment [12]. Assess-ment tools for fall risks should accurately discriminate fall-ers from non-fallers in practice. Accordingly, before a fall risk assessment tool is used, its predictive validity should be sufficiently tested [13]. Although several studies have been conducted, results differ depending on subject charac-teristics, such as age, complications, and physical disability. Thus, the interpretation of findings is limited and unclear, and the findings cannot be generalized [14, 15]. Specifi-cally, diagnostic studies on fall risk assessment tools should include a quantitative report on the most representative
Abstract The prevention of falls among the elderly is arguably one of the most important public health issues in today’s aging society. The aim of this study was to assess which tools best predict the risk of falls in the elderly. Elec-tronic searches were performed using Medline, EMBASE, the Cochrane Library, CINAHL, etc., using the following keywords: “fall risk assessment”, “elderly fall screening”, and “elderly mobility scale”. The QUADAS-2 was applied to assess the internal validity of the diagnostic studies. Selected studies were meta-analyzed with MetaDisc 1.4. A total of 33 studies were eligible out of the 2,321 stud-ies retrieved from selected databases. Twenty-six assess-ment tools for fall risk were used in the selected articles, and they tended to vary based on the setting. The fall risk assessment tools currently used for the elderly did not show sufficiently high predictive validity for differentiating high and low fall risks. The Berg Balance scale and Mobil-ity Interaction Fall chart showed stable and high specific-ity, while the Downton Fall Risk Index, Hendrich II Fall Risk Model, St. Thomas’s Risk Assessment Tool in Falling elderly inpatients, Timed Up and Go test, and Tinetti Bal-ance scale showed the opposite results. We concluded that rather than a single measure, two assessment tools used together would better evaluate the characteristics of falls by the elderly that can occur due to a multitude of factors and maximize the advantages of each for predicting the occur-rence of falls.
* Seong-Hi Park [email protected]
1 Department of Nursing, Soonchunhyang University, 22 Soonchunhyang-ro, Sinchang-myen, Asan-si, Chungcheongnam-do 31538, South Korea
2 Aging Clin Exp Res (2018) 30:1–16
1 3
validity indices (i.e., sensitivity and specificity) and test outcome differences due to different fall risk factors. Fur-thermore, research is needed that will provide an overview of which assessment tool has the highest validity for the elderly at high risk for falls.
Some studies have attempted to do so, but they pre-sented results based only on a specific tool such as St. Thomas’s Risk Assessment Tool in Falling elderly inpa-tients (STRATIFY) [16] or different setting [17] or did not perform a quantitative analysis of the predictive validity [18–20]. Therefore, based on those studies, it is difficult to make a comprehensive conclusion as to which tools are effective for assessing fall risk among the elderly. Accord-ingly, this study was conducted to compare the diagnostic accuracy of several currently available fall risk assessment tools developed for the elderly, to identify the assessment tools most frequently used to discriminate fallers and non-fallers and the assessment tools having the highest predic-tive validity, and to provide scientific evidence for selecting the best tool to use in practice.
Methods
This study was conducted according to the guidelines of the Cochrane Handbook for Systematic Reviews of Diagnostic Test Accuracy [21] and the Preferred Reporting Items for Systematic Reviews and Meta-Analyses (PRISMA) State-ment [22].
Search strategy
We searched seven computer-based electronic databases: MEDLINE, EMBASE, the Cochrane Library, CINAHL Complete, KoreaMed, and National Digital Science Library. The search was performed in August 2014 and again in June 2016 to identify any new studies.
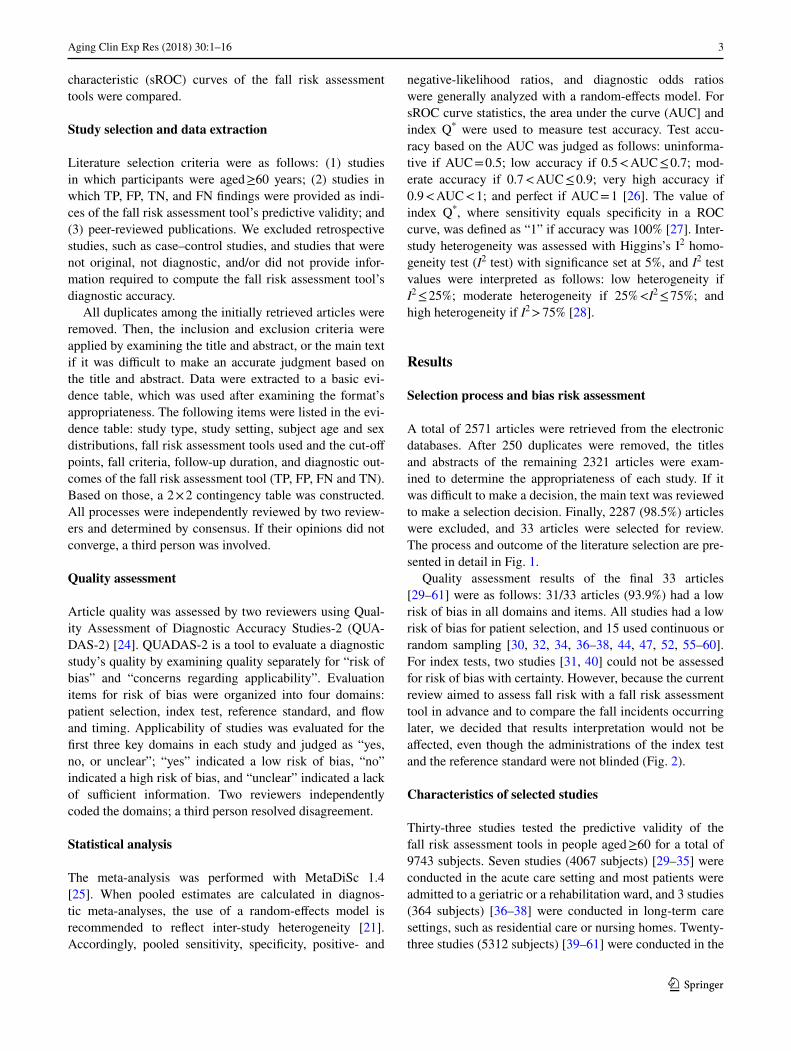
The search used the following terms: the name of vari-ous tools assessing fall risk (Berg Balance scale [BBS], Downton Fall Risk Index, Hendrich II Fall Risk Model etc.), “fall risk assessment”, “elderly fall screening”, “elderly mobility scale”, and “risk assessment”. In addi-tion, we used the search filters for diagnostic studies sug-gested by the Scottish Intercollegiate Guidelines Network [23]. For reference, an example of search strategy using Ovid-Medline was presented (Table 1).
Criteria for considering studies
Types of studies We included studies that reported the prog-nostic accuracy of a fall risk assessment tool and excluded studies reporting only sensitivity or specificity and provid-ing insufficient information to construct a 2 × 2 contingency
table. We excluded case–control studies, because they are prone to bias.
Types of participants We only included studies of people aged ≥60 years. We excluded studies in which people under age 60 participated, even if the average age was >60 years.
Indexed tests All fall risk assessment tools used in the elderly were included. We used the cut-off points suggested by the researchers in each study for the corresponding assessment tools.
Reference standard The reference standard was defined as ≥1 fall in which part of a person’s body other than the bottoms of the feet came to rest inadvertently on the ground [2, 13]. Each study’s own criteria were used to define a faller.
Types of outcome and assessment measures The true positive (TP), false positive (FP), true negative (TN), and false negative (FN) values were described for diag-nostic accuracy. Based on these indices, sensitivities, specificities, positive- and negative-likelihood ratios, diagnostic odds ratios, and summary receiver-operating
Table 1 Search strategy used to search Ovid-Medline
Searches
1 Morse fall risk assessment2 Johns Hopkins-fall risk assessment3 Hendrich fall risk assessment4 Berg Balance scale5 Conley fall risk assessment6 Schmid fall risk assessment7 St. Thomas risk assessment tool in fall-
ing elderly inpatient8 Downton fall risk assessment9 Fall risk assessment10 Berg balance scale11 Tinetti Balance scale12 Timed Up and Go13 Innes fall risk assessment14 Elderly fall screening15 Elderly Mobility scale16 Or/1-1517 Exp risk assessment/18 16 and 1719 Exp “Sensitivity and Specificity”/20 Sensitivity.tw21 Specificity.tw22 ((Pre-test or pre-test) adj probability).tw23 Post-test probability.tw24 Predictive value$.tw25 Likelihood ratio$.tw26 Or/19-2527 18 and 26
3Aging Clin Exp Res (2018) 30:1–16
1 3
characteristic (sROC) curves of the fall risk assessment tools were compared.
Study selection and data extraction
Literature selection criteria were as follows: (1) studies in which participants were aged ≥60 years; (2) studies in which TP, FP, TN, and FN findings were provided as indi-ces of the fall risk assessment tool’s predictive validity; and (3) peer-reviewed publications. We excluded retrospective studies, such as case–control studies, and studies that were not original, not diagnostic, and/or did not provide infor-mation required to compute the fall risk assessment tool’s diagnostic accuracy.
All duplicates among the initially retrieved articles were removed. Then, the inclusion and exclusion criteria were applied by examining the title and abstract, or the main text if it was difficult to make an accurate judgment based on the title and abstract. Data were extracted to a basic evi-dence table, which was used after examining the format’s appropriateness. The following items were listed in the evi-dence table: study type, study setting, subject age and sex distributions, fall risk assessment tools used and the cut-off points, fall criteria, follow-up duration, and diagnostic out-comes of the fall risk assessment tool (TP, FP, FN and TN). Based on those, a 2 × 2 contingency table was constructed. All processes were independently reviewed by two review-ers and determined by consensus. If their opinions did not converge, a third person was involved.
Quality assessment
Article quality was assessed by two reviewers using Qual-ity Assessment of Diagnostic Accuracy Studies-2 (QUA-DAS-2) [24]. QUADAS-2 is a tool to evaluate a diagnostic study’s quality by examining quality separately for “risk of bias” and “concerns regarding applicability”. Evaluation items for risk of bias were organized into four domains: patient selection, index test, reference standard, and flow and timing. Applicability of studies was evaluated for the first three key domains in each study and judged as “yes, no, or unclear”; “yes” indicated a low risk of bias, “no” indicated a high risk of bias, and “unclear” indicated a lack of sufficient information. Two reviewers independently coded the domains; a third person resolved disagreement.
Statistical analysis
The meta-analysis was performed with MetaDiSc 1.4 [25]. When pooled estimates are calculated in diagnos-tic meta-analyses, the use of a random-effects model is recommended to reflect inter-study heterogeneity [21]. Accordingly, pooled sensitivity, specificity, positive- and
negative-likelihood ratios, and diagnostic odds ratios were generally analyzed with a random-effects model. For sROC curve statistics, the area under the curve (AUC] and index Q* were used to measure test accuracy. Test accu-racy based on the AUC was judged as follows: uninforma-tive if AUC = 0.5; low accuracy if 0.5 < AUC ≤ 0.7; mod-erate accuracy if 0.7 < AUC ≤ 0.9; very high accuracy if 0.9 < AUC < 1; and perfect if AUC = 1 [26]. The value of index Q*, where sensitivity equals specificity in a ROC curve, was defined as “1” if accuracy was 100% [27]. Inter-study heterogeneity was assessed with Higgins’s I2 homo-geneity test (I2 test) with significance set at 5%, and I2 test values were interpreted as follows: low heterogeneity if I2 ≤ 25%; moderate heterogeneity if 25% <I2 ≤ 75%; and high heterogeneity if I2 > 75% [28].
Results
Selection process and bias risk assessment
A total of 2571 articles were retrieved from the electronic databases. After 250 duplicates were removed, the titles and abstracts of the remaining 2321 articles were exam-ined to determine the appropriateness of each study. If it was difficult to make a decision, the main text was reviewed to make a selection decision. Finally, 2287 (98.5%) articles were excluded, and 33 articles were selected for review. The process and outcome of the literature selection are pre-sented in detail in Fig. 1.
Quality assessment results of the final 33 articles [29–61] were as follows: 31/33 articles (93.9%) had a low risk of bias in all domains and items. All studies had a low risk of bias for patient selection, and 15 used continuous or random sampling [30, 32, 34, 36–38, 44, 47, 52, 55–60]. For index tests, two studies [31, 40] could not be assessed for risk of bias with certainty. However, because the current review aimed to assess fall risk with a fall risk assessment tool in advance and to compare the fall incidents occurring later, we decided that results interpretation would not be affected, even though the administrations of the index test and the reference standard were not blinded (Fig. 2).
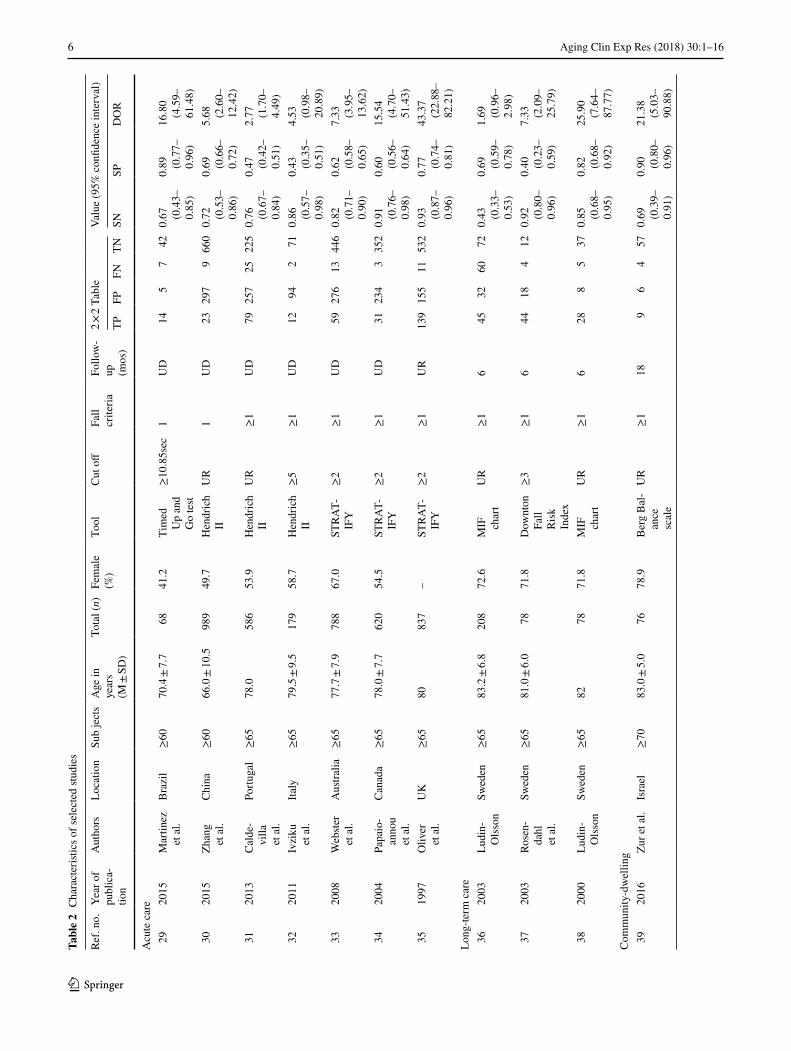
Characteristics of selected studies
Thirty-three studies tested the predictive validity of the fall risk assessment tools in people aged ≥60 for a total of 9743 subjects. Seven studies (4067 subjects) [29–35] were conducted in the acute care setting and most patients were admitted to a geriatric or a rehabilitation ward, and 3 studies (364 subjects) [36–38] were conducted in long-term care settings, such as residential care or nursing homes. Twenty-three studies (5312 subjects) [39–61] were conducted in the

4 Aging Clin Exp Res (2018) 30:1–16
1 3
community of elderly persons living independently in their homes or in a retirement community. Regarding the mean age of study subjects, a mean age in the 70 s was most common (23 studies) [29, 31–34, 40, 41, 43, 45, 47–59,
61], followed by a mean age in the 80 s (7 studies) [35–39, 44, 60] and a mean age in the 60 s (3 studies) [30, 42, 46]. In all studies except for one [35], a fall was defined in terms of fallers. In 3 studies [47, 49, 58], a criterion of ≥2 falls
Fig. 1 Flow diagram of article selection
Fig. 2 Quality assessment results of the selected studies by Quadas-2
5Aging Clin Exp Res (2018) 30:1–16
1 3
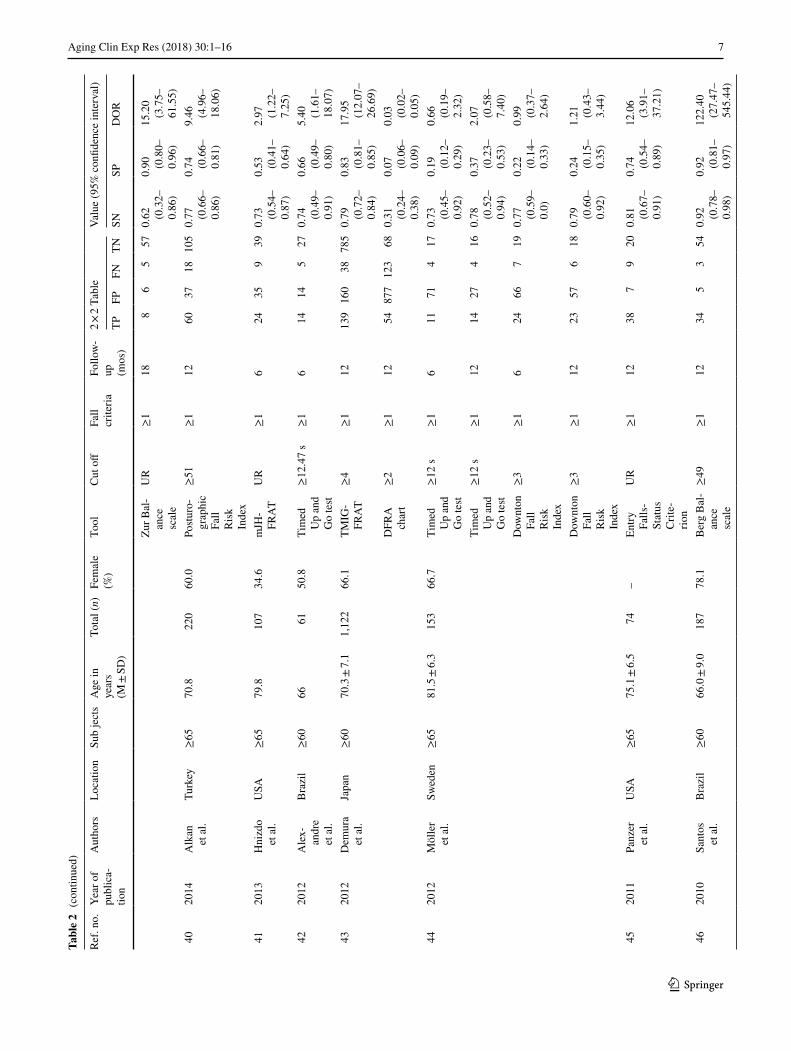
in a person was used to define falls, while, in most studies, the criterion was ≥1 falls. Follow-up durations varied, until hospital discharge in most studies with hospitalized elderly persons, 6 months in studies using long-term care settings, and 2–18 months in studies conducted in community set-tings. Typical follow-up durations were 6 months (6 stud-ies) [41, 42, 50, 53, 57, 61] and 12 months (14 studies) [40, 43–49, 51, 52, 54, 56, 59, 60]. Selected studies were con-ducted in 15 countries, including the US and Canada, and there was active research worldwide without a bias toward any particular country (Table 2).
Fall risk assessment tools used in each setting
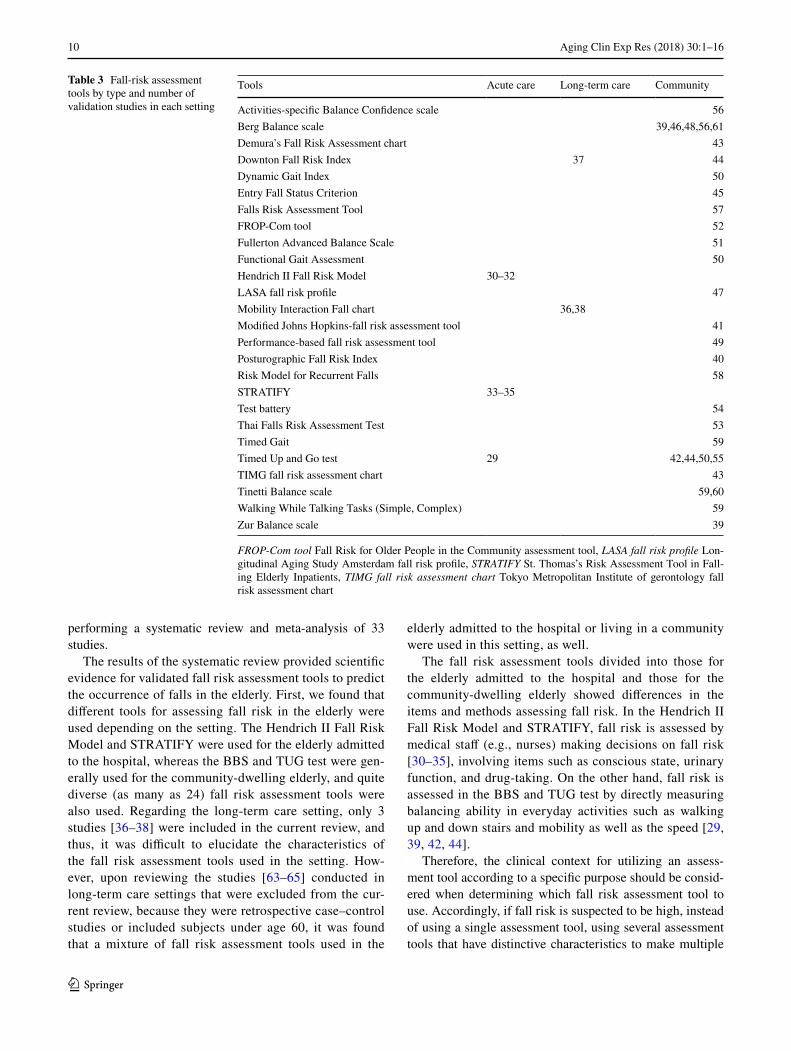
Twenty-six assessment tools for fall risk were used in the selected articles, and they tended to vary based on the set-ting (Table 3). Three fall risk assessment tools were used in the acute care setting: Hendrich II Fall Risk Model, STRATIFY, and Timed Up and Go (TUG) test. Of those, the Hendrich II Fall Risk Model and STRATIFY were used only for elderly hospitalized patients, whereas TUG test was also used for community-dwelling elderly. The number of studies conducted in the long-term care setting was too small to analyze a trend, but two studies used the Mobil-ity Interaction Fall (MIF) chart [36, 38] and one [37] used the Downton Fall Risk Index. Studies conducted with the community-dwelling elderly used a variety of 23 fall risk assessment tools. Assessment tools used in two or more studies were BBS, TUG test, Downton Fall Risk Index, and Tinetti Balance scale, while the remaining 20 assessment tools were each used in a single study.
Predictive validity of fall risk assessment tools in the elderly
The predictive validities of each assessment tool for fall risk are presented in Table 4 and Fig. 3.
BBS was used in 5 studies [39, 46, 48, 56, 61] of com-munity-dwelling elderly for a total of 570 subjects. The pooled sensitivity was 0.73 (95% confidence interval [CI], 0.65–0.79), and heterogeneity among studies was high (82.7%; χ2 = 23.09, P = .0001). The pooled specificity was 0.90 (95% CI 0.86–0.93), and heterogeneity among articles was low (31.9%; χ2 = 5.87, P = .21). The sROC AUC was 0.97 (standard error [SE] = 0.02).
The Downton Fall Risk Index was used in two studies [37, 44] and a total of 231 elderly persons. The pooled sen-sitivity was 0.84 (95% CI 0.76–0.91), and pooled specific-ity was 0.26 (95% CI 0.20–0.33). Heterogeneity between the articles was moderate: 47.5% (χ2 = 3.81, P = .15) and 43.7% (χ2 = 3.55, P = .17) for sensitivity and specificity, respectively.
The Hendrich II Fall Risk Model was used only in stud-ies of hospitalized elderly persons, for a total of 3 articles [30–32] and 1,754 subjects. The pooled sensitivity was 0.76 (95% CI 0.68–0.83) and heterogeneity among the arti-cles was 0.0% (χ2 = 1.10, P = .58), while the pooled speci-ficity was 0.60 (95% CI 0.57–0.62). Heterogeneity among the articles was high, 97.7% (χ2 = 87.03, P < .001). The sROC AUC was 0.75 (SE = 0.05).
The MIF chart was used in two studies (286 elderly persons) [36, 38]. Pooled sensitivity was 0.53 (95% CI 0.44–0.61) and heterogeneity between the articles was high, 94.8% (χ2 = 19.36, P < .001). Pooled specificity was 0.73 (95% CI 0.65–0.80) and heterogeneity between arti-cles was moderate, 64.8% (χ2 = 2.84, P = .09).
STRATIFY was used in 3 studies (2245 elderly persons admitted to an acute care hospital) [33–35]. The pooled sensitivity was 0.89 (95% CI 0.85–0.93), and heterogeneity among the articles was 64.0% (χ2 = 5.56, P = .06). Pooled specificity was 0.67 (95% CI 0.65–0.69), and heterogeneity among the articles was high, 96.5% (χ2 = 57.13, P < .001). The sROC AUC was 0.81 (SE = 0.03).
TUG test was used in 5 studies (427 elderly) [29, 42, 44, 50, 55]. Pooled sensitivity was 0.76 (95% CI 0.68–0.83), and article heterogeneity was 0.0% (χ2 = 2.20, P = .85). Pooled specificity was 0.49 (95% CI 0.43–0.54) and het-erogeneity among the articles was high, 94.8% (χ2 = 95.87, P < .001). The sROC AUC was 0.80 (SE = 0.04).
Finally, the Tinetti Balance scale was used in two stud-ies (284 elderly) [59, 60]. The pooled sensitivity was 0.68 (95% CI 0.56–0.79) and heterogeneity between the articles was 0.0% (χ2 = 0.32, P = .57); the pooled specificity was 0.56 (95% CI 0.49–0.62) and heterogeneity between the articles was high, 79.2% (χ2 = 4.80, P = .03).
Data from 20 fall risk assessment tools used in 888 community-dwelling elderly were combined and meta-ana-lyzed. The pooled sensitivity was 0.63 (95% CI 0.60–0.65) and the pooled specificity was 0.60 (95% CI 0.59–0.62). Heterogeneity among articles was high in both measures, 88.4% (χ2 = 164.29, P < .001) and 98.9% (χ2 = 1751.76, P < .001), respectively. The sROC AUC was 0.76 (SE = 0.05).
Discussion
Although falls can occur at any age, the frequency of falls increases with age [62]. Falls occur in the elderly when physical, perceptual, and cognitive changes occurring with aging are combined with an environment unsuited to elderly safety [5]. To do so, above all, appropriate tools for assessing fall risk in the elderly should be identified and their predictive validity investigated [13]. Hence, we con-ducted this study to address the aforementioned needs by
6 Aging Clin Exp Res (2018) 30:1–16
1 3
Tabl
e 2
Cha
ract
erist
ics o
f sel
ecte
d stu
dies
Ref.
no.
Year
of
publ
ica-
tion
Aut
hors
Loca
tion
Sub
ject
sA
ge in
ye
ars
(M ±
SD
)
Tota
l (n)
Fem
ale
(%)
Tool
Cut
off
Fall
crite
riaFo
llow
-up
(m
os)
2 × 2
Tabl
eVa
lue
(95%
con
fiden
ce in
terv
al)
TPFP
FNTN
SNSP
DO
R
Acu
te c
are
29
2015
Mar
tinez
et
al.
Bra
zil
≥60
70.4
± 7.
768
41.2
Tim
ed
Up
and
Go
test
≥10
.85s
ec1
UD
145
742
0.67
(0
.43–
0.85
)
0.89
(0
.77–
0.96
)
16.8
0 (4
.59–
61.4
8) 3
020
15Zh
ang
et a
l.C
hina
≥60
66.0
± 10
.598
949
.7H
endr
ich
IIU
R1
UD
2329
79
660
0.72
(0
.53–
0.86
)
0.69
(0
.66–
0.72
)
5.68
(2
.60–
12.4
2) 3
120
13C
alde
-vi
lla
et a
l.
Portu
gal
≥65
78.0
586
53.9
Hen
dric
h II
UR
≥1
UD
7925
725
225
0.76
(0
.67–
0.84
)
0.47
(0
.42–
0.51
)
2.77
(1
.70–
4.49
) 3
220
11Iv
ziku
et
al.
Italy
≥65
79.5
± 9.
517
958
.7H
endr
ich
II≥
5≥
1U
D12
942
710.
86
(0.5
7–0.
98)
0.43
(0
.35–
0.51
)
4.53
(0
.98–
20.8
9) 3
320
08W
ebste
r et
al.
Aus
tralia
≥65
77.7
± 7.
978
867
.0ST
RA
T-IF
Y≥
2≥
1U
D59
276
1344
60.
82
(0.7
1–0.
90)
0.62
(0
.58–
0.65
)
7.33
(3
.95–
13.6
2) 3
420
04Pa
paio
-an
nou
et a
l.
Can
ada
≥65
78.0
± 7.
762
054
.5ST
RA
T-IF
Y≥
2≥
1U
D31
234
335
20.
91
(0.7
6–0.
98)
0.60
(0
.56–
0.64
)
15.5
4 (4
.70–
51.4
3) 3
519
97O
liver
et
al.
UK
≥65
8083
7–
STR
AT-
IFY
≥2
≥1
UR
139
155
1153
20.
93
(0.8
7–0.
96)
0.77
(0
.74–
0.81
)
43.3
7 (2
2.88
–82
.21)
Long
-term
car
e 3
620
03Lu
din-
Ols
son
Swed
en≥
6583
.2 ±
6.8
208
72.6
MIF
ch
art
UR
≥1
645
3260
720.
43
(0.3
3–0.
53)
0.69
(0
.59–
0.78
)
1.69
(0
.96–
2.98
) 3
720
03Ro
sen-
dahl
et
al.
Swed
en≥
6581
.0 ±
6.0
7871
.8D
ownt
on
Fall
Ris
k In
dex
≥3
≥1
644
184
120.
92
(0.8
0–0.
96)
0.40
(0
.23–
0.59
)
7.33
(2
.09–
25.7
9)
38
2000
Ludi
n-O
lsso
nSw
eden
≥65
8278
71.8
MIF
ch
art
UR
≥1
628
85
370.
85
(0.6
8–0.
95)
0.82
(0
.68–
0.92
)
25.9
0 (7
.64–
87.7
7)C
omm
unity
-dw
ellin
g 3
920
16Zu
r et a
l.Is
rael
≥70
83.0
± 5.
076
78.9
Ber
g B
al-
ance
sc
ale
UR
≥1
189
64
570.
69
(0.3
9–0.
91)
0.90
(0
.80–
0.96
)
21.3
8 (5
.03–
90.8
8)
7Aging Clin Exp Res (2018) 30:1–16
1 3
Tabl
e 2
(con
tinue
d)
Ref.
no.
Year
of
publ
ica-
tion
Aut
hors
Loca
tion
Sub
ject
sA
ge in
ye
ars
(M ±
SD
)
Tota
l (n)
Fem
ale
(%)
Tool
Cut
off
Fall
crite
riaFo
llow
-up
(m
os)
2 × 2
Tabl
eVa
lue
(95%
con
fiden
ce in
terv
al)
TPFP
FNTN
SNSP
DO
R
Zur B
al-
ance
sc
ale
UR
≥1
188
65
570.
62
(0.3
2–0.
86)
0.90
(0
.80–
0.96
)
15.2
0 (3
.75–
61.5
5) 4
020
14A
lkan
et
al.
Turk
ey≥
6570
.822
060
.0Po
sturo
-gr
aphi
c Fa
ll R
isk
Inde
x
≥51
≥1
1260
3718
105
0.77
(0
.66–
0.86
)
0.74
(0
.66–
0.81
)
9.46
(4
.96–
18.0
6)
41
2013
Hni
zdo
et a
l.U
SA≥
6579
.810
734
.6m
JH-
FRA
TU
R≥
16
2435
939
0.73
(0
.54–
0.87
)
0.53
(0
.41–
0.64
)
2.97
(1
.22–
7.25
) 4
220
12A
lex-
andr
e et
al.
Bra
zil
≥60
6661
50.8
Tim
ed
Up
and
Go
test
≥12
.47
s≥
16
1414
527
0.74
(0
.49–
0.91
)
0.66
(0
.49–
0.80
)
5.40
(1
.61–
18.0
7) 4
320
12D
emur
a et
al.
Japa
n≥
6070
.3 ±
7.1
1,12
266
.1TM
IG-
FRA
T≥
4≥
112
139
160
3878
50.
79
(0.7
2–0.
84)
0.83
(0
.81–
0.85
)
17.9
5 (1
2.07
–26
.69)
DFR
A
char
t≥
2≥
112
5487
712
368
0.31
(0
.24–
0.38
)
0.07
(0
.06–
0.09
)
0.03
(0
.02–
0.05
) 4
420
12M
ölle
r et
al.
Swed
en≥
6581
.5 ±
6.3
153
66.7
Tim
ed
Up
and
Go
test
≥12
s≥
16
1171
417
0.73
(0
.45–
0.92
)
0.19
(0
.12–
0.29
)
0.66
(0
.19–
2.32
)Ti
med
U
p an
d G
o te
st
≥12
s≥
112
1427
416
0.78
(0
.52–
0.94
)
0.37
(0
.23–
0.53
)
2.07
(0
.58–
7.40
)D
ownt
on
Fall
Ris
k In
dex
≥3
≥1
624
667
190.
77
(0.5
9–0.
0)
0.22
(0
.14–
0.33
)
0.99
(0
.37–
2.64
)
Dow
nton
Fa
ll R
isk
Inde
x
≥3
≥1
1223
576
180.
79
(0.6
0–0.
92)
0.24
(0
.15–
0.35
)
1.21
(0
.43–
3.44
)
45
2011
Panz
er
et a
l.U
SA≥
6575
.1 ±
6.5
74–
Entry
Fa
lls-
Stat
us
Crit
e-rio
n
UR
≥1
1238
79
200.
81
(0.6
7–0.
91)
0.74
(0
.54–
0.89
)
12.0
6 (3
.91–
37.2
1)
46
2010
Sant
os
et a
l.B
razi
l≥
6066
.0 ±
9.0
187
78.1
Ber
g B
al-
ance
sc
ale
≥49
≥1
1234
53
540.
92
(0.7
8–0.
98)
0.92
(0
.81–
0.97
)
122.
40
(27.
47–
545.
44)

8 Aging Clin Exp Res (2018) 30:1–16
1 3
Tabl
e 2
(con
tinue
d)
Ref.
no.
Year
of
publ
ica-
tion
Aut
hors
Loca
tion
Sub
ject
sA
ge in
ye
ars
(M ±
SD
)
Tota
l (n)
Fem
ale
(%)
Tool
Cut
off
Fall
crite
riaFo
llow
-up
(m
os)
2 × 2
Tabl
eVa
lue
(95%
con
fiden
ce in
terv
al)
TPFP
FNTN
SNSP
DO
R
47
2010
Peet
ers
et a
l.N
ethe
r-la
nds
≥65
77.9
± 7.
140
873
.3LA
SA
fall
risk
profi
le
≥8
≥2
1243
9533
237
0.57
(0
.45–
0.68
)
0.71
(0
.66–
0.76
)
3.25
(1
.95–
5.43
) 4
820
10M
uir
et a
l.C
anad
a≥
6579
.7 ±
5.3
117
30.8
Ber
g B
al-
ance
sc
ale
≥50
≥1
1226
1226
530.
50
(0.3
6–0.
64)
0.82
(0
.70–
0.90
)
4.42
(1
.93–
10.1
2) 4
920
10Ti
ede-
man
n et
al.
Aus
tralia
≥63
75.3
± 5.
876
478
.7Pe
rfor-
man
ce-
base
d FR
AT
≥1
≥2
1217
913
913
531
10.
57
(0.5
1–0.
63)
0.69
(0
.65–
0.73
)
2.97
(2
.20–
4.00
)
50
2010
Wris
ley
and
Kum
ar
USA
≥60
72.9
± 7.
835
51.4
Tim
ed
Up
and
Go
test
≥11
.0 s
≥1
65
41
250.
83
(0.3
6–1.
00)
0.86
(0
.68–
0.96
)
31.2
5 (2
.86–
341.
88)
Dyn
amic
G
ait
Inde
x
≤19
≥1
66
70
221.
00
(0.5
4–1.
00)
0.76
(0
.56–
0.90
)
39.0
0 (1
.96–
777.
72)
Func
-tio
nal
Gai
t A
sses
s-m
ent
≤20
≥1
66
50
241.
00
(0.5
4–1.
00)
0.83
(0
.64–
0.94
)
57.9
1 (2
.82–
1188
.36)
51
2008
Her
nan-
dez
and
Rose
Can
ada
≥65
77.0
± 6.
519
2–
FAB
sc
ale
≥25
≥1
1244
6315
690.
75
(0.6
2–0.
85)
0.52
(0
.43–
0.61
)
3.21
(1
.63–
6.33
) 5
220
08Ru
ssel
l et
al.
Aus
tralia
≥60
75.9
± 8.
534
469
.2FR
OP-
Com
to
ol
≥20
≥1
1210
864
5611
60.
66
(0.5
8–0.
73)
0.64
(0
.57–
0.71
)
3.50
(2
.24–
5.45
) 5
320
08Th
iam
-w
ong
et a
l.
Thai
land
≥60
71.0
± 7.
714
456
9Th
ai-
FRA
T≥
4≥
16
3318
390
0.92
(0
.78–
0.98
)
0.83
(0
.75–
0.90
)
55.0
0 (1
5.21
–19
8.94
) 5
420
07La
esso
e et
al.
Den
mar
k≥
7073
.7 ±
2.9
9474
.4Te
st B
at-
tery
UR
≥1
127
467
340.
50
(0.2
3–0.
77)
0.43
(0
.32–
0.54
)
0.74
(0
.24–
2.31
) 5
520
05W
hitn
ey
et a
l.U
K≥
6379
.3 ±
7.2
110
75.5
Tim
ed
Up
and
Go
test
≥15
s≥
12
3938
924
0.81
(0
.67–
0.91
)
0.39
(0
.27–
0.52
)
2.74
(1
.13–
6.64
) 5
620
04La
joie
an
d G
al-
lagh
er
Can
ada
≥65
75.5
± 3.
112
564
.0B
erg
Bal
-an
ce
scal
e
≥46
≥1
1237
68
740.
82
(0.6
8–0.
92)
0.93
(0
.84–
0.97
)
57.0
4 (1
8.43
–17
6.2)

9Aging Clin Exp Res (2018) 30:1–16
1 3
Tabl
e 2
(con
tinue
d)
Ref.
no.
Year
of
publ
ica-
tion
Aut
hors
Loca
tion
Sub
ject
sA
ge in
ye
ars
(M ±
SD
)
Tota
l (n)
Fem
ale
(%)
Tool
Cut
off
Fall
crite
riaFo
llow
-up
(m
os)
2 × 2
Tabl
eVa
lue
(95%
con
fiden
ce in
terv
al)
TPFP
FNTN
SNSP
DO
R
AB
C
scal
e≥
67≥
112
3810
770
0.84
(0
.71–
0.94
)
0.88
(0
.78–
0.94
)
38.0
0 (1
3.38
–10
7.89
) 5
720
04N
andy
et
al.
UK
≥65
74.4
± 6.
434
355
.1FR
AT
≥2
≥1
651
5135
202
0.59
(0
.48–
0.70
)
0.80
(0
.74–
0.85
)
5.77
(3
.40–
9.79
) 5
820
02St
alen
-ho
ef
et a
l.
Net
her-
land
s≥
7077
.2 ±
4.9
287
59.9
RM
RF
≥0.
3≥
29
2731
1921
00.
59
(0.4
3–0.
73)
0.87
(0
.82–
0.91
)
9.63
(4
.79–
19.3
4) 5
920
02Ve
rghe
se
et a
l.U
SA≥
6579
.6 ±
6.3
5957
.6Ti
netti
B
al-
ance
sc
ale
≤10
≥1
128
145
320.
62
(0.3
2–0.
86)
0.70
(0
.54–
0.82
)
3.66
(1
.02–
13.1
8)
Tim
ed
Gai
t≥
12 s
≥1
1210
223
240.
77
(0.4
6–0.
95)
0.52
(0
.37–
0.67
)
3.64
(0
.88–
14.9
5)W
WT-
sim
ple
≥20
s≥
112
65
741
0.46
(0
.19–
0.75
)
0.89
(0
.76–
0.96
)
7.03
(1.6
8–29
.43)
WW
T-co
m-
plex
≥26
s≥
112
77
639
0.54
(0
.25–
0.81
)
0.85
(0
.71–
0.94
)
6.50
(1
.68–
25.2
0) 6
020
00R
aȋch
e et
al.
Can
ada
≥75
80.0
± 4.
422
5–
Tine
tti
Bal
-an
ce
scal
e
≤36
≥1
1236
8316
890.
70
(0.5
6–0.
82)
0.52
(0
.44–
0.59
)
2.48
(1
.28–
4.79
)
61
1996
Thor
bahn
an
d N
ewto
n
USA
≥65
79.2
± 6.
265
75.8
Ber
g B
al-
ance
sc
ale
≥45
≥ 1
613
34
450.
76
(0.5
0–0.
93)
0.94
(0
.83–
0.99
)
48.7
5 (9
.66–
246.
14)
mos
mon
ths,
TP tr
ue p
ositi
ve, F
P fa
lse
posi
tive,
FN
fals
e ne
gativ
e, T
N tr
ue n
egat
ive,
SN
sen
sitiv
ity, S
P sp
ecifi
city
, DO
R di
agno
sis
odds
ratio
, UD
unt
il di
scha
rge,
UR
unre
porte
d, H
endr
ich
II
Hen
dric
h II
Fal
l Ris
k M
odel
, STR
ATIF
Y St
. Tho
mas
’s R
isk
Ass
essm
ent T
ool i
n Fa
lling
Eld
erly
Inpa
tient
s, M
IF c
hart
mob
ility
Inte
ract
ion
Fall
char
t, m
JH-F
RAT
mod
ified
Joh
ns H
opki
ns-fa
ll ris
k as
sess
men
t too
l, TM
IG-F
RAT
Toky
o M
etro
polit
an In
stitu
te o
f ger
onto
logy
fall
risk
asse
ssm
ent c
hart,
DFR
A ch
art D
emur
a’s
Fall
Ris
k A
sses
smen
t cha
rt, L
ASA
fall
risk
pro
file
long
itudi
nal
Agi
ng S
tudy
Am
sterd
am fa
ll ris
k pr
ofile
, Per
form
ance
-bas
ed F
RAT
perfo
rman
ce-b
ased
Fal
l Ris
k A
sses
smen
t Too
l, FR
AT fa
ll R
isk
Ass
essm
ent T
ool,
FAB
scal
e Fu
llerto
n A
dvan
ced
Bal
ance
sc
ale,
FRO
P-C
om to
ol F
all R
isk
for O
lder
Peo
ple
in th
e C
omm
unity
ass
essm
ent t
ool,
Thai
-RAT
Tha
i Fal
ls R
isk
Ass
essm
ent T
est,
ABC
scal
e ac
tiviti
es-s
peci
fic B
alan
ce C
onfid
ence
scal
e, R
MRF
ris
k M
odel
for R
ecur
rent
Fal
ls, W
WT-
sim
ple
wal
king
Whi
le T
alki
ng T
asks
-Sim
ple,
WW
T-co
mpl
ex W
alki
ng W
hile
Tal
king
Tas
ks-C
ompl
ex
10 Aging Clin Exp Res (2018) 30:1–16
1 3
performing a systematic review and meta-analysis of 33 studies.
The results of the systematic review provided scientific evidence for validated fall risk assessment tools to predict the occurrence of falls in the elderly. First, we found that different tools for assessing fall risk in the elderly were used depending on the setting. The Hendrich II Fall Risk Model and STRATIFY were used for the elderly admitted to the hospital, whereas the BBS and TUG test were gen-erally used for the community-dwelling elderly, and quite diverse (as many as 24) fall risk assessment tools were also used. Regarding the long-term care setting, only 3 studies [36–38] were included in the current review, and thus, it was difficult to elucidate the characteristics of the fall risk assessment tools used in the setting. How-ever, upon reviewing the studies [63–65] conducted in long-term care settings that were excluded from the cur-rent review, because they were retrospective case–control studies or included subjects under age 60, it was found that a mixture of fall risk assessment tools used in the
elderly admitted to the hospital or living in a community were used in this setting, as well.
The fall risk assessment tools divided into those for the elderly admitted to the hospital and those for the community-dwelling elderly showed differences in the items and methods assessing fall risk. In the Hendrich II Fall Risk Model and STRATIFY, fall risk is assessed by medical staff (e.g., nurses) making decisions on fall risk [30–35], involving items such as conscious state, urinary function, and drug-taking. On the other hand, fall risk is assessed in the BBS and TUG test by directly measuring balancing ability in everyday activities such as walking up and down stairs and mobility as well as the speed [29, 39, 42, 44].
Therefore, the clinical context for utilizing an assess-ment tool according to a specific purpose should be consid-ered when determining which fall risk assessment tool to use. Accordingly, if fall risk is suspected to be high, instead of using a single assessment tool, using several assessment tools that have distinctive characteristics to make multiple
Table 3 Fall-risk assessment tools by type and number of validation studies in each setting
FROP-Com tool Fall Risk for Older People in the Community assessment tool, LASA fall risk profile Lon-gitudinal Aging Study Amsterdam fall risk profile, STRATIFY St. Thomas’s Risk Assessment Tool in Fall-ing Elderly Inpatients, TIMG fall risk assessment chart Tokyo Metropolitan Institute of gerontology fall risk assessment chart
Tools Acute care Long-term care Community
Activities-specific Balance Confidence scale 56Berg Balance scale 39,46,48,56,61Demura’s Fall Risk Assessment chart 43Downton Fall Risk Index 37 44Dynamic Gait Index 50Entry Fall Status Criterion 45Falls Risk Assessment Tool 57FROP-Com tool 52Fullerton Advanced Balance Scale 51Functional Gait Assessment 50Hendrich II Fall Risk Model 30–32LASA fall risk profile 47Mobility Interaction Fall chart 36,38Modified Johns Hopkins-fall risk assessment tool 41Performance-based fall risk assessment tool 49Posturographic Fall Risk Index 40Risk Model for Recurrent Falls 58STRATIFY 33–35Test battery 54Thai Falls Risk Assessment Test 53Timed Gait 59Timed Up and Go test 29 42,44,50,55TIMG fall risk assessment chart 43Tinetti Balance scale 59,60Walking While Talking Tasks (Simple, Complex) 59Zur Balance scale 39

11Aging Clin Exp Res (2018) 30:1–16
1 3
Tabl
e 4
Sum
mar
y re
sults
of m
eta-
anal
ysis
ROC
cur
ve re
ceiv
er-o
pera
ting
char
acte
ristic
cur
ve, A
UC
are
a un
der t
he c
urve
, SE
stan
dard
err
or, S
TRAT
IFY
St. T
hom
as’s
Ris
k A
sses
smen
t Too
l in
Falli
ng E
lder
ly In
patie
nts
Tool
sSt
udie
s (k)
Subj
ects
(n)
Pool
ed d
iagn
ostic
test
accu
racy
(95%
con
fiden
ce in
terv
al)
Sum
mar
y RO
C c
urve
Sens
itivi
tySp
ecifi
city
Posi
tive-
likel
ihoo
d ra
tio
Neg
ativ
e-lik
elih
ood
ratio
Dia
gnos
tic
odds
ratio
AU
C (S
E)Q
* (S
E)
Valu
esI2 (%
)χ2
PVa
lues
I2 (%)
χ2P
Ber
g B
al-
ance
scal
e5
570
0.73
(0.6
5–0.
79)
82.7
23.0
90.
0001
0.90
(0.8
6–0.
93)
31.9
5.87
0.21
7.35
(3.7
9–14
.24)
0.26
(0.1
2–0.
58)
29.7
3 (7
.81-
113.
17)
0.97
(0.0
2)0.
92 (0
.04)
Dow
nton
Fa
ll R
isk
Inde
x
223
10.
84 (0
.76–
0.91
)47
.53.
810.
150.
26 (0
.20–
0.33
)43
.73.
550.
171.
14 (0
.90–
1.45
)0.
60 (0
.25–
1.47
)1.
95 (0
.61–
6.20
)
Hen
dric
h II
Fa
ll R
isk
Mod
el
31,
754
0.76
(0.6
8–0.
83)
0.0
1.10
0.58
0.60
(0.5
7–0.
62)
97.7
87.0
3<
0.00
11.
69 (1
.26–
2.27
)0.
47 (0
.35–
0.63
)3.
61 (2
.22–
5.87
)0.
75 (0
.05)
0.70
(0.0
4)
Mob
ility
In
tera
ctio
n ch
art
228
60.
53 (0
.44–
0.61
)94
.819
.36
<0.
001
0.73
(0.6
5–0.
80)
64.8
2.84
0.09
2.50
(0.7
4–8.
41)
0.41
(0.0
8–2.
08)
6.26
(0.4
3–91
.38)
STR
ATI
FY3
2,24
50.
89 (0
.85–
0.93
)64
.05.
560.
060.
67 (0
.65–
0.69
)96
.557
.13
<0.
001
227
(1.7
7–4.
17)
0.16
(0.0
7–0.
37)
17.1
1 (4
.97–
58.9
3)0.
81 (0
.30)
0.75
(0.2
7)
Tim
ed U
p an
d G
o te
st
442
70.
76 (0
.68–
0.83
)0.
02.
020.
850.
49 (0
.43–
0.54
)94
.895
.87
<0.
001
1.87
(1.1
9–2.
93)
0.50
(0.3
3–0.
75)
3.99
(1.5
1–10
.51)
0.80
(0.0
4)0.
74 (0
.03)
Tine
tti B
al-
ance
scal
e2
284
0.68
(0.5
6–0.
79)
0.0
0.32
0.57
0.56
(0.4
9–0.
62)
79.2
4.80
0.03
1.51
(1.2
1–1.
89)
0.58
(0.4
0–0.
83)
2.69
(1.5
0–4.
83)
Oth
ers
1688
80.
63 (0
.60–
0.66
)88
.416
4.29
<0.
001
0.60
(0.5
9–0.
62)
98.9
1751
.76
<0.
001
2.57
(1.7
7–3.
73)
0.48
(0.3
0–0.
76)
5.77
(2.3
6–14
.09)
0.76
(0.0
4)0.
70 (0
.04)

12 Aging Clin Exp Res (2018) 30:1–16
1 3
Fig. 3 Predictive validity of fall risk assessment tools

13Aging Clin Exp Res (2018) 30:1–16
1 3
assessments of fall risk would be necessary to increase the overall predictive accuracy.
The goal of using a fall risk assessment tool is to dis-criminate high and low risks of fall rather than reducing fall risk, and therefore, an assessment tool with high sen-sitivity and high specificity should be chosen [66]. In addi-tion, inter-study heterogeneity should be low, so that the interpretation of a test score may be stable. Overall, all fall risk assessment tools used for the elderly, except for the MIF chart and Tinetti Balance scale, showed a sensitivity of ≥0.7 and low or no inter-study heterogeneity. In most assessment tools except for BBS, specificity was lower
than sensitivity (i.e., under 0.6) and inter-study heteroge-neity was high (i.e., over 90%). However, the primary goal of using a fall risk assessment tool is to identify people at a high risk of falling to minimize the occurrence of fall. Accordingly, we conjectured that if a fall risk assessment tool has a high sensitivity, it achieves the primary goal of using the assessment tool, even though the specificity is low.
Upon examining the results for each assessment tool, BBS showed both pooled sensitivity and pooled specific-ity >0.7, but inter-study heterogeneity in sensitivity was high. The Downton Fall Risk Index was a relatively stable
Fig. 3 (continued)

14 Aging Clin Exp Res (2018) 30:1–16
1 3
tool with a moderate level of inter-study heterogeneity in both sensitivity and specificity and had a pooled sensitivity of 0.84. However, the pooled specificity was too low (0.26). The pooled sensitivity and specificity of the Hendrich II Fall Risk Model were acceptable, at 0.7 and 0.6, respec-tively, but inter-study heterogeneity was high, particularly in specificity. The pooled sensitivity of the MIF chart was low (0.53) and inter-study heterogeneity was high. STRAT-IFY had the highest pooled sensitivity (0.89), and a pooled specificity at a level similar to that of Hendrich II Fall Risk Model. In both the TUG test and Tinetti Balance scale, the pooled sensitivity was approximately 0.7 with no inter-study heterogeneity, whereas the pooled specificity was low (0.5) and inter-study heterogeneity was high. Regarding the assessment tools used each in a single study, the sensitiv-ity was >0.7 for the majority of the assessment tools, while it was <0.5 for quite a few assessment tools. Overall, both pooled sensitivity and pooled specificity were <0.6 and inter-study heterogeneity was high in both measures.
Therefore, we concluded that the predictive validity of the fall risk assessment tools currently used for the elderly is not sufficient. Moreover, the evidence shows that the use of a large variety of fall risk assessment tools in the elderly does not predict elderly fallers with sufficient accuracy. Focusing on the primary goal of each selected tool, as men-tioned above, however, we recommend the Downton Fall Risk Index, Hendrich II Fall Risk Model, STRATIFY, and TUG test, which showed a pooled sensitivity >0.7 and low inter-study heterogeneity. However, the pooled specific-ity of the Downton Fall Risk Index and TUG test was very low compared to that for the other assessment tools; thus, it would be undesirable to use either test alone to assess fall risk. Regarding specificity, only BBS had a pooled specific-ity of 0.9, showing that the highest level of predictability and inter-study heterogeneity was low. Thus, BBS is the most useful tool in identifying the elderly with low fall risk.
An important limitation of the present study was that we selected only prospective studies with elderly subjects aged ≥60 or more and thus did not include all fall risk assessment tools used in practice. By limiting the study population to the elderly aged 60 years or more and exclud-ing retrospective studies, however, we were able to make relatively strong conclusions on each fall risk assessment tool based on the meta-analytic results. In addition, the limitation of this study concerns the low number of stud-ies included by setting, especially acute care and long-term care facilities. Although not a limitation which concerns the design of this review, it is the limit of this study that the validity of the fall tool used in each setting was not fully verified.
To summarize the study findings, rather than a single assessment tool, two assessment tools used in combina-tion will maximize the characteristics and predictability of
each test. For instance, in assessing the risk of fall among the community-dwelling elderly, the TUG test, which has a relatively stable sensitivity, and BBS, which has a relatively stable specificity, can be used in combination to increase diagnostic accuracy of the risk of fall. In addition, the most desirable strategy to consider both the disease state and physical balancing ability of the elderly will be to use, in combination, STRATIFY or the Hendrich II Fall Risk Model, which has a high sensitivity, and BBS or MIF chart which has a stable specificity. This approach will increase the predictability of the risk of fall regardless of the setting.
Acknowledgements The author thanks Dr. Jeong-Hae Hwang and Dr. Yun-Kyung Choi for the assistance and advice during data selec-tion, extraction, and the quality assessment of the studies.
Compliance with ethical standards
Conflict of interest No conflict of interest to declare.
Statement of human and animal rights This article does not con-tain any studies with human participants or animals performed by the author.
Informed consent For this type of study, formal consent is not required.
Funding This work was supported by the Soonchunhyang Univer-sity Research Fund (No. 20150692). The funder had no further role in the conduct of the research.
References
1. United Nations Department of Economic and Social Affairs, Population Division (2013) World Population Ageing 2013. United Nations, New York
2. World Health Organization (2012) Fact sheet 344: Falls. http://www.who.int/mediacentre/factsheets/fs344/en/. Accessed 6 June 2015
3. Kramarow E, Chen LH, Hedegaard H et al (2015) Deaths from unintentional injury among adults aged 65 and over: United States, 2000–2013. NCHS Data Brief. http://www.cdc.gov/nchs/data/databriefs/db199.pdf. Assessed 5 July 2016
4. Centers for Disease Control and Prevention (2006) Fatalities and injuries from falls among older adults, United States, 1993–2003 and 2001–2005. Morb Mortal Wkly Rep 55:1221–1224
5. Gillespie LD, Robertson MC, Gillespie WJ et al (2012) Interven-tions for preventing falls in older people living in the community. Cochrane Database Syst Rev CD007146. doi:10.1002/14651858.CD007146.pub3
6. World Health Organization (2007) Global report on falls preven-tion in older age. World Health Organization, Geneva
7. Scuffham P, Chaplin S, Legood R (2003) Incidence and costs of unintentional falls in older people in the United Kingdom. J Epi-demiol Community Health 57740–744
8. Public Health Agency of Canada (2005) Report on Seniors’ falls in Canada. Minister of Public Works and Government Services Canada, Ottawa
15Aging Clin Exp Res (2018) 30:1–16
1 3
9. Centre for Health Promotion, Public Health Agency of Can-ada; British Columbia Injury Research and Prevention Unit (BCIRPU) (2012) National fall prevention workshop: stepping up pan-Canadian coordination. Chronic Dis Inj Can 32: 227–228
10. Tinetti ME, Williams CS (1998) The effect of falls and fall inju-ries on functioning in community-dwelling older, persons. J Ger-ontol A Biol Sci Med Sci 53:M112-M119
11. Kannus P, Palvanen M, Niemi S et al (2007) Alarming rise in the number and incidence of fall-induced cervical spine injuries among older adults. J Gerontol A Biol Sci Med Sci 62:180–183
12. Public Health Agency of Canada (2013) Falls in older people: assessing risk and prevention. https://www.nice.org.uk/guidance/cg161. Accessed 5 July 2016
13. Scott V, Votova K, Scanlan A et al (2007) Multifactorial and functional mobility assessment tools for falls risk among older adults in the community, home-support, long-term care and acute settings. Age Ageing 36:130–139
14. Perrell KL, Nelson A, Goldman RL et al (2001) Fall risk assess-ment measures: an analytic review. J Gerontol A Biol Med Sci 56:M761-M766
15. Myers H (2003) Hospital fall risk assessment tools: a critique of the literature. Int J Nurs Pract 9:223–235
16. Aranda-Gallardo M, Morales-Asencio JM, Canca-Sanchez JC et al (2013) Instruments for assessing the risk of falls in acute hospitalized patients: a systematic review and meta-analysis. BMC Health Serv Res 13:122. doi:10.1186/1472-6963-13-122
17. da Costa BR, Rutjes AW, Mendy A et al (2012) Can falls risk prediction tools correctly identify fall-prone elderly rehabilita-tion inpatients? A systematic review and meta-analysis. PLoS One 7:e41061. doi:10.1371/journal.pone.0041061
18. Gates S, Smith LA, Fisher JD et al (2008) Systematic review of accuracy of screening instruments for predicting fall risk among independently living older adults. J Rehabil Res Dev 45:1105–1116
19. Kehinde JO (2009) Instruments for measuring fall risk in older adults living in long-term care facilities: an integrative review. J Gerontol Nurs 35:46–55. doi:10.3928/00989134-20090902-01
20. Lee J, Geller AI, Strasser DC (2013) Analytical review: focus on fall screening assessments. PM R 5:609–621. doi:10.1016/j.pmrj.2013.04.001
21. Bossuyt PM, Davenport C, Deeks J et al (2013) Cochrane hand-book for systematic reviews of diagnostic test accuracy. The Cochrane Collaboration. http://srdta.cochrane.org/. Accessed 30 May 2015
22. Moher D, Liberati A, Tetzlaff J et al (2009) Preferred reporting items for systematic reviews and meta-analyses: the PRISMA statement. Ann Intern Med 151:264–269
23. Scottish Intercollegiate Guidelines National Institute for Health and Care Excellence (2014) http://www.sign.ac.uk/methodology/filters.html#diag. Accessed 1 August, 2014
24. Whiting PF, Rutjes AW, Westwood ME et al (2011) QUA-DAS-2: A revised tool for the quality assessment of diag-nostic accuracy studies. Ann Intern Med 155:529–536. doi:10.7326/0003-4819-155-8-201110180-00009
25. Zamora J, Abraira V, Muriel A et al (2006) Meta-DiSc: a soft-ware for meta-analysis of test accuracy data. BMC Med Res Methodol 6:31. doi:10.1186/1471-2288-6-31
26. Greiner M, Pfeiffer D, Smith RD (2000) Principles and practical application of the receiver-operating characteristic analysis for diagnostic tests. Prev Vet Med 45:23–41
27. Walter SD (2002) Properties of the summary receiver operating characteristic (SROC) curve for diagnostic test data. Stat Med 21:1237–1256. doi:10.1002/sim.1099
28. Higgins JP, Thompson SG (2002) Quantifying heterogeneity in a meta-analysis. Stat Med 21:1539–1558. doi:10.1002/sim.1186
29. Martinez BP, Gomes IB, Oliveira CS et al (2015) Accu-racy of the timed up and go test for predicting sarcopenia in elderly hospitalized patients. Clinics 70:369–372. doi:10.6061/clinics/2015(05)11
30. Zhang C, Wu X, Lin S et al (2015) Evaluation of reliability and validity of the Hendrich II Fall Risk Model in a Chinese hos-pital population. PLoS One 10:e0142395. doi:10.1371/journal.pone.0142395
31. Caldevilla MN, Costa MA, Teles P et al (2013) Evalua-tion and cross-cultural adaptation of the Hendrich II Fall Risk Model to Portuguese. Scand J Caring Sci 27:468–474. doi:10.1111/j.1471-6712.2012.01031.x
32. Ivziku D, Matarese M, Pedone C et al (2011) Predictive validity of the Hendrich fall risk model II in an acute geriatric unit. Int J Nurs Stud 48:468–474. doi:10.1016/j.ijnurstu.2010.09.002
33. Webster J, Courtney M, Marsh N et al (2010) The STRAT-IFY tool and clinical judgment were poor predictors of fall-ing in an acute hospital setting. J Clin Epidemiol 63:109–113. doi:10.1016/j.jclinepi.2009.02.003
34. Papaioannou A, Parkinson W, Cook R et al (2004) Prediction of falls using a risk assessment tool in the acute care setting. BMC Med 2:1. doi:10.1186/1741-7015-2-1
35. Oliver D, Britton M, Seed P et al (1997) Development and evalu-ation of evidence based risk assessment tool (STRATIFY) to predict which elderly inpatients will fall: case-control and cohort studies. BMJ 315:1049–1053
36. Network-Olsson L, Jensen J, Nyberg L et al (2003) Predicting falls in residential care by a risk assessment tool, staff judge-ment, and history of falls. Aging Clin Exp Res 15:51–59
37. Rosendahl E, Lundin-Olsson L, Kallin K et al (2003) Prediction of falls among older people in residential care facilities by the Downton index. Aging Clin Exp Res 15:142–147
38. Lundin-Olsson L, Nyberg L, Gustafson Y (2000) The mobility interaction fall chart. Phys Res Int 5:190–201
39. Zur O, Shaki T, Carmeli E (2016) Concurrent validity and reli-ability of a new balance scale used in older adults. Adv in Exp Med Biol 910: 63–70. doi:10.1007/5584_2015_207
40. Alkan H, Yildiz N, Sarsan A et al (2014) The relationship between posturographic fall risk and clinical balance tests among community-dwelling older adults. Turk Geriatr Derg 17:242–248
41. Hnizdo S, Archuleta RA, Taylor B et al (2013) Validity and reli-ability of the modified John Hopkins Fall Risk Assessment Tool for elderly patients in home health care. Geriatr Nurs 34:423–427. doi:10.1016/j.gerinurse.2013.05.011
42. Alexandre TS, Meira DM, Rico NC et al (2012) Accuracy of timed up and go test for screening risk of falls among commu-nity-dwelling elderly. Rev Bras Fisioter 16:381–388
43. Demura S, Sato S, Shin S et al (2012) Setting the criterion for fall risk screening for healthy community-dwelling elderly. Arch Gerontol Geriatr 54:370–373. doi:10.1016/j.archger.2011.04.010
44. Möller UO, Kristensson J, Midlöv P et al (2012) Predictive validity and cut-off cores in four diagnostic tests for falls-A study in frail older people at home. Phys Occup Ther Geriatr 30:189–201. doi:10.3109/02703181.2012.694586
45. Panzer VP, Wakefield DB, Hall CB et al (2011) Mobility assess-ment: Sensitivity and apecificity of measurement sets in older adults. Arch Phys Med Rehabil 92:905–912. doi:10.1016/j.apmr.2011.01.004
46. Santos GM, Souza AC, Virtuoso JF et al (2011) Predictive val-ues at risk of falling in physically active and no active elderly with Berg Balance Scale. Rev Bras Fisioter 15:95–101
47. Peeters GM, Pluijm SM, van Schoor NM et al (2010) Valida-tion of the LASA fall risk profile for recurrent falling in older recent fallers. J Clin Epidemiol 63:1242–1248. doi:10.1016/j.jclinepi.2009.12.012

16 Aging Clin Exp Res (2018) 30:1–16
1 3
48. Muir SW, Berg K, Chesworth B et al (2010) Application of a fall screening algorithm stratified fall risk but missed preventive opportunities in community-dwelling older adults: a prospective study. J Geriatr Phys Ther 33:165–172
49. Tiedemann A, Lord SR, Sherrington C et al (2010) The devel-opment and validation of a brief performance-based fall risk assessment tool for use in primary care. J Gerontol A Biol Sci Med 65:896–903. doi:10.1093/gerona/glq067
50. Wrisley DM, Kumar NA (2010) Functional gait assessment: concurrent, discriminative, and predictive validity in commu-nity-dwelling older adults. Phys Ther 90:761–773. doi:10.2522/ptj.20090069
51. Hernandez D, Rose DJ, Hernandez D et al (2008) Predict-ing which older adults will or will not fall using the Fullerton Advanced Balance scale. Arch Phys Med Rehabil 89:2309–2315. doi:10.1016/j.apmr.2008.05.020
52. Russell MA, Hill KD, Blackberry I et al (2008) The reliability and predictive accuracy of the falls risk for older people in the community assessment (FROP-Com) tool. Age Ageing 37:634–639. doi:10.1093/ageing/afn129
53. Thiamwong L, Thamarpirat J, Maneesriwongul W et al (2008) Thai falls risk assessment test (Thai-FRAT) developed for com-munity-dwelling Thai elderly. J Med Assoc Thai 91:1823–1831
54. Laessoe U, Hoeck HC, Simonsen O et al (2007) Fall risk in an active elderly population–can it be assessed? J Negat Results Biomed 6:2. doi:10.1186/1477-5751-6-2
55. Whitney JC, Lord SR, Close JC (2005) Streamlining assessment and intervention in a falls clinic using the Timed Up and Go Test and Physiological Profile Assessments. Age Ageing 34:567–571
56. Lajoie Y, Gallagher SP (2004) Predicting falls within the elderly community: Comparison of postural sway, reaction time, the Berg balance scale and the Activities-specific Balance
Confidence (ABC) scale for comparing fallers and non-fallers. Arch Gerontol Geriatr 38:11–26
57. Nandy S, Parsons S, Cryer C et al (2004) Development and preliminary examination of the predictive validity of the Falls Risk Assessment Tool (FRAT) for use in primary care. J Public Health (Oxf) 26:138–143
58. Stalenhoef PA, Diederiks JP, Knottnerus JA et al (2002) A risk model for the prediction of recurrent falls in community-dwelling elderly: a prospective cohort study. J Clin Epidemiol 55:1088–1094
59. Verghese J, Buschke H, Viola L et al (2002) Validity of divided attention tasks in predicting falls in older individuals: A prelimi-nary study. J Am Geriatr Soc 50:1572–1576
60. Raȋche M, Hebert R, Prince F et al (2000) Screening older adults at risk of falling with the Tinetti balance scale. Lancet 356:1001–1002. doi:10.1016/S0140-6736(00)02695-7
61. Thorbahn LB, Newton RA (1996) Use of the Berg balance test to predict falls in elderly persons. Phys Ther 76:576–583
62. Lundin (2016). Preventing falls among older adults. Important Facts about Falls. http://www.cdc.gov/HomeandRecreational-Safety/Falls/adultfalls.html. Accessed 17 July 2016
63. Wijnia JW, Ooms ME, van Balen R (2006) Validity of the STRATIFY risk score of falls in nursing homes. Prev Med 42:154–157
64. Large J, Gan N, Basic D et al (2006) Using the timed up and go test to stratify elderly inpatients at risk of falls. Clin Rehabil 20:421–428
65. Morse JM (1986) Computerized evaluation of a scale to identify the fall-prone patient. Can J Public Health 77:21–25
66. Larson E (1986) Evaluating validity of screening tests. Nurs Res 35:186–188