toolbox 2 energy auditing in industry - wiley.com · developing an understanding of industrial...
TRANSCRIPT

APPLIED INDUSTRIAL ENERGY AND ENVIRONMENTAL MANAGEMENT Z. K. Morvay, D. D. Gvozdenac
Part III:
FUNDAMENTALS FOR ANALYSIS AND CALCULATION OF ENERGY AND
ENVIRONMENTAL PERFORMANCE
1
Applied Industrial Energy and Environmental Management Zoran K. Morvay and Dusan D. Gvozdenac © John Wiley & Sons, Ltd
Toolbox 2
ENERGY AUDITING IN INDUSTRY
Step-By-Step Guide to Carrying Out an Energy Audit
STEP 1 UNDERSTANDING INDUSTRIAL OPERATIONS
STEP 2 PRELIMINARY ENERGY AUDIT
STEP 3 IDENTIFICATION OF ENERGY CONSERVATION
OPPORTUNITIES (ECO)
STEP 4 DETAILED ENERGY AUDIT (DEA)
• preparing measurement plans and conducting measurements
STEP 4.1 SPECIFICATION OF ENERGY CONSERVATION MEASURES
(ECM)
STEP 4.2 PREPARATION AND PRESENTATION OF DEA REPORT AND
ACTION PLANS
STEP 1: UNDERSTANDING INDUSTRIAL OPERATIONS
Developing an understanding of industrial operations is a prerequisite for the analysis of energy
efficiency in an organization. In order to achieve that, we start with data on the general characteristics
of the business (Checklist 1) followed by data collection on energy use, main utilities and
characteristics of energy end-use requirements, as described by Step 2.
CHECKLIST 1: GENERAL CHARACTERISTICS Activity Type (sector):
Main products:
Production capacity [t/y]
Capacity utilization [%]
NATIONAL OR MULTINATIONAL:
History
When established:
Growth pattern

Part III – Toolbox 2:
ENERGY AUDITING IN INDUSTRY 2
Cost structure
Raw material [%]
Labor [%]
Energy [%]
Other [%]
EXTERNAL ENVIRONMENTAL FACTORS
Economics
Broad economic setting:
Development trends:
Structure and share of the market:
OBJECTIVES AND STRATEGIES General
Specific organizational objectives and strategies as defined by management
Growth
Growth objectives over the next 5 years
Investment
Policies and plans, main projects
STEP 2: PRELIMINARY ENERGY AUDIT (PEA)
A PEA is essentially a data gathering exercise which aims to develop an understanding of how energy
is used in a factory, and prepare a background for detailed energy audit (DEA) implementation (Fig.
2.1). Questionnaires 1 and 2 will help to guide you through and structure the data gathering process.

Part III – Toolbox 2:
ENERGY AUDITING IN INDUSTRY 3
Figure 2.1: Flow Chart of Preliminary Energy Audit (PEA)
QUESTIONNAIRE 1: PRELIMINARY ENERGY AUDIT – Data on energy consumption and costs
Company:
Address:
General Manager:
Contact person:
Telephone, Fax, E-Mail
By:
Date:

Part III – Toolbox 2:
ENERGY AUDITING IN INDUSTRY 4
GENERAL INFORMATION
Production program and capacity
Production in the year ______ (description and quantities of final products)1
Raw materials (description and quantities):
Short process description (phases)
Draft scheme of the production process
1 All quantities shall be given for the same year.

Part III – Toolbox 2:
ENERGY AUDITING IN INDUSTRY 5
Electricity, 3×380 V
Steam, 8 barg
Industrial Water
Cooling Water, 34 oC
Compressed Air, 7 barg
Waste Water
Solid Waste
Total annual operating time [h/yr]:
Number of shifts per working day:
Total number of employees:
Number of employees in energy group:
Head of group:
Total annual cost of production:
Total annual cost for energy and water:

Part III – Toolbox 2:
ENERGY AUDITING IN INDUSTRY 6
Layout of the factory

Part III – Toolbox 2:
ENERGY AUDITING IN INDUSTRY 7
MONTHLY SUMMARY OF FUEL OIL CONSUMPTION AND COSTS
Name of fuel:
Source:
Fuel classification:
Average low calorific value [kJ/kg]:
Year of consumption:
Month Deliveries
[l]
Cost of
delivery
[ ]
Working
days in a
month
Consumption
[l]
Cost of
consumed fuel
[ ] 1 2 3 4 5 6
I
II
III
IV
V
VI
VII
VIII
IX
X
XI
XII
Total

Part III – Toolbox 2:
ENERGY AUDITING IN INDUSTRY 8
MONTHLY SUMMARY OF ELECTRICITY ENERGY AND COSTS
Tariff description:
Year of consumption
Month
Active energy Reactive energy Total cost
[ ]
Consumption
[kWh]
Price/unit
[ /kWh]
Consumption
[kVArh]
Price/unit
[ /kVArh]
1 2 3 4 5 6
I
II
III
IV
V
VI
VII
VIII
IX
X
XI
XII
Total
Part III – Toolbox 2:
ENERGY AUDITING IN INDUSTRY 9
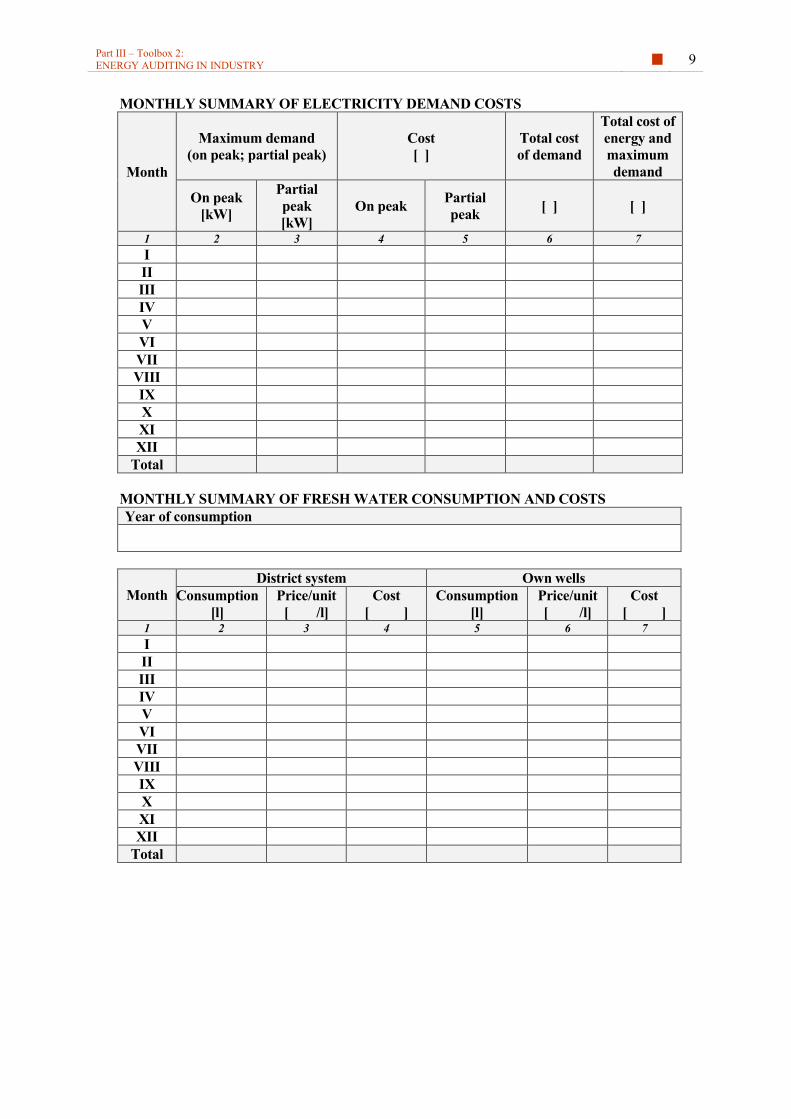
MONTHLY SUMMARY OF ELECTRICITY DEMAND COSTS
Month
Maximum demand
(on peak; partial peak)
Cost
[ ]
Total cost
of demand
Total cost of
energy and
maximum
demand
On peak
[kW]
Partial
peak
[kW]
On peak Partial
peak [ ] [ ]
1 2 3 4 5 6 7
I
II
III
IV
V
VI
VII
VIII
IX
X
XI
XII
Total
MONTHLY SUMMARY OF FRESH WATER CONSUMPTION AND COSTS
Year of consumption
Month
District system Own wells
Consumption
[l]
Price/unit
[ /l]
Cost
[ ]
Consumption
[l]
Price/unit
[ /l]
Cost
[ ] 1 2 3 4 5 6 7
I
II
III
IV
V
VI
VII
VIII
IX
X
XI
XII
Total

Part III – Toolbox 2:
ENERGY AUDITING IN INDUSTRY 10
MONTHLY SUMMARY OF WASTE WATER COSTS
Year of consumption
Month
Sewerage system Total cost of
water Total cost
Consumption
[l]
Price/unit
[ / ]
Cost
[ ]
[ ]
[ ] 1 2 3 4 5 4+5
I
II
III
IV
V
VI
VII
VIII
IX
X
XI
XII
Total

Part III – Toolbox 2:
ENERGY AUDITING IN INDUSTRY 11
QUESTIONNAIRE 2:
PRELIMINARY ENERGY AUDIT – Specifications of main utilities
ENERGY TRANSFORMERS
Boiler Room
BOILER No.1
BOILER No.2
FEEDWATERTANK
Make UpWater
Returncondensateapp. 65 %
STEAM to process
Oil
Preheater
Heavy Fuel Oil
Blow Down
Feed Water
Pumps
EXAMPLE
Figure 2.2: Draft Scheme of the Boiler Room
Number of boilers:
Total capacity:
Total annual production of heat energy [TJ/yr]:
Total annual fuel consumption [h/yr]:
Total annual operating time [h/yr]:
Total annual quantities of water supplied to the
system [h/yr]:

Part III – Toolbox 2:
ENERGY AUDITING IN INDUSTRY 12
Steam Boiler
Figure 2.3: Draft Scheme of the Steam Boiler
Type of boiler:
Design capacity [t/h]:
Fuel:
Total annual operating time [h/yr]:
Age [years]:
Rated capacity [t/h]:
Annual fuel consumption [yr]:
Annual operating period:
Pressures and Temperatures
Steam pressure at boiler outlet [kPa]
Steam temperature at boiler outlet [oC]:
Water temperature at boiler inlet [oC]:
Combustion air temperature [oC]:
Temperature of gas leaving the boiler [oC]:
Fuel temperature [oC]:
Flue Gas Analyses
CO2:
O2:
CO:
N2:
Excess air:

Part III – Toolbox 2:
ENERGY AUDITING IN INDUSTRY 13
Electric Power
Figure 2.4: Draft Single-Pole Scheme of the Transformer Station’s Connection
Annual need for electric power satisfied by:
Distribution system [%]
Your own CHP plant [%]
Voltage of the power supply system [kV]
Voltage transformation [kV]
Number of transformer stations
Number of transformers
Total installed capacity [kVA]
Installed capacity per units [kVA]
ENERGY END-USERS
A/C systems
A/C systems used:
Number of independent systems:
Total design quantity of the A/C air output [m3/h]

Part III – Toolbox 2:
ENERGY AUDITING IN INDUSTRY 14
FRESH AIR
OAHU 1 & 2
FRESH AIR
CFU
AHU
OEF
PREMISES
24 oC
50 %
SA
RA
FA
AHU
OEF
PREMISES
24 oC
50 %
SA
RA
FA
AHU
AEF
PREMISES
24 oC
50 %
SA
FA
RA
84000 m3/h
1512 kW
46800 m3/h
179600 m3/h
825 kW
133300 m3/h
538800 m3/h
1943 kW
494500 m3/h
44800 m3/h
85800 m3/h
605 kW
63900 m3/h
19100 m3/h
FRESH AIR
AHU
AEF
PREMISES
24 oC
50 %
SA
FA
RA
30250 m3/h
3150 m3/h
OAHU 3
39400 m3/h
170 kW
3150 m3/h
66 kW
FRESH AIR
PREMISES
24 oC
SA
OAHU 4
A B C D E
Figure 2.5: Draft Scheme of the System
Age [years]
Total design capacity of air cooling
[MJ/s]
Annual operating time (describe all relevant facts and characteristics, such as changes in
working conditions, seasonal and other)
Daily operating time (describe):
Air temperature [o C]
Type of regulation

Part III – Toolbox 2:
ENERGY AUDITING IN INDUSTRY 15
Compressed air system
Compressed air system used in a building:
DC 5600 AF0.9
After Filter
65AFlow Adjust
65A
DRY-1DOMNICK AO
15/30 1.0
Pre Filter65A
PQ
DC 5600 AF0.9
After Filter
65AFlow Adjust
65A
DRY-2DOMNICK AO
15/30 1.0
Pre Filter65A
PQ
DC 5600 AF0.9
After Filter
65AFlow Adjust
65A
DRY-3DOMNICK AO
15/30 1.0
Pre Filter65A
PQ
PG
100A
100APG PG
After FilterPre Filter65A
200A
PG PG
After FilterPre Filter65A
200A
PG PG
After FilterPre Filter65A
200A
PG
FQ
PG
After FilterPre Filter65A
200A
PG
After Filter
PCC 1200 AF
0.7Flow Adjust
80A
DRY-5Pre Filter
DOMNICK
40/30/30 0.980A
FQ
50A
50A
FQ
FQ
FQ
200A
200APG
100A
10A
15A
PG
20A
PG
Seperator
Sequence Control
in Control room
Air Tank
WWT.
Auto Tabe
Cleaning R-3
25A
15A
25A
15A
10A
20A
40A
PG
PG
PG
AIR SUPPLY
40A
PG
PG
PG
AIR SUPPLY
40A
PG
PG
PG
AIR SUPPLY
40A
PG
PG
AIR SUPPLY
50A/75A
Ball
Valve
CFU-1
40A
PG
PG
PG
AIR SUPPLY
PG
PG PG PG PG PG PG
Unload
PG PG PG PG PG PG
Unload
150A /100A
150A /100A
100A 100A
50A/75A
100A
15A
75A
15A
75A
15A
75A
100A100A
40A
40A
40A
100A
Figure 2.6: Draft Scheme of the Compressed Air System
Number of compressors:
Total capacity [nm3/min]
Capacity per unit [nm3/min]
Output pressure [kPa]
Total capacity of electric motors [kW]
Unit capacity of electric motors: [KW]
Volume of the tank [m3]
Type of regulation
Air cooling system
Parameters
Working pressure of machinery [kPa]
Entering air temperature [o C]
Daily operating time (system):
Daily operating time (compressors):

Part III – Toolbox 2:
ENERGY AUDITING IN INDUSTRY 16
STEP 3: IDENTIFICATION OF ENERGY CONSERVATION
OPPORTUNITIES (ECOs)
During inspection of the plant, as a part of PEA activities, opportunities for energy conservation have to
be identified. The following checklist should serve as a reminder as to where to look for ECOs.
Based on the ECOs identified, measurement plans will be prepared and measurements executed
during the DEA, in order to evaluate the potential for energy performance improvement by individual
ECOs.
ELECTRICAL SYSTEM – GENERAL
• Use demand limiters where applicable and where cost benefits exceed installed cost without
creation of unacceptable environmental conditions or limitations in manufacturing
production.
• Replace oversized motors and replace old motors with new energy-efficient motors.
• Investigate power factor improvement.
• Use two- or three- speed motors on pumps and fans when reduced flow is desired.
• Improve maintenance for all equipment.
• Reduce lighting levels where this will not reduce manufacturing production or quality or
sales efficiency. Turn off lights when not needed. Replace present lighting with more
efficient lighting sources.
• In manufacturing processes control warm-up time and turn off time.
• Reschedule production or other operations to spread out the electrical load and thus
improve the load factor.
• When possible, modulate a load rather than turning it off and on.
• Install small electric boilers for local requirements rather than operating a complete steam
system.
• In manufacturing plants, install sub metering for manufacturing sections. This has the effect
of making a manufacturing subsection an energy profit centre.
• Use variable-speed drives.
• Installation of electrical-peak-shaving generators.
The largest savings of electrical energy by electrical energy management will come from the basic
principle:
‘WHEN YOU DON'T NEED IT, TURN IT OFF’
AIR CONDITIONING
• Turn off air conditioning in all unoccupied areas.
• Ensure that the air conditioning system is in good working order; keep filters, coils and
blowers clean.
• Use spot coolers when spaces are occupied only at various and irregular times.
• Clean refrigerant condensers to reduce compressor horse power.
• Utilize humidity controlling systems which will allow humidity to rise to the highest
acceptable setting – systems that use re-heat are particularly beneficial.
• Minimize the heat created by lights, machinery or equipment which are left ‘on’ when not
required.
• Leave storm doors and windows in place during the summer to prevent outside heat from
coming in.
• Use water cooled lighting fixtures if possible.
• If the office is completely vacated after normal closing hours, turn off air conditioning at least
one hour before quitting time.

Part III – Toolbox 2:
ENERGY AUDITING IN INDUSTRY 17
• If possible, use heat-producing equipment such as photocopiers in the early morning or late
afternoon.
• Use awnings or shades to reduce heat gain from insulation.
• Urge employees to wear lighter clothing in order to accustom themselves to slightly higher
office or plant temperatures.
• Consider a spraying system or other means of evaporating water on the roof in order to reduce
the air conditioning load.
• Size air handling grills, ducts and coils in order to minimize air resistance.
LIGHTING
• Turn off all unnecessary lights.
• Replace low efficiency light sources with fluorescent, mercury, sodium or high intensity
direct lighting.
• Keep bulbs and fixtures clean and free of light-blocking dirt.
• Remove lights selectively – and ballasts – where lighting levels exceed established standards.
• Reduce or eliminate decorative lighting.
• Install photocells in order to control outdoor or perimeter lighting.
• Utilize direct sunlight as a light source wherever possible.
• Employ a lower wattage of lighting where possible.
• Use light colors on ceilings and walls, floors and furnishings.
• Install timers on lights in little used areas of the plant.
• Use automatic switches in order to ensure that plant lighting is extinguished after the last shift
leaves.
• Provide light switches in office areas so that individual lights may be turned off.
• Place lighting switches in prominent places.
• Move to ‘task lighting’ wherever possible.
• Eliminate inefficient electric lamps from plant stocks and catalogs.
• Consider turning off plant lights during lunch breaks.
INDUSTRIAL BOILERS
• Look to stack gas temperatures as a running indicator of boiler performance.
• Carry out frequent checks of boiler performance.
• If more than one boiler is in use, sequence boiler use in decreasing order of efficiency.
• Keep as many boilers as possible operating near full load (rather than having a greater number
operating at partial capacity).
• Keep all heat transfer surfaces clean.
• Improve boiler control systems.
• Reduce ‘excess air’ in order to increase boiler efficiency.
• Look to waste heat boilers and/or economizers in order to utilize hot stack gases.
• Utilize boiler blow-down as flash steam or in a blow-down heat exchanger in order to preheat
make-up water.
• Reduce blow-down through feed-water control.
STEAM
• Fully insulate all steam and condensate lines, and process equipment.
• Cover and insulate condensate tanks.
• Repair or replace faulty steam traps.
• Repair all other sources of steam leakage including flanges and high pressure reducing
stations.
• Maintain steam jets used for vacuum system.
• Ensure that boilers are operating at peak efficiency.

Part III – Toolbox 2:
ENERGY AUDITING IN INDUSTRY 18
• Keep boiler tube surfaces clean.
• Return condensate to boiler – or use pre-softened cooling water from compressors, etc. as
feed-water – in order to minimize both blow-down and overall energy and water
consumption.
• Monitor boiler blow-down chemical analysis.
• Recapture blow-down energy using heat exchangers or flash tanks.
• Use air heaters and/or economizers to recover heat from boiler flue gases.
• Minimize the distance that steam must travel by re-arranging process equipment and
eliminating straggling steam laterals.
• Use insulation valves to split up the steam distribution system.
• Operate steam-heated processes at the lowest permissible temperature.
• Lower steam pressures wherever possible.
• Use steam traps and/or balance pressure air vents in order to eliminate air films in steam lines.
• Put flash steam to work in lower pressure applications.
• Where clean condensate cannot be returned to the boiler, use it for washing or other
processes.
• Turn off steam tracing during mild weather.
• Look to glycol tracing systems to replace steam.
• Consider replacing electric motors with back pressure steam turbines and use exhaust steam
for process heat.
• Operate distillation columns at minimum quality requirements.
• Operate distillation columns at near flooding conditions for maximum separation efficiency.
• Determine correct feed plate location on distillation columns in order to increase efficiency
and minimize steam consumption.
• Consider switching selected steam stripping distillation units from direct (live) steam to
indirect (dry) stripping.
• Use steam traps of a correct size.
• Evaluate replacing condensing steam turbine rotating equipment drives with electric motors,
if your plant has a power generating capability.
• Add traps to distillation column in order to reduce the reflux ratio.
• Minimize boiler blow-down with better feed-water treatment.
• Use waste heat low pressure steam for absorption refrigeration.
• Replace barometric condensers with surface condensers.
• Shut off steam traps on superheated steam lines when not in use.
• Optimize the operation of multi-stage vacuum steam jets.
• Use insulation of optimum thickness.
• Use reflux ratio control or similar control instead of flow control on distillation towers.
• Substitute hot process fluids for steam.
FURNACES, KILNS AND OVENS
• Calculate and plot boiler efficiency daily.
• Establish a definite burner maintenance schedule.
• Adjust burners regularly for the most efficient operation.
• Heat oil to a proper temperature for good atomization.
• Eliminate combustible gas in flue gas.
• Reduce combustion air flow to an optimum level.
• Replace obsolete burners with more efficient ones.
• Use waste and by-products as fuel wherever possible.
• Limit and control secondary combustion air in furnace operations.
• Calculate a ‘heat balance’ for all combustion equipment in order to better understand where
energy is dissipated or used.
• Utilize hot stack gases as an energy source.
• Insulate furnaces, kilns and ovens in order to minimize heat loss.

Part III – Toolbox 2:
ENERGY AUDITING IN INDUSTRY 19
• Control infiltration of cold air into furnaces.
• Shut down idle combustion whenever possible.
• Consider cam controllers or other systems in order to control the shut down cycle on
combustion equipment.
• Schedule plant operations for ‘full load’ operations on combustion equipment.
• Minimize energy loss during loading and unloading (cycling).
• Eliminate ‘over-design’ in equipment and practices.
• Analyze flue gases regularly.
• Look into using automatically controlled flue dampers.
COMPRESSED AIR
• Make an optimized selection of a central compressor versus a number of smaller zone
compressors.
• Choose the compressor with the highest efficiency.
• Select an air intake location that provides dry, clean air.
• Maintain compressor driving belts, and all other critical parts.
• Ensure that water cooling ducts are not blocked.
• Use larger or extra receivers on existing compressors.
• Investigate automatic control systems.
• Provide basic instrumentation in order to gauge system efficiency.
• Repair all line leaks promptly as part of a regular maintenance program.
• Use long radius bend and welded joints wherever possible in piping.
• Incorporate strainers and lubricators in each air-operated device.
• Maintain air operated equipment regularly as well as ‘conditioning units’ – filters, pressure
regulators and lubricators.
• Do not operate equipment above the manufacturer's recommended operating pressure.
• Reduce air pressure to the lowest feasible level.
• Consider using double acting air cylinders.
• Use hot air from remote receiver tanks close to cylical loads.
• Use hot air from air cooled compressors for space heating wherever economically available.
• Cooling water from water cooled compressors has many potential uses within the plant.

Part III – Toolbox 2:
ENERGY AUDITING IN INDUSTRY 20
STEP 4: DETAILED ENERGY AUDIT (DEA)
A detailed energy audit aims at establishing actual energy performance of selected end-users and
processes. Based on identified of energy conservation opportunities during the preliminary audit.
At the heart of a DEA is a specific metering campaign which usually takes a week or two
according to a carefully prepared measurement plan (see Examples 1 and 2 below). The measuring
results are analyzed in order to establish energy balances, specify performance improvement measures
(Step 4.1) and carry out an economic and financial analysis of performance improvement projects
(Fig. 2.7)
Figure 2.7: Flow Chart of Detailed Energy Audit (DEA)
The Economic and Financial Evaluation of energy performance improvement measures includes
cost-benefit analysis, calculation of economic and financial internal rates of return (EIRR and FIRR)
and a discounted cash flow analysis. It is described in Toolbox III-3 and includes a spreadsheet
program (Software No. 3, Toolbox III-3), for carrying out such calculations.
The audit results have to be summarized in a report, together with an action plan containing the
priorities for the implementation of performance improvement projects, as specified in Step 4.2.

Part III – Toolbox 2:
ENERGY AUDITING IN INDUSTRY 21
Example 1: Preparing the measurement plan for a steam boiler
M1 Combustion air:
- Temperature, tFA [oC]
- Relative humidity, RHFA [%]
M2 Fuel consumption:
- Fuel flow rate, mF [l/h, t/h, nm3/h ….]
- Temperature, tF [oC]
M3 Steam (saturated):
- Pressure, pS [bar]
M4 Feed water:
- Mass flow rate of feed water, mFW [t/h]
- Temperature, tFW [oC]
- Conductivity, CondFW, [µS/cm]
M5 Flue gas:
- Flue gas temperature, tFG [oC]
- Oxygen content, O2 [%]
- CO content, CO [ppm]
M6 Blow-down:
- Mass flow rate of blow-down water, mBD,
[t/h]
M7 Boiler water:
- Conductivity, CondBW, [µS/cm]
Example 2: Preparing measurement plan for a a Sterilization Process (Retorts)
M1 Mass flow rate versus time kg/h
Temperature oC
Pressure Bar
Duration min
M2 Mass flow rate of water versus
time
kg/h
Temperature oC
M3 Mass flow rate f condensate kg/h
Temperature oC
M4 Mass flow rate of water kg/h
Temperature versus time oC
M5 Mass of product in kg
Temperature oC
M6 Temperature oC

Part III – Toolbox 2:
ENERGY AUDITING IN INDUSTRY 22
STEP 4.1: SPECIFICATION OF ENERGY
CONSERVATION MEASURES
All of the measures or performance improvement projects have to be specified to the level of a
conceptual engineering design (see the example below).
Project:
CHP
ECM #2:
Gas Engine Installation
Scheme and position of NEW PLANT
Investment specification: Design and installation 25 000
Supervision 12 500
EQUIPMENT
Gas engine and generator
(electrical output 1,819 kWe) 1 000 000
Absorption chiller
Capacity 861 kWR; hot water 88/83 oC 327 500
Heat exchanger for engine cooling
(767 kWH) 45 000
Heat exchanger for flue gases (1148 kWH) 70 000
Transformer 0.4/20 kV 62 500
Cooling tower 20 000
LOCATION PREPARATION
Site preparation 5000
Adoption the existing installation 12 500
Gas connection installation 7500
MISCELLANEOUS
10 % of equipment cost 152 500
TOTAL: 1 740 000 $US
Energy cost reduction:
0.2487 m$US/y
Simple pay back period:
7 years
Reduction in co2 emission:
31.1 %

Part III – Toolbox 2:
ENERGY AUDITING IN INDUSTRY 23
STEP 4.2: PREPARATION AND PRESENTATION OF DEA
REPORT AND ACTION PLANS
1. Recommended chapters for DEA report
• Executive summary
• General data on factory and processes
• Observations and comments on operational, housekeeping and maintenance practice
• Current level of production and energy consumption and energy balances
• Specifications of identified energy performance improvement measures
• Expected values of energy cost savings
• Investment analysis:
– Economic aspects: Payback period and EIRR
– Financial aspects: Cash flow and FIRR
• Quantitative target for improving energy performance
• Implementation plan for achieving the set targets
• Technical details and specifications must be attached
2. Approach to preparing an energy action plan
The order of consideration of energy conservation measures: i. Improvement of maintenance practices,
ii. Improvement of operation practices,
iii. Improvement of equipment efficiency,
iv. Improvement of process efficiency.
The order of priority for the implementation of energy conservation measures: i. Introduction of systematic energy management practices (including awareness,
training and motivation programs)
ii. Improvement of energy metering, control and monitoring (provide data for continuing
improvement of efficiency)
iii. Improved housekeeping and maintenance
iv. Implementation of energy performance improvement projects with a short payback
period
3. Selling of energy action plan to management
i. Organize the session as a formal presentation to be attended by general, technical,
production, financial and maintenance managers
ii. Establish the relevance of energy costs
iii. Explain the opportunities for cost reduction
iv. Avoid technical jargon and detail
v. Provide comparisons or benchmarks within the industry group
vi. Provide a time scale in order to achieve results
vii. Provide targets for the coming years
viii. Specify investment requirements