too fast, too soon? the rise of the chinese wind turbine
TRANSCRIPT
1
Too Fast, Too Soon? The Rise of the Chinese Wind
Turbine Manufacturing Industry
Long Lam1, Lee Branstetter
2, Inês L. Azevedo
3
Working Paper
June 20, 2014
1 Doctoral student, Department of Engineering and Public Policy, Carnegie Mellon
University, email: [email protected]
2 Professor, Heinz College and Department of Social and Decision Sciences, Carnegie
Mellon University, Peterson Institute for International Economics, and NBER, email:
3 Associate Professor, Department of Engineering and Public Policy, Carnegie Mellon
University, 5000 Forbes Avenue, Pittsburgh PA 15213; email: [email protected]
Acknowledgements: We acknowledge with gratitude the financial support of Fundação
para a Ciência e a Tecnologia (Portuguese Foundation for Science and Technology), the
Carnegie Mellon Portugal Program, CMU’s Scott Energy Institute, The Climate and
Energy Decision Making Center (CEDM), and the Carnegie Mellon Electricity Industry
Center (CEIC). We thank the American Wind Energy Association, Nico Doranov, Matej
Drev, Guangwei Li, and Prof. Sally Xu (Peking University) for valuable insight and
assistance with the data and empirical methods used in this study. We thank Granger
Morgan and conference participants at the NBER, CMU, and ISA for valuable comments.

2
Abstract: China has emerged as the world's largest carbon emitter by an increasingly
large margin, and the worryingly high levels of pollution in its major cities have drawn
global attention. A growing stream of research, which has received favorable attention in
the mainstream media, stresses that China is also an increasingly important source of
innovation in clean energy technology. The comforting message stressed by this
countervailing research stream is that China-generated innovation can cure China-
generated environmental externalities, and proponents cite the growing global dominance
of Chinese firms in wind and solar power hardware as proof of their assertions.
We investigate these claims made on behalf of China's wind turbine
manufacturing industry. Although various studies in the received literature attest to the
growing innovative capability of the Chinese wind turbine manufacturing industry (Ru et
al., 2012), a careful examination of market data and patent data from the PATSTAT
undermines some of these claims. We map out the growth of the Chinese wind turbine
industry and point to the government policy initiatives that have been important in
promoting that growth. We assess the patenting activity for the wind industry by country
in terms of patent counts, then we undertake a citation function analysis of global
patenting in technologies related to wind turbine manufacturing, showing that, even at the
global level, invention in this domain may have been incremental in nature. Nevertheless,
Chinese firms have received almost no international patents protecting their "inventions."
Given the strong and clear incentives these firms face to protect innovations in large
markets such as Europe or the U.S., it is hard to resist the conclusion that Chinese
enterprises have simply not come up with any new product or process technology worth
patenting outside their home country.
Chinese firms have managed to push the costs of existing technology to low
levels -- a factor that undergirds their modest but growing exports to the rest of the world.
However, even this achievement may not be fully sustainable. A wave of industry
consolidation in China suggests that some of the recent steps of its producers down the
"learning curve" required widespread pricing below marginal cost. We do not believe the
current period of consolidation will end in the death of the Chinese industry -- to the
contrary, we believe that leading China-based indigenous producers are likely to remain
important global players for the foreseeable future. Nevertheless, further progress in
terms of cost reductions may slow substantially relative to the recent past.

3
1. Introduction: The Rapid Rise of China's Wind Energy Industry
China's geography provides it with significant wind resources. These are
especially concentrated in the country's northern and northeastern regions (See Figure 1
and Figure 2). Given the scale of China's wind resources and the environmental, health,
and climate change costs associated with conventional (mostly coal-fired) electric power
generation, a significantly greater reliance on wind energy can be easily defended. Recent
advances in wind power engineering, pioneered by Western firms, also hold out that
promise that such a shift could be accomplished at a reasonable economic cost1. China
has embraced a much greater role for wind energy with impressive speed. From a country
with virtually no wind power capacity, China has pushed itself to the global forefront in
less than a decade. China’s cumulative installed capacity in 2001 measured only a little
over 400 MW; by 2010, it had surged to 44.7 GW, allowing China to surpass the U.S. as
the country with most installed wind capacity (GWEC, 2012). Through 2008, China
experienced an annual wind installation growth rate of at least 60% (CWEA, 2012). From
2009 to 2010, the growth rate slowed down to a still impressive level of 37%. (See
Figure 3).
Over the same period, we have also observed tremendous growth in China's
indigenous wind turbine manufacturing industry. Within China, Sino-foreign joint
ventures and indigenous domestic enterprises commanded only 17% of the national
market as recently as 2004. By 2010, these Chinese firms dominated the local market,
claiming a cumulative 90% market share (See Figure 4). Today, four of the top ten
global turbine manufacturers (Goldwind, Sinovel, United Power and Mingyang) are
based in China (BTM Consult, 2013)2. As our paper will show, the expansion of total
capacity and the rise of the domestic producers are not just temporally coincident -- by
engaging in the world's largest program of wind farm construction and by limiting those
farms to domestically produced components, the Chinese authorities effectively
incubated a globally significant set of domestic producers.
However, the growth of installed capacity has clearly outstripped the ability or
willingness of the national grid to absorb wind energy, at least in the short run.
Curtailment issues, or problems associated with wind sector management and grid
connections, can render turbines inoperable for periods of time. While there is a lack of
publicly available and reliable data, the curtailment rate in China is believed to be
somewhere between more than 10% in Jilin, Hebei and more than 20% in Gansu, western
and eastern Inner Mongolia and (GTM Research) (See Figure 2 for the geographical
location of the provinces).3 The problem has worsened in recent years. At the national
level, about 17% of wind-generated electricity was curtailed in 2011, and the figure rose
1 This would be especially true if China imposed a price on carbon emissions. Senior policymakers have embraced this
as a long-run goal, but it has not yet been enacted in China.
2 Goldwind, in particular, has been the subject of some favorable international press. In a widely read 2009 article, The
New Yorker's Evan Osnos portrayed Goldwind as an innovative, hard-charging enterprise with a Silicon Valley-like
culture.
3 Corroboration is difficult, but similar figures were cited by Greenpeace (2012).
4
to about 20% in 20124. Grid connection, while improving, still remains a problem. By the
end of 2012, only 61 GW of the 76 GW of installed capacity, or 80%, was connected to
the grid, compared to 70% in 2010 (NEA, 2013; Greenpeace, 2012). By comparison, in
the U.S. the level of grid connection is generally very close to 100%, and 2012
curtailment rates in regions wherever data are publicly available are typically less than
5% (Wiser, 2012). As a consequence, the U.S. still generates more electric power from
wind than China does, despite having been handily overtaken by China in terms of
installed capacity! The continuing lack of grid connection and the high curtailment rates
mean that the Chinese taxpayer, the Chinese ratepayer, and the Chinese investor have
paid for capacity that is not yet lowering Chinese carbon intensity or providing needed
green energy to Chinese cities.
Over the past few years, evidence of overexpansion and overcapacity in China's
indigenous wind turbine manufacturing industry has grown. Recent industry data suggest
that the majority of producers active in the industry in 2010 have since ceased production
(GWEC, 2012). As growth in supply exceeded demand, even the top publicly traded
Chinese producers saw their stock prices plummet by as much as 90% at the nadir of the
demand cycle. Today, in the wake of substantial industry consolidation and improving
market conditions for the surviving firms, the industry leaders' equity prices continue to
trade at a significant discount. And even though market forecasters predict an
improvement in the fortunes of some leading firms, this does not extend to all the current
market leaders.
Some strands in the existing literature contend that the remarkable growth of
China’s wind power industry began with successful imitation, then shifted to
"cooperative innovation" through joint ventures with international firms, and has been
more recently sustained by indigenous innovation (see Ru et al., 2012, or Gosens and Lu,
2013). Similarly, some point to the increasing average size of domestic wind turbines
(Lewis, 2012) and the increasing number of turbine models independently developed by
domestic Chinese enterprises (Wang et al., 2012) as evidence of progress in innovation
made by China’s wind power industry. The sharp price declines of Chinese equipment
are also attributed to cost-reducing innovation. Summing up the total number of wind
turbine patents issued by patent offices around the world, Bettencourt et al. (2013)
conclude that China’s wind power industry is marked by fast innovation as indicated by
the high number of wind turbine patents granted to indigenous producers by the Chinese
patenting office. However, as we show in our analysis, domestic patent counts may
provide a potentially misleading picture of the pace and extent of Chinese wind
innovation.
Using international patent data, we undertake an analysis of international
innovation trends in technologies related to wind turbine manufacturing. Our results
indicate that patented inventions in this domain has become steadily more incremental.
Wind turbine technology is a domain where most key components and ideas are
relatively mature, so, in principle, this is the kind of technical domain in which China-
based manufacturers could conceivably participate in the global innovation process by
4 These percentages come from authors' calculations based on (Qi, 2013) and National Energy Administration (2013).

5
introducing discrete, well-defined product and process innovations that could be
implemented outside China by other firms. However, further analysis suggests that the
contribution of Chinese firms to the advance of the global technological state of the art
has been limited to date. China's indigenous wind power manufacturers appear to have
produced virtually no new technology worth patenting in the major markets outside
China.
Nahm and Steinfeld (2013) and others in the literature stress dimensions of
"innovation" that are not well reflected in patent data, and introduce the concept of
"innovative manufacturing." These authors suggest that the rapid emergence of very large
scale manufacturing capabilities in China across a broad spectrum of products,
components, and systems has led to the development within Chinese enterprises of a
novel ability to redesign or modify products in ways that dramatically lower production
costs. Such activity may be limited in terms of its scientific or engineering novelty or
sophistication (and would therefore generate few patents), but may nevertheless
contribute to global welfare by generating lasting, significant reductions in the cost of
alternative energy hardware. The dramatic price reductions undertaken by Chinese wind
turbine manufacturers would seem to point to impressive innovative manufacturing
capabilities.
However, the financial difficulties of the Chinese industry since 2011 point to an
alternative view: a large component of the recent price declines others have fully
attributed to "innovative manufacturing" capabilities was instead driven by overcapacity,
negative margins throughout the supply chain, and/or favorable factor and input prices
that may be unsustainable in the longer run. Financial analysts covering the Chinese
industry contend that equipment prices will need to rise and remain at levels above recent
lows in order for the leading firms to return to financial health and earn rates of return in
excess of the shadow cost of capital. The ability of indigenous manufacturers to continue
to deliver substantial cost declines may have its limits.
The rest of the paper is organized as follows. Section 2 provides a description of
the patent citation functions we estimate to describe global innovation trends in wind
turbine technology. Section 3 explores trends in international patenting in these
technologies, and reports the results of our patent citation function estimation. Section 4
describes the policy measures employed by the Chinese government to expand installed
wind power capacity and indigenous production of wind turbines. Section 5 surveys the
substantial downturn in financial health of the Chinese industry in recent years, as well as
the modest recovery seemingly underway in 2013-2014. Section 6 concludes.
2. Measuring Innovation in Wind Power: Patent Counts, Citation Counts and
Citation Functions
Mainstream economic research has been using patents as a measure of innovation
since the early 1960s. Different patent analysis methods have been utilized, each with its
advantages and disadvantages (Jaffe and Trajtenberg, 2002). Simple patent counts can be
misleading, since the value distribution of patents has been shown to be highly skewed
(Harhoff et al., 2002). Patent citation analysis, which examines the number of times each
patent has been cited by subsequent patents, has been used to measure patent quality
6
(Trajtenberg, 1990) as well knowledge flows and spillovers (Jaffe et al., 1993). The
citation flows to a particular patent tend to follow a double exponential shape over time,
first rising, and then falling. This shape appears to reflect the dual impact of diffusion and
obsolescence. Compared to a patent issued at a later date, an older patent has been around
longer, such that subsequent innovators have time to become aware of it and incorporate
the ideas embodied in it into their own innovations. As more time elapses, this diffusion
process makes the patent more likely to be cited. On the other hand, an older patent may
protect a technology that is no longer as relevant in its field, i.e., it becomes obsolete.
This knowledge obsolescence has the opposite effect, tending to reduce the likelihood
that a particular patent will be cited over time. Caballero and Jaffe (1993) developed a
statistical framework that takes diffusion, obsolescence, and technology field
characteristics into account, and their citation function has since been widely used in
innovation studies (Jaffe and Trajtenberg, 2002). Popp (2002) was the first to apply
citation functions to the analyses of innovation in energy technologies. In our analysis
below, we employ a variant of this technique.
Firms who wish to use the patent system to protect their invention first file a
patent application, also known as “priority application”, with the patent office in their
home jurisdiction. Under international patent rules, firms then have up to one year to
choose to apply for patent protection abroad for the same invention, where the filing date
on the foreign application is the same date as the one on their initial (usually) domestic
application. To evaluate the merit of the patent application, a patent office normally
conducts an international search report of prior art. This search report helps the patent
office assess the patentability of an invention as well as the legitimacy of the claims made
by the inventors. Upon filing an application in the United States, inventors have a legal
observation to make "appropriate citations to the prior art" on which they build. During
the evaluation process, patent examiners, who are experts in their respective
technological fields, may modify the list of citations5. The citations serve as legal
boundaries, limiting the scope of the property rights eventually awarded to the patent
applicant. The inventors thus have an incentive to both limit unnecessary cited patents
and to cite all relevant patents, placing them outside the realm of the current patent
(OECD, 2009). In major patent jurisdictions outside the United States, inventors are not
required to include citations to the prior art in their initial application, but examiners add
these citations to the document, thus circumscribing the range of intellectual property that
can be protected by a successful application in the same manner.
In this paper we need not assume that citations always necessarily indicate a flow
of knowledge from cited to citing inventions. What we require instead is that examiners
generally fulfill their legal obligation to link current applications to the important prior
inventions on which they build. As a result, patents with a high number of citations
signify their high usefulness and value. We follow the model used by Caballero and Jaffe
(1993) and Jaffe and Trajtenberg (1996) to estimate the likelihood (or “citation frequency
function”, as denoted by Jaffe) that a particular patent will be cited by subsequent patents
as a function of the time elapsed between the two patents as well as the characteristics of
the citing and cited patents.
5 EPO patent examiners assign citations to patents, though applicants can optionally add their own.

7
The probability that any particular patent in group K granted in year T will cite
some particular patent in group k granted in year t is assumed to be determined by the
attributes of the two groups of patents, and the combination of exponential
processes that capture knowledge diffusion and knowledge obsolescence effects (Jaffe
and Trajtenberg, 1996). The functional form of the citation function is given by:
(1)
where represents the rate at which knowledge becomes obsolete and the rate at
which knowledge diffuses.
The coefficient α corresponds to categorical variables associated with the salient
characteristics of the citing patent group K and the cited patent group k. In previous
applications of the citation function, researchers have considered attributes such as the
technology fields of the citing and cited patents, the grant years of the citing patents, and
the grant years of the cited patents. This paper only examines technologies related to
wind energy, so there is no need to include technology field dummies6. Instead, we will
focus on the coefficients associated with cited and citing grant year dummy variables,
The former set of coefficients measures the relative technological usefulness of different
patent cohorts, as reflected by the propensity for later generations of inventors to cite
them in patent documents. To limit the number of coefficients that must be estimated, we
aggregate potentially citing patents and potentially cited patents into 2-year cohorts.
The expected number of citations that a wind patent granted in year t will receive
from another wind patent granted in year T is the likelihood function in equation (1)
multiplied by the number of potential citing patents in group K and the number of
potentially cited patents in group k. To estimate the parameters of the citation function,
we aggregate our patents into cells corresponding to the characteristics of the cited and
citing patents, and take, as our dependent variable, the number of citations made by
patents in cell K to patents in cell k. This yields:
(2)
Combining Equation (1) and (2) yields:
(3)
All parameters are estimated by a nonlinear least squares estimator:
(4)
The α parameters in the model are fixed effects measured relative to a specified base
group. To adjust for heteroskedasticity problems associated with grouped data
6 Different types of wind turbine technologies may be included for the citation function analysis, but increasing the
number of estimated parameters makes the estimator more difficult to converge.
8
(Wooldridge, 2005), the observations are weighted as follows:
(5)
where is the total number of potentially cited patents granted in year t and is the
number of potentially citing patents granted in year T.
The patent data used in this citations function analysis comes from the European
Patent Office Worldwide Patent Statistical Database (PATSTAT). This database
consolidates all the patents that inventors file in all patent offices around the world. We
used data on patent applications, in all patent offices, from 1980 through October 2012,
and then restricted the analysis to those patents eventually granted by the patent offices of
China, the fifteen major patent jurisdictions within the EU, Japan, South Korea, Russia,
Canada, and the U.S. These are the regions with the most activity in wind turbine
invention, manufacturing, and deployment.
To identify the relevant patents, we rely on a combination query method that finds
wind energy patents by combining patents assigned to "wind energy" in the PATSTAT
database with those that are clearly connected to wind energy based on a keyword search
of the patent abstract. Similar to Johnstone et al. (2009), we use the “F03D” classification
as an indicator of a wind power patent. We then append this dataset with results from a
scan of the PATSTAT patent abstracts using a query similar to Nemet (2009) for wind
power keywords in English7, French
8, German
9 and Spanish
10. The patent’s “nationality”
is determined by the geographic location of the inventor. If the inventor information is
missing, we use the applicant’s location instead.
3. Patents and Innovation in Wind Energy – Global Trends and Chinese Activity
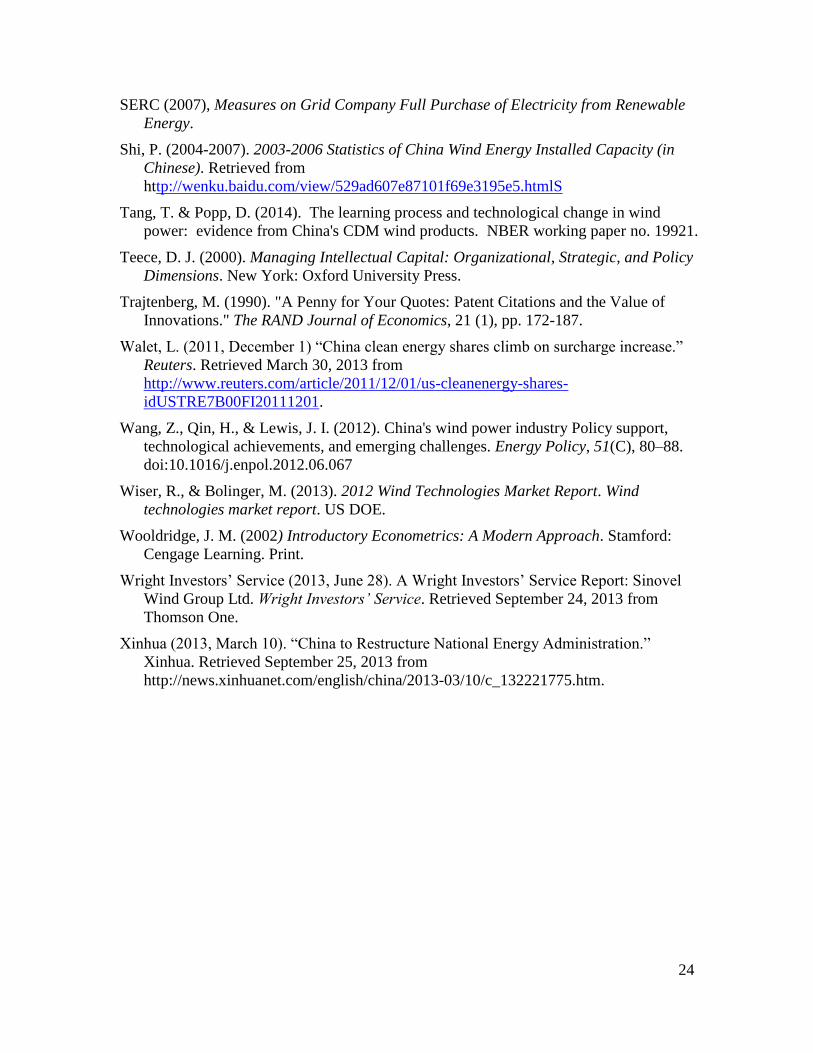
Before implementing our patent citation analysis, we begin by examining the
number of wind power patents in the PATSTAT database published by patenting offices
from China, the European Patenting Office (EPO), the EU15 nations, Japan, South Korea,
Russia, Canada, and the United States. Figure 5 and Figure 6 show the total number of
patents taken out by inventors based in the above-mentioned countries. Patenting
activities accelerated in the early 1980s and again in the 2000s, as seen by the two peaks
in these periods, which correspond to periods of renewed interests in wind power. The
most recent burst of inventive activities began in the late 1990s. At this point, a number
of European countries accelerated their efforts to curb carbon emissions. The universal
7 ABST/((“wind power” OR (wind AND turbine) OR windmill) OR (wind AND (rotor OR blade$ OR generat$) AND
(electric$)))
8 ABST/((“windkraftanlage” OR (wind AND turbine) OR windmühle) OR (wind AND (rotor OR blatt$ OR generat$)
AND (elektri$)))
9 ABST/((“Ènergie Èolienne” OR (Èolienne AND turbine) OR moulin a vent) OR (Èolienne AND (rotor OR pale$ OR
generat$) AND (Èlectri$)))
10 ABST/((“ aerogenerador” OR (eolic AND turbin) OR molino de viento') OR (eolic AND (rotor OR pala$ OR
genera$) AND (electric$)))

9
ratification of the Kyoto Protocol by Western Europe's industrial states sent a clear signal
to the industry (Dechezlepretre, 2009).
The large number of patents granted within China’s jurisdiction, a significant
portion of which is assigned to domestic firms, suggests that China has started to emerge
as an important source of innovations in wind turbine technology. However, since patents
are not created equal, we identify impactful patents through patent citation analysis,
where we use the patents granted by the national patent offices of China, the EU15
nations, Japan, South Korea, Taiwan, and the U.S as the sample of potentially cited
patents and all patents evaluated by the EPO, the World Intellectual Property
Organization, or the U.S. Patent and Trademark Office as the set of citing patents. Results
of our citation function estimation are shown in Table 2. Results obtained from
estimating our citations functions using only U.S. patents are shown in Table 3. For
brevity's sake, we report only the coefficients on the cited patent grant cohorts. These
coefficients measure the relative "citedness" of subsequent cohorts of patents, relative to
a base category (in this case, patents granted in 1980-1981). As such, the coefficients
provide an indication of the relative impact of successive cohorts of patents on
subsequent invention. As our interest is focused on the more recent patenting surge, we
define the cohorts of potentially citing patents to be those granted in the 1990s and 2000s,
but we allow the set of potentially cited patents to include all those granted since 1980.
The reported results in Table 2 and Table 3 indicate that the likelihood of a wind
turbine patent being cited by subsequent patents decreases over time, a trend that has also
been documented in other technological domains (Jaffe & Trajtenberg, 1996; Arora et al.,
2013). For example, Table 2 shows that the 1990-91 cohort is about 80% less likely to be
cited than the base cohort. Viewing all the cohort fixed effects, we see an almost
monotonic decline in measured patent quality, with the most recent patent cohorts -- the
ones associated with the global patent boom in wind turbine technology -- showing a
decline in quality of more than 90% relative to the base category. The trend is similar
when we use only data from the USPTO (Table 3).
These results place the recent global surge of wind turbine patents in perspective.
A simple count of global patent activity might lead the observer to believe that we are in
a golden age of wind turbine innovation. However, if recent invention were as impactful
as the inventions of the past, we would not observe a sharp drop off in the "citedness" of
more recent patent cohorts. Since citation analysis points to this kind of decline, it
suggests that as the numbers of patents in wind turbine technology has risen, their
technological content has declined in value. At a global level, we have far more patents,
but, on average, they represent much more incremental inventions.11
Long time series on the levelized cost of wind-generated electricity in multiple
countries (net of financial incentives) trace out a picture that is quite consistent with that
drawn by our patent citation analysis. Figure 10 plots results from several well-regarded
engineering studies that measure technological progress in wind turbine technology
through the decline of wind-generated electricity prices, holding multiple factors constant
11 Popp (2002) documents a similar decline in the measured quality of invention, using a broader patent sample drawn
from multiple "green" technologies.

10
across several decades. These studies suggest that the significant price declines recorded
through the 1990s had faded by the early 2000s. The recent surge in patenting is not
associated with any further decline in levelized costs. If citation analysis is missing the
advent of transformative technologies, why does their impact not show up in the cost
data?
Levelized costs and the citation function analysis seem to indicate a substantial
degree of technological maturity in wind turbines. Indeed, even the major innovations of
the 1990s largely consisted of importing into the wind turbine sector materials and
automated control systems developed for other industries. If the pace of technological
advance in the wind turbine manufacturing sector is fairly gradual, and if innovation is
incremental, then this could play to China’s advantage. Wind power would be the sort of
technical domain in which emerging manufacturers in a "latecomer country," such as
China, could begin to innovate successfully at the global level because it does not
necessarily require a deep base of expertise in frontier science. So far, though, we see no
signs in the international patent data supporting this view.
Compared to China’s Patent Office, the patent examination process undertaken by
the EPO and its member states is more mature and robust12
. When we restrict our sample
to only those patents eventually granted by an EPO member state, the total number of
patents drops substantially. Of these, inventors with German addresses were awarded the
most patents, followed by Danish and American inventors. Inventors typically file for
patents at the patent offices of their home country first, and only apply to the EPO to
extend protection to some or all of the 28 member countries states. Because the EPO’s
patent application process can be costly, the EPO data filter out low-value inventions
(Johnstone et al., 2009), explaining the smaller number of patents granted by the EPO
member states. Over our sample period, only two patents have been granted by EPO
member states to Chinese inventors,13
and neither of these have gone to one of China's
leading wind turbine manufacturers (See Figure 7). Time series trends in patenting at the
national level are provided in Figure 8. The recent uptick in patenting activity is clearly
evident, and the final years of the data sample are ones in which Chinese firms have
displaced foreign rivals in their home market. Despite the growth in Chinese production
and the inception of Chinese exports of wind power equipment to other major markets,
we see essentially no patents granted to indigenous Chinese firms outside of their home
market. There is a global patenting surge in this domain, but China's indigenous
producers are not participating in it.
Could Chinese firms be creating useful new-to-the-world product innovations but
not patenting them outside their home country? This would seem to defy economic logic.
At current exchange rates, both the U.S. and the EU remain much larger economies than
China, and they will retain that status for years to come. Unless Chinese firms patent their
inventions in these jurisdictions, they have no way of preventing other inventors from
infringing on their intellectual property rights. Chinese firms in other sectors have, in
recent years, become increasingly aggressive about patenting inventions outside China --
12 Prior to 2009 Chinese patent examiners limited their search reports to domestic prior arts only (Cass, 2009).
13 China’s State Intellectual Property Office granted 934 patents in the F03D classification to Chinese applicants over
the same time period. (SIPO, 2012)

11
the total number of patents taken out in the U.S or the E.U. by China indigenous
enterprises across all sectors now easily exceeds one thousand per year (Branstetter et al.,
2013). It is hard to interpret the lack of international patents on the part of China's
indigenous wind turbine manufacturers as signifying anything other than their lack of any
innovation sufficiently novel to merit patenting outside China.
What about the growing numbers of domestic patents taken out by Chinese wind
turbine manufacturers? Are these not evidence of Chinese innovative dynamism? Lei et
al. (2012) have examined the recent surge in Chinese domestic patenting across a broad
swath of technologies, finding that government support, at various levels, for increased
domestic patent applications explains part of the surge. Similarly, Li (2012) shows that
subsidy programs at the provincial level are partly responsible for the increased rate of
domestic patenting activity. Chinese companies are taking out local patents because they
are paid to do so. What is also true is that China's evolving legal system still has
difficulty distinguishing between patents that protect real innovation and patents that
merely pretend to protect real innovation. This provides local firms with large portfolios
of "junk" patents potential legal leverage over rivals.14
If these patents represented
economically valuable inventions, then Chinese manufacturers who are increasingly
seeking to export their products outside of China would have a strong incentive to patent
at least their most valuable inventions outside of China. The fact that they have not done
so suggests that Chinese firms themselves may regard their "inventions" as not worth the
time and expense of patenting outside China. We find no record of Goldwind, Guodian
United Power, or Mingyang even applying for patent protection in EPO member states.
Sinovel has, very recently, submitted some 21 patent applications to the EPO, but, of
these, 11 were subsequently withdrawn by Sinovel and 4 were deemed to be withdrawn
by the EPO, suggesting a judgment by Sinovel that these applications were not
sufficiently novel to merit a patent grant. Sinovel has only requested an examination for
6 of its applications, and none have yet secured patent grants in an EPO member state.
Chinese wind turbine producers may not be generating patented product or
process innovations, but they have dramatically ramped up their wind turbine
manufacturing capabilities in a relatively short period of time. Tang and Popp (2014),
Lewis (2013), Nahm and Steinfeld (2013), Qiu and Anadon (2012), and Wang, Qin, and
Lewis (2012) examine this rapid acquisition of manufacturing capabilities from a range
of perspectives. There is little question that this represents a substantial technological
achievement. Chinese enterprises can now manufacture a full spectrum of wind turbine
products, including the largest and most challenging. The best Chinese firms achieve
reasonably high levels of quality, and continue to price their products at levels well below
those of the major Western manufacturers. Clearly, Western technology has been
successfully absorbed and effectively applied in a context where low factor and input
prices enable cost-effective manufacturing on a large scale.
But can we call this innovation in the usual sense of the word? To the extent that
the global state of the art is not advanced by the development of new products and/or
14 The largest number of intellectual property lawsuits anywhere in the world occurs with Chinese firms suing each
other for intellectual property infringement.

12
processes that could be applied outside of China, we would suggest that this process is
better characterized as technology transfer or technology absorption, rather than
innovation. Some scholars have examined the sustained decline in product prices in the
Chinese wind turbine industry and have interpreted this as prima facie evidence of
dynamic "cost innovation" -- intentional, cumulative refinement of the manufacturing
process, coupled with small changes in the product itself. These changes are individually
too minor to merit a patent but, collectively, result in steady, sustained, significant cost
reductions. However, sustained price reductions could also emerge from a process of
gradual absorption of Western best practice and its application in a context where factor
and input prices are lower than in those Western locations where the technology was
originally invented. Prices and costs could fall even in the absence of a meaningful
capability on the part of Chinese firms to refine, improve, and change production
processes in significant ways. Even without innovation, this process generates economic
value by creating a low-cost center of production -- a value that potentially benefits users
of wind turbines far from China's borders. On the other hand, to the extent that low
wages, low effective land prices, a low cost of capital rise over time, the low costs could
be temporary rather than permanent. And once Western best practice is fully absorbed,
that also implies a deceleration or a cessation of the decline in costs.
Nahm and Steinfeld (2013) have undertaken an impressive series of interviews of
Chinese producers of alternative energy equipment in an effort to identify the kinds of
discrete technology changes and modifications that could drive dynamic cost innovation -
- a process for which they introduce the term "innovative manufacturing." These
researchers are able to identify small set of specific changes introduced by Chinese
producers to the design and production processes of products originally developed
elsewhere that appear to be associated with substantial reductions in production cost.
Unfortunately, the interview/case study approach alone is unable to quantify with
precision the magnitude of cost declines attributable to these design changes rather than
to other factors. It is also unclear from existing scholarship whether the design changes
regularly represent improvements that could be applied by foreign producers elsewhere in
the world, or whether the changes are generally effective only in China, because the
design changes exploit unusually low factor or input prices that are unique to the Chinese
context and, perhaps, to a particular moment in China's industrial development. Our
reading of this evidence suggests that some degree of "cost innovation" may be taking
place in China's wind turbine industry, but its nature, scale, scope, and sustainability have
proved difficult to isolate and quantify. We present in the next section an account of the
development of the Chinese wind turbine manufacturing industry that emphasizes factors
other than innovative capability on the part of indigenous firms.
4. China’s Wind Energy Boom and Its Consequences
China has enacted a number of policies in recent years to boost its supply of renewable
energy.15
A key turning point came with the Renewable Energy Law of the People’s
15 China's renewable energy industries have also benefitted from Chinese participation in international programs like
the Clean Development Mechanism (CDM), which was created by the Kyoto Protocol. While we do not explore the
impact of these international programs, Tang and Popp (2014) provide a useful quantitative study.
13
Republic of China, passed in 2005 and implemented in 200616
. This law provided a
regulatory framework for renewable energy, designated the key government players at
the national and provincial level, and empowered them to draft renewable energy
development and utilization plans (Shuman, 2010). The passage of this law signaled a
strong central government commitment to a rapid build-up of renewable energy in China
-- a commitment soon codified into ambitious renewable energy targets embraced by the
State Council, China's most powerful governmental body, in its Mid- and Long-Term
Development Plan for Renewable Energy. This document called for 10% of China‘s
primary energy consumption to come from renewable energy sources, including
hydropower, wind, and solar, by 2010. By 2020, renewable sources were to account for
15% of primary energy consumption (NRDC, 2007)17
. When these goals were set, total
renewable energy sources contributed only about 6% of primary energy consumption,
and almost all of that 6% came from hydropower (See
Table 1). Establishment of the ambitious 2010 target set off a national frenzy of
wind farm development, the largest development program of its kind in the global history
of the industry.
The Renewable Energy Law also aimed to prop up the domestic turbine
manufacturing industry by offering research and development funds and strong
deployment incentives. Most controversial of these was "Notice 1204," a rule
promulgated in 2005 as part of the Renewable Energy Law that required that at least 70%
of any wind turbine supported by the law had to be manufactured in China. Effectively,
the largest crash program of wind farm development in the history of the industry was
being reserved solely for products with at least 70% domestic content.
In 2004, indigenous firms and Sino-foreign joint ventures accounted for only 17%
of national installed capacity. To take advantage of China's ambitious wind farm
development program, while meeting its requirement for local manufacturing, Western
firms scrambled to transfer technology to Chinese affiliates and local joint venture
partners.18
These efforts were supported by other Chinese government programs. The
Ninth Five-Year Plan (for years 1996 to 2000) had already created incentives through the
National High Tech R&D Program (more commonly known as the 863 Program) to
encourage the licensing of technology from foreign producers by providing Ministry of
Science and Technology (MOST) funds to local wind turbine manufacturers to offset
their licensing costs. The continuation of the 863 Program in the Tenth and Eleventh
Five-Year Plan provided support for the development of megawatt-size wind turbines as
well as variable speed and pitch technologies (Lewis, 2013). This helped Chinese
enterprises absorb the foreign knowhow needed to meet China's wind energy
development targets and its requirement that 70% of turbines be made in China.
16 See Table A1 in the Appendix for summary of relevant policies
17 This goal was revised in 2009 to include nuclear energy as part of the final energy consumption target. 18 Tang and Popp (2014) provide empirical evidence of the impact of this cooperative technology transfer from foreign
firms.

14
The State Council's ambitious renewable energy targets were supported by a
series of requirements and incentives within the national power system. The "Measures
on Grid Company Full Purchase of Electricity from Renewable Energy," issued by the
State Electricity Regulatory Commission (SERC), set up a mandatory connection and
purchase requirement for grid operators, as well as a priority dispatch system under
which renewable generators are given priority in the dispatch sequence.
Similar to what many countries in Europe did in the past, China established feed-
in tariffs to encourage the generation of renewable power. To gauge the price of wind
energy projects prior to setting a feed-in tariffs system, China has held a number of
concession programs where projects were awarded through a competitive bidding process.
The current feed-in-tariff system for wind energy generation has four tiers, ranging from
510 to 610 Chinese yuan per megawatt-hour (CNY/kWh) -- roughly equivalent to USD
80 – USD 100/kWh -- for six years, depending on the region’s wind resources and
electricity demand (Hu, 2013). To help pay for the costs incurred by the new programs,
the National Development and Reform Commission (NDRC), the nation's top economic
planning agency, issued the Interim Measures on Renewable Energy Electricity Prices
and Cost Sharing Management, which levied a 1 CNY/MWh surcharge on consumers
(NDRC, 2006). The surcharge has increased a few times since its introduction, and
NRDC announced at the end of 2011 its intention to raise it to 8 CNY/MWh, or USD 1.3
(Walet, 2011). In order to ensure equality among the grid companies, SERC and NDRC
issued the Interim Measures on Revenue Allocation from Renewable Surcharges, which
created an interprovincial equalization program where grid companies could exchange
their shortfall or surpluses with companies from other regions (Schuman, 2010).
The National People's Congress adopted some important amendments to the
Renewable Energy Law in 2009, as the deadline for the 10% renewable energy target
approached. The global financial crisis had led to a sharp decline in fossil energy prices.
Even though China escaped the worst of the global slowdown, there was still a temporary
decline in the growth of energy demand. This combination of lower fossil energy prices
and relaxed demand made the renewable energy targets much more expensive for the grid
operators. Even though the grid companies were still required to connect and purchase
power generated by renewable sources, they could require wind generators to consent in
their power purchase agreements to grid curtailment (Schuman, 2010). Such agreement
allowed grid companies to purchase only a portion of the renewable energy, freeing them
to purchase electricity generated by cheaper sources. The 2009 Amendments created a
central renewable energy fund through which grid companies could directly seek
compensation for costs associated with purchasing and transmission of renewable power
(Shuman, 2010). The Amendments also require regulatory agencies "to set priority
dispatch regulations that will give priority to renewable power generators in the
electricity dispatch sequence,” with lowest emission units being dispatched first (p.10,
Schuman, 2010).
Meanwhile, the U.S. government challenged China's policy limiting its rapidly
expanding domestic market to locally produced wind turbines under WTO trade rules.
Rather than fight the U.S. in a trade case that it would likely lose, China rescinded the
formal legal requirement that turbines supported by the Renewable Energy Law had to be
70% manufactured in China (Bradsher, 2010). However, by the time this legal

15
requirement was formally rescinded, indigenous firms and Sino-foreign joint ventures
had come to dominate the Chinese market. The technological advantage held by foreign
firms had been significantly diminished, if not eliminated, and low-cost Chinese
producers were now able to produce virtually the entire spectrum of commercial
products. China's ambitious wind power build-out had displaced foreign producers in the
domestic market with apparent success.
5. Recent Developments in the Chinese Wind Power Industry
Even if Chinese wind turbine manufacturers have, at least so far, failed to
generate meaningful advances to the global technological state of the art in terms of
product innovation, they could still be providing an important service to the global
industry if they are able to push the costs of manufacturing standard products to low
levels. For decades, China-based producers have been able to expand their global market
share across a wide range of manufactured goods by offering products with reasonable
levels of quality at low costs. Consumers around the world have benefitted from these
low costs, even as rising Chinese competition has forced a reallocation of the labor force
in countries where domestic producers have been unable to withstand the onslaught of
Chinese competition. Low costs in China reflect much lower wages, of course, but they
also reflect the low prices of the other inputs and factors of production. In Western
countries, land for production facilities must generally be purchased from private owners.
In China, private land ownership, per se, is still effectively nonexistent. The state owns
the land, and can provide it to favored firms and industries at very low cost. Likewise, the
cost at which China's state-owned banks lend to industry is also arguably artificially
low.19
Of course, policy distortions that artificially reduce the cost of land and capital
inputs have an economic cost, in China and elsewhere. Moreover, such subsidies, if they
are product-specific and distort trade, contravene international trade rules, and could
result in China facing penalties in a WTO dispute.20
Nevertheless, it stands to reason that,
given these favorable environmental factors and a fairly mature technology, China-based
wind turbine manufacturers would be able to produce at a lower cost than foreign rivals.
And lower priced wind turbines could expand adoption of wind energy around the world,
as well as in China, leading to faster adoption and more rapid global de-carbonization.
However, recent evidence on the current state of the Chinese wind power industry
suggests that China's breakneck expansion pushed prices to unsustainably low levels,
undermining the financial health of China's heretofore rapidly growing wind turbine
manufacturing sector. Data on recent developments in the Chinese wind power industry
is surprisingly hard to come by. The wave of bankruptcies engulfing China's solar cell
industry -- former market leader Suntech has already declared bankruptcy -- has received
extensive attention in the international media, but the same media outlets have said little
about China's wind turbine manufacturers. Nevertheless, data from the Chinese Wind
19 See Lardy (2011) for a careful analysis and evaluation of the degree to which key input prices in China have been
artificially pushed down, as well as the economic consequences.
20 In a definitional sense, a low price sustained by WTO-illegal measures may not be sustainable, in the sense that it
may not be legally defensible.

16
Energy Association (CWEA) suggest that a significant consolidation is underway. At the
end of 2010, there were over 80 wind turbine manufacturers in China. That number had
decreased to approximately 30 by 2013, according to industry sources. CWEA numbers
suggest that annual wind turbine sales fell in quantity terms by more than 30% from 2010
to 2012 as the majority of firms eventually shuttered.
This consolidation has been driven, in part, by government policy. The Ministry
of Industry and Information Technology (MIIT) developed a new set of regulations, the
Wind Power Equipment Manufacturing Industry Access Standards, which came into
effect in June 2011, requiring that turbine manufacturers had to produce wind turbines
capable of generating 2.5 MW and possess an overall annual capability of a minimum of
1 GW in order to compete for domestic contracts. Only 12% of 80 Chinese manufacturers
in the industry in 2011 were judged capable of meeting those standards, so these
regulations had the effect of freezing marginal producers out of the expanding domestic
market.21
Manufacturers who meet the standards will continue to receive preferential
treatment, including access to equity issuance on the Chinese stock market (a process
rigidly controlled by the government), simpler requirements for bank loans, and tax
breaks (Liu, 2011).
Many Chinese industries plagued by overcapacity have struggled on the pathway
to consolidation, because local governments try to keep local producers alive, even when
economic logic would require many of them to close. By prolonging the period of
overcapacity, this local resistance to consolidation raises the social costs and the ultimate
degree of resource misallocation. By effectively disqualifying the vast majority of
producers, regardless of local financial support, MIIT presented the local governments
with a fait accompli.
The results have been swift, and they have quickly laid bare the weakness of the
majority of producers. Some 50-odd domestic manufacturers of wind turbines had, to
varying degrees, borrowed money, hired workers, set aside land, and constructed
factories. Now these enterprises are apparently no longer producing wind turbines at all.
The magnitude of these costs -- the full extent of the misallocation of resources that
occurred as Chinese producers scrambled to meet the State Council's ambitious goals --
will only become evident with the passage of time.
And the process of consolidation may not yet be over. Some of the large firms
still remaining in the industry appear to be on shaky ground. A number of them are listed
on the stock exchanges, and are tracked by a community of equity analysts. China's
number three manufacturer, Sinovel, is getting especially negative reviews. Since early
2011, Sinovel's equity price on the Shanghai market has collapsed from CNY 22 per
share to less than CNY 4 per share. Sales of turbines fell 61% in 2012 from 2011 levels,
and the company is currently recording significant losses with no clear pathway to a
return to financial health. Sinovel is known to American readers as the Chinese company
accused of stealing the trade secrets of a firm known as American Superconductor. The
21 See Alternative Energy eTrack

17
company is under criminal investigation by the U.S. Department of Justice and remains
the target of a lawsuit filed by American Superconductor.22
The strongest Chinese firm in the industry, Goldwind, appears to be in better
shape, and equity analysts judge it to have brighter prospects. But even this enterprise is
far weaker today than the market expected three or four years ago. In late 2010,
Goldwind's shares on the Hong Kong exchange peaked at a price of over HK $26 per
share. By August 2011, the company's stock price had suffered a decline of nearly 75%,
and equity prices remained at severely depressed levels through fall 2013, with a modest
recovery since then to less than HK $9. In addition to manufacturing turbines, Goldwind
has invested in a number of wind farms, and the financial statements submitted by the
firm suggest that Goldwind's profits during the industry downturn have been heavily
reliant on income from these noncore businesses. The company's accounts suggest the
core wind turbine manufacturing business was only marginally profitable in 2011, ran
losses in 2012, and returned to (marginal) profitability in 2013. To the extent that it can
be inferred from the company's annual reports, Goldwind's return on assets appears to be
well below the average level for Chinese private sector.
No one is predicting that the entire Chinese wind turbine industry is going to
disappear, even if a majority of the active firms in 2011 have since ceased production. No
one is forecasting that China's leading firms will cease to be a global force, even if some
former high flyers, like Sinovel, appear to be sliding toward dissolution. Goldwind, at
least, seems to be on a path to higher profitability, and a number of other large producers
appear to be benefitting from a stronger price environment in the aftermath of the
industry's substantial consolidation. Still, the recent financial history of the industry calls
into question just what sort of return the nation has earned to date on the expensive
experiment launched by the passage of the Renewable Energy Law.
In hindsight, it appears likely that the explosive growth of the industry was a
classic case of too much, too soon. In the mid-2000s, the Chinese government set
extremely ambitious targets for renewable energy consumption by the end of the decade.
It also required that all new wind turbines used to meet this target by 70% manufactured
in China. This unabashedly protectionist move was not challenged by a major trading
partner for years. This started a gold rush in China's wind sector as domestic firms moved
in to what was the most frenetic build-out of wind energy ever attempted in any country,
confident that their most technologically sophisticated and well established foreign rivals
would be effectively kept out of the marketplace, except to the extent that they
transferred technology to Chinese affiliates or joint venture partners. China's protected
internal marketplace was primed to become the biggest wind energy market in the world
in record time. Firms with limited technological capability and manufacturing scale
scrambled into the marketplace to be part of China's green revolution. With the scale of
this revolution fully endorsed by the State Council, it was reasonable to expect that the
power generators and grid operators would be forced to buy wind power from domestic
producers -- even if the prices were high -- in order to meet the mandates of the nation's
most powerful governmental body.
22 See Wright's Research Service analyst report on Sinovel, July 4, 2013.
18
However, as the deadlines approached, the entities that purchased and distributed
energy within the national grid received crucial "wiggle room" from the central
authorities. As wind farms were hastily constructed, many of them were simply not
connected to the grid. When the marginal cost of wind energy increased, the grid
operators were allowed to "curtail" it. Full enforcement of the 10% mandate would have
required the grid operators to either incur significant losses or pass large electricity price
increases on to China's energy-intensive manufacturers at a time when the central
government was far more determined to maintain growth in the wake of a global
economic crisis than it was to enforce green power mandates, and this inclination was
reinforced by a substantial drop in fossil energy prices after the global crisis. China's
appetite for a surge in wind energy declined at precisely the moment that the investment
boom of the 2000s was resulting in a hefty surplus of turbine manufacturing capacity.23
Faced with an unexpected glut, producers lowered prices below marginal cost, the
financial health of the industry deteriorated, and the equity prices of even the leading
producers collapsed.
As the scale of overcapacity and overproduction in the wind turbine sector --
especially among the smaller, less capable producers -- became apparent, MIIT seems to
have become the designated Grim Reaper, implementing regulations that shut the entire
lower tier of producers out of further wind farm supply contracts. The majority of
producers are now apparently shut down, providing badly needed "breathing room" for
the leading manufacturers, like Goldwind. As the degree of overcapacity has faded,
turbine prices have modestly risen. In light of all this, it seems that China's march down
the cost curve went several steps too far. The rock-bottom prices of two years ago
reflected, in part, the financial realities of an industry suffering from significant
overcapacity, in which even the leading producers were incurring losses on their wind
turbine manufacturing businesses and suffering pronounced equity price declines.
Whatever the dynamic cost innovation capabilities of Chinese domestic producers may
be, these capabilities appear to have their limits.
6. Conclusions
China established itself as a major global player in the wind energy industry in
less than a decade. From an installed capacity of just over 400MW in 2001, China
surpassed the US to become the country with the most wind capacity in the world,
totaling approximately 76GW as of 2012. As they have ramped up output, indigenous
producers have increasingly undercut the prices maintained by producers outside China.
This growth path, some argue, suggests that Chinese wind power manufacturing firms
have developed substantial indigenous technological capabilities. Indeed, some Chinese
wind turbine manufacturers have been profiled in the Western media as the kind of
dynamic "green innovators" that might save the world from the consequences of China's
expanding emissions of carbon dioxide and other industrial pollutants.
23 Interestingly, even today, the level of electricity generated by wind appears to lag far behind the level of wind
generation capacity installed. Despite having handily overtaken the United States years ago in installed capacity, China
still generates less electricity from wind than the U.S., and the gap has not measurably narrowed in the most recent
periods for which we have data. See Figure 11.

19
Unfortunately, we find little evidence that Chinese firms in this industry have
acquired a substantive capacity to generate the kinds of novel product and process
innovations that are captured by patent statistics. Using patents as a measure of
innovation, we find that there are almost no wind power patents granted to Chinese
inventors by the member states of the European Patent Office or by the U.S. Patent and
Trademark Office. While Chinese wind power firms had a strong focus on their domestic
market in the beginning of the last decade, the top firms have shifted focus to the
international market in recent years. These firms have every incentive to protect any
inventions they create by taking out patents in the international markets that are an
increasingly important component of their expansion strategies. Furthermore, our citation
analysis results suggest that recent technological improvements in wind power, even at
the global level, may have been increasingly incremental. Wind power is therefore
exactly the kind of technological context in which we might expect emerging
manufacturers from a latecomer country to successfully participate in the advance of the
global state of the art. That makes the near total absence of international patents on the
part of Chinese firms all the more striking, especially when compared against the
increasing intense patenting activities outside China of Chinese firms in other sectors. It
is hard to interpret this as evidence of anything other than the reality that, to date, Chinese
wind turbine manufacturers simply have not produced inventions worth patenting outside
their home countries.
These two factors lead us to conclude that it is not innovation, per se, that has
fueled the rise of China’s wind power industry. Rather, the industry’s rapid development
can be attributed to a highly supportive policy environment. As it raced to meet
incredibly ambitious renewable energy targets, China embarked on the greatest crash
wind farm development program in the global history of the industry. For several crucial
years during this rapid build-out, China violated international trade rules by limiting
participation in this build-out to products that were mostly manufactured in China. Faced
with a possible U.S. challenge at the WTO, China rescinded its formal requirements for
domestic manufacture in 2010, but, by then, China's efforts at import-substituting
industrialization had "succeeded." To be sure, this represents a significant technological
achievement on the part of Chinese firms -- Western technology was quickly absorbed
and adapted to a Chinese context of low factor and input prices, allowing Chinese
producers to marry reasonably high quality with low prices. Innovation, per se, may be
limited in the Chinese industry, but the absorptive capacity of Chinese producers is quite
high.
On the other hand, the domestic industry China has created looks at least
somewhat less healthy today than it did three years ago. The latest industry data suggest
that the majority of producers active in the industry in 2010 have since ceased production.
The top publicly traded Chinese producers saw their stock prices decline by roughly 75%
over next two years, and the wave of consolidation hitting the lower tier producers is only
now bringing significant financial improvement to the surviving incumbents. Before the
recent wave of consolidation in the Chinese wind power industry, foreign observers
might have hoped that Chinese producers, while apparently unable, as yet, to advance the
state of the art through significant product innovation, had nevertheless found a way to
generate sustained reductions in production costs. This may well prove to be true in the
20
longer run, but it seems apparent that overcapacity drove Chinese equipment prices well
below economically sustainable levels, even among domestic manufacturers. For the
Chinese industry to find its financial footing, equipment prices will need to stabilize at
levels above recent lows.
Despite the current situation facing the industry, we believe that leading Chinese
firms are likely to remain important global players in the near future. By singling out
clean energy as one of the seven priority industries, China government signaled its firm
commitment to clean energy development in its 12th
Five-Year Plan (2011-2015). With
the continuation of friendly policy environment, China’s wind power industry is likely to
rebound. However, even as the industry regains its financial footing, further progress in
terms of cost reductions is likely to slow substantially relative to the recent past, as is the
growth rate of the indigenous industry.

21
References
Alternative Energy e-Track Database. Retrieved November 26, 2012 from
http://www.alternativeenergyetrack.com/Index.aspx
Arora, A., Branstetter, L., & Drev, M. (Forthcoming) Going Soft: How the Rise of
Software Based Innovation led to the Decline of Japan's IT Industry and the
Resurgence of Silicon Valley. The Review of Economics and Statistics, MS #14150.
Bettencourt, L.M.A., Trancik J.E., Kaur J. (2013). Determinants of the Pace of Global
Innovation in Energy Technologies. PLoS ONE 8(10): e67864.
doi:10.1371/journal.pone.0067864
Bradsher, K. (2010, December 14) To Conquer Wind Power, China Writes the Rules. The
New York Times. Retrieved 12 July, 2012, from
http://www.nytimes.com/2010/12/15/business/global/15chinawind.html?pagewanted
=all.
Branstetter, L., Li, G., & Veloso, F. (2013). The Rise of International Co-invention.
NBER Working Paper.
BTM Consult ApS. (2013). International Wind Energy Development – World Market
Update 2012. BTM Consult ApS, Ringkøbing, Denmark.
BP Statistical Review of World Energy. (2013). Retrieved September 30, 2013 from
http://www.bp.com/en/global/corporate/about-bp/statistical-review-of-world-energy-
2013.html
Cabellero, R. & Jaffe, A. (1993). How High are the Giants’ Shoulders: An Empirical
Assessment of Knowledge Spillovers and Creative Destruction in a Model of
Economic Growth. NBER Macroeconomics Annual, Vol. 8, pp.15-74.
Cass, R.A. (2009, February 10). “Patent Reform with Chinese Characteristics”. The Wall
Street Journal. Retrieved September 15, 2013 from
http://online.wsj.com/news/articles/SB123419814824764201
CWEA. (2008-2013). 2007-2012 China’s Wind Power Installed Capacity Statistics (in
Chinese) (pp. 1–12). Retrieved November 18, 2012 from
http://www.cwea.org.cn/upload
Flannery, H.C., (2013, August 26) Goldwind: Company Update. KGI, Retrieved
September 25, 2013 from Thomson One.
Gipe, P. (1995). Wind Energy Comes of Age. New York: Wiley.
Gosens, J. & Lu, Y. (2013). "From Lagging to Leading? Technology Innovation Systems
in Emerging Economies and the Case of Chinese Wind Power." Energy Policy (60):
234-250.
Greenpeace. (2012). China Wind Power Outlook 2012. Retrieved from
http://www.greenpeace.org/eastasia/publications/reports/climate-energy/2012/wind-
energy-report-2012/

22
GWEC. (2012). China Wind Energy Outlook. (L. Junfeng, F. Cai, L. Qiao, H. Xie, H.
Gao, X. Yang, et al., Eds.) (pp. 1–85). Retrieved July 3, 2013 from
http://www.gwec.net/publications/country-reports/china-wind-energy-outlook-2012/
GTM Media Research & Azure International. (2013). China Wind Market Quarterly: 4th
Quarter 2012.
Harhoff, D., Scherer, F.M., & Vopel, K. (2002). Citations, Family Size, Opposition and
the Value of Patent Rights. Research Policy. Elsevier, No. 32(8), pp. 1343-1363.
Heymann, M. (1999). Signs of Hubris: The Shaping of Wind Technology Styles in
Germany, Denmark, and the United States, 1940-1990. Technology and Culture, Vol.
39, No. 4, pp. 641-670.
IEA. (2011). Technology Roadmap: China Wind Energy Development Roadmap 2050 ©
OECD/IEA (fig. 4, p. 14), Source: ERI.
Jaffe, A.B. & Trajtenberg, M. (1996). Flows of Knowledge from Universities and Federal
Labs: Modeling the Flow of Patent Citations over Time and Across Institutional and
Geographic Boundaries. NBER Working Paper No. 5712.
Jaffe, A.B. & Trajtenberg, M. (2002). Patents, Citations and Innovations: A Window on
the Knowledge Economy. Boston: MIT Press.
Jaffe, A.B., Trajtenberg, M, & Henderson R. (1993). Geographic Localization of
Knowledge Spillovers as Evidenced by Patent Citations. Quarterly Journal of
Economics, No. 108, pp. 577-598.
Jamieson, P. (2011) Innovation in Wind Turbine Design. New York: Wiley.
Johnstone, N., Hascic, I., & Popp, D. (2009). Renewable Energy Policies and
Technological Innovation: Evidence Based on Patent Counts. Environmental and
Resource Economics, 45(1), 133–155.
Kamp, L. M., Smits, R. E. H. M., & Andriesse, C. D. (2004). Notions on learning applied
to wind turbine development in the Netherlands and Denmark. Energy Policy, 32(14),
1625–1637. doi:10.1016/S0301-4215(03)00134-4
Lardy, N. (2011). Sustaining China's Growth after the Global Financial Crisis.
Washington: Peterson Institute for International Economics.
Lewis, J. (2013). Green Innovation in China: China's Wind Power Industry and the
Global Transition to a Low-Carbon Economy. New York: Columbia University Press.
Print.
Li, X. (2012). Behind the Recent Surge of Chinese Patenting: An Institutional View.
Research Policy, 41(1), 236-249.
Liu, Y. (2011, March 22) “Consolidation Among China's Wind Power Manufacturers
Likely.” Renewable Energy World. Retrieved March 29. 2013 from
http://www.renewableenergyworld.com/rea/news/article/2011/03/consolidation-
among-chinas-wind-power-manufacturers-likely.
Liu, J. & Goldstein, D. (2013). Understanding China’s Renewable Energy Technology
23
Exports. Energy Policy 52, pp. 417-428.
National Energy Administration (2013). 2012 National Wind Power Generating Capacity
Increased by 41%. Retrieved September 25, 2013 from http://www.nea.gov.cn/2013-
04/09/c_132294176.htm
Nahm, J. & Steinfeld, E. (2013). Scale-up nation: China's specialization in innovative
manufacturing. World Development, 54, 288-300.
Nemet, G. F (2009). Demand-pull, technology-push, and government-led incentives for
nonincremental technical change. Research Policy, 38(5), 700–709.
Nielsen, S. (2012, November 20). “China Grabs Share in Latin America Wind With
Cheap Loans.” Bloomberg News. Retrieved March 29 2013 from
http://www.bloomberg.com/news/2012-11-20/china-grabs-share-in-latin-america-
wind-with-cheap-loans.html
NDRC (2006). Interim Measures on Renewable Energy Electricity Prices and Cost
Sharing Management.
NRDC (2007). Medium and Long-Term Plan for Renewable Energy Development in
China.
OECD. (2009). OECD Patent Statistics Manual. Retrieved October 13, 2012 from
http://browse.oecdbookshop.org/oecd/pdfs/free/9209021e.pdf
Popp, D. (2002). Induced Innovation and Energy Prices. American Economic Association
92, No.1, pp. 160-180.
Qi, W. (2013, February 26) “Analysis – Chinese Wind Curtailments Double in 2012.”
Windpower Monthly. Retrieved August 26, 2013 from
http://www.windpowermonthly.com/article/1171987/analysis---chinese-wind-
curtailments-double-2012.
Qiu, Y. & Anadon, L. (2012). The price of wind power in China during its expansion:
technology adoption, learning-by-doing, economies of scale, and manufacturing
localization. Energy Economics, 34, 825-835.
Ru, P., Zhi, Q., Zhang, F., Zhong, X., Li, J., & Su, J. (2012). Behind the development of
technology: The transition of innovation modes in China’s wind turbine
manufacturing industry. Energy Policy, 43(C), 58–69.
doi:10.1016/j.enpol.2011.12.025.
Samaras, C. (2008, January 8). A Life-Cycle Approach To Technology, Infrastructure,
And Climate Policy Decision Making: Transitioning To Plug-In Hybrid Electric
Vehicles And Low-Carbon Electricity. Carnegie Mellon University, Pittsburgh, PA.
Şahin, A.D. (2004) Progress and recent trends in wind energy. Progress in Energy and
Combustion Science, Volume 30, Issue 5, 2004, Pages 501-543, ISSN 0360-1285,
10.1016/j.pecs.2004.04.001.
Schuman, S. (2010). Improving China’s Existing Renewable Energy Legal Framework:
Lessons from the International and Domestic Experience. National Resources
Defense Council.
24
SERC (2007), Measures on Grid Company Full Purchase of Electricity from Renewable
Energy.
Shi, P. (2004-2007). 2003-2006 Statistics of China Wind Energy Installed Capacity (in
Chinese). Retrieved from
http://wenku.baidu.com/view/529ad607e87101f69e3195e5.htmlS
Tang, T. & Popp, D. (2014). The learning process and technological change in wind
power: evidence from China's CDM wind products. NBER working paper no. 19921.
Teece, D. J. (2000). Managing Intellectual Capital: Organizational, Strategic, and Policy
Dimensions. New York: Oxford University Press.
Trajtenberg, M. (1990). "A Penny for Your Quotes: Patent Citations and the Value of
Innovations." The RAND Journal of Economics, 21 (1), pp. 172-187.
Walet, L. (2011, December 1) “China clean energy shares climb on surcharge increase.”
Reuters. Retrieved March 30, 2013 from
http://www.reuters.com/article/2011/12/01/us-cleanenergy-shares-
idUSTRE7B00FI20111201.
Wang, Z., Qin, H., & Lewis, J. I. (2012). China's wind power industry Policy support,
technological achievements, and emerging challenges. Energy Policy, 51(C), 80–88.
doi:10.1016/j.enpol.2012.06.067
Wiser, R., & Bolinger, M. (2013). 2012 Wind Technologies Market Report. Wind
technologies market report. US DOE.
Wooldridge, J. M. (2002) Introductory Econometrics: A Modern Approach. Stamford:
Cengage Learning. Print.
Wright Investors’ Service (2013, June 28). A Wright Investors’ Service Report: Sinovel
Wind Group Ltd. Wright Investors’ Service. Retrieved September 24, 2013 from
Thomson One.
Xinhua (2013, March 10). “China to Restructure National Energy Administration.”
Xinhua. Retrieved September 25, 2013 from
http://news.xinhuanet.com/english/china/2013-03/10/c_132221775.htm.

25
Figure 1: Distribution of China’s wind resource potential (W/m2). The country’s northern
and northeastern regions are among the windiest. Wind power density is expressed in
W/m2, measured at 70m height. Figure from IEA (2011).
Figure 2: China’s wind power installation by province. Provinces with most wind power
installed are also those that have significant wind resources. Data from CWEA (2013);
map produced by authors.

26
Figure 3: Annual and cumulative wind nameplate capacity installations in China by year,
broken down by domestic versus foreign firms. Domestic firms dominate the market in
recent years. Plot constructed by the authors using data from: CWEA (2007 - 2013), Shi
(2003 - 2006), and Alternative eTrack (2010).
Figure 4: The breakdown of China’s wind turbine market by foreign and domestic firms
between 2002 and 2012. Domestic firms dominate the market in recent years starting
from 2005, when Renewable Energy Law was passed and Notice 1204 was issued. Plot
constructed by the authors using data from: CWEA (2007 - 2013), Shi (2003 - 2006), and
Alternative eTrack (2002).
0
10,000
20,000
30,000
40,000
50,000
60,000
70,000
80,000
90,000
100,000
0
2,000
4,000
6,000
8,000
10,000
12,000
14,000
16,000
18,000
20,000
Cu
mu
lati
ve
In
sta
lla
tio
n
Ca
pa
cit
y (
MW
)
An
nu
al
Ins
tall
ati
on
Cap
ac
ity
(MW
)
Europe US India Domestic Cumulative
0%
10%
20%
30%
40%
50%
60%
70%
80%
90%
100%
2002 2003 2004 2005 2006 2007 2008 2009 2010 2011 2012 2013
Foreign Domestic
RE Law Passage & Notice 1204 Issuance
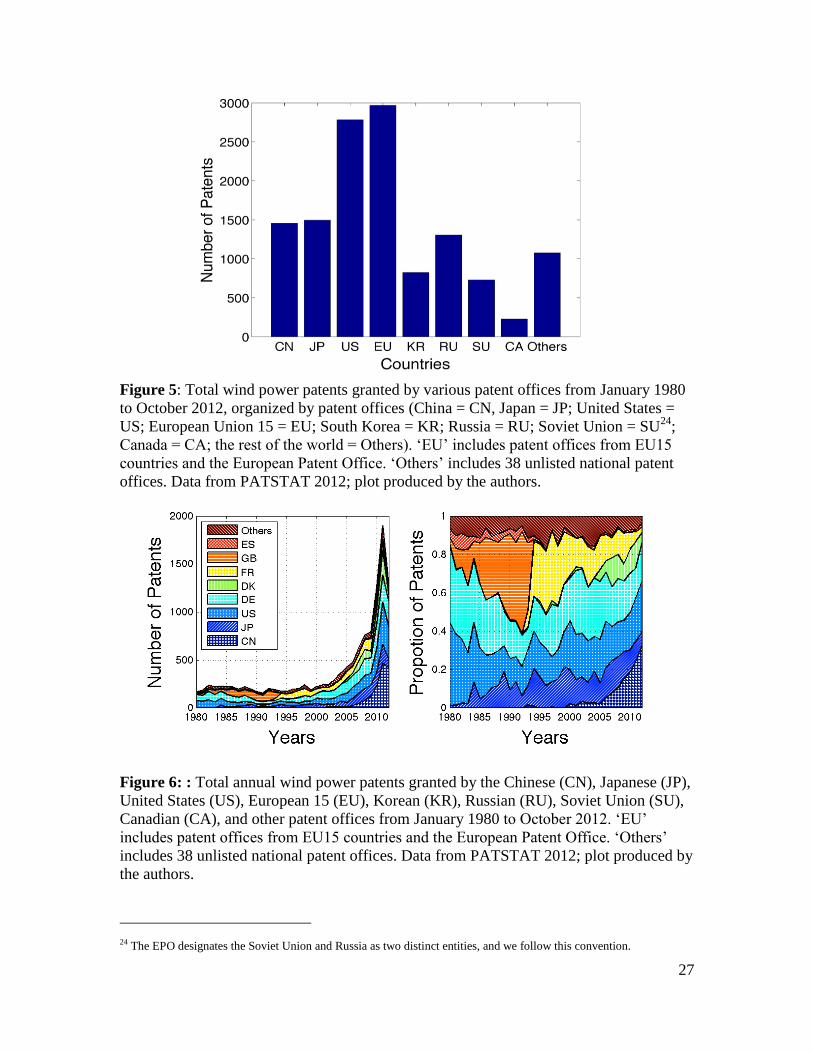
27
Figure 5: Total wind power patents granted by various patent offices from January 1980
to October 2012, organized by patent offices (China = CN, Japan = JP; United States =
US; European Union 15 = EU; South Korea = KR; Russia = RU; Soviet Union = SU24
;
Canada = CA; the rest of the world = Others). ‘EU’ includes patent offices from EU15
countries and the European Patent Office. ‘Others’ includes 38 unlisted national patent
offices. Data from PATSTAT 2012; plot produced by the authors.
Figure 6: : Total annual wind power patents granted by the Chinese (CN), Japanese (JP),
United States (US), European 15 (EU), Korean (KR), Russian (RU), Soviet Union (SU),
Canadian (CA), and other patent offices from January 1980 to October 2012. ‘EU’
includes patent offices from EU15 countries and the European Patent Office. ‘Others’
includes 38 unlisted national patent offices. Data from PATSTAT 2012; plot produced by
the authors.
24 The EPO designates the Soviet Union and Russia as two distinct entities, and we follow this convention.
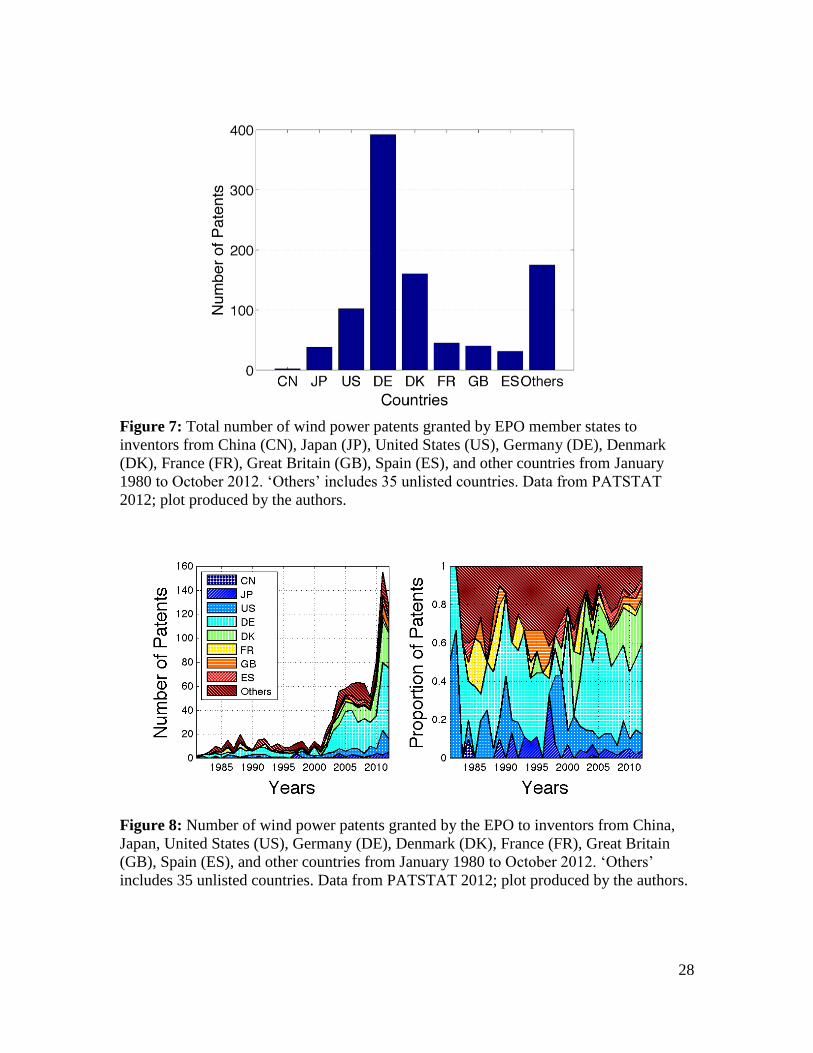
28
Figure 7: Total number of wind power patents granted by EPO member states to
inventors from China (CN), Japan (JP), United States (US), Germany (DE), Denmark
(DK), France (FR), Great Britain (GB), Spain (ES), and other countries from January
1980 to October 2012. ‘Others’ includes 35 unlisted countries. Data from PATSTAT
2012; plot produced by the authors.
Figure 8: Number of wind power patents granted by the EPO to inventors from China,
Japan, United States (US), Germany (DE), Denmark (DK), France (FR), Great Britain
(GB), Spain (ES), and other countries from January 1980 to October 2012. ‘Others’
includes 35 unlisted countries. Data from PATSTAT 2012; plot produced by the authors.

29
Figure 9: Number of EPO wind power applications and patents granted to German,
Danish, Japanese, American and Chinese inventors from January 1980 to October 2012.
Data from PATSTAT 2012; plot produced by the authors.
Figure 10: Estimated levelized cost of energy for wind energy between 1980 and 2009
for the US and Europe (excluding incentives). Source: Wiser & Bolinger (2013),
Lemming et al. (2009), and DEA (1999).
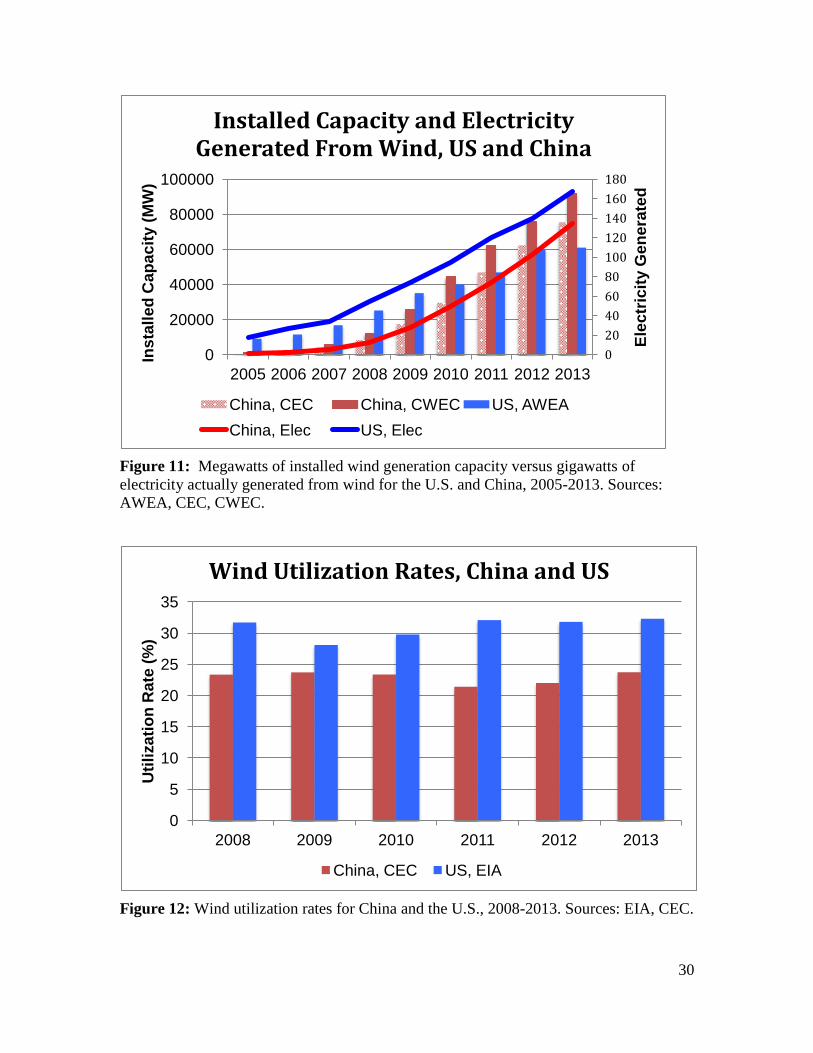
30
Figure 11: Megawatts of installed wind generation capacity versus gigawatts of
electricity actually generated from wind for the U.S. and China, 2005-2013. Sources:
AWEA, CEC, CWEC.
Figure 12: Wind utilization rates for China and the U.S., 2008-2013. Sources: EIA, CEC.
0
20
40
60
80
100
120
140
160
180
0
20000
40000
60000
80000
100000
2005 2006 2007 2008 2009 2010 2011 2012 2013
Ele
ctr
icit
y G
en
era
ted
Ins
tall
ed
Cap
ac
ity (
MW
)
Installed Capacity and Electricity Generated From Wind, US and China
China, CEC China, CWEC US, AWEA
China, Elec US, Elec
0
5
10
15
20
25
30
35
2008 2009 2010 2011 2012 2013
Uti
liza
tio
n R
ate
(%
)
Wind Utilization Rates, China and US
China, CEC US, EIA
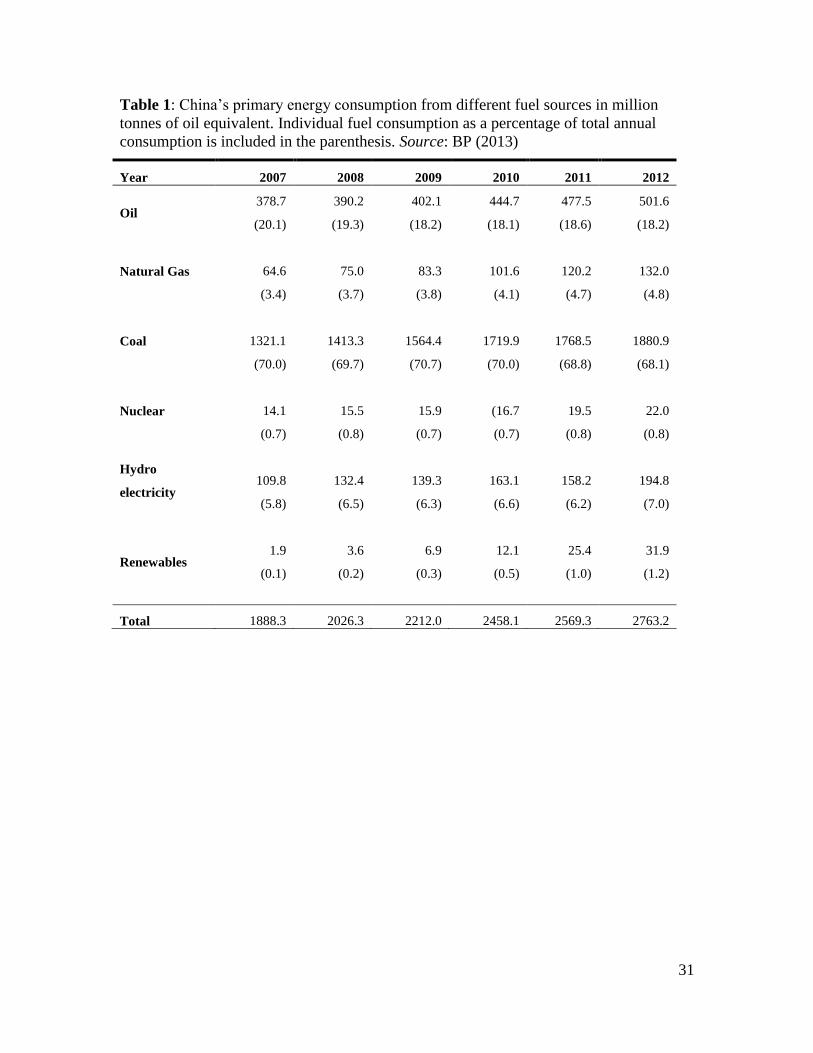
31
Table 1: China’s primary energy consumption from different fuel sources in million
tonnes of oil equivalent. Individual fuel consumption as a percentage of total annual
consumption is included in the parenthesis. Source: BP (2013)
Year 2007 2008 2009 2010 2011 2012
Oil 378.7 390.2 402.1 444.7 477.5 501.6
(20.1) (19.3) (18.2) (18.1) (18.6) (18.2)
Natural Gas
64.6 75.0 83.3 101.6 120.2 132.0
(3.4) (3.7) (3.8) (4.1) (4.7) (4.8)
Coal
1321.1 1413.3 1564.4 1719.9 1768.5 1880.9
(70.0) (69.7) (70.7) (70.0) (68.8) (68.1)
Nuclear
14.1 15.5 15.9 (16.7 19.5 22.0
(0.7) (0.8) (0.7) (0.7) (0.8) (0.8)
Hydro
electricity
109.8 132.4 139.3 163.1 158.2 194.8
(5.8) (6.5) (6.3) (6.6) (6.2) (7.0)
Renewables
1.9 3.6 6.9 12.1 25.4 31.9
(0.1)
(0.2)
(0.3)
(0.5)
(1.0)
(1.2)
Total 1888.3 2026.3 2212.0 2458.1 2569.3 2763.2

32
Table 2: Citation function estimation results for two-year cohorts using PATSTAT data
on patent grants examined by the EPO, WIPO, and the USPTO from 1980 to October
2012, using the cohort of 1980-81 as the base year for cited patents. Citing patent cohorts
are drawn from the years 1990-2012. For bevity, only the coefficients measuring
obsolescence, diffusion, and the relative citedness of successive cited patent cohorts are
reported. The latter can be interpreted as a percentage quality discount relative to the
base category. For instance, the 1994-1995 patent cohort is about 80% less likely to be
cited than the 1980-1981 patent cohort.
Parameter Standard Error
Cited year effects
(Base = 1980-81)
1982-1983 -0.0404 0.1017
1984-1985 -0.2663** 0.0975
1986-1987 -0.5260*** 0.0524
1988-1989 -0.7215*** 0.0612
1990-1991 -0.7874*** 0.0550
1992-1993 -0.7970*** 0.0586
1994-1995 -0.7996*** 0.0656
1996-1997 -0.8911*** 0.0411
1998-1999 -0.9196*** 0.0341
2000-2001 -0.9010*** 0.0457
2002-2003 -0.9172*** 0.0421
2004-2005 -0.9310*** 0.0384
2006-2007 -0.9487*** 0.0313
2008-2009 -0.9615*** 0.0264
2010-2011 -0.9789*** 0.0219
Obsolescence 0.2496*** 0.0227
Diffusion 0.0017* 0.0009
N = 136
R-squared = 0.95
Coefficients with *** denote that it is significant at 1% level, ** is significant at 5% level,
and * is significant at 10% level.

33
Table 3: Citation function estimation results for two-year cohorts using PATSTAT data
on patents granted by the USPTO from 1980 to October 2012, using the cohort of 1980-
81 as the base year. Citing patent cohorts are drawn from the years 1990-2012. For bevity,
only the coefficients measuring obsolescence, diffusion, and the relative citedness of
successive cited patent cohorts are reported. The latter can be interpreted as a percentage
quality discount relative to the base category. For instance, the 1994-1995 patent cohort
is about 71% less likely to be cited than the 1980-1981 patent cohort.
Parameter Standard Error
Cited year effects
(Base = 1980-1981)
1982-1983 -0.2177*** (0.0739)
1984-1985 -0.3268*** (0.0716)
1986-1987 -0.5525*** (0.0601)
1988-1989 -0.7223*** (0.0469)
1990-1991 -0.7996*** (0.0348)
1992-1993 -0.7464*** (0.0486)
1994-1995 -0.7129*** (0.599)
1996-1997 -0.8407*** (0.0389)
1998-1999 -0.8624*** (0.0369)
2000-2001 -0.8938*** (0.0448)
2002-2003 -0.8236*** (0.0548)
2004-2005 -0.8587*** (0.0480)
2006-2007 -0.8856*** (0.0426)
2008-2009 -0.9014*** (0.0415)
2010-2011 -0.9526*** (0.0361)
Obsolescence 0.1969*** (0.0137)
Diffusion 0.0029** (0.0012)
N = 136
R-squared = 0.96
Coefficients with *** denote that it is significant at 1% level, ** is significant at 5% level,
and * is significant at 10% level.

34
Table A1: Major government policies to support the growth of the renewable energy
sector. Adapted from Liu & Goldstein (2013).
Date Policy Details
2002 Taxation Notice on
Value-Added Tax
Electricity generated from wind power is exempted from 50% of the
value-added-tax
July 2005 Notice 1204 70% of wind turbine must consist of local content starting 2006
Jan 2006
Renewable Energy
Electricity Price Sharing
and Management
Electricity generated by renewable energy is priced by the government,
and the part over the market price for conventional electricity will be
shared by all electricity consumers
Sept 2007
Medium and long-term
development plan for
renewable energy in
China
(a) Construct large-scale wind farms in Northern China and small to
medium sized wind farms in other areas. (b) Set up off-shore wind power
generation pilot projects with at least 100 MW capacity by 2010, and 1000
MW capacity by 2020. (c) Target 1000 roof-top solar PV projects
nationwide by 2010, 20,000 by 2020
2008 National Energy Bureau
created
(a) Promote policymaking on energy development and reconstruction,
manage national oil reserves, natural gas, coal and electricity(b) Propose
strategic policies in renewable energy and energy conservation. (c)
Manage international cooperation and ensure adequate supplies of oil
2008 Corporate Tax Law Wind farm projects are exempted from corporate tax for the first 3 years,
and exempted from 50% of corporate tax for the next 3 years
Mar 2008 Tenth Renewable Energy
Five-Year Plan
(a) Increase the economy of scale of wind farms, promote domestic
production of wind technologies, reduce costs and improve global
competitiveness. (b) Set a target for the aggregate installed
capacity of wind energy to be at least 10 GW, and that for solar PV energy
to be at least 0.3 GW
Aug 2008 Wind Turbine Special
Fund Management
(a) Subsidize Chinese wind technology companies. (b) Funded
enterprises receive 600 RMB/kW for their first 50 WTGS.
Dec 2008 Taxation Notice on
Value-Added Tax
Electricity generated from wind power continues to be exempted from
50% of the value-added tax
2009 Amendment to the
Renewable Energy Law
(a) Impose a renewable portfolio standard to grid wind power suppliers.
(b) Introduce FITs depending on regional wind resources
2009
State Council Notice on
Energy Conservation and
Emission Reduction
(a) Enforce the use of renewable energy in new residential and office
buildings. (b) Reconstruct and upgrade industries with high energy
consumption and high emissions. (c) Merge or shut down small inefficient
power generation plants
March
2009
Solar Energy
Construction Subsidy
Funds Management
(a) Subsidize 20 RMB ($2.94)/Wp. (b) The subsidized solar PV products
need to have at least 50 kWp installed capacity. (c) Priority is given to
solar PV products applicable to new buildings, schools, hospitals and
other public infrastructure
July 2009 Notice on the Golden
Sun Model Project
(a) Subside 50% of the total investment for qualified solar PV
generation, 70% if the project is in remote areas with no electricity. (b)
The subsidized projects must operate no less than 20 years. (c) The solar
PV generation units must have at least 0.1 billion RMB ($14.7 million)
registered capital. (d) Single projects must have installed capacity over
300 kWp
July 2009 Renewable Energy
Construction Model City
(a) Select and subsidize qualified model cities, with 50–80 million RMB
($7.35–11.76 million) per city. (b) Model cities must have renewable
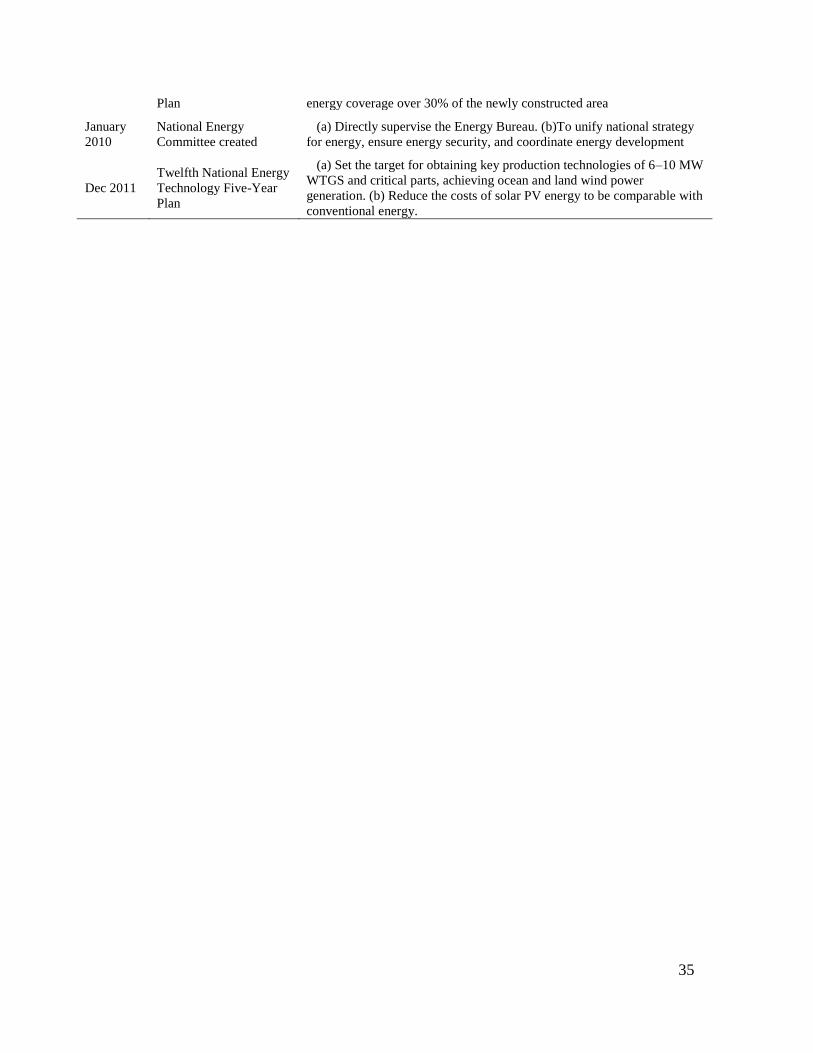
35
Plan energy coverage over 30% of the newly constructed area
January
2010
National Energy
Committee created
(a) Directly supervise the Energy Bureau. (b)To unify national strategy
for energy, ensure energy security, and coordinate energy development
Dec 2011
Twelfth National Energy
Technology Five-Year
Plan
(a) Set the target for obtaining key production technologies of 6–10 MW
WTGS and critical parts, achieving ocean and land wind power
generation. (b) Reduce the costs of solar PV energy to be comparable with
conventional energy.