too fast too furious need for speed (high-frequency trading) antidote
TRANSCRIPT
TOO FAST TOO FURIOUS NEED FOR SPEED
ANTIDOTE TOMMI A. VUORENMAA, PHD
[email protected] on HFT at Copenhagen Business School
October 5th, 2015
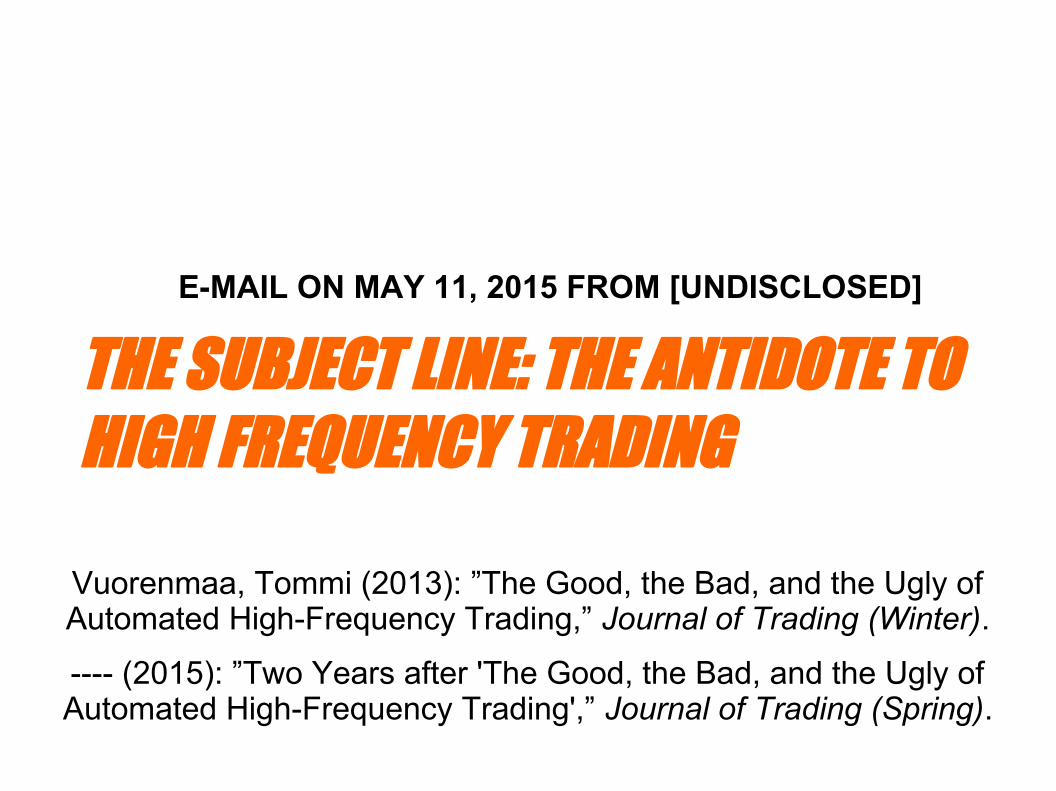
E-MAIL ON MAY 11, 2015 FROM [UNDISCLOSED]
THE SUBJECT LINE: THE ANTIDOTE TO HIGH FREQUENCY TRADING
Vuorenmaa, Tommi (2013): ”The Good, the Bad, and the Ugly of Automated High-Frequency Trading,” Journal of Trading (Winter).
---- (2015): ”Two Years after 'The Good, the Bad, and the Ugly of Automated High-Frequency Trading',” Journal of Trading (Spring).

“Ask any racer, any real racer. It doesn't matter if you win by an inch or a mile; winning's winning.” -Dom [F&F]
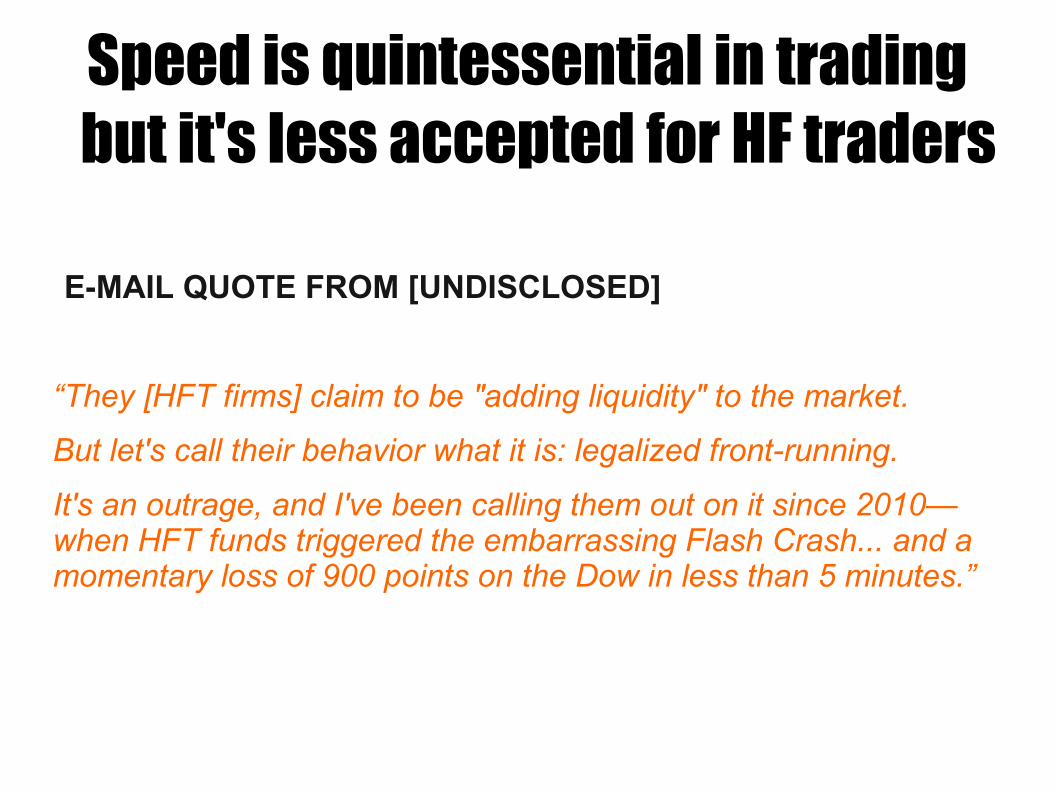
E-MAIL QUOTE FROM [UNDISCLOSED]
“They [HFT firms] claim to be "adding liquidity" to the market.
But let's call their behavior what it is: legalized front-running.
It's an outrage, and I've been calling them out on it since 2010—when HFT funds triggered the embarrassing Flash Crash... and a momentary loss of 900 points on the Dow in less than 5 minutes.”
Speed is quintessential in trading but it's less accepted for HF traders

HFT FIRMS ARE NOT FOUND TO HAVE TRIGGERED THE 2010 FLASH CRASH.
See: CFTC-SEC REPORT (2010).
Vuorenmaa, Tommi and Liang Wang (2014): “An Agent-Based Model of the Flash Crash of May 6, 2010, with Policy Implications.”
http://papers.ssrn.com/sol3/papers.cfm?abstract_id=2336772
Simulation: https://www.youtube.com/watch?v=0pBreyekwJs
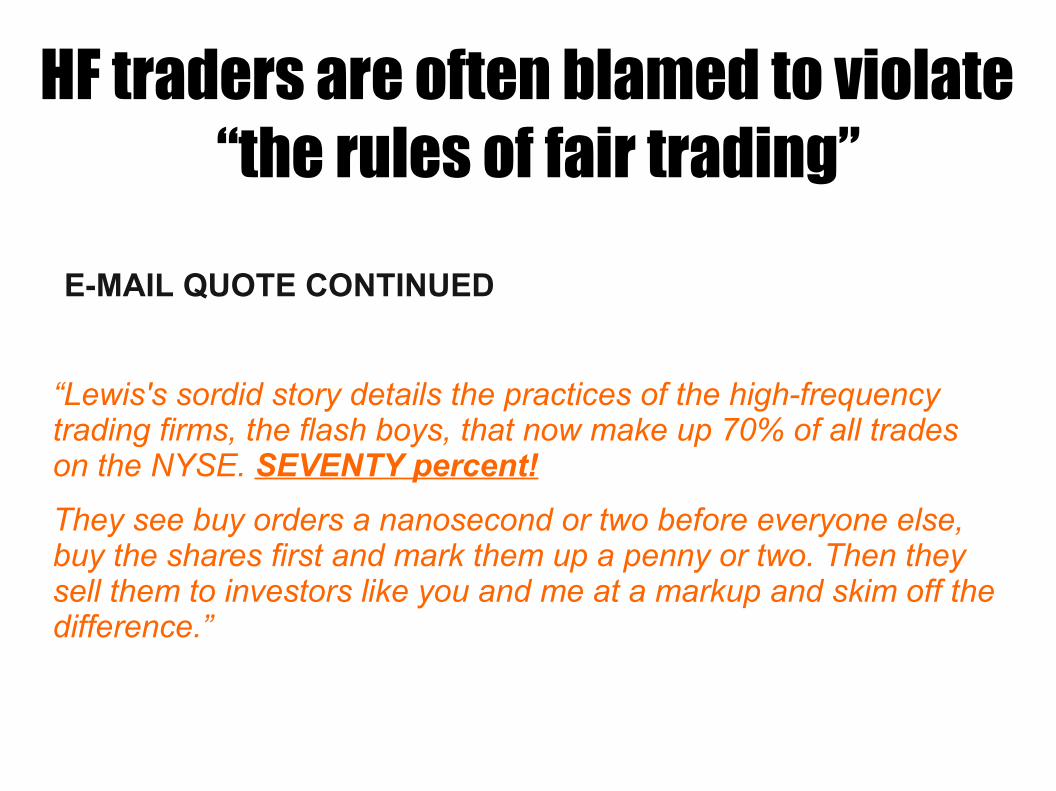
E-MAIL QUOTE CONTINUED
“Lewis's sordid story details the practices of the high-frequency trading firms, the flash boys, that now make up 70% of all trades on the NYSE. SEVENTY percent!
They see buy orders a nanosecond or two before everyone else, buy the shares first and mark them up a penny or two. Then they sell them to investors like you and me at a markup and skim off the difference.”
HF traders are often blamed to violate “the rules of fair trading”
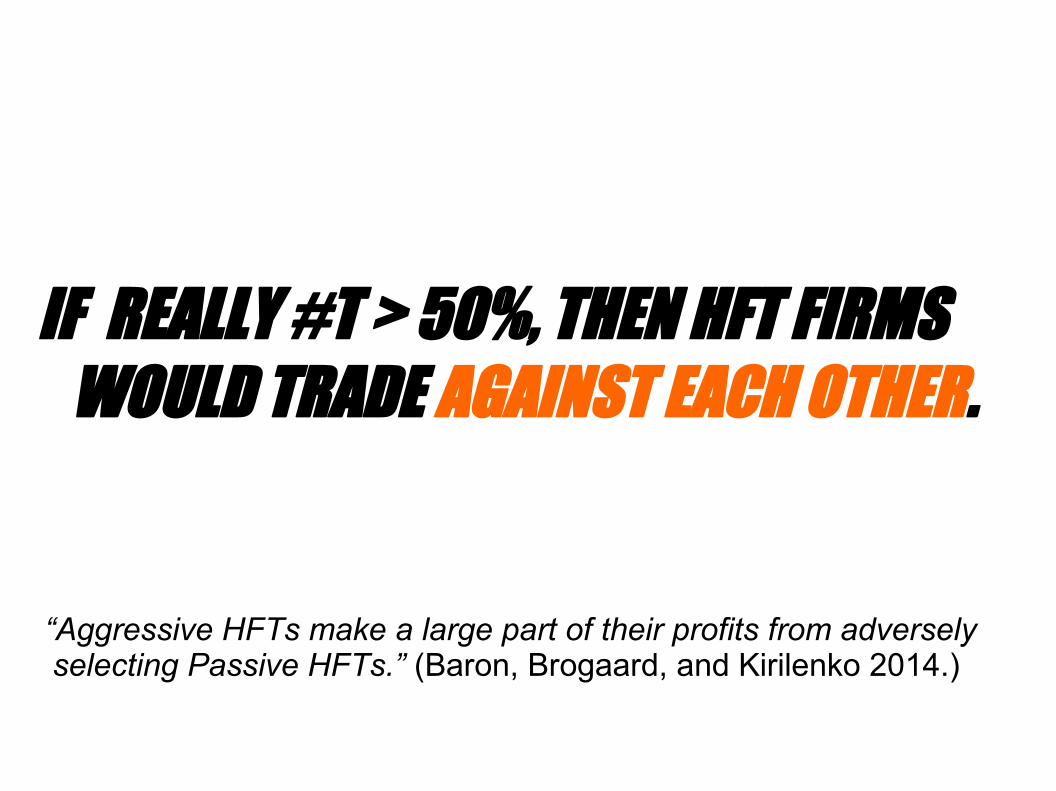
IF REALLY #T > 50%, THEN HFT FIRMS WOULD TRADE AGAINST EACH OTHER.
“Aggressive HFTs make a large part of their profits from adversely selecting Passive HFTs.” (Baron, Brogaard, and Kirilenko 2014.)
E-MAIL QUOTE CONTINUED
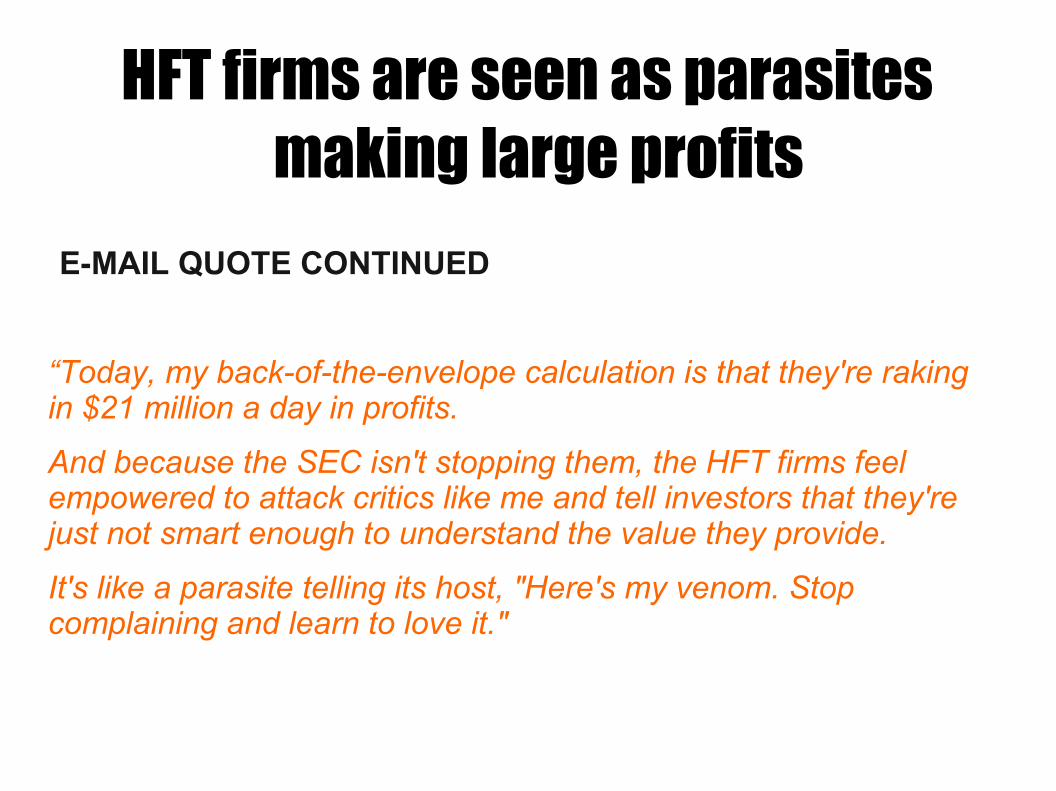
“Today, my back-of-the-envelope calculation is that they're raking in $21 million a day in profits.
And because the SEC isn't stopping them, the HFT firms feel empowered to attack critics like me and tell investors that they're just not smart enough to understand the value they provide.
It's like a parasite telling its host, "Here's my venom. Stop complaining and learn to love it."
HFT firms are seen as parasites making large profits
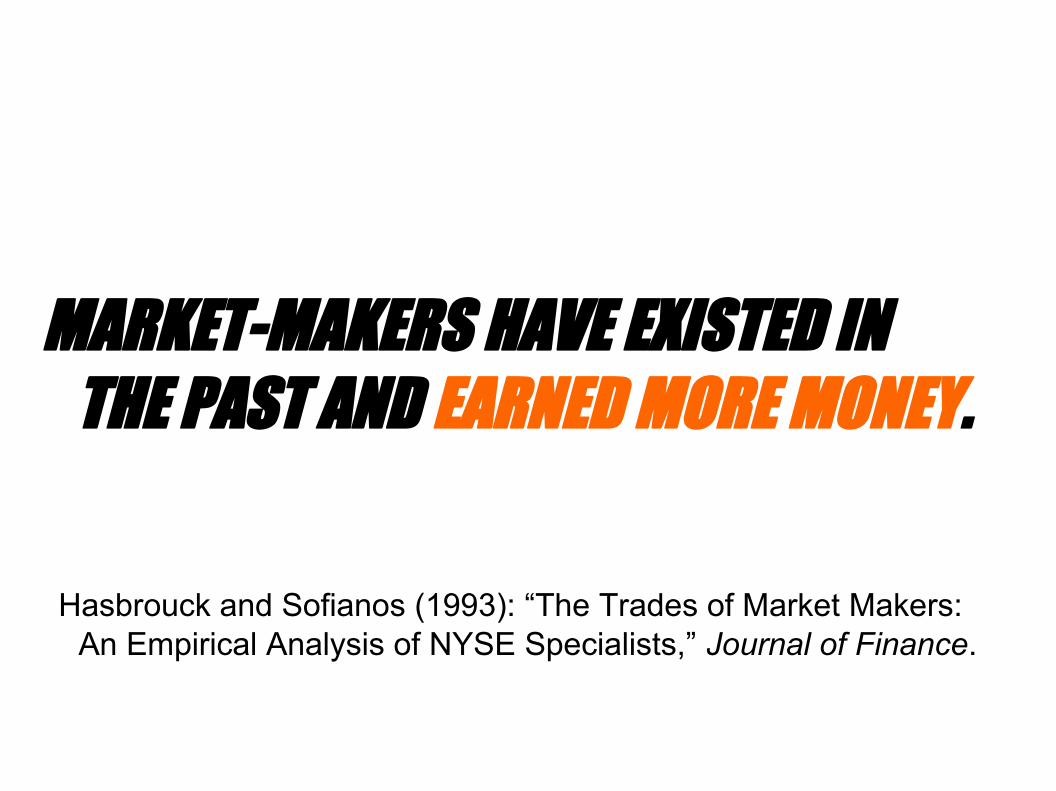
MARKET-MAKERS HAVE EXISTED IN THE PAST AND EARNED MORE MONEY.
Hasbrouck and Sofianos (1993): “The Trades of Market Makers: An Empirical Analysis of NYSE Specialists,” Journal of Finance.
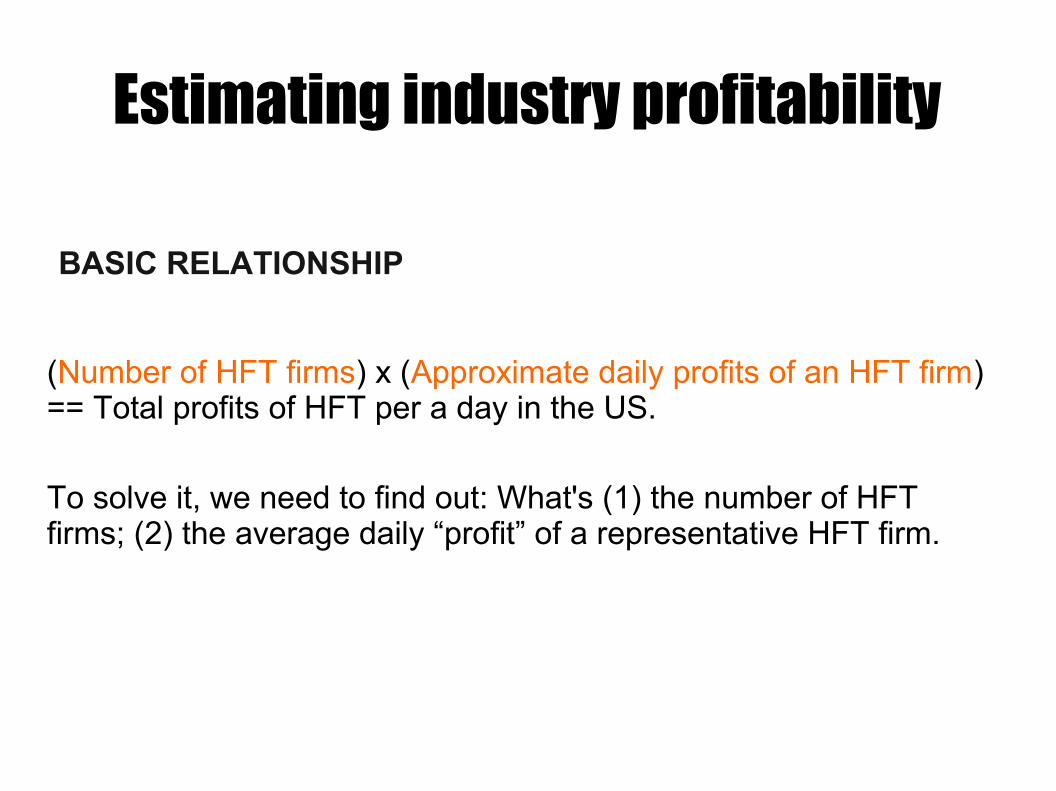
Estimating industry profitability
BASIC RELATIONSHIP
(Number of HFT firms) x (Approximate daily profits of an HFT firm) == Total profits of HFT per a day in the US.
To solve it, we need to find out: What's (1) the number of HFT firms; (2) the average daily “profit” of a representative HFT firm.
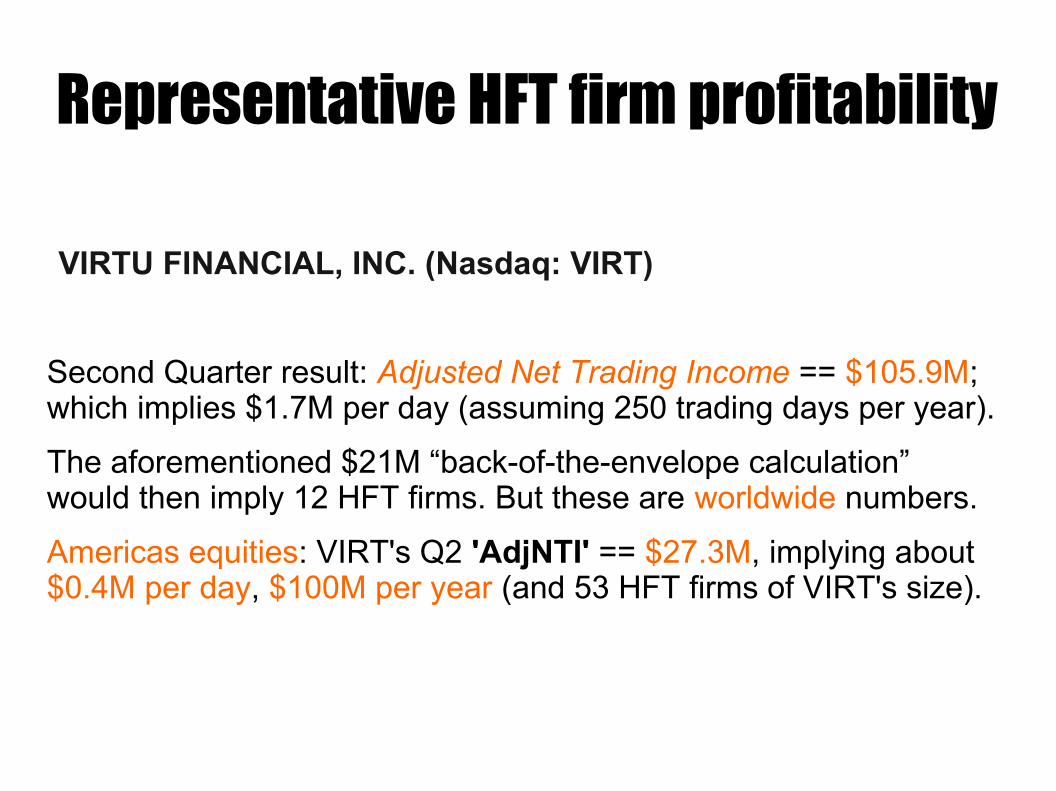
Representative HFT firm profitability
VIRTU FINANCIAL, INC. (Nasdaq: VIRT)
Second Quarter result: Adjusted Net Trading Income == $105.9M; which implies $1.7M per day (assuming 250 trading days per year).
The aforementioned $21M “back-of-the-envelope calculation” would then imply 12 HFT firms. But these are worldwide numbers.
Americas equities: VIRT's Q2 'AdjNTI' == $27.3M, implying about $0.4M per day, $100M per year (and 53 HFT firms of VIRT's size).
http://www.sec.gov/Archives/edgar/data/1592386/000104746914002070/a2218589zs-1.htm
http://ir.virtu.com/releases.cfm?view=all
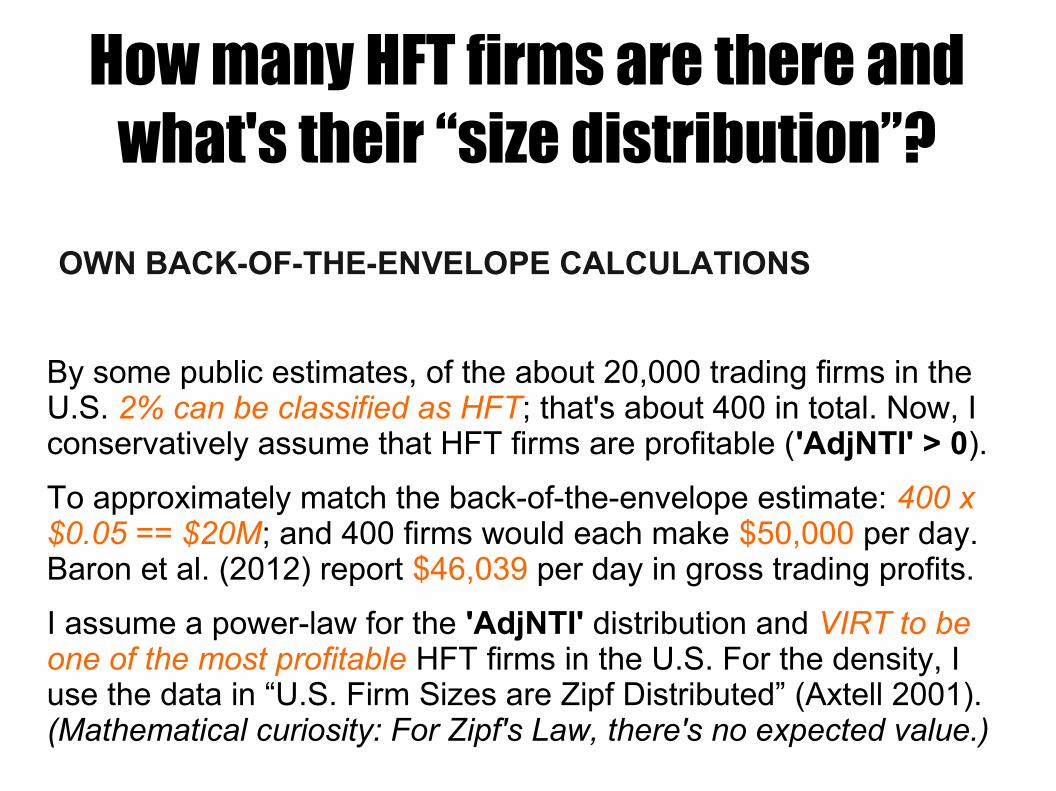
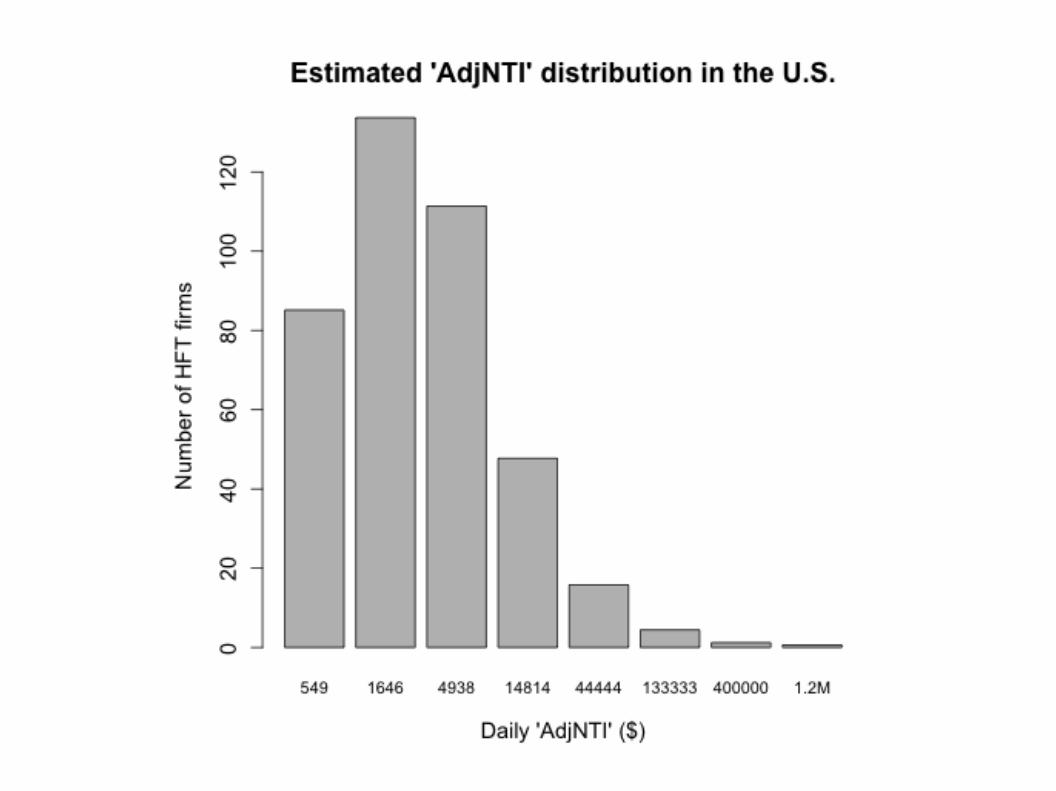
How many HFT firms are there and what's their “size distribution”?
OWN BACK-OF-THE-ENVELOPE CALCULATIONS
By some public estimates, of the about 20,000 trading firms in the U.S. 2% can be classified as HFT; that's about 400 in total. Now, I conservatively assume that HFT firms are profitable ('AdjNTI' > 0).
To approximately match the back-of-the-envelope estimate: 400 x $0.05 == $20M; and 400 firms would each make $50,000 per day. Baron et al. (2012) report $46,039 per day in gross trading profits.
I assume a power-law for the 'AdjNTI' distribution and VIRT to be one of the most profitable HFT firms in the U.S. For the density, I use the data in “U.S. Firm Sizes are Zipf Distributed” (Axtell 2001). (Mathematical curiosity: For Zipf's Law, there's no expected value.)
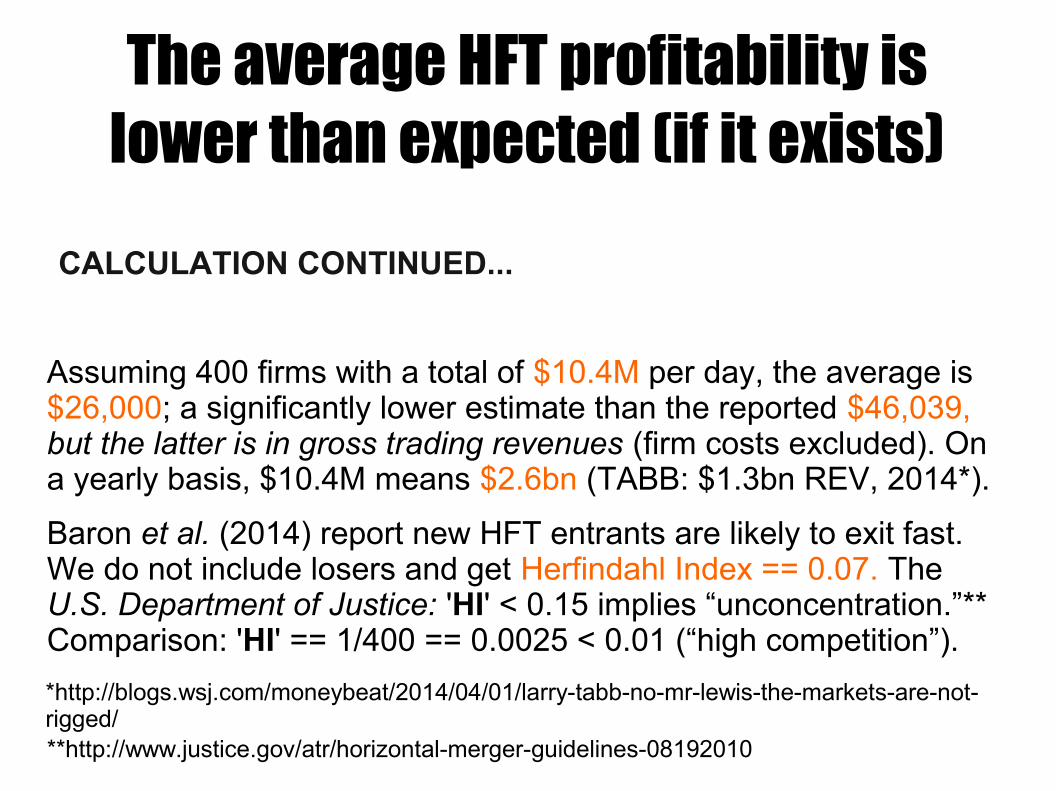
The average HFT profitability is lower than expected (if it exists)
CALCULATION CONTINUED...
Assuming 400 firms with a total of $10.4M per day, the average is $26,000; a significantly lower estimate than the reported $46,039, but the latter is in gross trading revenues (firm costs excluded). On a yearly basis, $10.4M means $2.6bn (TABB: $1.3bn REV, 2014*).
Baron et al. (2014) report new HFT entrants are likely to exit fast. We do not include losers and get Herfindahl Index == 0.07. The U.S. Department of Justice: 'HI' < 0.15 implies “unconcentration.”** Comparison: 'HI' == 1/400 == 0.0025 < 0.01 (“high competition”).
**http://www.justice.gov/atr/horizontal-merger-guidelines-08192010
*http://blogs.wsj.com/moneybeat/2014/04/01/larry-tabb-no-mr-lewis-the-markets-are-not-rigged/
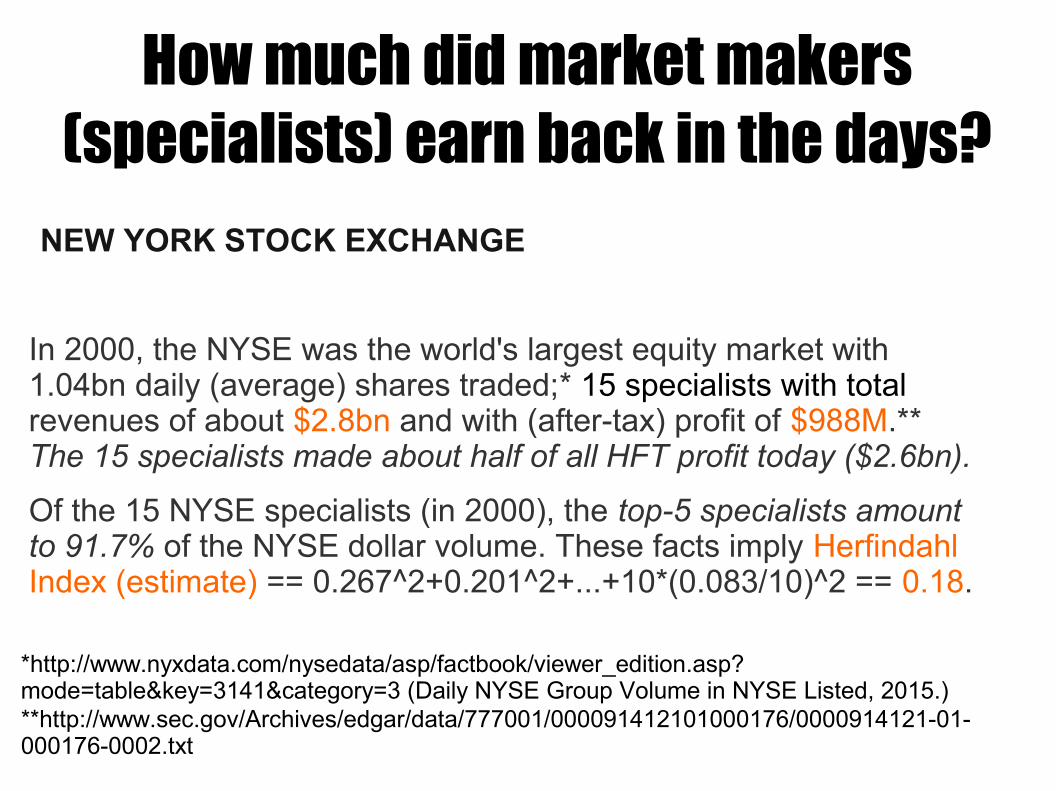
How much did market makers (specialists) earn back in the days?
NEW YORK STOCK EXCHANGE
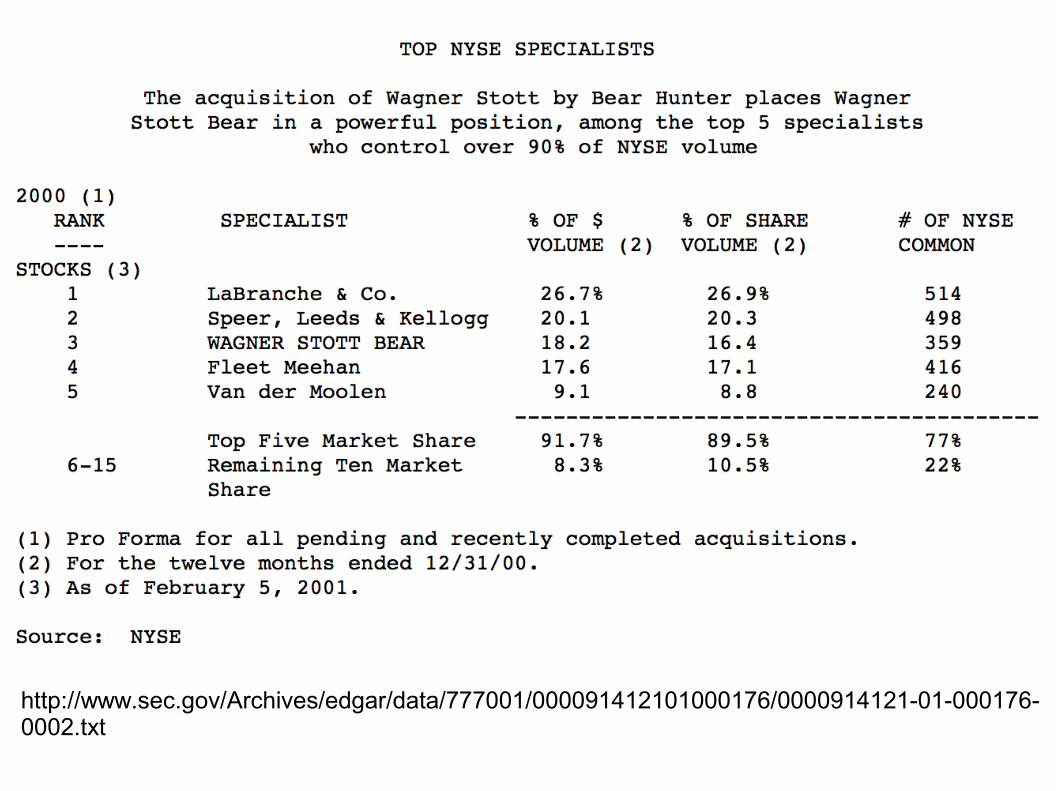
In 2000, the NYSE was the world's largest equity market with 1.04bn daily (average) shares traded;* 15 specialists with total revenues of about $2.8bn and with (after-tax) profit of $988M.** The 15 specialists made about half of all HFT profit today ($2.6bn).
Of the 15 NYSE specialists (in 2000), the top-5 specialists amount to 91.7% of the NYSE dollar volume. These facts imply Herfindahl Index (estimate) == 0.267^2+0.201^2+...+10*(0.083/10)^2 == 0.18.
**http://www.sec.gov/Archives/edgar/data/777001/000091412101000176/0000914121-01-000176-0002.txt
*http://www.nyxdata.com/nysedata/asp/factbook/viewer_edition.asp?mode=table&key=3141&category=3 (Daily NYSE Group Volume in NYSE Listed, 2015.)
http://www.sec.gov/Archives/edgar/data/777001/000091412101000176/0000914121-01-000176-0002.txt
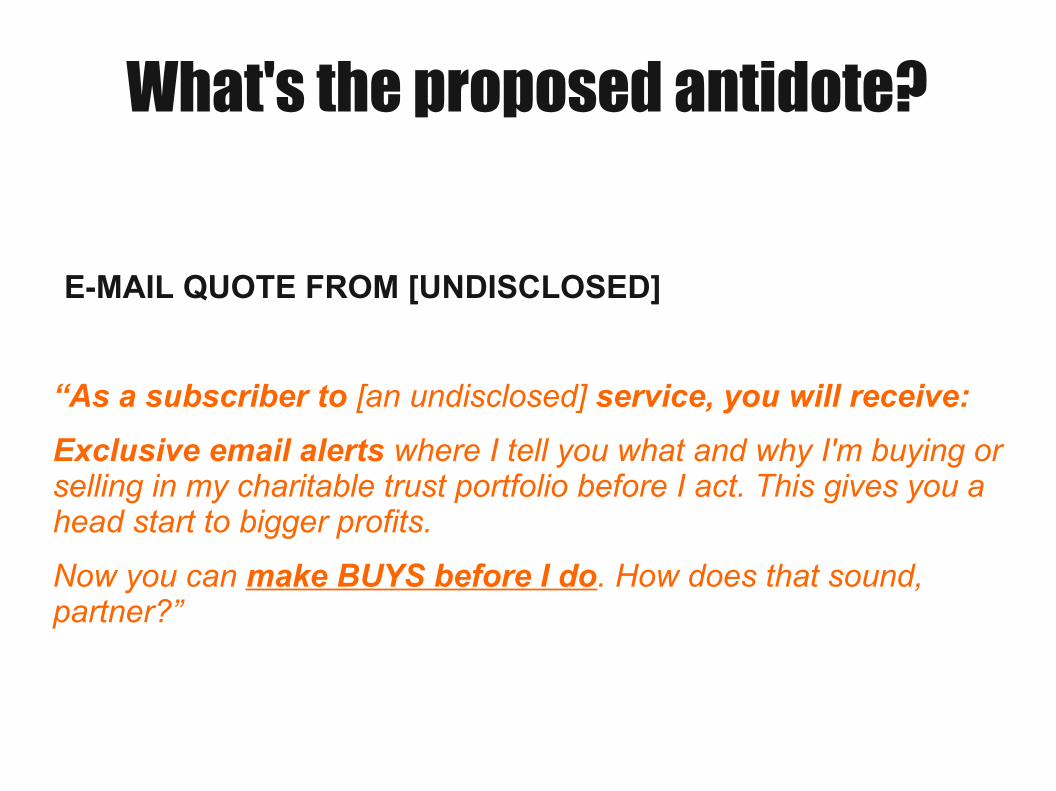
What's the proposed antidote?
E-MAIL QUOTE FROM [UNDISCLOSED]
“As a subscriber to [an undisclosed] service, you will receive:
Exclusive email alerts where I tell you what and why I'm buying or selling in my charitable trust portfolio before I act. This gives you a head start to bigger profits.
Now you can make BUYS before I do. How does that sound, partner?”
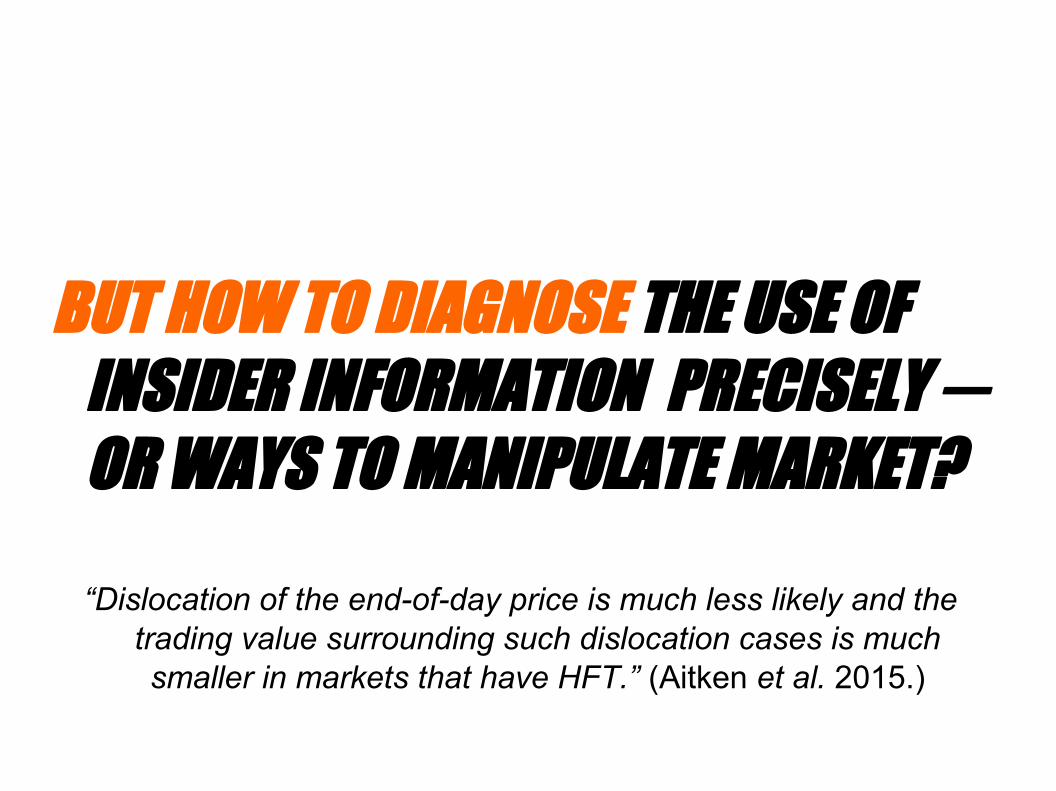
BUT HOW TO DIAGNOSE THE USE OF INSIDER INFORMATION PRECISELY ─ OR WAYS TO MANIPULATE MARKET?
“Dislocation of the end-of-day price is much less likely and the trading value surrounding such dislocation cases is much smaller in markets that have HFT.” (Aitken et al. 2015.)
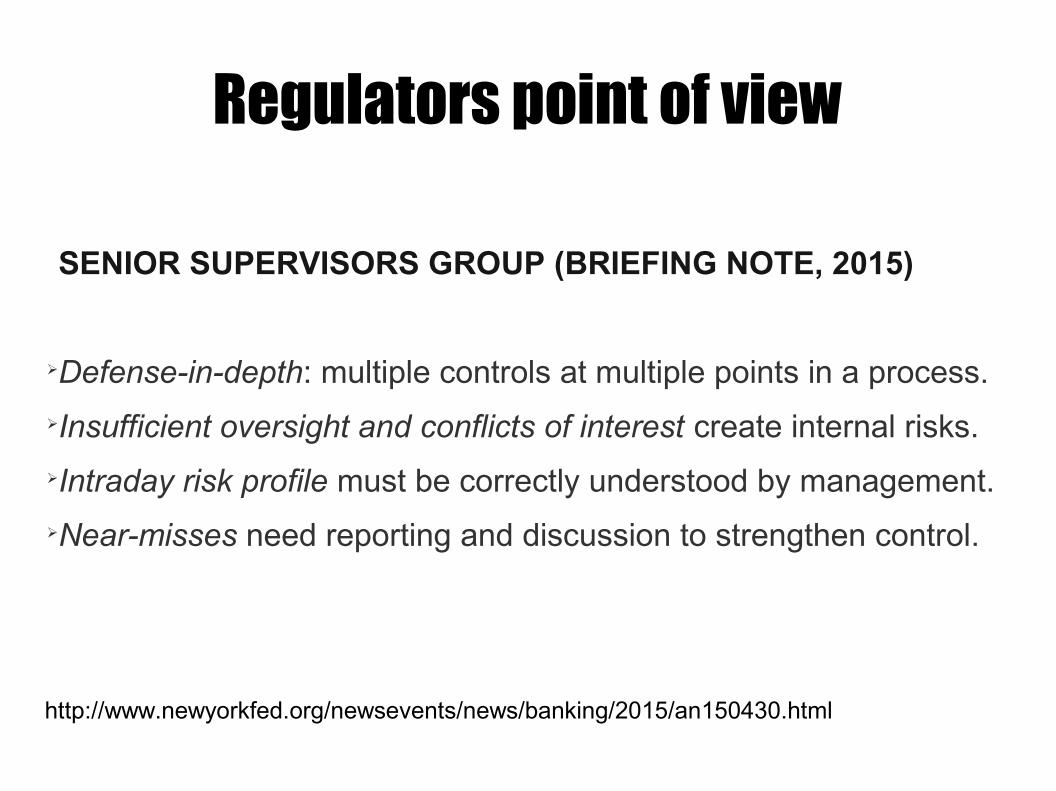
Regulators point of view
SENIOR SUPERVISORS GROUP (BRIEFING NOTE, 2015)
➢Defense-in-depth: multiple controls at multiple points in a process.
➢Insufficient oversight and conflicts of interest create internal risks.
➢Intraday risk profile must be correctly understood by management.
➢Near-misses need reporting and discussion to strengthen control.
http://www.newyorkfed.org/newsevents/news/banking/2015/an150430.html
“Nothing really matters unless you have a code.” -Brian O'Conner [F&F]
Disclaimer:
Information presented above is available in public domain. No private or confidential information has been unlawfully disclosed.
Related projects by the author
BLOG HTTP://VERSUSTAKES.CO
MOST RECENT (SEPT / 2015): “BIG DATA BROTHER: POWER OF TRADING IN THE HANDS OF A FEW”
PROJECT HTTP://HFT.EXCHANGE
ARRAY RESOLUTION
COMPANY HTTP://TRIANGLEINTELLIGENCE.COM