tomography: non-destructive analytical tools for the ... · characterization are of the outmost...
TRANSCRIPT

IntroductionDuring the development of new materials forthe nuclear industry, materials testing andcharacterization are of the outmost importanceto maintain safety standards and reliability. Nocompromise on safety in the workplace in anyarea within the total nuclear fuel cycle can betolerated, and therefore most in-situ materialcharacterization and testing is conducted bycertified and qualified personnel schooled indestructive and non-destructive testing (DTand NDT) methods. Certification and qualifi-cation in NDT can be obtained through manytraining centres in South Africa in accordancewith European, American, and other interna-tional standards (SGS, n.d.; SAIW, n.d.;African NTD Centre, n.d.).
The testing of new methods and materialsrelated to the nuclear fuel cycle is essential forthe continuing development and safety ofnuclear-related materials and processes. Thesefundamental research initiatives are mostlyperformed at the laboratory scale by materialand instrument scientists, researchers, andmost likely postgraduate students.
Davies (2000) describes the role and valueof NDT during maintenance and in-serviceinspection of nuclear power plants duringoutages, and particularly the monitoring ofmaterial degradation to prevent failure.Ultrasonic testing (UT), magnetic testing (MT,)and electrical testing (ET) play a major role asNDT methods for monitoring materialsdegradation in-situ, while atomic- and nuclearphysics-based methods such as positronannihilation, neutron diffraction, as well as X-ray and neutron tomography are limited tolaboratory-scale experimentation. However,conventional film-based X-ray and gamma-rayradiography (RT) techniques are being appliedthroughout many areas of material testing inthe nuclear fuel cycle.
The ‘nuclear fuel cycle’ refers to the entirerange of activities associated with theproduction of electricity from nuclear fission,entailing (International Atomic EnergyAgency, n.d.):
➤ Mining and milling: from mined uraniumto yellowcake
➤ Conversion: from yellowcake to gas➤ Enrichment: increases the proportion of
the fissile Isotope➤ Deconversion: depleted uranium.➤ Fuel fabrication: UO2 pellets – fuel pins –
fuel elements➤ Electricity generation: fuel burn-up➤ Storage: spent fuel➤ Reprocessing: spent fuel➤ Radioactive waste: safe storage.
The nuclear fuel cycle includes the ‘frontend’, i.e. preparation of the fuel, the ‘serviceperiod’ in which fuel is used in the reactor togenerate electricity, and the ‘back end’, i.e. thesafe management of spent fuel, includingreprocessing and reuse and disposal.
Neutron- and X-ray radiography/tomography: non-destructive analyticaltools for the characterization of nuclearmaterialsby F.C. de Beer*†
SynopsisA number of important areas in nuclear fuel cycle, at both the front endand back end, offer ideal opportunities for the application of non-destructive evaluation techniques. These techniques do not only provideopportunities for non-invasive testing of e.g. irradiated materials, but alsoplay an important role in the development of new materials in the nuclearsector. The advantage of penetrating radiation used as probe in theinvestigation and testing of nuclear materials makes X-ray and neutronradiography (2D) and tomography (3D) suitable for various applicationsin the total nuclear fuel cycle. The unique and different interaction modesof the two radiation probes with materials provide several opportunities.Their complementary nature and non-destructive character makes themmost suitable for nuclear material analyses, analytical methoddevelopment, and the evaluation of the performance of existing nuclearmaterial compositions. This article gives an overview of the X-ray andneutron radiography/tomography applications in the field of nuclearmaterial testing, and highlights a few of the success stories. Severalselected areas of application in the nuclear fuel cycle are discussed toillustrate the complementary nature of these techniques as applied tonuclear materials.
Keywordsneutron radiography, X-ray radiography, SAFARI-1; non-destructivetesting.
* Radiation Science Department, Necsa, Pelindaba.† School of Chemical and Minerals Engineering,
North-West University, Potchefstroom.© The Southern African Institute of Mining and
Metallurgy, 2015. ISSN 2225-6253. Paper receivedAug. 2015 and revised paper received Aug. 2015.
913The Journal of The Southern African Institute of Mining and Metallurgy VOLUME 115 OCTOBER 2015 ▲
http://dx.doi.org/10.17159/2411-9717/2015/v115n10a3

Neutron- and X-ray radiography/tomography
The general nuclear fuel cycle is schematically depicted inFigure 1, showing the various activities in the production ofenergy through the nuclear fission process. Every activityrequires conventional NDT techniques to be conducted tomaintain the safe working and operation of the plants andfacilities. The standard NDT methods applied to e.g.inspection of welds in piping, are (Willcox and Downes, n.d):
➤ Radiography testing (RT)➤ Magnetic particle crack detection (MT)➤ Dye penetrant testing (PT)➤ Ultrasonic flaw detection (UT)➤ Eddy current and electromagnetic testing (ET).
This paper does not focus on the so-called conventionalNDT techniques and their application in the nuclear sector,but rather on the non-conventional NDT techniques that areused as needed, and which constitute important researchtools. In particular, penetrating radiation probes as realized inradiography/tomography are described with specificapplications in material research. Quantitative and/orqualitative data obtained through applying these noveltechniques in a laboratory environment adds value to manyareas within the nuclear sector. The following specificactivities, ranging from mining the ore to security of thewaste generated, and where radiography and tomography areapplied, are highlighted in this paper:
➤ Mining and geosciences: quantification of ore deposits➤ Fuel fabrication: development and testing of new
materials ➤ Electricity generation: fuel rod performance ; post-
irradiation examination (PIE) ➤ Radioactive waste: safe storage, civil engineering.
Analytical methods based on penetrating radiation Information about the internal structures of objects, forexample the hydrogen content of Zr cladding, can be obtainedby destructive analytical methods, e.g. cutting a the fuel rodin a 2D plane for analysis by electron microscopy, or sieveanalysis for particle size distribution of a soil sample. In mostcases, once the sample has been destroyed, no otheranalytical tests are possible and the larger picture (volumetrichydrogen distribution and particle size distribution in thesoil) is lost.
More valuable, unique, and in some cases more accurateresults can be obtained only when three-dimensionalinformation is available. For research purposes the mostacceptable way to obtain information while maintaining thesample integrity is to apply a non-destructive test usingpenetrating radiation (either with X-rays, gamma rays, orneutrons). It is worthwhile to mention that the neutron, thefission product of the nuclear fuel cycle, can be used as aprobe to investigate the integrity of the nuclear fuel itself.After irradiation the physical condition of fuel pellets, whilestill intact in the fuel pin, can be obtained only by means ofradiography. This manner of non-invasive investigationkeeps the sample intact, leaves the sample in its originalform, and it is possible for other tests to be conductedsubsequently on the real sample as if it was not touched. Thenon-invasive process allows for the generation of valuablequalitative information. However, when digital data istransformed into three-dimensional tomographic data(Banhard, 2008), it is possible to obtain high-resolutionquantitative information of the internal structures andproperties of the object. An example is the volumetric poresize distribution of voids within nuclear-encapsulatingconcrete matrixes, as well as their physical distributionthroughout the sample (McGlinn et al., 2010).
X-ray, gamma-ray, and neutron radiation are attenuated(absorbed and scattered by the sample) according to anexponential law (De Beer, Middleton, and Hilson, 2004):
[1]
where I is the intensity of the transmitted radiation beam, I0the intensity of the incident radiation beam, µ the attenuationcoefficient (cm2/g) of the material under investigation for thespecific radiation type, ρ the density of the sample (g/cm3),and x the thickness of the sample (cm).
The attenuation coefficient µ expresses the totalattenuation, due to both the scattering and capture processesfor the incident radiation. The term µρ is also called the totalabsorption coefficient of the sample. We assume that thequantity µρ is linearly related to its constituents:
[2]
where µi is the radiation attenuation coefficient of constituenti, ρi the density of constituent i, Vi the volume fraction ofconstituent i, and ∑ the summation symbol for the ithcomponents. Composites of materials will thus have adifferent radiation attenuation property from the individualelements.
The parameters I(E), I0(E), and µ(E) reflect radiationenergy dependency. This dependency, in a radiography
▲
914 OCTOBER 2015 VOLUME 115 The Journal of The Southern African Institute of Mining and Metallurgy
Figure 1 – Schematic depiction of the nuclear fuel cycle (Pixshark, n.d.)

context, means that materials will attenuate differentradiation types by different magnitudes and thus will yielddifferent radiological images, and also that an element hasdifferent attenuation properties at different energy levels forthe same radiation type. This implies that an element can betransparent to fast neutrons (MeV energies) but can bedetected easily using thermal neutrons (eV energies). Anexample is the thermal neutron scattering and absorption ofhydrogen and boron (Domanus, 1992).
Although the basic interaction of X-rays and neutronswith the elements differs, the principle of conductingradiography to obtain a two-dimensional radiograph/imageof the sample is the same. Figure 2 schematically illustratesthe basic components and layout of a radiography facility.
A source of radiation emits penetrating radiation towardsa sample. For example, a sample contains either a defect, aninclusion of another material, or a void that is abnormal forthe sample, or an area that differs completely in terms ofcomposition from the basic matrix of the sample, whichresults in a lower or higher density at the location within thesample. The incident radiation will be attenuated (scatteredand/or absorbed) differently due to the abnormality. Asensitive area detector, with a high quantum efficiency forthe detection of the specific type of penetrating radiation,registers the difference in attenuated radiation that haspassed through the sample. The 2D data (image) obtained by
the detector is called a radiograph and contains the integratedradiation transmitted information for the total sample in acertain orientation with respect to the source and detectorconfiguration.
The information captured in the radiograph differs inprinciple for X-ray and neutron radiography/tomography.The two probes are mostly utilized within the nuclear fuelcycle as non-destructive techniques in research and fornuclear material qualification and quantification. Theseprinciples are discussed in more detail in the followingparagraphs.
X-ray radiographyX-ray interaction with materials depends on the density ofthe sample – i.e. the electron cloud density (Banhard, 2008).The area detector registers a two-dimensional image(radiograph) of the object representing the internal structuredensity. Elements with low electron densities are not easy toresolve in a radiograph, but they are easily penetrated toreveal denser materials embedded within the sample matrix.Figure 3 presents the different X-ray attenuation coefficients(cm-1) for 125 kV X-rays for the full spectrum of elements inthe periodic table. It clearly shows the increase in absorptionof X-rays (darker shading) at higher atomic numbers.
Neutron radiographyThe interaction of neutrons with materials is totally differentto that of X-rays, since neutrons, being neutral particles,interact only with the nucleus of the atom. Neutrons are notaffected by even a dense electron cloud, e.g. of a lead atom(µρn = 0.38 cm-1). The thermal neutron attenuation coeffi-cients depicted in Figure 4 shows a totally different, and insome instances an opposite attenuation capability (greyscale) to that for X-rays (Figure 3). Hydrogen, as a highlyattenuating material (µρn = 3.44 cm-1), will be easy to detectand clearly visible on a neutron radiograph when embeddedin e.g. a ZrTM (µρn = 0.29 cm-1) fuel pin, which is nearlytransparent to neutrons. A radiograph with low- tointermediate-energy X-rays is possible as the ZrTM tube (µρX= 2.47 cm-1) attenuates most of the X-ray radiation and withno photons remaining, the H (µρX = 0.02 cm-1) cannot beregistered/detected on the X-ray radiograph.
Neutron- and X-ray radiography/tomography
915The Journal of The Southern African Institute of Mining and Metallurgy VOLUME 115 OCTOBER 2015 ▲
Figure 3 – Periodic table with X-ray attenuation coefficients of the elements for 125 kV X-ray energies (Grünauer, 2005)
Figure 2 – Principle and layout of a 2D radiography set-up. A similarset-up is used for tomography, with the sample rotating in the radiationbeam (Domanus, 1992)

Neutron- and X-ray radiography/tomography
TomographyThe word ‘tomography’ comes from the Greek words ‘to cutor section’ (tomos) and ‘to write’ (graphein) (Banhard,2008). Tomography is also known as computer tomography(CT) or computer assisted tomography (CAT) as in diagnosticinvestigations in the medical field. For the purpose of thisarticle, the following semantics are adopted: CT in generaldescription, XCT for X-ray computer tomography, and NT forneutron tomography. CT is a radiographic inspection methodthat uses a computer to reconstruct an image of a cross-sectional plane (slice) through an object (ISO 15708-1). Theresulting cross-sectional image is a quantitative map of thelinear radiation attenuation coefficient, µ, at each point in theplane. The linear attenuation coefficient characterizes thelocal instantaneous rate at which the incident radiation isattenuated during the scan, by scatter or absorption, as itpropagates through the object.
To obtain this ‘map’, the sample is radiographed and thusprojection data is gathered from multiple directions throughmany angles of the sample. For the purpose of this article, nodetailed description of the 3D reconstruction process of thesample is presented. To put it simply, multiple 2D-projectionsare fed into a dedicated computer with a specialized computeralgorithm to create cross-sectional planes of the sample.When these cross-sectional planes are stacked together, a fullvirtual three-dimensional image (tomogram) of the samplecan be viewed and analysed.
Application of radiography and tomography withinthe nuclear fuel cycleIn each of the following sectors of the nuclear fuel cycle,radiography and/or tomography have been applied usingeither X-rays or neutrons. In some areas the application waspioneered in the early second half of the 20th century bymeans of film techniques. The techniques applied and thedescription thereof is not within the scope of this article.However, the outcomes of these film-based investigationsand the results obtained will be described, together with therecent digital methods in this field.
MiningX-ray-, gamma-ray, and neutron tomography havedemonstrated their potential in the earth sciences asimportant diagnostic tools to generate volumetric data ongeological compositions, especially advances in the areaborehole core investigations, as depicted in Figure 5. Thisaspect is being explored further with optimum resolutionobtained through the application of micro-focus X-raytomography, as CT complements conventional destructiveanalytical thin-sectioning of drill core samples (De Beer andAmeglio, 2011).
The raw material for nuclear fuel is uranium, which is arelatively common element that can be found throughout theworld. Uranium is present in most rocks and soils, in manyrivers, and in seawater. Uranium is about 500 times moreabundant than gold and about as common as tin.
The largest producers of uranium are currently Australia,Canada, and Kazakhstan, with Namibia rated 5th and SouthAfrica 11th globally (World Nuclear Association, 2015). The
▲
916 OCTOBER 2015 VOLUME 115 The Journal of The Southern African Institute of Mining and Metallurgy
Figure 4 – Periodic table with thermal neutron energy attenuation coefficients of the elements (Grünauer, 2005)
Figure 5 – Left: the grouped pyroxene mineral (coloured red) can beclearly seen in norite (top), and different concentration of feldspar areobserved in anorthosite (bottom) in a thin slice. Right: transparentcorresponding neutron tomograms. The minerals shown are onlypyroxenes that are present in both norite and anorthosite but atdifferent concentrations [archives from Necsa’s Nrad and MIXRADsystem]
concentration of uranium in the ore can range from 0.03 to20%. Conventional mining is by open cut or undergroundmethods. Uranium ore can be produced from a mine specif-ically for uranium, or as a by-product from mines with adifferent main product such as copper, phosphate, or gold(International Atomic Energy Agency, n.d.).
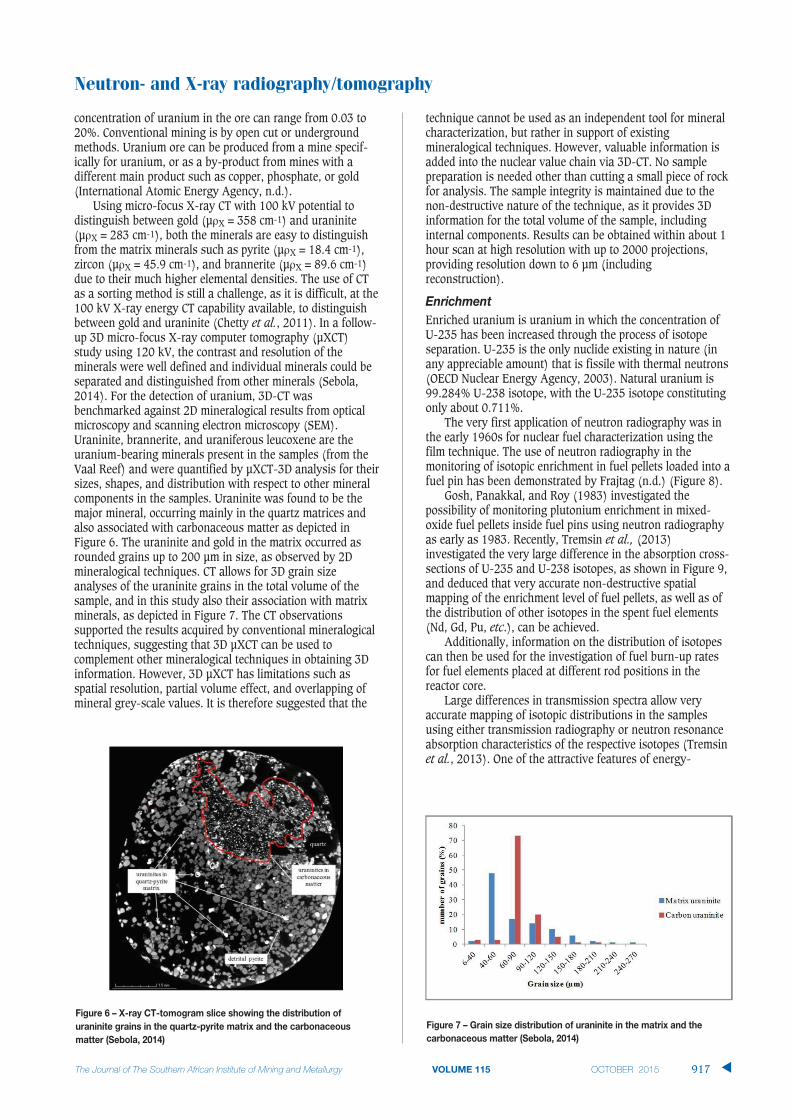
Using micro-focus X-ray CT with 100 kV potential todistinguish between gold (µρX = 358 cm-1) and uraninite(µρX = 283 cm-1), both the minerals are easy to distinguishfrom the matrix minerals such as pyrite (µρX = 18.4 cm-1),zircon (µρX = 45.9 cm-1), and brannerite (µρX = 89.6 cm-1)due to their much higher elemental densities. The use of CTas a sorting method is still a challenge, as it is difficult, at the100 kV X-ray energy CT capability available, to distinguishbetween gold and uraninite (Chetty et al., 2011). In a follow-up 3D micro-focus X-ray computer tomography (µXCT)study using 120 kV, the contrast and resolution of theminerals were well defined and individual minerals could beseparated and distinguished from other minerals (Sebola,2014). For the detection of uranium, 3D-CT wasbenchmarked against 2D mineralogical results from opticalmicroscopy and scanning electron microscopy (SEM).Uraninite, brannerite, and uraniferous leucoxene are theuranium-bearing minerals present in the samples (from theVaal Reef) and were quantified by µXCT-3D analysis for theirsizes, shapes, and distribution with respect to other mineralcomponents in the samples. Uraninite was found to be themajor mineral, occurring mainly in the quartz matrices andalso associated with carbonaceous matter as depicted inFigure 6. The uraninite and gold in the matrix occurred asrounded grains up to 200 µm in size, as observed by 2Dmineralogical techniques. CT allows for 3D grain sizeanalyses of the uraninite grains in the total volume of thesample, and in this study also their association with matrixminerals, as depicted in Figure 7. The CT observationssupported the results acquired by conventional mineralogicaltechniques, suggesting that 3D µXCT can be used tocomplement other mineralogical techniques in obtaining 3Dinformation. However, 3D µXCT has limitations such asspatial resolution, partial volume effect, and overlapping ofmineral grey-scale values. It is therefore suggested that the
technique cannot be used as an independent tool for mineralcharacterization, but rather in support of existingmineralogical techniques. However, valuable information isadded into the nuclear value chain via 3D-CT. No samplepreparation is needed other than cutting a small piece of rockfor analysis. The sample integrity is maintained due to thenon-destructive nature of the technique, as it provides 3Dinformation for the total volume of the sample, includinginternal components. Results can be obtained within about 1hour scan at high resolution with up to 2000 projections,providing resolution down to 6 µm (includingreconstruction).
EnrichmentEnriched uranium is uranium in which the concentration ofU-235 has been increased through the process of isotopeseparation. U-235 is the only nuclide existing in nature (inany appreciable amount) that is fissile with thermal neutrons(OECD Nuclear Energy Agency, 2003). Natural uranium is99.284% U-238 isotope, with the U-235 isotope constitutingonly about 0.711%.
The very first application of neutron radiography was inthe early 1960s for nuclear fuel characterization using thefilm technique. The use of neutron radiography in themonitoring of isotopic enrichment in fuel pellets loaded into afuel pin has been demonstrated by Frajtag (n.d.) (Figure 8).
Gosh, Panakkal, and Roy (1983) investigated thepossibility of monitoring plutonium enrichment in mixed-oxide fuel pellets inside fuel pins using neutron radiographyas early as 1983. Recently, Tremsin et al., (2013)investigated the very large difference in the absorption cross-sections of U-235 and U-238 isotopes, as shown in Figure 9,and deduced that very accurate non-destructive spatialmapping of the enrichment level of fuel pellets, as well as ofthe distribution of other isotopes in the spent fuel elements(Nd, Gd, Pu, etc.), can be achieved.
Additionally, information on the distribution of isotopescan then be used for the investigation of fuel burn-up ratesfor fuel elements placed at different rod positions in thereactor core.
Large differences in transmission spectra allow veryaccurate mapping of isotopic distributions in the samplesusing either transmission radiography or neutron resonanceabsorption characteristics of the respective isotopes (Tremsinet al., 2013). One of the attractive features of energy-
Neutron- and X-ray radiography/tomography
The Journal of The Southern African Institute of Mining and Metallurgy VOLUME 115 OCTOBER 2015 917 ▲
Figure 6 – X-ray CT-tomogram slice showing the distribution ofuraninite grains in the quartz-pyrite matrix and the carbonaceousmatter (Sebola, 2014)
Figure 7 – Grain size distribution of uraninite in the matrix and thecarbonaceous matter (Sebola, 2014)

Neutron- and X-ray radiography/tomography
resolved neutron radiography is the ability to enhancecontrast, and in some cases enable quantification, as shownin Figure 10. It was observed that the contrast between thepellets of different density depends strongly on the range ofneutron energies used. The more thermal part of the beamspectrum (neutron energies above 19.7 MeV) reveals thepellet with the lowest density as an object with the highesttransmission. The coldest part of the neutron spectrum(neutron energies even below 6 MeV) shows the least densepellet as a darkest in the assembly.
Nuclear fuel fabrication and testing (I & PIE)Nuclear fuel types range from isotopic sources in a form ofsalt or disks to pressurized water reactor (PWR) fuel in theform of UO2 fuel pellets inside ZrTM -cladded fuel pins.Nuclear fuel is subjected to stringent manufacturing and
performance criteria which have to be verified. Non-destructive testing of the fuel ensures that other tests can beperformed subsequently and that the material can still beapplied in its specific environment. Some of the NDT tests areapplied to characterize and/or quantify the integrity of thefuel or as quality assurance tests. X-ray radiography cannotbe used for irradiated fuel inspection, whereas neutronradiography becomes possible due to the following reasons(Lehmann, Vontobel, and Hermann, 2003):
➤ Uranium has a very high attenuation coefficient for X-rays (about 50 cm-1 at 150 keV). The diameter of fuelpellets is in the order of 10 mm and penetration by X-rays is impossible. High-energy gamma radiation (>1MeV) is, however, suitable for quality control of freshfuel pellets
➤ The neutron attenuation coefficient for the natural
▲
918 OCTOBER 2015 VOLUME 115 The Journal of The Southern African Institute of Mining and Metallurgy
Figure 8 – Neutron radiograph (film) of fresh fuel pellets in a fuel pin with varying degrees of isotopic U-235 enrichment. Pellets with higher enrichmentappear darker (Frajtag, n.d.)
Figure 9 – Neutron attenuation of 100 µm thick U-235 and U-238 isotopes calculated from the tabulated data on the total cross-sections as a function ofneutron energy (Tremsin et al., 2013)
Figure 10 – Thermal neutron transmission radiographs obtained by grouping the energy-resolved images of different neutron spectra. The ranges ofneutron energies used to build each radiograph are shown in the respective legends (Tremsin et al., 2013)

composition of uranium is low (0.8 cm-1) and it is easyto transmit neutrons through thicker assemblies
➤ U-235 and U-238 have very different interactions withthermal neutron beams. Due to the 60 times highercross-section of U-235, it is very easy to distinguishbetween the two isotopes and to quantify the amountof the fissile isotope U-235
➤ Lead is used as shielding material around fuel samplesfor radiation protection purposes, and thus X-rayradiography fails in transmission experiments.Neutrons, on the other hand, penetrate lead shieldingwith a thickness of about 15 cm and allow neutronradiography investigations
➤ Additional substitutes in fuel compositions, which arein use as burnable poisons but are strong neutronabsorbers (e.g. B, Li-6, Dy, or Gd), are easily identifiedwith neutron methods
➤ After long-term exposure, hydrogen can be found inthe cladding outer region of fuel rods under somecircumstances. X-ray radiography fails to visualizethese material modifications because of the very lowcontrasts obtained for elements with with low atomicnumbers. Neutrons, on the other hand, have a highsensitivity for hydrogen, thus allowing quantificationof the hydrogen content in cladding.
IsotopesCharacterization of isotopic sources is a demanding anddifficult task due to their physical size and natural radioac-tivity, which makes visual inspection impossible. Hoffman(2012) investigated a small radioactive radium source usinghigh-resolution micro-focus X-ray tomography to determinewhether the sample contained a powdered form of radioactivematerial or whether it was solid. The source contained 20 mgof radium and was in a form of a needle with a diameter ofabout 1 mm and about 8 mm in length – all sealed within aglass tube. Figure 11 is an XCT tomogram of the ampouleshowing its serial number clearly on the outside, while Figure12 is a slice from the 3D tomogram revealing the position ofthe radioactive material inside the needle.
Valuable metrology quantitative information could bededucted from the 3D tomogram of the isotope (Table I). Themost important aspect for further processing of the isotope isthe quantification of the volume of radioactive salt present inthe needle.
Nuclear fuelA major field of neutron radiography application is theinspection of nuclear fuel and control rods, reactor materialsand components, and of irradiation devices for the testing ofnuclear fuels and materials. The fuel rods are used underextreme conditions such as very high power density,
temperature, pressure, and radiation level. Thermal neutronradiography investigations were conducted with the conven-tional film technique due to the radioactivity of the objects.The following issues are addressed through the use ofneutron radiography: (a) condition of the fuel assembly,including fuel rod condition, (b) detection of leaks such asingress of water, and (c) quality control, including functionaland dimensional evaluation and inspection of irradiationdevices and components. Figure 13 shows a neutronradiograph of a fuel pin with pelletized fuel as fabricated(Domanus, 1992).
Due to the high radioactivity of nuclear fuel afterirradiation, X-ray radiography cannot be used as an investi-gation technique. Investigations are done within a hot-celllaboratory set-up, which allows for the remote handling ofthe radioactive fuel (Klopper, De Beer, and Van Greunen,1998). A research reactor is normally an extension of a hot-cell laboratory, as neutron radiography is one of the majoranalytical probes in the post-irradiation examination (PIE) ofnuclear fuel. Typical findings using neutron radiography asan analytical probe on irradiated fuel pins are the condition ofthe fuel pellets and of the ZrTM -cladding material.
Fuel pellet investigations reveal fabricated conditionssuch as cracks, chips, change of shape or location, voids,inclusions, corrosion, nuclear properties, and coolant. Figure14 shows examples of these findings on film neutronradiographs.
Neutron- and X-ray radiography/tomography
The Journal of The Southern African Institute of Mining and Metallurgy VOLUME 115 OCTOBER 2015 919 ▲
Figure 11 – µXCT of a Ra isotopic source ampule (Hoffman, 2012)
Table I
Quantitative information deducted from the XCT
Description: Information Value Unit
Needle inscription 100 µgOfficial source activity 20 mCiContact dose rate 1.1 mSv/hDiameter of tube 1.67 mmDiameter of internal void 1.03 mmLength of tube 9.72 mmLength of internal void 7.57 mmWall thickness 0.34 mmLength of salt 3.01 mmInner volume 6.31 mm3
Volume of salt 2.51 mm3
Figure 12 – Slice of µXCT tomogram with enlarged end pugs revealingRa isotope internal information (Hoffman, 2012)

Neutron- and X-ray radiography/tomography
Domanus (1992) describes a number of other fuel pelletproperties revealed by neutron radiography, including centralvoids and the accumulation of Pu in the central void. Fuel rodinspections include deformed cladding, hydrides in cladding,plenum and spring, dislocated disks, condition of the bottomplug, and a picture of a melted thermocouple inside the fuelrod. Lehmann, Vontobel, and Hermann (2003) report on theextensive utilization of the NEUTRA and ICON neutronradiography (Nrad) facilities at Paul Sherrer Institute inSwitzerland, where a dedicated detection station is availablefor the inspection of irradiated fuel assemblies. Aspects suchas fuel enrichment, fuel poisoning, and hydrogen content inthe fuel cladding are being addressed and investigated byneutron radiography. Due to the importance of fuel claddinginvestigations, the utilization and function of neutronradiography is addressed in the following paragraph.
Hydrogen embrittlementIt is well known that hydrogen agglomeration is deleteriousin any material. More than a few hundred ppm hydrogen inthe cladding surface of fuel rods at compromises thestructural stability of the cladding tube significantly, with theconsequence of possible failure, especially when mechanicalloading is also involved. The ability of neutrons to penetrateuranium is considerably higher than for X-rays and allowsfor the structures of the nuclear fuel rods to be inspected.Furthermore, the probability of neutron interaction withhydrogen is very high, while for X-rays it is effectively zero.This allows neutron radiography to be effectively utilized for
the study of even small quantities of hydrogen ingress in thecladding, which is an important mechanism for claddingembrittlement, as depicted in Figure 15.
Furthermore, through proper characterization and withthe aid of digital radiographs, Nrad allows for the investi-gation of the absolute hydrogen content and its distribution.in situ investigations provide new information about thekinetics of hydrogen uptake during steam oxidation and ofhydrogen diffusion in zirconium alloys. Nrad-studies are theonly way to investigate and understand the phenomenon ofhydrogen ingress in the ZrTM cladding. A linear dependenceof the total macroscopic neutron cross-section on the H/ZrTM
atomic ratio, as well as on the oxygen concentration, wasfound, while no significant temperature dependence of thetotal macroscopic neutron cross-sections of hydrogen andoxygen was found, depending that zirconium and oxygen donot change their structures. Additionally, it was found thatrapid hydrogen absorption takes place in the absence of theoxide layer covering the metallic surface of the ZrTM cladding(Grosse et al., 2011). Figure 16 displays the results of in-situNrad investigations of hydrogen uptake during steamoxidation with the time dependence of hydrogen concen-tration of ZrTM-4 materials at 1273 K and higher, where avery rapid hydrogen uptake was found in the first couple ofseconds after the steam flow was switched on. At temper-atures of about 1273 K a phase transformation occurs and isaccompanied by a volume change and the formation of apronounced crack structure. When the cracks are formed, the
▲
920 OCTOBER 2015 VOLUME 115 The Journal of The Southern African Institute of Mining and Metallurgy
Figure 13 – Neutron radiograph of nuclear fuel prior to irradiation (Domanus, 1992)
Figure 14 – Neutron radiographs (film prints) of irradiated nuclear fuel and their conditions (Domanus, 1992). Top: random cracks in pellets, middle: typicallongitudinal cracks in pellets

hydrogen uptake increases by nearly an order of magnitude(Grosse et al., 2008; Grosse, 2010). The decrease inhydrogen concentration is due to the consumption of the ß-ZrTM phase, which contains most of the absorbedhydrogen.
Pebble bed modular reactor (PBMR) fuelFigure 17 shows the composition of a 60 mm outer diameterhigh-temperature reactor (HTR) fuel pebble consisting ofthousands of 0.5 mm diameter low-enriched uranium oxidefuel particles with a tri-structural isotropic (TRISO) coating,embedded in a graphitic matrix. The pebble was analysedusing X-ray tomography technique prior to irradiation at the
SANRAD facility located at the SAFARI-1 nuclear researchreactor in South Africa. The aim of the investigation was toobserve the homogeneity of the TRISO particles within thecarbon matrix and to direct the manufacturing process toensure the centralization of the fuel within the carbon matrix
(Necsa, 2006). Figure 18 shows the misalignment of the fuelwithin the carbon matrix of the fuel pebble as well as thelocation and identification of a TRISO particle within the fuel-free zone. The inhomogeneous distribution of the TRISOparticles at the top of the fuel pebble can be clearly seen.Three-dimensional quantitative data of the misalignment of thefuel particles becomes available in the tomograms and ispresented in Figure 19, showing the extent of correction in X-,Y- and Z-directions to be introduced in the manufacturingprocess of the fuel pebble.
Lehmann, Vontobel, and Hermann (2003) reported thesuccessful application of neutron tomography to the 3Dscanning of PBMR fuel pebbles at the NEUTRA facility of theSINQ spallation source at PSI in Switzerland (see Figure 20). Asphere-type fuel element from the high-temperature reactor(HTR) programme was studied with neutron tomography. Thissample is 6 cm in diameter and contains about 8500 individualfuel pebbles (diameter 0.5 mm). No shielding of the fresh fuelelement was necessary for the tomographic inspection. Theinvestigation was aimed at the visualization of the 3D distri-bution of the fuel particles in the graphite matrix in order todetermine its uniformity and the fuel sphere’s content of fissilematerial.
TRISO fuel particles are an integral part of the fuel designfor current and future HTRs. A TRISO particle comprises fourconcentric spherical layers encasing a fuel kernel, namely thebuffer (porous carbon), inner pyrolytic carbon (IPyC), siliconcarbide (SiC), and outer pyrolytic carbon (OPYC) layers (seeFigure 17). Each layer performs specific functions. The fuelkernel, consisting of uranium or uranium carbide, provides thefissile material and retains some of the fission products. Thebuffer layer, a highly porous carbon structure, provides somefree volume for gaseous fission products, and protects the SiClayer from damage by high-energy fission products. The IPyClayer provides structural support for the subsequent SiC layerand prevents the chlorine compounds required for SiCdeposition interacting with the fuel kernel. The SiC layer forms
Neutron- and X-ray radiography/tomography
The Journal of The Southern African Institute of Mining and Metallurgy VOLUME 115 OCTOBER 2015 921 ▲
Figure 15 – Neutron radiograph of nuclear fuel and cladding material showing (black spots) hydrogen accumulation within the ZrTM tubing (Frajtag, n.d.)
Figure 16 – Neutron radiography (Nrad) investigation: kinetics ofhydrogen uptake and release during steam oxidation (Frajtag, n.d.)
Figure 17 – Composition of PBMR fuel (Weil, 2001)

Neutron- and X-ray radiography/tomography
the main diffusion barrier for fission products. It acts as apressure vessel, providing mechanical strength for the particleduring manufacture of the nuclear fuel compact or pebble bed.The OPyC layer protects the SiC layer during fuel fabrication asthe TRISO particle is pressed into a larger fuel compact orpebble.
Lowe et al., (2015) examined the applicability of multi-scale X-ray computer tomography (CT) for the non-destructivequantification of porosity and thickness of the various layers ofTRISO particles (see Figure 21) in three dimensions, andcompared this to the current destructive method involvinghigh-resolution SEM imaging of prepared cross-sections.
An understanding of the thermal performance andmechanical properties of TRISO fuel requires a detailedknowledge of pore sizes, their distribution, and interconnec-tivity. Pore size quantification (false color coding) and distri-bution in an X-ray tomogram of the SiC (D) and OPyC (E)layers within a TRISO particle is shown in Figure 22.
Direct comparison with SEM sections indicates thatdestructive sectioning can introduce significant levels of coarsedamage, especially in the pyrolytic carbon layers. Since it isnon-destructive, multi-scale time-lapse X-ray CT opens thepossibility of intermittently tracking the degradation of TRISOstructure under thermal cycles or radiation conditions in orderto validate models of degradation such as kernel movement. X-ray CT in situ experimentation on TRISO particles under loadand temperature could also be used to understand the internalchanges that occur in the particles under accident conditions.
Research reactor control rod verificationNrad is being applied as a verification and analytic techniqueat the SAFARI-1 nuclear research reactor on the control rods
▲
922 OCTOBER 2015 VOLUME 115 The Journal of The Southern African Institute of Mining and Metallurgy
Figure 18 – X-ray tomography of a PBMR fuel pebble. Left: the non-centralized fuel sphere within the carbon matrix. Right: Location andidentification of a TRISO particle inside the fuel-free zone (Necsa, 2006)
Figure 19 – Graphical presentation of the deviation of the fuel zone of aBPMR pebble from the centre of the carbon matrix in three dimensions(Necsa, 2006)
Figure 20 – Neutron tomogram generated at PSI, Switzerland showingthe exact location and homogeneity of the TRISO (Lehmann, Vontobel,and Hermann, 2003)
Figure 21 – Micro-focus X-ray radiograph of a TRISO particle (Necsa)
Figure 22 – Xradia VersaXRM orthoslice showing the SiC (D) and OPyC(E) layers with the pore volumes superimposed. Pore diameter is colour-coded to identify large pore clustering (Lowe et al., 2015)

prior to their installation in the core of the reactor. Thequality control assurance test entails the verification of theneutron attenuation cross-section of the control rod against astandard consisting of Cd. The inspection entails a visualclarification of the attenuation of the thermal neutrons byinspection of the neutron radiograph of the control rod.Additionally, due to the digital radiography capability of theneutron camera detection system, the first-order neutrontransmission calculation can be made using the pixelgreyscale values on the radiographs of both the standard andcontrol rod sample. Pixel greyscale values represent a linearrelationship in the neutron attenuation of materials. In thisinstance a dramatic decline in greyscale pixel values is seendue to the high thermal neutron absorption by the Cd section(µρn =115.11cm-1) of the control rod. Neutron radiographs ofthe Cd standard and a control rod are depicted in Figure 23.
Radioactive wasteLow- and intermediate-level nuclear waste is normallyencapsulated in in some form of barrier to protect the wastefrom the environment and vice versa. Intermediate-levelnuclear waste is firstly encapsulated in a steel drum,compressed, and finally embedded normally in a concrete drumand safely stored underground in a remote location such asVaalputs in the Karoo region in South Africa (Necsa, n.d. (b))(see Figure 24). A site is normally chosen with low rainfall andsuitable surface and groundwater conditions.
Concrete is a porous medium and the characterization oftransport of water through concrete structures is well describedby De Beer, Strydom and Griesel (2004) and De Beer, Le Rouxand Kearsley (2005). It is especially important to understandthe transport of water through concrete because nearly allconcrete structures contain steel reinforcing, and in the case ofnuclear waste, intermediate-level nuclear waste in compressedsteel drums. When cracks in the concrete, caused by thetransport of liquid through it, reach the reinforcing, anenvironment conductive to the corrosion of steel is created.Corrosion affects the strength of the structural members, as thesteel is a major contributor to the tensile and compressivestrength of the members. Severe leakage of radioactivematerials into the surrounding environment is thus possible ifthe integrity of the concrete barrier is compromised.
Neutron radiography studies of concrete and mortarsenable the direct physical visualization and quantitativedetection of water inside concrete structures. The physical
properties of concrete such as porosity, permeability, andsorping characteristics are obtained through applying neutronradiography as a non-destructive analytic tool. The aim ofthese investigations is to maximize the properties to preventwater sorption and leaching of concrete structures and optimizeone of the physical properties which is sometimes neglected inthe criteria to develop structures for nuclear waste encapsu-lation (De Beer, Strydom and Griesel, 2004 ; De Beer, Le Rouxand Kearsley, 2005). To improve the durability of concrete, thecapillary and pore size within the concrete matrix must berestricted to a minimum. This is why hydration as well as W/Cratio properties is of great importance, and creates thus anideal opportunity for neutron radiography to play a role inobtaining the needed information in a non-destructive mannerto optimize these parameters. The visualization of the sorptionof water by means of neutron tomography of a laboratory-sizeconcrete structure is depicted in Figure 25.
ConclusionsX-ray and neutron radiography in two or three dimensionsplay an important role in many dedicated areas within thenuclear fuel cycle. The advantage of these methods is theircompletely non-destructive nature. Visualization of thestructure of samples, as well as quantitative description, areimportant aspects in materials research. The important roles ofX-ray and neutron radiography/tomography as non-invasiveanalytic techniques within specific areas within the nuclear fuel
Neutron- and X-ray radiography/tomography
The Journal of The Southern African Institute of Mining and Metallurgy VOLUME 115 OCTOBER 2015 923 ▲
Figure 23 – Neutron radiographs of a Cd standard (left) and control rod(right) showing Cd (black) indicating high thermal neutron absorbingmaterials (Necsa, 2010 (a))
Figure 25 – Neutron radiographs showing the effect of 70%, 60%, and50% W/C ratio on the sorptivity of water into a concrete slab (De Beer,Strydom and Griesel, 2004)
Figure 24 – Vaalputs intermediate-level waste storage site, South Africa(Necsa)

Neutron- and X-ray radiography/tomography
cycle should not be underestimated. X-rays and neutrons areproduced by very different methods, and also interact withmaterials in different manners. In the nuclear environment,each type of radiation has its own field of utilization due totheir different characteristics, but in some instances theirapplications complement each other to reveal comprehensiveinformation.
Neutron transmission analysis is a very helpful tool toobtain information on the properties of, and changes in,nuclear fuel material. Scientists and researchers in thegeosciences in South Africa have, in the availability of thetomography facilities at Necsa, the capabilities to conductquantitative analytical measurements at state-of-the-artradiation imaging facilities that compare to similar facilitieselsewhere in the world.
Within the mining area, 3D computer tomography showspotential for further development, and can be already used tocomplement and add value to current conventional 2Dmineralogical techniques. Neutron radiography analysis is ableto derive the hydrogen content in fuel cladding both qualita-tively and quantitatively, with high sensitivity and precision.
The results presented here illustrate how recent advancesin laboratory-based X-ray CT instruments allow theexamination of TRISO particles at the nano- and micro-scalesin 3D. In this case study, high-resolution X-ray CT has beenshown to be a viable tool for profiling the TRISO particles intwo important aspects; to characterize the individual TRISOlayers with variations in thickness and their subsequentinteractions, thus allowing manufacturing validation as well asassisting in working towards a mechanistic understanding offabrication and in-service issues.
The availability of these techniques in South Africa opensnew possibilities for research, quantitative analysis, and non-destructive evaluation. National capacity as well as interna-tional trends shows the ability for non-destructive testing ofnuclear materials utilizing penetrating X- ray- and neutronradiation in more comprehensive and unique ways than before.
ReferencesAFRICAN NTD CENTRE. http://www.andtc.com/BANHARD, J. 2008. Advanced Tomographic Methods in Materials Research and
Engineering. Oxford University Press.CHETTY, D., CLARK, W., BUSHELL, C., SEBOLA, P.T., HOFFMAN, J.W., NSHIMIRIMANA,
R.B., and DE BEER, F.C. 2011. The use of 3D X-ray computed tomographyfor gold location in exploration drill cores. Proceedings of the 10thInternational Congress for Applied Mineralogy (ICAM), Trondheim, Norway,1-5 August 2011. pp.129–136. http://www.mintek.co.za/wp-content/uploads/2011/11/ch-17.pdf
DAVIES, L.M. 2000. Role of NDT in condition based maintenance of nuclear powerplant components. 15th World Conference on Non-Destructive Testing,Rome, 15-21 October 2000.http://www.ndt.net/article/wcndt00/papers/idn078/idn078.htm
DE BEER, F.C. and AMEGLIO, L. 2011. Neutron, X-ray and dual gamma-rayradiography and tomography of geomaterial – a South African perspective.Leading Edge, June 2011. Special Edition Africa.
DE BEER, F.C., MIDDLETON, M.F., and HILSON, J. 2004. Neutron radiography ofporous rocks and iron ore. Applied Radiation and Isotopes, vol. 61. pp. 487–495.
DE BEER, F.C., STRYDOM, W.J., and GRIESEL, E.J. 2004. The drying process ofconcrete: a neutron radiography study. Applied Radiation and Isotopes, vol.61, no. 4. pp. 617–623.
DE BEER, F.C., LE ROUX, J.J., and KEARSLEY, E.P. 2005. Testing the durability ofconcrete with neutron radiography. Nuclear Instruments and Methods inPhysics Research A, vol. 542. pp. 226– 231.
DOMANUS, J.C. 1992. Practical Neutron Radiography. Kluwer Academic Publishers. FRAJTAG, P. Not dated. Radiation Protection and Radiation Applications: Gamma
and Neutron Radiography.http://moodle.epfl.ch/pluginfile.php/1593971/mod_resource/content/2/RRA-EPFL- FS2014-Week14a.pdf [Accessed 1 May 2015].
GHOSH, J.K., PANAKKAL, J.P., and ROY, P.R., 1983. Monitoring plutoniumenrichment in mixed-oxide fuel pellets inside sealed nuclear fuel pins byneutron radiography. NDT International, vol. 16, no. 5, October 1983. pp.275–276. DOI: 10.1016/0308- 9126(83)90127-X
GROSSE, M. 2010. Neutron radiography—a powerful tool for fast, quantitative andnon- destructive determination of the hydrogen concentration and distri-bution in zirconium alloys. Proceedings of the 6th International ASTMSymposium on zirconium in the Nuclear Industry, Chengdu, China, 9–13May 2010.
GROSSE, M., VAN DEN BERG, M., GOULET, C., LEHMANN, E., and SCHILLINGER, B. 2011.in situ neutron radiography investigations of hydrogen diffusion andabsorption in zirconium alloys. Nuclear Instruments and Methods in PhysicsResearch, vol. A651. pp. 253–257. doi: 10.1016/j.nima.2010.12.070
GROSSE, M., STEINBRUECK, M., LEHMANN, E., and VONTOBEL, P. 2008. Kinetics ofhydrogen absorption and release in zirconium alloys during steamoxidation. Oxidation of Metals, vol. 70, no. 3. pp. 149–162.
GRÜNAUER, F. 2005. Design, optimization, and implementation of the new neutronradiography facility at FRM-II. Dr. Rer. Nat. dissertation, Faculty of Physics,Technischen Universität München.
HOFFMAN, J.W. 2012. Process description for micro-focus X-ray investigation ofsource at MIXRAD facility. Necsa internal report, DOC NO: RS-MFX-PRO-12002.
INTERNATIONAL ATOMIC ENERGY AGENCY. Not dated. Getting to the Core of the NuclearFuel Cycle. Department of Nuclear Energy, Vienna, Austria.https://www.iaea.org/OurWork/ST/NE/NEFW/_nefw-documents/NuclearFuelCycle.pdf
ISO 15708-1:2002(E). Non-destructive testing — Radiation methods —Computed tomography — Part 1: Principles.
KLOPPER, W., DE BEER, F.C., and VAN GREUNEN, W.S.P. 1998. Overview of hot cellfacilities in South Africa. Proceedings of the European Working Group ‘HotLaboratories and Remote Handling’.
LEHMANN, E.H., VONTOBEL, P., and HERMANN, A. 2003. Non-destructive analysis ofnuclear fuel by means of thermal and cold neutrons. Nuclear Instrumentsand Methods in Physics Research A, vol. 515, no. 3. pp. 745–759. doi:10.1016/j.nima.2003.07.059
LOWE, T., BRADLEY, R.S., YUE, S., BARII, K., GELB, J., ROHBECK, N., TURNER, J., andWITHERS, P.J. 2015. Microstructural analysis of TRISO particles using multi-scale X-ray computed tomography. Journal of Nuclear Materials, vol. 461.pp. 29–36. http://dx.doi.org/10.1016/j.jnucmat.2015.02.034
MCGLINN, P.J., DE BEER, F.C., ALDRIDGE, L.P., RADEBE, M.J., NSHIMIRIMANA, R.B.,BREW, D.R.M., PAYNE, T.E., and OLUFSON, K.P. 2010. Appraisal of acementitious material for waste disposal: neutron imaging studies of porestructure and sorptivity. Cement and Concrete Research, vol. 40. pp. 1320–1326
NECSA. 2006. RT-TVG-06/05: Test Report: X-Ray Radiography of PBMR-FuelSpheres with Zirconium Particles. Internal report, SAMPLE NO: DFS-T-F03G04.
NECSA. 2010 (a). RS-TECH-REP-10004: Neutron Radiography Quality Assurancetest report of neutron absorbing material in Control Rods of the SAFARI-1Nuclear Research Reactor (Lot/Batch No: RT-LOT-10/03). Internal report.
NECSA. Not dated (b). Vaalputs. The National Radioactive Waste Disposal Facility.http://www.radwaste.co.za/vaalputs%20information%20pamflet.pdf.[Accessed 1 May 2015].
OECD NUCLEAR ENERGY AGENCY. 2003. Nuclear Energy Today. OECD Publishing. p. 25.
PIXSHARK. Not dated. http://pixshark.com/images-of-nuclear-fuels.htmSAIW (Southern African Institute of Welding). Not dated. http://www.saiw.co.za/SEBOLA, P. 2014. Characterisation of uranium-mineral-bearing samples in the
Vaal Reef of the Klerksdorp Goldfield, Witwatersrand basin. MSc disser-tation, Faculty of Science, University of the Witwatersrand, Johannesburg.http://wiredspace.wits.ac.za/handle/10539/16820?show=fullhttp://hdl.handle.net/10539/16820
SGS SOUTH AFRICA (PTY) LTD. Not dated. http://www.sgs.co.za/en.aspxTREMSIN, A.S., VOGEL, S.C., MOCKO, M., BOURKE, M.A.M., YUAN, V., NELSON, R.O.,
BROWN, D.W., and FELLER, B. 2013. Non-destructive studies of fuel pellets byneutron resonance absorption radiography and thermal neutronradiography. Journal of Nuclear Materials, vol. 440. pp. 633–646.
WEIL, J. 2001. Pebble-bed design returns. Nuclear Power gets a Second Look.IEEE Spectrum Special Report. http://spectrum.ieee.org/energy/nuclear/pebblebed-design-returns [Accessed 20 June 2015].
WILLCOX, M. and DOWNES, G. Not dated. A brief description of NDT techniques.Insight NDT, paper T001.http://www.turkndt.org/sub/makale/ornek/a%20brief%20description%20of%20ndt.pdf
WORLD NUCLEAR ASSOCIATION. 2015. http://www.world- nuclear.org/info/Nuclear-Fuel-Cycle/Mining-of-Uranium/World-Uranium-Mining- Production/[Accessed 13 May 2015]. ◆
▲
924 OCTOBER 2015 VOLUME 115 The Journal of The Southern African Institute of Mining and Metallurgy