togo: 2013 article iv consultation; imf country … · togo 2013 article iv consultation ......
TRANSCRIPT

©2014 International Monetary Fund
IMF Country Report No. 14/38
TOGO 2013 ARTICLE IV CONSULTATION
Under Article IV of the IMF’s Articles of Agreement, the IMF holds bilateral discussions with members, usually every year. In the context of the 2013 Article IV consultation with Togo, the following documents have been released and are included in this package: The Staff Report prepared by a staff team of the IMF for the Executive Board’s
consideration on December 6, 2013, following discussions that ended on October 10, 2013, with the officials of Togo on economic developments and policies. Based on information available at the time of these discussions, the staff report was completed on November 20, 2013.
A Debt Sustainability Analysis prepared by the staffs of the IMF and the World Bank.
An Informational Annex prepared by the IMF.
A Press Release summarizing the views of the Executive Board as expressed during its December 6, 2013 consideration of the staff report that concluded the Article IV consultation with Togo.
A Statement by the Executive Director for Togo.
The publication policy for staff reports and other documents allows for the deletion of market-sensitive information.
Copies of this report are available to the public from
International Monetary Fund Publication Services PO Box 92780 Washington, D.C. 20090
Telephone: (202) 623-7430 Fax: (202) 623-7201 E-mail: [email protected] Web: http://www.imf.org
Price: $18.00 per printed copy
International Monetary Fund Washington, D.C.
February 2014

gs
TOGO STAFF REPORT FOR THE 2013 ARTICLE IV CONSULTATION
KEY ISSUES Context. After several postponements, the July legislative elections—which were, peacefully conducted—gave an absolute majority to the incumbent party. The new government has thus a strong mandate to implement growth-promoting policies and meet the public’s expectations of improved living standards. Growth is accelerating, fuelled by private foreign and public infrastructure investments.
Article IV discussions. Fiscal deficits have increased in recent years, constraining the room for fiscal maneuver and raising sustainability concerns. Although growth has picked up over the past few years, it has not been inclusive. The main medium-term challenge is to move to higher, sustainable, and inclusive growth. The government has an important role to play in raising the growth potential by providing critical infrastructure, improving the business environment, and deepening the financial sector.
Key staff recommendations. These include:
Resetting fiscal policy to ensure fiscal sustainability. Reverse the fiscal deterioration and implement fiscal adjustment to increase the primary balance progressively in order to lower the debt burden.
Enhancing revenue and public financial management. Enhance revenue collection, leveraging the proposed new revenue authority. Improve treasury operations and debt management. Address the country’s social and development needs by reducing the cost of running the government and improving the targeting and efficiency of public expenditure.
Addressing financial sector vulnerabilities. Take prompt corrective action to address emerging weaknesses which could undermine financial sector stability.
Addressing growth bottlenecks and focus on inequality. Ensure that growth is broad-based and sustainable, and its dividends are widely shared.
Exchange restrictions and regime. Togo, a member of the WAEMU, accepted the obligations under Article VIII, Sections 2, 3 and 4 of the Fund’s Articles of Agreement as of June 1, 1996, and maintains an exchange system free of restrictions on the making of payments and transfers for current international transactions. The WAEMU’s exchange regime is a conventional peg to the euro.
November 20, 2013

TOGO
2 INTERNATIONAL MONETARY FUND
Approved By Michael Atingi-Ego (AFR) and Peter Allum (SPR)
A staff team consisting of Messrs. Mlachila (head), Ruggiero, Arizala, and Cangul (all AFR), Ms. Hacibedel (FIN), and Mr. Keller (IMF resident representative) conducted the discussions assisted by Messrs. Branger (MCM consultant) and Judge (STA consultant). Messrs. Assimaidou and N’Sonde, and Ms. Boukpessi (all OED) participated in the discussions. The discussions took place in Lomé during August 21-September 6, 2013. The mission met with Prime Minister Ahoomey-Zunu, Minister of Economy and Finance Ayassor, National Director of the Central Bank of West African States (BCEAO) Ténou, and other senior government officials, and representatives of labor unions, the private sector, and the development partner community. Discussions were finalized during October 7-10, 2013 in Washington D.C. The last Article IV consultation was concluded on July 18, 2011.
CONTENTS
RECENT DEVELOPMENTS, THE OUTLOOK, AND RISKS ________________________________________ 4
POLICY DISCUSSIONS ___________________________________________________________________________ 9
A. Restoring Fiscal Policy to a More Sustainable Path ______________________________________________9
B. Moving to Stronger, More Sustainable, and Inclusive Growth _________________________________ 13
C. Strengthening the Financial Sector and External Sector Stability ______________________________ 16
STAFF APPRAISAL ______________________________________________________________________________ 20
BOX
1. Main Recommendations from the 2011 Article IV Consultations ________________________________6
FIGURES
1. Historical Perspective, 1990–2011 _______________________________________________________________5
2. Recent Developments and Short-Term Projections, 2009–2013 _________________________________7
3. Medium-Term Outlook, 2007–18 ________________________________________________________________8
TABLES
1 Selected Economic and Financial Indicators, 2010–18 __________________________________________ 22
2. Balance of Payments, 2010–18 _________________________________________________________________ 23
3a. Central Government Financial Operations, 2010–18 __________________________________________ 24
3b. Central Government Financial Operations, 2010–18 _________________________________________ 25

TOGO
INTERNATIONAL MONETARY FUND 3
4. Monetary Survey, 2010-18 _____________________________________________________________________ 26
5. Financial Soundness Indicators, 2009-June 2013 ______________________________________________ 27
APPENDICES
I. Togo Risk Assessment Matrix __________________________________________________________________ 28
II. Financial Sector Profile _________________________________________________________________________ 29
III. Poverty Dynamics and Income Distribution: Recent Developments and Determinants _______ 34
IV. External Sector Stability Assessment and Matrix ______________________________________________ 40
V. Central Government Financial Operations on GFSM-01 Basis _________________________________ 46

TOGO
4 INTERNATIONAL MONETARY FUND
2014
Est. Est.
Real GDP 4.1 4.8 5.9 5.6 6.0Consumer price index (average) 1.4 3.6 2.6 2.2 2.4
Overall fiscal balance (payment order basis) -2.1 -3.4 -6.6 -5.4 -4.6Overall fiscal balance (cash basis) -4.3 -3.5 -7.2 -6.3 -5.3Current account balance -6.3 -9.1 -11.8 -10.6 -10.9Total public debt1 47.3 44.0 45.2 44.1 44.3
Sources: Togolese authorities and IMF staff estimates and projections.1 Includes arrears and state-owned enterprises external debt.
(Percentage growth, unless otherwise indicated)
(Percent of GDP, unless otherwise indicated)
2010 2011 2012 2013
Proj.
RECENT DEVELOPMENTS, THE OUTLOOK, AND RISKS 1. The ruling party recently won legislative elections, which gives the authorities a strong mandate to pursue growth-oriented policies. The long-delayed legislative elections held in July 2013 were peaceful, and the ruling party secured two-thirds of the seats. In a sign of policy continuity, the prime minister and most of the cabinet were reappointed. The electoral victory gives the authorities the mandate to pursue policies that, in the view of the public, would enhance economic growth and make it more inclusive. Thus, the authorities’ main policy challenges are to maintain fiscal sustainability, step up investment while maintaining debt sustainability, and meet the public’s strong expectations of sharing the fruits from higher economic growth.
2. Macroeconomic performance has improved from fifteen years of crisis (Figure 1 and Text Table 1). Real economic growth accelerated from almost 4½ in 2010-11 to 5.9 percent in 2012, reflecting dynamism in agriculture, mining, construction, and public works. The recent pace of economic growth reflects in part a recovery from the protracted political, social and economic crisis from the early 1990s through mid-2000s. Togo’s GDP per capita declined by about 17 percent during 1997-2002, and the recovery that started in earnest in 2009 has not yet fully made up for the lost ground. Poverty remains high, at about 60 percent of the population, and growth has not been inclusive, as income distribution worsened during 2006-11.1 Inflation eased to an average 2.6 percent in 2012, on account of rising staple food production and declining import prices following a pick-up in 2011 due to adjustments in energy prices. The current account deficit widened in 2011-12 to 11.8 percent of GDP, primarily as a result of higher imports of fuels and goods for public and private investment.
Text Table 1. Togo: Selected Economic Indicators, 2010–14
1 During this period, the Gini coefficient—a measure of inequality—rose from 0.361 to 0.393 (Appendix II)

TOGO
INTERNATIONAL MONETARY FUND 5
Figure 1. Togo: Historical Perspective, 1990–2011
Sources: Togolese authorities; World Bank; and IMF staff calculations and estimates.
-40-30-20-10010203040
-20-15-10-505
101520
1990 1992 1994 1996 1998 2000 2002 2004 2006 2008 2010 2012
Real GDP and CPI inflation(percentage change)
Real Gross Domestic Product (LHS)
Consumer Price Index (RHS)60
70
80
90
100
110
0
100
200
300
400
500
600
700
1990 1992 1994 1996 1998 2000 2002 2004 2006 2008 2010 2012
Nominal and Real GDP Per Capita(U.S. dollars)
Nominal GDP per Capita (LHS)Real GDP per Capita (1990 = 100, RHS)
0
5
10
15
20
25
1990 1992 1994 1996 1998 2000 2002 2004 2006 2008 2010 2012
Tax Revenue(percent of GDP)
0
5
10
15
20
25
30
1990 1992 1994 1996 1998 2000 2002 2004 2006 2008 2010 2012
Public Expenditure(percent of GDP)
Total ExpenditureCapital expenditure
During the last decade growth outperformed the decade immediately before....
...but real GDP per capita is still below the level of two decades ago...
Tax revenue effort has improved during the last twenty years...
... which has been followed by increases in expenditures, in particular investment.
During the last 20 years, tangible progress has been made towards improving MDG indicators, although several goals remain out of reach.
1990 1995 2000 2005 latest Goals
Poverty headcount ratio at $1.25 a day (PPP) (% of population) … … … 38.7 28.2 (2011) Halve
Literacy rate, youth female (% of females ages 15-24) … … 63.6 67.9 74.6 (2009) 100
School enrollment, primary (% net) 66.6 76.6 87.0 89.6 91.8 (2008) 100
Ratio of female to male primary enrollment (%) 64.4 67.8 77.7 84.8 91.9 (2012) 100
Mortality rate, infant (per 1,000 live births) 85.2 81.8 78.7 76.0 72.9 (2011) 28.4
Mortality rate, under-5 (per 1,000 live births) 147.0 136.9 127.8 119.7 110.1 (2011) 49
Maternal mortality ratio (modeled estimate, per 100,000 live births) 620.0 540.0 440.0 370.0 300.0 (2010) 155
Prevalence of HIV, total (% of population ages 15-49) 1.7 2.9 4.0 4.1 3.4 (2011) Halt/reverse
Improved water source (% of population with access) 48.5 50.8 53.2 55.8 59.0 (2011) 74.25
Togo: Millenium Development Goals, 1990–2012

TOGO
6 INTERNATIONAL MONETARY FUND
3. Most of the staff advice in the context of the 2011 Article IV consultation remains relevant today (Box 1). Wide ranging structural reforms and fiscal conservatism were implemented up until the HIPC completion point in December 2010. Revenue and public financial management (PFM) reforms have slowed and debt management has weakened since then. The financial sector strategy was approved but its implementation remains limited. Only two out of four banks have been privatized and actions are needed to tackle vulnerabilities in other banks. Reforms in the mining, telecommunications, and energy sectors have progressed slowly under resistance from vested interests. More recently, the Ministry of Economy and Finance approved a public financial management (PFM) reform plan and its implementation has started to bear fruits.
Box 1. Main Recommendations from the 2011 Article IV Consultations
Staff emphasized the following areas as key to maintain macroeconomic stability, sustain growth, and reduce poverty in the medium term: Adopt and implement the financial sector development strategy and speed up bank
privatization. Strengthen public financial management. Improve debt management capacity and adopt a financing strategy relying on highly
concessional loans and grants. Reform the phosphate, telecommunication and energy sectors, where state-owned enterprises
dominate. The World Bank plays a key support role in this area.1 Improve the business environment and boost investment in physical and human capital. ____________________ 1 Since mid-2011, authorities took some steps to reform these sectors. In mining, Togo became a full member of the Extractive Industry Transparency Initiative (EITI) and the authorities are now trying to identify a consortium that could develop the new deposits of carbonated phosphates. In the telecom sector, a new Telecommunication Act was approved, opening the sector to more competition. In the electricity sector, a new Managing Director of the state-owned distribution company was selected following a competitive process in December 2011.
4. Economic growth is expected to soften to around 5½ in 2013. Even though growth has been supported by the agriculture, manufacturing, and construction sectors, economic activity was somewhat affected by irregular rains in mid-2013, lackluster transit trade (in part due to resumption of normal activity in other regional ports), and political uncertainties earlier in the year (Figure 2). The current account deficit would improve slightly to 10.6 percent of GDP, because of lower global import prices.
5. In the medium term, growth is expected to rebound to about 6 percent a year (Figure 3), under the impulse of regional growth and trade, more public and private investments in infrastructure, FDI in mining, and the impact of earlier reform in cash crop markets. The primary domestic fiscal balance would become positive to anchor reductions in the debt burden, and the overall fiscal balance would gradually be reduced to limit new debt accumulation. However, mainly reflecting imports of investments and intermediate goods, the current account deficit is projected to remain high, only narrowing to 9.2 percent of GDP by 2016.

TOGO
INTERNATIONAL MONETARY FUND 7
Figure 2. Togo: Recent Developments and Short-Term Projections, 2009–2013
Sources: Togolese authorities and IMF staff estimates and projections.
-0.5
0.5
1.5
2.5
05
101520253035
average 2007–09
2010 2011 2012
Net FDI (In billions of CFA)
Net FDI (In billions of CFA, LHS)Net FDI (In percent of GDP, RHS)
-10
-5
0
5
10
15
Feb-11 Aug-11 Feb-12 Aug-12 Feb-13 Aug-13
Economic Situation Indicator,Feb. 11 – Aug. 13
(y/y percent change)
TogoWAEMU
0
5
10
15
20
25
30
35
Feb-11 Jun-11 Oct-11 Feb-12 Jun-12 Oct-12 Feb-13 Jun-13
Exports, Feb. 11–Jun. 13(Billions of CFA)
PhosphateOtherClinkerCotton
0
5
10
15
20
25
30
35
40
45
50
Feb-11 Jun-11 Oct-11 Feb-12 Jun-12 Oct-12 Feb-13 Jun-13
Imports, Feb. 11–Jun. 13(Billions of CFA)
OtherPetroleum ProductConstruction materialsFood
-15
-10
-5
0
5
10
15
20
25
30
Jan-11 May-11 Sep-11 Jan-12 May-12 Sep-12 Jan-13 May-13
Import Traffic at the Port of Lomé , Jan. 11 – May. 13
(year-on-year percent change)
-20
-10
0
10
20
30
40
50
60
Jan-11 May-11 Sep-11 Jan-12 May-12 Sep-12 Jan-13 May-13
Transit Import Traffic at the Port of Lomé ,Jan. 11 – May. 13
(year-on-year percent change)
Exports remain strong, in particular in the clinker and cotton sector...
...as well as imports, reflecting strong domestic demand...
...which is generating growing import traffic at the Port of Lome ...
...although transit activity remains stable, given increased competition from neighbors.
Net FDI flows continue to rise... ... but economic activity indicators point to softness in early 2013.
57.98

TOGO
8 INTERNATIONAL MONETARY FUND
Figure 3. Togo: Medium-Term Outlook, 2007–18
Sources: Togolese authorities; and IMF staff estimates.
0
1
2
3
4
5
6
7
8
2007 2008 2009 2010 2011 2012 2013 2014 2015 2016 2017 2018
Real GDP(Percent change)
SSA
WAEMU excl. Togo0
2
4
6
8
10
12
14
2007 2008 2009 2010 2011 2012 2013 2014 2015 2016 2017 2018
CPI average(Percent change)
SSA
Togo
WAEMU excl. Togo
0
5
10
15
20
25
2007 2008 2009 2010 2011 2012 2013 2014 2015 2016 2017 2018
Government Revenue(Percent of GDP)
Tax revenue Non-tax revenue
0
5
10
15
20
25
30
2007 2008 2009 2010 2011 2012 2013 2014 2015 2016 2017 2018
Government Expenditure(Percent of GDP)
Primary domestic current Interest payments Capital
-10
-8
-6
-4
-2
0
2
4
2007 2008 2009 2010 2011 2012 2013 2014 2015 2016 2017 2018
Fiscal Position(Percent of GDP)
Overall balance, excl. grants
Domestic primary balance
Overall balance
0
50
100
150
200
250
300
350
400
450
-18
-16
-14
-12
-10
-8
-6
-4
-2
0
2007 2008 2009 2010 2011 2012 2013 2014 2015 2016 2017 2018
External Position
Tade balance (percent of GDP, left)
Current account balance(percent of GDP, left)
Gross official reserves (billions of CFAF, right)
Togo
Growth momentum is expected to be maintained... ...and inflation to stabilize, apart from adjustments in fuel prices.
Total revenue would rise on the back of continued revenue administration reforms...
...while savings in current expenditures will contribute to fiscal retrenchment...
The fiscal position would improve under the projection period...
...as would the external position.

TOGO
INTERNATIONAL MONETARY FUND 9
6. While the main risks to the outlook are domestic, the Togolese economy is still vulnerable to a significant growth slowdown in its trading partners (Appendix I). Local and presidential elections in 2014 and 2015, respectively, could generate policy slippages; entrenched interests may resist reforms; and limited capacity may slow policy implementation. Without prompt corrective action to address emerging weaknesses in the financial sector, macroeconomic stability could be undermined. Continued policy inaction in the energy sector could negatively affect growth and the budget, while ill-conceived public-private partnerships could entail fiscal liabilities. Given its openness, the economy is vulnerable to shocks in export demand due to growth slowdown among its trading partners.
POLICY DISCUSSIONS 7. Discussions focused on policies required to restore fiscal discipline and move to a stronger, more sustainable and inclusive growth. There was agreement to reinvigorate in structural reforms that stalled after the HIPC completion point. Against this background, the discussions were organized around three main themes: (i) restoring fiscal policies to a more sustainable path; (ii) moving to stronger, more sustainable, and inclusive growth; and (iii) strengthening the financial sector and external stability. There was broad agreement between the authorities and staff on the issues facing Togo and the policies to address them, though views sometimes diverged on the pace and feasibility of needed actions. To assist them meet these challenges, the authorities requested Fund support in implementing their economic reform program.2
A. Restoring Fiscal Policy to a More Sustainable Path
Fiscal policy deteriorated since end-2010….
8. Fiscal deficits and public debt levels have increased in 2011 and 2012. The overall fiscal deficit more than doubled to 7.2 percent of GDP during 2012 largely on account of the adoption of an expansionary budget in the context of planned elections. At the same time, financing from privatization and budget support fell well short of budget plans and, as fuel subsidies rose to 2.1 percent of GDP, unpaid bills accumulated at end-2012. Meanwhile, the public debt-to-GDP ratio increased and is estimated at around 45 percent of GDP at end-2012, including on account of government recognition of old domestic liabilities of bankrupt public enterprises and arrears to pension funds.
9. The 2013 approved budget was also expansionary and subject to risks that eventually materialized. Unrealistically high capital spending, allocations for legislative and municipal elections and higher wages contributed to an overall balance deficit of almost 11 percent of GDP in the 2 A staff-level agreement was reached in early September 2013. However, presentation of the authorities’ request to the IMF Executive Board has been delayed to allow them to complete agreed prior actions.

TOGO
10 INTERNATIONAL MONETARY FUND
adopted budget. In addition, financing was predicated on unrealistically high privatization proceeds. Budget execution pressures built up immediately, as bank privatization did not yield the projected revenue, fuel subsidies over the first quarter absorbed almost the entire allocation for the year, and the anticipated external financing did not materialize. Meanwhile, additional outlays were required to fully finance election operations which saw cash flow pressures increase further by mid-2013.
...but the authorities’ now intend to follow a strong adjustment path
10. In the face of these challenges, the authorities adopted a revised 2013 budget and subsequently took further action to keep the fiscal deficit under control. The revised budget, adopted in consultation with Fund staff, is more realistic as it provides for lower capital expenditures, better aligned with execution capacity, higher allocations for fuel subsidies, and more realistic privatization revenue estimates.3 Staff advised the authorities that, since neighboring countries are adopting pricing policies yielding higher fuel prices and enforcement efforts have been strengthened, smuggling to Togo is now reduced which results in higher official imports and subsidy outlays. To curb the heavy subsidy bill, staff proposed a phased increased in fuel prices—except for kerosene, which is mostly consumed by the poor—by 5 percent in September 2013, and in January 2014, with accompanying targeted measures to protect the most vulnerable.4 The authorities are instead inclined to adopt temporary exemptions on income tax for transporters and on imports of selected essential foodstuff. They also plan to expand the school-feeding program. These measures will be finalized during consultations with domestic stakeholders.
11. Staff proposed that fiscal policies should aim at reducing debt distress vulnerabilities and be anchored by an improvement of the domestic primary fiscal balance. A return to positive territory would allow the authorities to generate the fiscal space to meet their infrastructure needs and implement their social policies, while reducing the debt burden. At the same time, the overall fiscal deficit should be carefully monitored, and overall debt policies guided by close adherence to a strengthened medium-term debt strategy (¶20) and a regular update of the debt sustainability analysis.
12. The authorities agreed with the approach proposed by staff to define their fiscal stance. Their current policies thus target a return to positive primary domestic fiscal balances and the reduction of the overall fiscal deficit in 2014 and the medium term. Their fiscal objective is to enhance fiscal sustainability by reducing the overall deficit to around 5¼ percent of GDP in 2014 and below 4 percent by 2016, while returning to a balanced primary domestic balance in 2014 and to a positive primary domestic balance slightly below 2 percent by 2016. To signal their commitment
3 The authorities report tax revenue inclusive of tax exemptions. Staff’s presentation of Togo’s fiscal accounts excludes such tax exemptions from revenue. To enhance transparency, the recorded tax exemptions are reported as a memorandum item. 4 A phased increase would give time to assess smugglers’ reaction to a higher price differential with Nigeria and Ghana, sources of smuggled fuel. Volumes consumed on the official domestic markets tend to decline the higher the price differentials.

TOGO
INTERNATIONAL MONETARY FUND 11
to fiscal prudence, the authorities chose to frontload fiscal adjustment, as the deficit reduction in 2013 accounts for one-third of the projected adjustment during 2013-16.
13. The projected fiscal adjustment is predicated on the implemention of the authorities’ policy objectives. The reduction in current spending reflects the objectives to cut back on oil subsidies during 2013-2015—as discussed above—and to limit the nominal growth of the wage bill to somewhat below the nominal growth of GDP in the medium-term. On the revenue side, the ongoing reforms in revenue administration are expected to usher a continuation of improvements in revenue collection (see below). However, the deficit levels for 2014 and beyond could still raise financing challenges. The possible adoption of a Fund-supported program could help catalyze development partners’ budget support, which, together with recourse to the regional financial market, would help close projected financing gaps. Staff emphasized that reconciling fiscal sustainability with developmental and social objectives will require significant improvements in public expenditure planning and efficiency, and continued efforts to enhance revenue collection.
14. While noting the considerable pressures they are facing from unions on wage increases, the authorities reiterated their intention to resist the pressure, except for those portions that can be accommodated within the current medium-term spending envelope. Once again at the beginning of the school year, the unions demanded wage, benefits, and employment increases. Staff emphasized the importance of moving away from ad-hoc yearly negotiations and instead adopting a comprehensive strategy of public sector employment and remuneration that is consistent with the authorities’ medium-term fiscal framework and sector strategies, particularly for education and health. Staff cautioned the authorities that, if wage demands were to be accommodated beyond the current allocations in the framework, the appropriate first-best policy adjustment would be to lower other budget expenditures.
15. The authorities concur with the staff that the progressive elimination of fuel subsidies would be a key driver of any fiscal adjustment. However, they are concerned that the current political and social situation is too tense for drastic changes. Staff pointed to the example of Ghana which has recently eliminated fuel subsidies by increasing prices and reestablishing an automatic adjustment mechanism that aligns future changes with the fluctuation of world oil prices and exchange rates. The Togolese authorities now expect to be in position to reduce fuel subsidies by about 1 percent of GDP in 2014, after they have reached an agreement with unions on pay packages. While staff agreed that fuel subsidies can be eliminated only gradually, it underscored the importance of strategically disseminating information to the public on their fiscal cost and regressive impact, as well as the opportunity cost in terms of foregone social and infrastructure spending.
16. There was some divergence of views regarding the pace of scaling up investment spending. The authorities’ concern is that the 1990s crisis has left a legacy of underinvestment in infrastructure that is holding back potential growth. They argued that the protracted and deep nature of the crisis has left them with a wider infrastructure gap than other countries in the region, and that only by significantly scaling up investment can they accelerate economic growth and development. Staff emphasized that prioritizing and effectively executing capital expenditures

TOGO
12 INTERNATIONAL MONETARY FUND
through enhanced planning and project implementation capacity is more important than increasing allocations for project spending. Therefore, it was prudent to create more fiscal space and progressively increase capital spending in line with improvements in the authorities’ capacity to plan and execute projects. Staff noted that the practice of issuing guarantees on the scheduled amortization of bank pre-financing of government contractors for infrastructure projects has reduced transparency and effectively tied down large portions of allocations for investment spending in future years, thus curtailing room to prioritize in future budgets.
17. The authorities intend to raise tax revenue further. In the short term, gains in revenue collections can be sustained by increased reliance on risk-based assessment of imports and tighter monitoring of entitlements to exemptions. The authorities’ plan to sustain their revenue effort in the medium term hinges on the successful launch of the revenue authority (Office Togolais des Recettes—OTR). Once established, the OTR should deliver efficiency gains by hiring new and more qualified personnel, shedding excess staff, and exploiting synergies among domestic- and import-related tax functions under a common strategic direction. Staff noted that pushing ahead with on-going and programmed reforms in the tax and customs administrations remains important, notwithstanding the on-going creation of the OTR.
18. Better public financial management (PFM) should improve government efficiency and transparency. Implementation of the authorities’ medium-term expenditure framework will require careful alignment of policies with reform priorities. Staff noted that the execution of the authorities’ PFM reform plan is experiencing some delays related to both limited capacity and resistance from some administrative units. The authorities also noted that, in the low capacity environment of a fragile country, it is often difficult to reach consensus of reform priorities and align all government units to effectively implement them. Staff and the authorities discussed a number of measures to reinvigorate the PFM agenda. These include: (i) first steps towards establishing a single treasury account; (ii) a more effective cash projection and management system at the treasury; and (ii) better prioritization, execution and monitoring of investment projects.
19. The debt sustainability analysis (DSA) shows that Togo remains at moderate risk of debt distress (Supplement II). There has been considerable debt accumulation over the past two years as the fiscal situation deteriorated. The increase in external debt has been mainly driven by new loans from multilaterals and non-Paris Club bilateral creditors. In light of the projected increase in public investments, Togo’s external public debt is expected to increase in the near future, accumulating to around 22 percent of GDP by 2016. Under baseline assumptions, which are more favorable than historical trends, overall debt indicators are projected to remain below the relevant thresholds in the 20-year period. Nonetheless, there is need to closely monitor the trajectory of public debt, with increased focus on debt contracted from domestic sources, given the country’s low debt management capacity.
20. Strengthened debt management and policies are essential to ensure debt sustainability and reduce vulnerabilities. The authorities and staff discussed options to raise the functional profile and capacity of the Public Debt Directorate, including its human and physical resources. The authorities currently compile an annual debt strategy, but this should be

TOGO
INTERNATIONAL MONETARY FUND 13
strengthened to establish a medium-term strategy that is aligned with the budget process and the medium-term expenditure framework. Staff pointed out that under present circumstances, there were risks of losing control over debt management and new debt, unless the present deficiencies are addressed in a forceful manner. The authorities shared the view that debt management was in need of substantial improvements and asked for additional technical assistance.
21. In the staff’s view, Togo should continue to borrow on concessional terms until its debt management capacity has considerably improved, and closely monitor domestic debt dynamics. The DSA shows that Togo remains at moderate risk of debt distress, combined with low institutional capacity. At around 45 percent of GDP, its total public debt at end-2012 is above the average level for relevant comparator groups in Sub-Saharan Africa, i.e., fragile states that benefitted from HIPC (39.1 percent of GDP) and low-income countries (34.4 percent of GDP). The authorities emphasized that concessional financing is not available in amounts sufficient to meet their urgent development needs. Thus, they are exploring with potential lenders and development partners the possibility of contracting financing packages with a fully concessional grant element of 35 percent or higher that are also consistent with the currently projected DSA.
B. Moving to Stronger, More Sustainable, and Inclusive Growth
Growth has not been inclusive…
22. Poverty reduction requires sustained high growth but also implementation of specific policies to share its benefits more broadly. Poverty in Togo is high and its human development index remains low. While the recent acceleration of economic growth resulted in a reduction of about 3 percentage point in poverty incidence to about 60 percent during 2006-2011, income distribution worsened, as real consumption in the lowest four deciles actually declined (Appendix III and Text Figure 1). Poverty has a strong geographical connotation, being highest in rural areas and the further one goes from the economically more vibrant coastal areas. In fact, poverty in rural areas increased during this period, while internal migration contributed to about a third of the total reduction in poverty. These findings suggest that policies to reduce poverty should focus on measures to enhance productivity in rural areas and market access, and targeted cash transfers. Also, given the importance of internal migration as a potential escape route from poverty, urban planning could take a more prominent role in the authorities’ poverty reduction strategy. Policies should focus on improving urban and peri-urban transportation, and the expansion of primary education and health services.
-6
-4
-2
0
2
4
6
g
1 10 20 30 40 50 60 70 80 90 100
Expenditure percentiles
Growth-incidence 95% confidence bounds
Growth at median Growth in mean
Mean growth rate
Total (years 2006 and 2011)Text Figure 1. Togo: Growth Incidence Curve, 2006–11
Growth-IncidenceGrowth at medianMean growth rate
95% confidence boundsGrowth in mean

TOGO
14 INTERNATIONAL MONETARY FUND
…and faces significant bottlenecks
23. Growth is hampered by a number of major obstacles. Chief among these are infrastructure gaps (especially energy and roads), high telecommunication costs; and—more generally—a weak business environment. While investing in roads has been a budget priority since 2010, reforms to improve energy supply and telecommunication services have hardly gone beyond early planning stages. Electricity generation costs are high, utilities inefficiently run, and Togo largely depends on energy imports, exposing it to cut off risks (see below). Survey-based structural indicators suggest that addressing infrastructure bottlenecks and improving the business climate remain crucial to unlocking Togo’s growth potential (Appendix IV). Although the financial sector has deepened in the 2000s, concentration of the banking activity in Lomé prevents a wider reach of the sector to the Togolese society, especially in rural areas (Appendix II).
24. The new poverty reduction strategy paper (PRSP) aims at making growth stronger and more inclusive. The Strategy to Accelerate Growth and Promote Employment (Stratégie de Croissance Accélérée et de Promotion de l’Emploi—SCAPE—2013-2017) was adopted by the government in August 2013. It was finalized after extensive consultations with stakeholders.5 It builds on experience with the first PRSP (2009-11). Policies and reforms are envisaged around five strategic pillars: (i) developing sectors with high growth potential; (ii) strengthening economic infrastructure; (iii) developing human capital, social protection, and employment; (iv) strengthening governance; and (v) promoting participatory, inclusive, and durable development. The SCAPE includes plans to strengthen institutions for setting strategic priorities, and monitoring and evaluating programs.
Decisive action to raise growth will be required on a number of fronts…
25. So far, the authorities’ efforts have focused on improving road and transport infrastructure. Given Togo’s location as a regional hub, the authorities view investment in transportation infrastructure as critical to increase potential growth. A number of large projects are already advanced in transportation. In addition to large road investments, airport and port capacity will double by end-2014. The authorities have also recently established the Togo Invest Corporation (TIC)—a fully-owned state holding company with capital of CFAF 20 billion (0.9 percent of GDP)—to launch major rail and transportation projects along the North-South axis, mostly via public private partnerships. Staff cautioned the authorities that this carries the high fiscal risks typically associated to PPPs, as well as economic risks deriving from typically long gestation periods. In addition, the project carries administrative risks, as it is unclear how policy and operational responsibilities would be shared between ministries in charge of infrastructure development and TIC—thus undermining already limited ministerial capacities. Risks would be reduced if Togo could develop the institutions and legal framework to manage PPPs before the TIC starts operations. The authorities argued that in
5 The English translation will be circulated to the Executive Board, together with the related joint staff advisory note (JSAN), as soon as possible.

TOGO
INTERNATIONAL MONETARY FUND 15
the short run risks will likely be limited given that TIC’s main activities in the coming year will be to conduct technical feasibility studies.
26. While staff agreed that transportation infrastructure should be a priority, it noted that economic growth should be supported more broadly, to include reforms in the telecommunications and energy sectors, and the business environment more generally. The cost of telecom services is among the highest in the world, and access is still limited and marred by frequent interruptions. It will be important to accelerate the implementation of the telecom strategy and to liberalize the sector by allowing more competition.
27. A comprehensive reform of the power sector to address a major bottleneck to growth is overdue. Staff emphasized that the electricity sector is facing a structural financial deficit and that it is already constraining economic growth. Given its limited domestic generation capacity, about 85 percent of Togo’s power is imported. On current investment plans, such shortfalls will only become larger and are likely to develop into the most important constraint to growth. High input costs compared to tariffs, operational inefficiencies, over-reliance on imports, and a lack of adequate strategic planning have led to supply shortfalls. Peak demand is met by expensive fuel oil-based generation supplied by an independent power producer. The sector is accumulating arrears to suppliers, mostly to other electricity companies in neighboring countries. This exposes Togo to the risk that these countries—which are themselves facing shortages—cut exports. At the same time, the largest payment backlog toward the distribution company is due by public sector entities.6
28. The authorities concurred with the staff analysis, but pointed out that there is no short-term solution. While staff understands that this is a complex sector, it also noted that several measures could be taken in the short-term and still have a positive impact. As a priority, staff argued that it is important to break the cycle of arrears accumulation. This can be achieved via a public information campaign aiming at making the public aware of the main financial and supply constraints in the sector, with emphasis on the need to eliminate payment and service backlogs, and by a sanctions policy allowing to cut off service to public sector entities. The authorities, fearing backlash in case essential public services are interrupted, preferred to devise a repayment plan after arrears are verified. It is thus crucial that the authorities make good on their intention to settle a portion of government arrears in 2014 and that more realistic budget allocations are made. A gradual move to cost-recovery level tariffs in the medium term is unavoidable, including to attract foreign investors, provided other areas are addressed concurrently.
29. There is significant scope for further improvement in the business climate (Appendix IV). Despite progress made in a number of areas, e.g., creation of a one-stop shop for business registration (which considerably reduced the time required to complete this procedure to 24 hours), Togo still ranks poorly in the 2013 Doing Business survey (156th out of 185 countries). Reform efforts are especially needed in the areas where Togo is still lagging well behind comparator
6 While the collection rate on private sector accounts is above 95 percent, collection on central government (31 percent) and municipalities (18 percent) is very poor. Overall arrears amount to 1.1 percent of GDP.

TOGO
16 INTERNATIONAL MONETARY FUND
countries, such as protecting investors’ rights, enforcing contracts, and accessing financing. The authorities recently awarded a contract for the operation of a one-stop window for foreign trade. When fully operational, this is expected to facilitate the flow and transit of goods, and expedite customs and border controls.
…as well as to make growth more inclusive
30. Staff welcomed the authorities’ focus on inclusiveness under the new development strategy. However, staff noted that growth relying on capital-intensive natural resource projects is unlikely to create a lot of jobs and benefit the rest of the economy. Conversely, growth relying on higher farm productivity and broader rural job opportunities is likely to generate additional demand and to lead to faster poverty reduction. Financial sector stability and development and financial inclusion are also important elements of an inclusive growth strategy (see below).
31. The authorities are determined to alleviate poverty via economic growth and measures to foster employment and micro-productive activities. Their strategy to promote inclusive growth hinges on measures creating opportunities for gainful self-employment, and the gradual expansion of the pilot school feeding program. Staff noted that given the strong geographical and sectoral profile of poverty, expanding conditional cash transfers and the school feeding program would appear good ways to deliver assistance to the poor. School feeding programs, in particular, have the added advantage of improving forward and backward linkages within the rural economy. However, the authorities fear that cash-based social programs may be prone to abuse and could create a culture of dependency.
C. Strengthening the Financial Sector and External Sector Stability
Despite increased financial deepening and overall financial stability…
32. The financial sector in Togo has experienced considerable financial deepening, and Togo compares favorably to its WAEMU peers. Since 2007, credit- and deposits-to-GDP ratios indicate significant improvements, and more than a 100 bank branches have been opened. However, lack of wide access to credit in spite of this growth remains a challenge (Appendix II). From the deposit perspective, low level of savings is a major constraint. On the credit supply side, lack of competition among banks and concentrations around Lomé prevent financial services from reaching wider public, especially in rural areas. The microfinance sector plays an important role where traditional banking services do not function efficiently, but the sector is plagued by unregulated activity.
33. The microfinance sector has grown very rapidly. Between 2009 and 2012, deposits and loans increased by 70 percent and 80 percent, respectively, and the number of clients increased from about 0.7 to 1.2 million. At end-2012, the microfinance’s share of deposits was 16 percent of the financial system. The microfinance plays a critical role in financial inclusion especially among the poor and the rural population, covering a large number of households. Togo’s microfinance sector plays a relatively more important part in the domestic economy than those in neighboring countries,

TOGO
INTERNATIONAL MONETARY FUND 17
as evidenced by the higher financial deepening indicators and relatively higher proportion of population covered by the sector.
…actions are needed to tackle vulnerabilities in some banks
34. The overall situation of the banking system appears stable, but aggregate numbers hide the weaknesses of individual banks. While NPLs have declined significantly over the past five years and system-wide capital adequacy levels are strong, substantial differences among banks exist. Stress-tests conducted recently suggest the system is strong according to traditional metrics of liquidity and solvency, but they also show that it is imperative to give due weight to risks stemming from highly concentrated loans and deposits’ short-term bias.
35. The rehabilitation of the banking sector remains an unfinished business. Three major state-owned banks (BTCI, UTB and BIA-T) were recapitalized in 2008 through a securitization process. These institutions received about US$200 million in new government securities in exchange for non-performing loans which were to be recovered by an asset recovery company called Société de Recouvrement du Togo (SRT). Strengthening the recovery effort could result in important revenue for the government but, so far, only limited amounts have been recovered. As time passes, the recovery rate on the portfolio diminishes, reducing its value as a government asset.7 The bank privatization process has led to the successful sale of two out of four banks, and an unsuccessful attempt in early 2013 to privatize BTCI.
There is need to improve the regulatory framework and institutions
36. There are considerable systemic weaknesses in the bank supervision framework in the WAEMU region. Banking supervision relies on a dual mandate between the authorities in the WAEMU and the Ministry of Finance. The WAEMU is responsible for supra-national supervision of banks and can recommend recapitalization or resolution of weak institutions but the final decision relies on the national Ministry of Finance.8 This structure can complicate the decision-making process and promote moral hazard. Furthermore, banking regulation in the WAEMU is relatively lax when compared to international standards. Non-performing loans are required to be provisioned only after 180 days whereas international norms prescribe 90 days, and banks in the WAEMU are allowed to often operate below the minimum capital requirements for extended time before they are intervened. Delays in policy implementation due to complex regulatory framework, combined with ex ante relatively loose financial regulation, result in a financial system prone to systemic risks. While agreeing with the staff views, the authorities noted that these issues should be addressed at a WAEMU-wide level.
7 As long as the operational costs of the SRT are not larger than the recovered amounts, the recovery of outstanding loans should not generate liabilities for the government. 8 International Monetary Fund, 2008, “Financial Sector Assessment Program for the West African Economic and Monetary Union (WAEMU),“ June.

TOGO
18 INTERNATIONAL MONETARY FUND
37. Regulation of the microfinance sector needs to be improved. Prevalence of informal lending and institutional arrangements constrains effective supervision. There is a proliferation of small financial entities that operate without formal licenses or authorization. The supervisory infrastructure is ill-equipped to track and enforce licensing, and close illegal units. Currently there exist over 60 such microfinance entities. There is also need to rein in pyramid-type operations, which undermine financial and social sector stability.
38. The authorities and staff concurred that over the medium term policies should focus on enabling the financial sector to perform greater financial intermediation. Policies could include:
Adopting resolution strategies for problem banks. The authorities and staff agreed on the importance to take effective and swift corrective action to address the situation of institutions facing financial difficulties. There was agreement on the fact that the authorities would continue leading the financial sector towards an environment where the private sector increases participation through larger stockholding, and by carrying out the process of privatization of public banks.
Enhancing oversight and supervision of the micro-credit sector. The microfinance supervisor—the Cellule d’Appui et de Suivi des Institutions Mutualistes et de Coopératives d’Epargne et de Crédit (CAS-IMEC, a division of the MEF)—is grossly understaffed and needs significant institutional strengthening. An important first step would be to increase the staffing and enhance training in modern risk-based financial sector supervision. At the same time, it is important to close all unlicensed institutions, and take measures to prevent the establishment and development of pyramid-type structures. In the medium term, there will be need to promote the restructuring and consolidation of the microfinance sector.

TOGO
INTERNATIONAL MONETARY FUND 19
Restructuring pension funds to become financially sustainable over the medium-term. Staff highlighted the importance of adopting one of the proposed options to eliminate the structural deficit of the public sector pension scheme (CRT) and to settle public sector arrears with both the CRT and the national social security fund (CNSS). The options for improving the financial situation of the CRT include: (i) raising the retirement age; (ii) progressively raising the contribution rate; and (iii) transferring social assistance payments (which have nothing to do with pensions) to the state budget. This would allow to reduce financial losses and to accommodate the increasing number of beneficiaries.
Improving external sector stability
39. An external sector stability assessment suggests that external sector risks are generally manageable (Appendix IV). Although export growth has accelerated significantly over the past five years, imports have grown even faster, mainly on account of investment goods for various infrastructure projects. Togo has had structural current account deficits for nearly two decades. Low savings relative to large investment needs imply continued deficits over the medium term, although they are expected to decline as new projects come on-stream. In the longer run, prospects are generally good for greater export growth given investment in mining-related activities and the large expansion of the port of Lomé. Inward FDI is expected to increase on account of improvements in infrastructure and the business climate. Remittances have remained an important contributor to the balance of payments.
40. Staff assessment of the real effective exchange rate (REER), using three standard methods, indicate that it is broadly in line with economic fundamentals. The REER has somewhat declined over the past three years (Text Figure 2), largely reflecting the depreciation of the euro, to which the CFA franc is pegged. External reserves (pooled at the regional level) are ample, covering more than five months of imports. To reduce external vulnerabilities, Togo needs to implement prudent fiscal and borrowing policies, and increase non-price competitiveness. The authorities concurred with this assessment and noted that they are working with other development partners to address competitiveness issues. In particular, their reform efforts will focus on implementing the new investment code, supported by the adoption of implementing decrees, adopting a new mining code in line with EITI transparency standards, and developing a modern code for property titles.
85
90
95
100
105
110
115
Jan-05 Jan-06 Jan-07 Jan-08 Jan-09 Jan-10 Jan-11 Jan-12 Jan-13
Text Figure 2. Togo: REER and NEER, Jan.05–Aug.13(2005=100)
Real Effective Exchange Rate
Nominal Effective Exchange Rate

TOGO
20 INTERNATIONAL MONETARY FUND
STAFF APPRAISAL 41. Growth has picked up over the past few years on the back of reforms initiated under the previous ECF-supported program. The past five years have seen a reversal of declining per capita GDP levels that had plagued Togo over the previous 15 years. Growth has generally been broad-based, with agriculture, cement and clinker manufacturing, construction, and other services showing good performance, but it has not been inclusive. The medium term growth outlook is good, and the challenge is to sustain the momentum and make growth more inclusive, taking advantage of Togo’s unique location in the midst of some of SSA’s biggest and most dynamic sub-regional economies. Inflation would remain moderate. The authorities need to reinvigorate much-needed structural reforms that had stalled over the past two years in order to set growth on a sustainable path.
42. Staff welcomes the authorities’ renewed determination to address emerging fiscal problems in 2013 in order to set Togo on a sustainable debt path. Fiscal deficits and debt ratios have increased in recent years, reducing room for fiscal maneuver and raising sustainability issues. Restoring fiscal space and keeping low the risk of debt distress require lower deficits. Debt sustainability considerations call for strengthening of debt management and for further reduction of the fiscal deficit in the medium term. Greater revenue mobilization is needed to facilitate high priority spending on infrastructure, health, education, and agriculture. The proposed OTR would help reinvigorate revenue mobilization. At the same time, operational reforms in revenue administration should be deepened.
43. Reducing the fiscal deficit while addressing the country’s social and development needs will require improving public spending efficiency. Beyond reducing the cost of running the government and streamlining of government agencies, rationalization of expenditure and more cost-effective support to the most vulnerable segments of the population will be needed. In this regard, staff welcomes the authorities’ intention to phase out costly and poorly-targeted fuel price subsidies and to broaden and improve social safety nets. This will require strong political leadership to overcome vested interests, a well-orchestrated public information campaign, as well as good administrative capacity. It remains important to systematically address pressures on the wage bill and size of the public sector by defining a structural wage and employment reform.
44. There is need to have a determined effort to improve debt management. Debt management has weakened considerably since the HIPC completion point at end-2010. At the same time, debt levels have increased in part due to the government’s recognition of old liabilities. Consequently, careful monitoring of existing debt and rigorous implementation of a medium-term debt strategy will be needed to control the accumulation of new debt and bring current debt levels progressively down. In particular, the authorities should seek only new concessional external loans until there is a decisive improvement in their debt management capacity. While PPPs have the potential to unlock much-needed financing for infrastructure, the authorities will need to adopt

TOGO
INTERNATIONAL MONETARY FUND 21
a robust legal framework and improve their institutional capacity to ensure maximum benefits from
such arrangements while minimizing contingent liabilities for the government.
45. The main medium-term challenge for Togo is to move to higher, sustainable, and inclusive growth. To raise potential growth, there is need to address major bottlenecks, especially in infrastructure. Despite the pickup in growth over the past five years, overall poverty incidence has declined only slowly. Indeed, there are significant regional differences in poverty levels, with poverty in several rural regions actually increasing. Growth has not been inclusive, as the poorest 40 percent of the population has seen its incomes decline between 2006 and 2011. Consequently, creation of fiscal space to support implementation of policies that raise incomes of the poor, such as rural feeder roads, mini dams for irrigation, and off-grid energy alternatives will be needed to make growth more inclusive. At the same time, for the poorest segments of the population, progressively extending the pilot cash transfer and school feeding programs will begin to reduce the inter-generational transmission of poverty.
46. While the overall Togolese financial system has developed significantly over the past decade and is sound, a number of individual banks have shown fragility. Financial depth has increased significantly over the past decade and Togo compares favorably to its WAEMU peers. The microfinance sector has greater reach in Togo than in other WAEMU countries. Actions will be needed to enhance weak banks, such as requiring banks to accumulate capital, where needed, through dividend suspensions or new capital injections. There is also need to significantly enhance the supervision, monitoring and control of the microfinance sector, which is plagued by structural weaknesses and unregulated activity.
47. The economy will remain exposed to substantial risks, mainly on the domestic side. The main domestic risks are delays in reforming the energy sector and difficulties modernizing state functions and reforming state owned enterprises, which would affect growth and fiscal sustainability. External vulnerabilities are generally manageable as Togo’s export destinations are relatively diversified. That said, concerted efforts to increase non-price competitiveness will help propel Togo into a major transport and logistics hub on the West African coast.
48. It is proposed that the next Article IV consultation take place on the standard 12–month cycle.

TOGO
22 INTERNATIONAL MONETARY FUND
Table 1. Togo: Selected Economic and Financial Indicators, 2010–18
2014 2015 2016 2017 2018Act. Est. Est.
National income, prices, and exchange ratesReal GDP 4.1 4.8 5.9 5.6 6.0 6.0 6.1 5.8 5.5Real GDP per capita 1.9 2.6 3.7 3.4 3.8 3.8 3.9 3.6 3.3GDP deflator 1.1 7.6 6.5 2.0 2.4 2.5 2.5 2.5 2.5Consumer price index (average) 1.4 3.6 2.6 2.2 2.4 2.5 2.5 2.5 2.5GDP (CFAF billions) 1,571 1,772 1,999 2,154 2,337 2,539 2,762 2,995 3,239Exchange rate CFAF/US$ (annual average level) 494.4 471.4 510.0 …… … … … … …Real effective exchange rate -6.0 0.7 -4.0 … … … … … …Terms of trade (deterioration = –) -2.2 -2.1 -0.2 0.3 0.4 0.5 0.4 0.4 0.3
Monetary survey
Net foreign assets13.0 4.4 -2.1 -3.1 -2.4 1.7 2.5 2.7 -0.3
Credit to government14.3 -5.6 3.7 2.0 0.7 0.7 0.5 0.6 1.2
Credit to nongovernment sector 10.3 20.5 11.5 10.0 6.6 6.6 8.0 6.7 6.7Broad money (M2) 16.3 15.9 8.9 15.9 9.5 9.2 12.2 8.7 8.8Velocity (GDP/end-of-period M2) 2.2 2.1 2.2 2.1 2.0 2.0 2.0 2.0 1.9
Investment and savingsGross domestic investment 18.9 18.6 19.1 20.3 21.1 21.9 22.1 21.6 20.9
Government 7.9 8.1 8.8 10.2 10.6 10.9 10.9 10.1 9.4Nongovernment 11.0 10.5 10.3 10.1 10.5 11.0 11.2 11.5 11.5
Gross national savings 12.6 9.6 7.3 9.7 10.2 12.0 13.1 13.1 12.5Government 5.8 4.8 2.2 4.8 6.0 7.4 8.1 7.9 7.6Nongovernment 6.8 4.8 5.1 4.9 4.2 4.6 5.1 5.3 4.9
Government budgetTotal revenue and grants 20.4 20.4 19.8 22.7 23.0 23.5 23.7 23.5 23.3
Revenue 18.4 17.3 18.2 19.3 19.4 19.9 20.1 20.2 20.3Total expenditure and net lending 22.5 23.8 26.4 28.1 27.6 27.1 26.5 25.7 25.1
Domestic primary expenditure 16.7 18.9 20.3 20.0 19.4 18.9 18.3 18.0 17.9Overall balance (payment order basis) -2.1 -3.4 -6.6 -5.4 -4.6 -3.5 -2.8 -2.2 -1.8Overall balance (cash basis) -4.3 -3.5 -7.2 -6.3 -5.3 -4.3 -3.6 -2.9 -2.6
Domestic primary balance21.7 -1.6 -2.0 -0.7 0.0 1.1 1.8 2.2 2.5
External sectorCurrent account balance -6.3 -9.1 -11.8 -10.6 -10.9 -9.9 -9.0 -8.4 -8.4
Exports (goods and services)3 40.2 40.7 39.6 39.5 39.2 39.4 39.4 39.5 39.2Imports (goods and services)3 -57.3 -61.4 -61.1 -62.2 -62.5 -62.0 -60.4 -58.8 -56.5
External public debt4 17.2 15.6 18.1 18.9 19.6 20.8 21.5 22.0 22.4External public debt service (percent of exports)4 4.7 2.0 2.8 3.5 3.9 3.8 4.0 3.9 3.6Total public debt4 47.3 44.0 45.2 44.1 44.3 42.8 41.4 40.2 39.4
Sources: Togolese authorities and IMF staff estimates and projections.1 Change as a percentage of broad money at the beginning of the period. 2 Revenue minus expenditure, excluding grants, interest, and foreign-financed expenditure.
4 Includes arrears and state-owned enterprises external debt.
3 Aggregate import and export figures, both for historical data and for projections, now include separately the imports and exports from the binational electricity generating company CEB, which were previously netted out when calculating aggregate numbers.
2010 2011 2012 2013
(Annual change, percent of beginning-of-period broad money)
(Percent of GDP, unless otherwise indicated)
(Percentage growth, unless otherwise indicated)Proj.

TOGO
INTERNATIONAL MONETARY FUND 23
Table 2. Togo: Balance of Payments, 2010–18
2010 2011 2012 2013 2014 2015 2016 2017 2018Act. Act. Prel.
Current account balance -98.9 -160.9 -235.2 -228.2 -254.7 -251.8 -247.4 -252.1 -272.0Trade balance -225.0 -273.7 -313.1 -348.0 -380.0 -387.7 -395.5 -409.1 -403.7
Exports 483.5 553.6 628.9 677.9 731.1 797.4 864.5 936.8 1005.5Of which: Cotton 8.9 23.6 31.0 41.6 45.3 49.6 59.3 68.9 74.1 Phosphates 34.0 46.9 70.6 71.3 80.0 88.1 98.4 110.0 119.3 Cement & clinker 73.4 81.4 92.9 103.3 116.1 140.4 154.5 169.9 181.8
Reexports 112.5 139.0 158.4 167.9 178.0 188.7 200.0 212.0 229.2
Imports, f.o.b. -708.5 -869.0 -989.5 -1093.1 -1200.0 -1298.3 -1380.1 -1452.0 -1500.9Of which : Imports for domestic use -651.4 -827.3 -942.0 -1025.9 -1111.0 -1185.1 -1260.1 -1346.0 -1409.2
Of which: Petroleum products -57.8 -109.9 -125.3 -140.6 -158.9 -176.1 -181.8 -192.4 -195.9
Services (net) -38.5 -47.1 -74.2 -73.3 -76.2 -73.4 -65.5 -64.1 -66.0Income (net) -11.6 -11.4 -13.6 -9.3 -12.2 -13.0 -16.6 -13.8 -20.8Current transfers (net) 176.2 171.3 165.7 202.3 213.6 222.3 230.3 235.0 218.5
Of which : Remittances 126.4 126.9 126.9 128.2 129.5 130.8 132.1 136.0 121.3
Capital and financial account 77.4 124.1 73.8 175.9 196.3 198.1 216.8 235.4 258.9Direct investment 24.1 30.7 31.9 37.0 58.4 63.5 69.1 74.9 81.0Portfolio investment, incl. bonds -3.8 18.1 19.6 21.9 26.9 31.4 33.7 33.7 25.0Other investment 75.0 52.5 19.7 106.4 111.0 103.2 114.0 121.0 153.0
Errors and omissions -24.9 -55.9 3.6 0.0 0.0 0.0 0.0 0.0 0.0
Overall balance -46.4 -92.8 -157.8 -52.3 -58.4 -53.7 -30.7 -16.6 -13.0
Financing 46.4 92.8 157.8 52.3 58.4 53.7 30.7 16.6 13.0Central bank net foreign assets1 -31.7 -6.8 123.7 -1.7 12.1 -11.5 -15.5 -20.1 -15.5Arrears, net change 0.0 0.0 -0.2 0.0 0.0 0.0 0.0 0.0 0.0 Principal 0.0 0.0 -0.2 0.0 0.0 0.0 0.0 0.0 0.0 Interest 0.0 0.0 0.0 0.0 0.0 0.0 0.0 0.0 0.0Flow rescheduling 26.4 41.5 37.7 36.1 33.5 31.1 22.0 21.5 24.1Clearance of debt/arrears 642.5 0.0 0.0 0.0 0.0 0.0 0.0 0.0 0.0Debt/arrears cancellation -642.3 0.0 0.0 0.0 0.0 0.0 0.0 0.0 0.0Debt and arrears rescheduling 0.2 0.0 0.0 0.0 0.0 0.0 0.0 0.0 0.0Finacing gap 51.8 58.0 -3.6 17.9 12.8 34.1 24.2 15.3 4.5 Identified Financing 41.1 46.1 16.3 17.9 12.8 0.0 0.0 0.0 0.0
IMF financing 11.0 17.3 0.0 0.0 0.0 0.0 0.0 0.0 0.0 Donor financing 30.1 28.9 16.3 17.9 12.8 0.0 0.0 0.0 0.0
Residual financing gap 10.3 11.9 -19.6 0.0 0.0 34.1 24.2 15.3 4.5
Memorandum items:
Current account balance -6.3 -9.1 -11.8 -10.6 -10.9 -9.9 -9.0 -8.4 -8.4 Trade balance -14.3 -15.4 -15.7 -16.2 -16.3 -15.3 -14.3 -13.7 -12.5
Exports of goods and services2 40.2 40.7 39.6 39.5 39.2 39.4 39.4 39.5 39.2Imports of goods and services -57.3 -61.4 -61.1 -62.2 -62.5 -62.0 -60.4 -58.8 -56.5
Direct investment 1.5 1.7 1.6 1.7 2.5 2.5 2.5 2.5 2.5Gross international reserves (imputed in billions of USD) 0.7 0.8 0.4 0.4 0.4 0.5 0.5 0.5 0.6Gross international reserves (as a percentage of M2) 49.2 47.8 24.2 21.0 18.2 17.6 16.8 16.7 16.3Gross international reserves of the WAEMU (months of next year's imports) 6.1 5.9 5.2 4.9 4.8 … … … … …
Sources: Togolese authorities and IMF staff estimates and projections.1 Negative sign indicates increase.2 Aggregate import and export figures, both for historical data and for projections, now include separately the imports and exports from the bi-national electricity generating company CEB, which were previously netted out when calculating aggregate numbers. Exports from CEB accounted for about 3 percent of GDP in 2009 and imports of CEB for about 4.4 percent of GDP.
(Billions of CFA francs)
(Percent of GDP, unless otherwise indicated)
Proj.

TOGO
24 INTERNATIONAL MONETARY FUND
Table 3a. Togo: Central Government Financial Operations, 2010–18 (In CFAF billion)
2014 2015 2016 2017 2018
Act. Est.Approved
Budget Revised Budget
Est.Approved
BudgetRevised Budget
Proj.
Revenue and grants 321.3 362.3 411.4 417.1 396.4 492.9 496.3 489.5 536.9 597.7 653.4 705.2 755.4Total revenue 289.1 306.6 340.0 376.0 364.7 411.5 414.9 415.3 452.8 506.2 555.2 606.2 658.2
Tax revenue 238.9 281.4 304.0 332.6 320.8 363.9 363.9 364.3 400.1 448.3 492.2 537.9 584.3Tax administration (DGI) 105.7 118.5 133.2 148.2 143.9 158.8 158.8 159.1 175.0 198.7 219.2 240.4 260.9Customs administration (DGD) 133.2 162.9 170.8 184.4 176.9 205.1 205.1 205.3 225.2 249.6 273.0 297.5 323.3
Nontax revenue 50.2 25.1 36.0 43.4 43.9 47.6 51.0 51.0 52.6 57.9 63.0 68.3 73.9Grants (projects) 32.2 55.8 71.4 41.1 31.7 81.4 81.4 74.1 84.1 91.5 98.2 99.0 97.2
Expenditure and net lending 354.4 422.0 601.5 573.7 528.1 702.7 608.9 606.2 644.3 686.8 731.5 770.2 814.2 Of which: Dom. primary expenditures 262.0 334.4 400.6 416.7 405.1 425.0 427.3 431.3 453.9 479.3 506.6 540.3 578.8 Of Which : temporary social measures … 3.4 … … 0.0 … … 0.0 …… … … … …
Current expenditure 230.8 277.8 311.3 362.8 352.8 351.8 378.5 385.9 395.9 410.0 430.4 469.1 509.8 Primary current spending 215.7 266.2 294.0 345.2 334.2 321.7 348.4 355.7 362.1 377.8 396.1 434.0 468.2
Wages and salaries 82.6 104.7 115.9 116.7 120.4 125.3 136.0 136.0 147.2 159.8 167.9 179.6 188.9Goods and services 59.5 63.7 81.8 106.1 88.5 81.5 84.9 78.3 85.5 93.2 102.3 116.3 127.6Transfers and subsidies 69.4 97.9 96.3 122.4 125.3 114.9 127.5 141.4 129.4 121.8 122.9 135.2 148.7 Of which : Oil prices support 3.7 32.5 5.0 31.8 42.5 10.0 30.0 43.9 24.0 8.0 0.0 0.0 0.0
Interest 15.1 11.51 17.3 17.6 18.6 30.1 30.1 30.2 33.8 32.3 34.3 35.1 41.6Domestic debt 10.1 9.59 11.0 11.0 12.8 20.7 20.7 20.8 23.6 22.8 23.0 22.0 21.5External debt 5.0 1.92 6.3 6.6 5.8 9.4 9.4 9.4 10.2 9.5 11.3 13.1 20.1
Public investment 123.6 144.2 290.2 210.9 175.1 350.9 230.4 220.3 248.4 276.7 301.1 301.0 304.5Domestically financed 46.2 68.2 106.6 71.4 70.9 103.3 78.9 75.5 91.8 101.5 110.5 106.3 110.6Foreign financed 77.3 76.1 183.5 139.4 104.2 247.6 151.5 144.8 156.6 175.2 190.6 194.7 193.9
Domestic primary balance 27.2 -27.9 -60.6 -40.7 -40.4 -13.5 -12.4 -15.9 -1.1 26.9 48.6 65.9 79.4
Overall balance, payment order basis (incl. grants) -33.0 -59.7 -190.1 -156.6 -131.7 -209.8 -112.6 -116.7 -107.4 -89.0 -78.1 -64.9 -58.9Excluding grants -65.2 -115.4 -261.5 -197.8 -163.4 -291.2 -194.0 -190.9 -191.5 -180.5 -176.3 -163.9 -156.1
Change in arrears1 -35.2 -2.4 -17.0 -14.0 -11.7 -23.0 -24.4 -19.6 -15.8 -19.7 -21.4 -23.2 -25.1
Overall balance, cash basis (incl.grants; incl.change in arrears) -68.2 -62.1 -207.1 -170.6 -143.2 -232.8 -137.0 -136.3 -123.2 -108.7 -99.5 -88.2 -84.0
Excluding grants -100.4 -117.8 -278.5 -211.8 -175.1 -314.2 -218.4 -210.4 -207.3 -200.2 -197.7 -187.2 -181.2
Financing 16.9 4.0 175.0 149.4 146.6 185.5 91.2 118.4 110.4 74.6 75.3 72.9 79.6Domestic financing (net) -12.3 -16.3 69.4 57.6 85.1 36.6 38.4 65.7 59.2 13.2 9.7 6.0 6.5
Banking system 5.4 -31.8 -4.6 -3.5 34.4 -8.8 -8.8 18.5 6.9 7.7 6.4 9.0 18.3Nonbank financing -17.8 15.5 73.9 61.1 50.6 45.4 47.2 47.2 52.3 5.5 3.3 -3.0 -11.8
Of which: Bank Privatization proceeds … … 45.0 12.6 3.0 45.0 16.8 16.8 0.0 0.0 0.0 0.0 0.0External financing (net) 29.2 20.3 105.6 91.8 61.5 148.9 52.8 52.7 51.1 61.4 65.7 66.9 73.1
Exceptional financing 41.1 46.1 20.3 20.3 16.3 13.8 18.4 17.9 12.8 0.0 0.0 0.0 0.0ECF credit 11.0 17.3 0.0 0.0 0.0 0.0 0.0 0.0 0.0 0.0 0.0 0.0 0.0Other identified financing (budget support) 30.1 28.9 20.3 20.3 16.3 13.8 18.4 17.9 12.8 0.0 0.0 0.0 0.0
Residual/unidentified financing ( + = financing needs) 2 10.3 11.9 11.7 0.9 -19.6 33.5 27.5 0.0 0.0 34.1 24.2 15.3 4.5
Memorandum Item:
Tax exemptions recorded by DGI and DGD as revenue3
7.7 10.0 … … 6.9 … … 38.2 40.0 … … … …Sources: Togolese authorities and IMF staff estimates and projections.
3 DGD started collecting data on tax exemptions on imports in 2013. The amount of these exemptions in 2013 is estimated at CFAF 28 bill (1.3 percent of GDP).
2013
Proj.
1 Includes the BCEAO credit for domestic arrears clearance.2 Identifies residual for past years (i.e. 2012) and financing gap for current and future years (i.e. 2013 onward). In keeping with practice under the previous ECF-supported program, unidentified financing from 2014 on is calculated without assuming any external budget support (i.e. exceptional financing).
(In billions of CFA Francs)
20112010 2012

TOGO
INTERNATIONAL MONETARY FUND 25
Table 3b. Togo: Central Government Financial Operations, 2010–18 (In percent of GDP)
2014 2015 2016 2017 2018
Act. Est.Approved
Budget Revised Budget
Est.Approved
BudgetRevised Budget
Proj.
Revenue and grants 20.4 20.4 23.4 22.2 19.8 22.9 23.2 22.7 23.0 23.5 23.7 23.5 23.3Total revenue 18.4 17.3 19.4 20.0 18.2 19.1 19.4 19.3 19.4 19.9 20.1 20.2 20.3
Tax revenue 15.2 15.9 17.3 17.7 16.0 16.9 17.0 16.9 17.1 17.7 17.8 18.0 18.0Nontax revenue 3.2 1.4 2.0 2.3 2.2 2.2 2.4 2.4 2.3 2.3 2.3 2.3 2.3
Grants 2.0 3.1 4.1 2.2 1.6 3.8 3.8 3.4 3.6 3.6 3.6 3.3 3.0
Expenditures and net lending 22.5 23.8 34.2 30.5 26.4 32.6 28.5 28.1 27.6 27.1 26.5 25.7 25.1 Of which: Dom. primary expenditures 16.7 18.9 22.8 22.2 20.3 19.7 20.0 20.0 19.4 18.9 18.3 18.0 17.9 Of Which : temporary social measures … 0.2 … … 0.0 … … 0.0 … … … … …
Current expenditures 14.7 15.7 17.7 19.3 17.6 16.3 17.7 17.9 16.9 16.2 15.6 15.7 15.7 Primary current spending 13.7 15.0 16.7 18.4 16.7 14.9 16.3 16.5 15.5 14.9 14.3 14.5 14.5
Wages and salaries 5.3 5.9 6.6 6.2 6.0 5.8 6.4 6.3 6.3 6.3 6.1 6.0 5.8Goods and services 3.8 3.6 4.7 5.6 4.4 3.8 4.0 3.6 3.7 3.7 3.7 3.9 3.9Transfers and subsidies 4.4 5.5 5.5 6.5 6.3 5.3 6.0 6.6 5.5 4.8 4.4 4.5 4.6 Of which : Oil prices support 0.2 1.8 0.3 1.7 2.1 0.5 1.4 2.0 1.0 0.3 0.0 0.0 0.0
Interest 1.0 0.6 1.0 0.9 0.9 1.4 1.4 1.4 1.4 1.3 1.2 1.2 1.3Public investment 7.9 8.1 16.5 11.2 8.8 16.3 10.8 10.2 10.6 10.9 10.9 10.1 9.4
Domestically financed 2.9 3.8 6.1 3.8 3.5 4.8 3.7 3.5 3.9 4.0 4.0 3.5 3.4Foreign financed 4.9 4.3 10.4 7.4 5.2 11.5 7.1 6.7 6.7 6.9 6.9 6.5 6.0
Domestic primary balance 1.7 -1.6 -3.5 -2.2 -2.0 -0.6 -0.6 -0.7 0.0 1.1 1.8 2.2 2.5
Overall balance, payment order basis (incl. grants) -2.1 -3.4 -10.8 -8.3 -6.6 -9.7 -5.3 -5.4 -4.6 -3.5 -2.8 -2.2 -1.8Excluding grants -4.2 -6.5 -14.9 -10.5 -8.2 -13.5 -9.1 -8.9 -8.2 -7.1 -6.4 -5.5 -4.8
Change in arrears1 -2.2 -0.1 -1.0 -0.7 -0.6 -1.1 -1.1 -0.9 -0.7 -0.8 -0.8 -0.8 -0.8Overall balance, cash basis (incl.grants; incl.change in arrears) -4.3 -3.5 -11.8 -9.1 -7.2 -10.8 -6.4 -6.3 -5.3 -4.3 -3.6 -2.9 -2.6
Excluding grants -6.4 -6.6 -15.9 -11.3 -8.8 -14.6 -10.2 -9.8 -8.9 -7.9 -7.2 -6.2 -5.6
Financing 1.1 0.2 10.0 8.0 7.3 8.6 4.3 5.5 4.7 2.9 2.7 2.4 2.5Domestic financing (net) -0.8 -0.9 4.0 3.1 4.3 1.7 1.8 3.1 2.5 0.5 0.4 0.2 0.2
Banking system 0.3 -1.8 -0.3 -0.2 1.7 -0.4 -0.4 0.9 0.3 0.3 0.2 0.3 0.6Nonbank financing -1.1 0.9 4.2 3.3 2.5 2.1 2.2 2.2 2.2 0.2 0.1 -0.1 -0.4
Of which: Bank Privatization proceeds … … 2.6 0.7 0.2 2.1 0.8 0.8 0.0 0.0 0.0 0.0 0.0External financing (net) 1.9 1.1 6.0 4.9 3.1 6.9 2.5 2.4 2.2 2.4 2.4 2.2 2.3
Exceptional financing 2.6 2.6 1.2 1.1 0.8 0.6 0.9 0.8 0.5 0.0 0.0 0.0 0.0ECF credit 1.1 1.0 0.0 0.0 0.0 0.0 0.0 0.0 0.0 0.0 0.0 0.0 0.0Other identified financing (budget support) 1.1 1.6 1.2 1.1 0.8 0.6 0.9 0.8 0.0 0.0 0.0 0.0 1.0
Residual/unidentified financing ( + = financing needs)2 0.7 0.7 0.7 0.0 -1.0 1.6 1.3 0.0 0.0 1.3 0.9 0.5 0.1
Memorandum Items:
Tax exemptions recorded by DGI and DGD as revenue3
0.5 0.6 … … 0.3 … … 1.8 1.7 … … … …Nominal GDP (CFAF billions) 1,571 1,772 1,756 1,879 1,999 2,154 2,138 2,154 2,337 2,539 2,762 2,995 3,239Sources: Togolese authorities and IMF staff estimates and projections.
Proj.
3 DGD started collecting data on tax exemptions on imports in 2013. The amount of these exemptions in 2013 is estimated at CFAF 28 bill (1.3 percent of GDP).
2 Identifies residual for past years (i.e. 2012) and financing gap for current and future years (i.e. 2013 onward). In keeping with practice under the previous ECF-supported program, unidentified financing from 2014 on is calculated without assuming any external budget support (i.e. exceptional financing).
1 Includes the BCEAO credit for domestic arrears clearance.
(Percent of GDP)
20112010 2012 2013

TOGO
26 INTERNATIONAL MONETARY FUND
Table 4. Togo: Monetary Survey, 2010–18
2010 2011 2012 2013 2014 2015 2016 2017 2018Act. Act. Act.
Net foreign assets 259.5 291.1 273.8 245.9 220.4 239.6 271.3 309.2 305.2BCEAO 193.5 200.2 76.6 78.2 66.2 77.7 93.2 113.3 128.8
Assets 352.4 397.1 219.2 220.9 208.8 220.3 235.8 255.9 271.5Liabilities -159.0 -196.9 -142.6 -142.6 -142.6 -142.6 -142.6 -142.6 -142.6
Commercial banks 66.0 90.9 197.2 167.6 154.2 161.9 178.1 195.9 176.3Assets 169.8 226.5 357.0 303.4 279.2 293.1 322.4 354.7 319.2Liabilities 103.8 135.6 159.8 135.8 124.9 131.2 144.3 158.7 142.9
Net domestic assets 457.1 540.6 631.9 803.7 928.9 1015.3 1136.1 1220.1 1358.3Credit to government (net) 138.8 98.9 129.7 148.2 155.1 162.8 169.2 178.2 196.4
BCEAO 62.2 71.4 74.2 72.4 68.1 68.0 68.0 68.0 68.0Commercial banks 76.6 27.6 55.5 75.8 87.0 94.7 101.2 110.1 128.5
Credit to nongovernment sector 358.5 505.6 601.7 691.9 761.1 837.2 937.7 1031.5 1134.6Other items (net) -40.4 -64.4 -99.6 -36.4 12.7 15.3 29.3 10.5 27.2
Money supply (M2) 717.0 831.3 905.6 1049.6 1149.3 1254.9 1407.4 1529.4 1663.4
Currency in circulation 183.3 193.8 161.5 177.7 191.0 201.6 228.6 233.1 237.8 Bank deposits 533.7 637.5 744.0 871.9 958.2 1053.3 1178.9 1296.2 1425.6
Net foreign assets 3.0 4.4 -2.1 -3.1 -2.4 1.7 2.5 2.7 -0.3BCEAO 5.1 0.9 -14.9 0.2 -1.1 1.0 1.2 1.4 1.1Commercial banks -2.2 3.5 12.8 -3.3 -1.3 0.7 1.3 1.3 -1.4
Net domestic assets 13.2 11.6 11.0 19.0 11.9 7.5 9.6 6.0 9.8 Credit to government (net) 4.3 -5.6 3.7 2.0 0.7 0.7 0.5 0.6 1.3 Credit to nongovernment sector 10.3 20.5 11.6 10.0 6.6 6.6 8.0 6.7 7.3 Other items (net) -1.4 -3.3 -4.2 7.0 4.7 0.2 1.1 -1.3 1.2
Money supply (M2) 16.3 15.9 8.9 15.9 9.5 9.2 12.2 8.7 8.8 Currency in circulation 7.0 1.5 -3.9 1.8 1.3 0.9 2.1 0.3 0.3 Bank deposits 9.3 14.5 12.8 14.1 8.2 8.3 10.0 8.3 9.2
Memorandum items:Velocity (GDP/end-of-period M2) 2.2 2.1 2.2 2.1 2.0 2.0 2.0 2.0 1.9
Net foreign assets 16.5 16.4 13.7 11.4 9.4 9.4 9.8 10.3 9.4BCEAO 12.3 11.3 3.8 3.6 2.8 3.1 3.4 3.8 4.0
Assets 22.4 22.4 11.0 10.3 8.9 8.7 8.5 8.5 8.4Liabilities -10.1 -11.1 -7.1 -6.6 -6.1 -5.6 -5.2 -4.8 -4.4
Commercial banks 4.2 5.1 9.9 7.8 6.6 6.4 6.4 6.5 5.4Assets 10.8 12.8 17.9 14.1 11.9 11.5 11.7 11.8 9.9Liabilities 6.6 7.7 8.0 6.3 5.3 5.2 5.2 5.3 4.4
Net domestic assets 29.1 30.5 31.6 37.3 39.7 40.0 41.1 40.7 41.9Credit to government (net) 8.8 5.6 6.5 6.9 6.6 6.4 6.1 5.9 6.1
BCEAO 4.0 4.0 3.7 3.4 2.9 2.7 2.5 2.3 2.1Commercial banks 4.9 1.6 2.8 3.5 3.7 3.7 3.7 3.7 4.0
Credit to nongovernment sector 22.8 28.5 30.1 32.1 32.6 33.0 33.9 34.4 35.0Other items (net) -2.6 -3.6 -5.0 -1.7 0.5 0.6 1.1 0.4 0.8
Money supply (M2) 45.6 46.9 45.3 48.7 49.2 49.4 51.0 51.1 51.4
Currency in circulation 11.7 10.9 8.1 8.3 8.2 7.9 8.3 7.8 7.3 Bank deposits 34.0 36.0 37.2 40.5 41.0 41.5 42.7 43.3 44.0
Sources: Central Bank of West African States and IMF staff estimates and projections.
(Annual change, as a percent of beginning-of-period broad money)
(Billions of CFA Francs)
(In percent of GDP)
Proj.
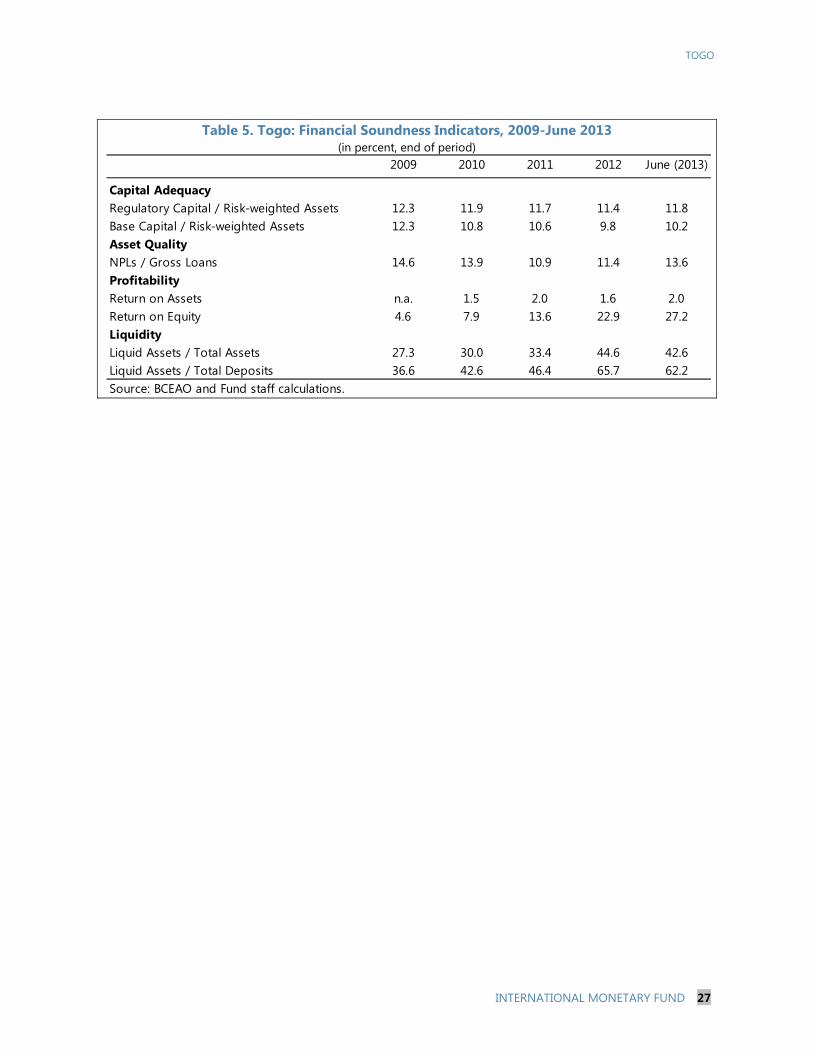
TOGO
INTERNATIONAL MONETARY FUND 27
Table 5. Togo: Financial Soundness Indicators, 2009-June 2013
(in percent, end of period)
2009 2010 2011 2012 June (2013)
Capital AdequacyRegulatory Capital / Risk-weighted Assets 12.3 11.9 11.7 11.4 11.8Base Capital / Risk-weighted Assets 12.3 10.8 10.6 9.8 10.2Asset QualityNPLs / Gross Loans 14.6 13.9 10.9 11.4 13.6ProfitabilityReturn on Assets n.a. 1.5 2.0 1.6 2.0Return on Equity 4.6 7.9 13.6 22.9 27.2LiquidityLiquid Assets / Total Assets 27.3 30.0 33.4 44.6 42.6Liquid Assets / Total Deposits 36.6 42.6 46.4 65.7 62.2Source: BCEAO and Fund staff calculations.

TOGO
28 INTERNATIONAL MONETARY FUND
Appendix I. Togo Risk Assessment Matrix1
Source of Risk Likelihood Expected impact on economy
Nature of Impact
Short Term (1 year) Sharp decline in growth in Togo’s regional partners
Low Medium Togo’s economy is relatively open, so a decline in external demand would reduce potential growth, although domestic factors, especially public and private investment, have played a significant role in recent growth performance.
Social unrest High Medium Generalized poverty in the country constitutes an environment prone to social unrest, which may generate demonstrations and major economic disruption, although public order and security are well established.
Delays in fiscal adjustment
Medium HiG2gh Policy slippages may materialize to: (i) accelerate infrastructure investment too rapidly, in a context of low capacity at all stages of the investment cycle; (ii) yield to requests to settle all old debts without adequate checks; and (iii) rapidly increase public sector wages and employment. Under social and political pressure, the authorities may delay taking decisive action on PFM and OTR reforms.
Risks to financial sector stability
High High Some public sector banks have been poorly managed. A lot needs to be done to improve supervision of microcredit institutions. Both sectors pose risks for financial sector stability and fiscal costs.
Medium- to Long-Term (2 to 4 years) 2 Power supply shortfalls
High High Planning and regulatory inaction and poor operational management of utilities may lead to widespread power cuts. In the short term, this will result in budget costs.
Weather shock: flooding or drought
Medium Medium Flooding and drought are a recurring event in Togo, but their impact is typically short-lived and/or localized.
Protracted period of slower European growth
High Low Togo’s export base is diversified by country and product. Main source of remittances are Europe and WAEMU. Both channels have proven stable over recent years.
Lower-than-anticipated emerging market (EM) growth potential
Medium Medium Togo’s exports are diversified consisting mainly of primary commodities to emerging and developing countries, whose price is a function of global economic conditions. China is mainly a source of imports and loans for public works. A slowdown in EMs could actually lower import prices.
Policy slippages in connection with local (2014) and presidential (2015) elections
Medium Medium The local elections are not likely to result in slippages. However, the presidential elections are likely to limit the authorities’ ability to exercise fiscal discipline, pursue structural reforms, and share the fruits from growth more equally.
Resistance to reforms from entrenched interests affecting mining, infrastructure investment and business environment reform
High High Political and private interests often overlap, and are essential to maintain the current stability. Reforms diminishing the control exercised by entrenched groups are likely to meet strong resistance. Delays in reforms would slow economic growth, increase inequality, and potentially lead to pressure for political change.
1 The Risk Assessment Matrix (RAM) shows events that could materially alter the baseline path (the scenario most likely to materialize in the view of IMF staff). The relative likelihood of risks listed is the staff’s subjective assessment of the risks surrounding the baseline (“low” is meant to indicate a probability below 10 percent, “medium” a probability between 10 and 30 percent, and “high” a probability of 30 percent or more). The RAM reflects staff views on the source of risks and overall level of concern as of the time of discussions with the authorities. 2 Some of these risks (e.g., weather related emergency) could materialize in the short-term as well.

TOGO
INTERNATIONAL MONETARY FUND 29
0
10
20
30
40
50
60
2000 2002 2004 2006 2008 2010 2012
DepositLoanM2
Figure 1b: WAEMU Financial Deepening Indicators(In percent of GDP)
0
10
20
30
40
50
60
2000 2002 2004 2006 2008 2010 2012
DepositLoanM2
Figure 1a: Togo Financial Deepening Indicators(In percent of GDP)
Appendix II. Financial Sector Profile
The financial sector in Togo experienced considerable deepening over the last decade. However, lack of broad access to credit in spite of this growth remains a challenge. Lack of competition among banks to reach new customers and concentration around Lomé (despite increases in the number of branches) prevent a wider reach, especially in rural areas. The microfinance sector plays an important role where traditional banking services do not function efficiently, but the sector is plagued by unregulated activity. At the broader level, while traditional risk metrics such as improving capital adequacy and NPLs suggest there is aggregate stability, there are individual banks that do not meet prudential requirements. The overall soundness of the system can thus be threatened by a further deterioration of these banks unless timely action is taken. Reinforcing this point, a stress test that was conducted recently suggests that the banking sector is vulnerable to insolvency and illiquidity crises in the face of shocks that can exploit systemic asset concentrations, underlining the fragility of aggregate stability.
A. Banking System
1. Indicators of depth and overall financial stability show encouraging signs.1 Indicators of financial depth have risen steadily, and compare favorably with the WAEMU average (Text Figures 1a and 1b). The deposit-to-GDP ratio has more than doubled since 2000 to 38 percent, while for WAEMU, the same ratio stands at 25 percent.
2. Financial sector indicators (FSIs) suggest the system is well capitalized, although a couple of banks display substantial weaknesses. The gross NPL ratio appears to be stable near 11 percent, but caution is warranted. The loan composition of the portfolio indicates excessive concentration in some sectors. Over 70 percent of loans flow to commerce, manufacturing and transportation, exposing the banking sector to risk of loan concentration in the event of a common shock to these sectors’ profitability. Furthermore, loans allocated to the five largest enterprises account for over 70 percent of total capital, underlining exposure to a potentially correlated shock 1 Abiding by Basel I standards prevents use of proper risk-based approaches to evaluate the stability of banks in Togo. For instance, bank holdings of sovereign debt are given zero risk weighting in calculating prudential ratios. Similarly, claims on financial institutions are given a risk-weight of 20 percent regardless of actual creditworthiness of the institution. Thus, these standards may overestimate solvency ratios for banks that actively pursue transactions in government securities.
TOGO
30 INTERNATIONAL MONETARY FUND
among important stakeholders in the system. Indeed, IMF (2013) shows that stress tests at the WAEMU level indicate that concentration of lending represents one of the main risks in the financial system.
3. There are indications of limited competition. The four largest banks account for over 60 percent of total assets, total deposits and total loans in 2012. While measures of industrial concentration are not always the best indicators for market dominance, lending policies and interest rates for loans paint a consistent picture, namely inertia to lower rates. The thin network of branches outside Lomé enhances the lack of competition by rendering transportation cost a non-trivial factor in the choice of bank. Furthermore, the ratio of non-interest income to total income provides an indication of the relative importance of bank commissions and fees in generating income. The ratio, although declining since 2004, was at 41 percent in 2011. A high ratio is a reflection of a business model characterized by lack of lending opportunities and hence concentrated in other financial services apart from providing loans.
4. Bank privatization has fallen short of expectations. Banks in Togo reached near-bankruptcy in mid-2000s mainly due to heavy exposure to NPLs of state-owned enterprises. Three major state-owned banks (BTCI, UTB and BIA-T) had to be recapitalized through a securitization process, and one private bank (Ecobank Togo) underwent restructuring. Bad loans were removed from their balance sheets in return for bonds, which are eligible for BCEAO refinancing. The authorities decided to recover the bad loans via an asset recovery company.2 In order to improve governance and compensate for the heavy budgetary impact of recapitalization (CFAF 88.1 billion, 6.2 percent of GDP), the authorities decided to privatize the three state-owned banks in addition to a fourth one, which did not need financial restructuring in 2008 (BTD). However, only two banks— BTD and BIA-T—were eventually privatized.
B. Risk Assessment
5. Stress-testing of the Togolese banking system reveals credit risks. The most important result of the stress-test is that, in the event of the default of the largest borrower in the system, the capital adequacy ratio (CAR) falls 70 percent for banks of all sizes. Specifically, the medium and large banks have the greatest insolvency risk due to a decline in their CARs relative to the baseline scenario. However, the smallest banks are at greatest risk of a run under simulated liquidity risks. Similarly, testing the concentration risk of loans to certain sectors (commerce, manufacturing and transportation) demonstrates that stagnation in each of these sectors would put primarily the medium and large banks at risk. This is a first order impact, and it should be viewed as a generous estimate. One would expect effects to pass into the remaining sectors, and feed back to the entire financial system, including smaller banks.
2 The launch of the Société de Recouvrement du Togo (SRT) has suffered extensive delays. It became operational only in early 2013, but its operational strategy is not yet approved, and it has recovered a limited volume of assets.
TOGO
INTERNATIONAL MONETARY FUND 31
C. Microfinance Sector
6. The microfinance sector has been growing rapidly. Deposits and loans increased by 77 percent and 80 percent respectively, between 2008 and 2012. At end 2012, the level of savings in the sector stood at CFAF 116 billion, 16 percent of the financial system deposits whereas credit was at CFAF 103 billion, approximately 14 percent of overall financial sector credit.
7. The years 2010 and 2011 were characterized by a crisis of confidence among savers. One major institution, IDH, was put under temporary receivership in July 2010 after being declared bankrupt. However, its resolution has made limited progress since.3 In this context, the growth of NPLs in the sector from 3.2 percent in 2011 to 5 percent in 2012 is worrisome, and requires monitoring.
8. Insufficient technical capacity contributes to the problem of ineffective supervision. Currently, there are two institutions that supervise the sector, CASIMEC and WAEMU Banking Commission. Large networks fall under the responsibility of the WAEMU Banking Commission. while smaller operations are monitored by CASIMEC, an institution within the Ministry of Finance. However, there are currently significant capacity and technical issues. The supervisory infrastructure lacks the technical means to develop tracking systems to enforce licensing rules, and make decisions on dealing with the many small and decentralized entities it should supervise. Indeed, currently there are sixty-three illicit microfinance entities. A strategy still has to be devised to either incorporate these institutions into the regulatory system or to close them.
D. Policy Advice
9. In the short run, financial sector consolidation should be favored over broadening and deepening. A combination of banks, including new Pan-African banks, aggressively expanding into Togo’s financial sector, weak supervision, and conditions in microfinance are increasing financial vulnerability if unaddressed. The offer of banking services for Togo’s small economy—and the formal sector—appear sufficient, for the time being, in quantity. What is lacking is an offer that better responds to quality criteria and the development needs of the economy. Thus, the short term priority in sectoral reform should be to tighten multilateral surveillance through the Banking Commission and other financial sector supervisors, and harmonize coordination with national authorities, which license financial sector activity.
10. At the regional level the bank resolution framework should be revamped through greater executive powers for the Banking Commission, more effective recapitalization and bankruptcy proceedings to prevent contagion. Policies should include: (i) strengthening capacity and the means of microfinance supervision to allow it to execute its mandate and impose decisions; (ii) reducing the backlog of microfinance licensing, consolidating non-viable entities and closing illegitimate ones,
3 A new pyramid scheme emerged over the past year, but there has been a slow response in closing it down.

TOGO
32 INTERNATIONAL MONETARY FUND
and impeding the re-emergence of pyramidal schemes; and (iii) developing financial tools to assess and package risks, and broadening the basis of activity.
11. Medium-term objectives can then focus on increasing financial depth by enabling an efficiently functioning banking sector to rise to its full intermediary potential. This implies expanding financial access to a wider cross section of society while preserving the stability and the profitability of the banking system. To reach this goal (i) the legal framework should carefully design guarantees, property rights, and a viable insurance market, which are key elements to ease credit risk and collateral constraints, and hence would allow banks to lend at longer maturities, decrease loan rates, and diversify debt instruments to more effectively finance investment; (ii) there should be greater awareness of financial services, financial education and outreach, especially in rural areas; (iii) asymmetric information can be reduced by more transparency on potential borrowers through a functional credit registration system; (iv) existing modern technologies, including mobile phone-based ones, can facilitate payments when supported by appropriate regulatory infrastructure; and (v) business climate can improve by increasing the enforceability of contracts and ensuring more effective and consistent regulatory compliance.

TOGO
INTERNATIONAL MONETARY FUND 33
Selected References
Banque Africaine de Développement, 2012, “Développement du Marché des Capitaux“, Revue Economique Mensuelle, Novembre (Lomé : Banque Africaine de Développement).
Government of Togo, 2012, République du Togo – Stratégie et Plan d’Actions pour le Développement du Secteur Financier, 2012-2017.
International Monetary Fund, 2013, WAEMU – Financial Sector Review (Washington: International Monetary Fund).
Ministère de l’Economie et des Finances, 2012, “Diagnostic et Stratégie du Secteur de la Microfinance au Togo ; rapport final (version nettoyée), “ Document préparé dans le cadre de l’élaboration de la stratégie du secteur financier.
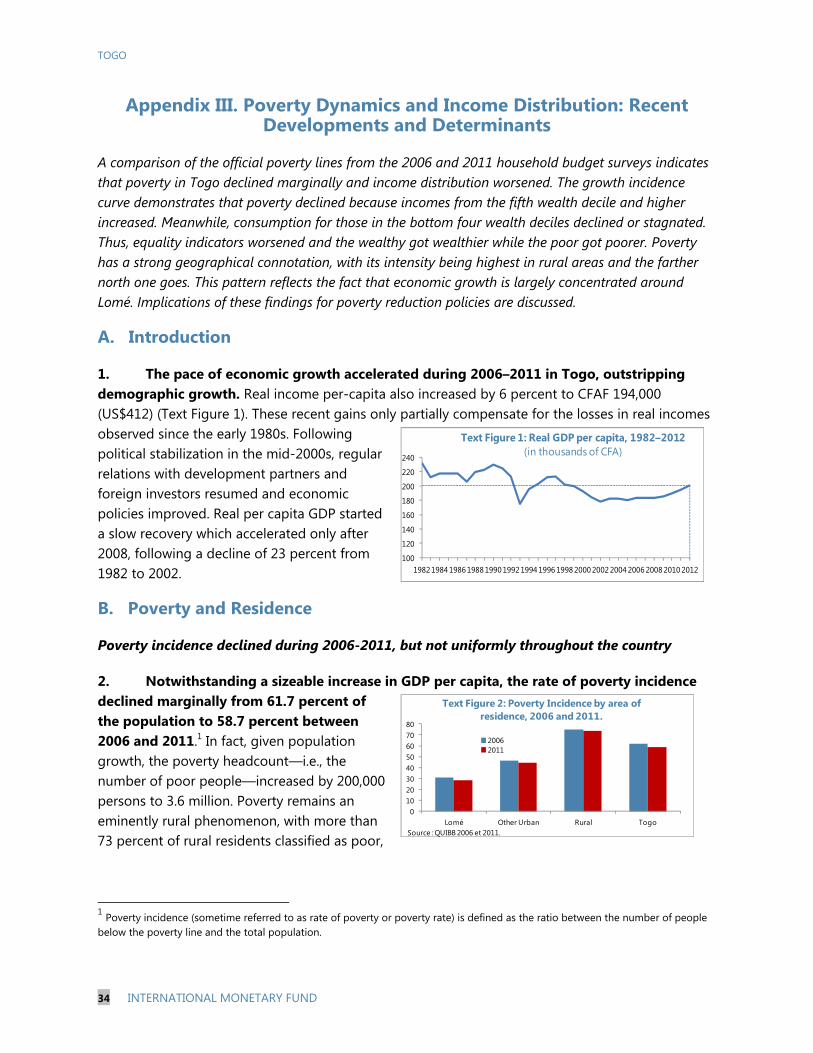
TOGO
34 INTERNATIONAL MONETARY FUND
01020304050607080
Lomé Other Urban Rural Togo
Text Figure 2: Poverty Incidence by area of residence, 2006 and 2011.
20062011
Source : QUIBB 2006 et 2011.
Appendix III. Poverty Dynamics and Income Distribution: Recent Developments and Determinants
A comparison of the official poverty lines from the 2006 and 2011 household budget surveys indicates that poverty in Togo declined marginally and income distribution worsened. The growth incidence curve demonstrates that poverty declined because incomes from the fifth wealth decile and higher increased. Meanwhile, consumption for those in the bottom four wealth deciles declined or stagnated. Thus, equality indicators worsened and the wealthy got wealthier while the poor got poorer. Poverty has a strong geographical connotation, with its intensity being highest in rural areas and the farther north one goes. This pattern reflects the fact that economic growth is largely concentrated around Lomé. Implications of these findings for poverty reduction policies are discussed.
A. Introduction
1. The pace of economic growth accelerated during 2006–2011 in Togo, outstripping demographic growth. Real income per-capita also increased by 6 percent to CFAF 194,000 (US$412) (Text Figure 1). These recent gains only partially compensate for the losses in real incomes observed since the early 1980s. Following political stabilization in the mid-2000s, regular relations with development partners and foreign investors resumed and economic policies improved. Real per capita GDP started a slow recovery which accelerated only after 2008, following a decline of 23 percent from 1982 to 2002.
B. Poverty and Residence
Poverty incidence declined during 2006-2011, but not uniformly throughout the country
2. Notwithstanding a sizeable increase in GDP per capita, the rate of poverty incidence declined marginally from 61.7 percent of the population to 58.7 percent between 2006 and 2011.1 In fact, given population growth, the poverty headcount—i.e., the number of poor people—increased by 200,000 persons to 3.6 million. Poverty remains an eminently rural phenomenon, with more than 73 percent of rural residents classified as poor,
1 Poverty incidence (sometime referred to as rate of poverty or poverty rate) is defined as the ratio between the number of people below the poverty line and the total population.
100
120
140
160
180
200
220
240
1982 1984 1986 1988 1990 1992 1994 1996 1998 2000 2002 2004 2006 2008 2010 2012
Text Figure 1: Real GDP per capita, 1982–2012(in thousands of CFA)
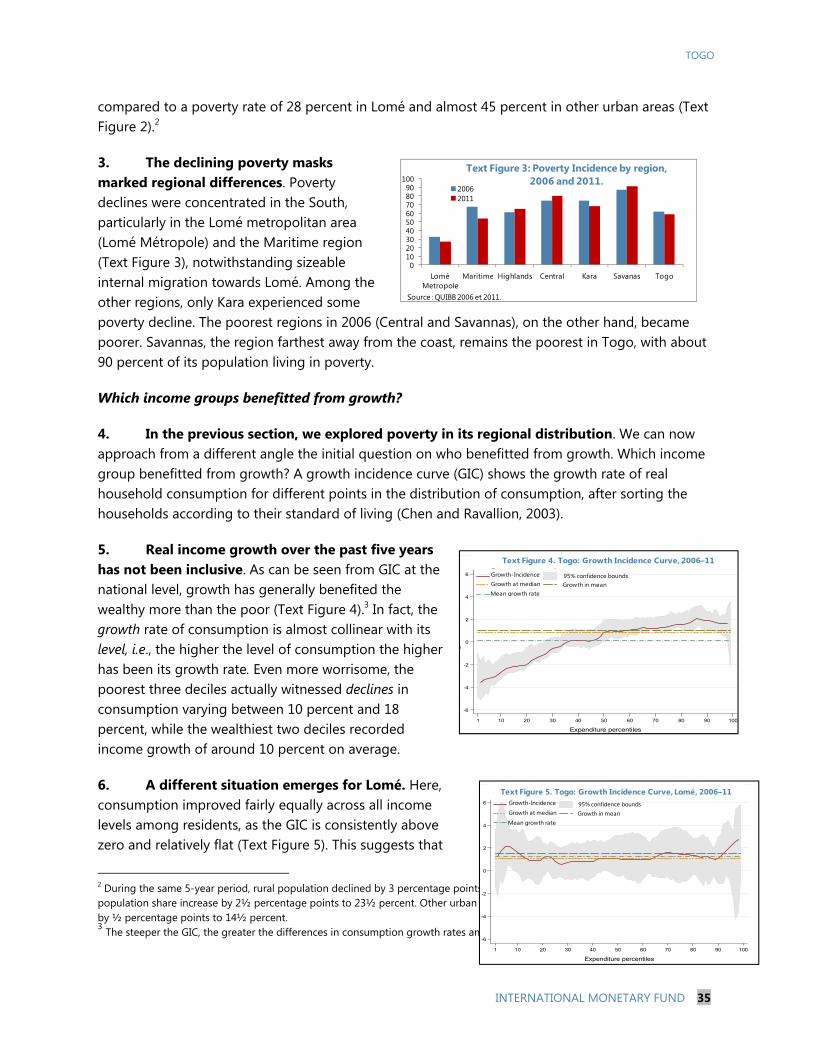
TOGO
INTERNATIONAL MONETARY FUND 35
0102030405060708090
100
Lomé Metropole
Maritime Highlands Central Kara Savanas Togo
Text Figure 3: Poverty Incidence by region, 2006 and 2011.
20062011
Source : QUIBB 2006 et 2011.
compared to a poverty rate of 28 percent in Lomé and almost 45 percent in other urban areas (Text Figure 2).2
3. The declining poverty masks marked regional differences. Poverty declines were concentrated in the South, particularly in the Lomé metropolitan area (Lomé Métropole) and the Maritime region (Text Figure 3), notwithstanding sizeable internal migration towards Lomé. Among the other regions, only Kara experienced some poverty decline. The poorest regions in 2006 (Central and Savannas), on the other hand, became poorer. Savannas, the region farthest away from the coast, remains the poorest in Togo, with about 90 percent of its population living in poverty.
Which income groups benefitted from growth?
4. In the previous section, we explored poverty in its regional distribution. We can now approach from a different angle the initial question on who benefitted from growth. Which income group benefitted from growth? A growth incidence curve (GIC) shows the growth rate of real household consumption for different points in the distribution of consumption, after sorting the households according to their standard of living (Chen and Ravallion, 2003).
5. Real income growth over the past five years has not been inclusive. As can be seen from GIC at the national level, growth has generally benefited the wealthy more than the poor (Text Figure 4).3 In fact, the growth rate of consumption is almost collinear with its level, i.e., the higher the level of consumption the higher has been its growth rate. Even more worrisome, the poorest three deciles actually witnessed declines in consumption varying between 10 percent and 18 percent, while the wealthiest two deciles recorded income growth of around 10 percent on average.
6. A different situation emerges for Lomé. Here, consumption improved fairly equally across all income levels among residents, as the GIC is consistently above zero and relatively flat (Text Figure 5). This suggests that
2 During the same 5-year period, rural population declined by 3 percentage points to 62 percent of total, while Lomé saw its population share increase by 2½ percentage points to 23½ percent. Other urban areas saw their share of the population increase by ½ percentage points to 14½ percent. 3 The steeper the GIC, the greater the differences in consumption growth rates among quintiles.
-6
-4
-2
0
2
4
6
g
1 10 20 30 40 50 60 70 80 90 100
Expenditure percentiles
Growth-incidence 95% confidence bounds
Growth at median Growth in mean
Mean growth rate
Total (years 2006 and 2011)Text Figure 4. Togo: Growth Incidence Curve, 2006–11
Growth-IncidenceGrowth at medianMean growth rate
95% confidence boundsGrowth in mean
-6
-4
-2
0
2
4
6
1 10 20 30 40 50 60 70 80 90 100
Expenditure percentiles
Growth-incidence 95% confidence bounds
Growth at median Growth in mean
Mean growth rate
Lomé urbain
Growth-Incidence
Growth at median
Mean growth rate
95% confidence boundsGrowth in mean
Text Figure 5. Togo: Growth Incidence Curve, Lomé, 2006–11

TOGO
36 INTERNATIONAL MONETARY FUND
the capital city offers more formal and informal opportunities for its resident—across all income levels—to benefit from economic growth.
7. In rural areas, the benefits from national economic growth have accrued even less to the poor. The poorest 65 percent of residents in rural areas actually saw their consumption decline (Text Figure 6). This suggests that residents of rural areas are facing obstacles in partaking in the benefits of economic growth. Only the wealthiest 35 percent or residents experienced an increase in consumption. In these circumstances, not surprisingly, inequality—as measured by the Gini coefficient—increased between 2006 and 2011. The Gini coefficient rose from 0.361 in 2006 to 0.393 in 2011.4 Although at 0.393 the level of inequality is similar to that of countries in the sub-region, an increase of 3 percentage points over five years is significant.
C. Food Insecurity and Migration
8. Food insecurity is pervasive and highly seasonal in rural areas. In the months of June and July up to 20 percent of households in rural areas face food shortages (Text Figure 7). This drops to around 5 percent between September and December (after the main harvest) and then starts to increase again. In and around Lomé on the coast, food insecurity is low and constant throughout the year. In other urban areas, food security is also an issue but the degree it varies throughout the year suggests that consumption smoothing is less of a problem than consumption levels. Rural households have difficulty smoothing their consumption, probably due to limited or precarious monetary incomes to afford higher prices during off-seasons. These patterns point towards a potentially important area of policy intervention, that includes improving the functioning of rural markets, improving possibilities for storage and access to off-farm income earning opportunities (including cash for work or food for work) to allow households to purchase food during the lean season.
9. Rural-urban migration has been a driver of poverty reduction. Higher levels of welfare in urban areas attract migrants from other areas. To establish how migration contributes to poverty reduction, changes in poverty incidence between 2006 and 2011 have been decomposed into how
4 A Gini coefficient of 1 implies that inequality is at the maximum level. A Gini coefficient of zero implies that everybody’s income is
the same.
-6
-4
-2
0
2
4
6
1 10 20 30 40 50 60 70 80 90 100
Expenditure percentiles
Growth-incidence 95% confidence bounds
Growth at median Growth in mean
Mean growth rate
RuralFigure 6. Togo: Growth Incidence Curve, Rural, 2006–11Growth-IncidenceGrowth at median
Mean growth rate
95% confidence boundsGrowth in mean
0
0.05
0.1
0.15
0.2
0.25
Perc
ent o
f hou
seho
lds
that
is
food
inse
cure
Text Figure 7. Togo: Percent of households facing food shortages by location (2011)
Rural Other urban Urban Golf

TOGO
INTERNATIONAL MONETARY FUND 37
much of the total poverty reduction is due to reductions when households stayed within urban or rural areas, and how much is due to rural-urban migration (a third term establishes the interaction between the two). Applying this decomposition shows that of the total drop in poverty incidence of 3 percentage points, about one third (1.1 percent) is attributable to internal migration. Migration is thus an important contributor to poverty reduction.
D. Policy Implications
10. Rising inequality and poverty patterns suggest different policies for different wealth groups. Poor households, largely found in rural areas, would benefit from policies that raise agricultural productivity and lower barriers to participate in markets. With urban food markets set to continue to grow, opportunities for farmers to sell their surplus staples would increase. Therefore, more policy attention should be devoted to feeder roads, local transportation, increased agricultural extension, improved price incentives (e.g., passing on to farmers a greater proportion of international agricultural commodity prices as has been done for cotton), better storage facilities and the provision of agricultural inputs in an efficient and cost effective manner (World Bank, 2013a).
11. Social safety nets targeted towards the poorest would help alleviate the high and seasonal levels of food insecurity. Cash transfers and school feeding programs, especially if they are conditional, are typically inexpensive fiscally and quite effective socially (Arze del Granado and Adenauer, 2011). The strong geographical and seasonal connotation of food insecurity provides an opportunity to implement geographically targeted and seasonal income support programs. The current cash transfer and school feeding programs, currently implemented on a pilot basis, have the potential to provide income relief to the poorest, and create forward and backward linkages within the rural economy.
12. Although migration brings the risk of urban gridlock and inefficiency, if managed well, it could contribute to higher total factor productivity and incomes. Urban planning should thus take a more prominent role in the authorities’ poverty reduction strategy and emphasize public urban and peri-urban transportation in a context of an economically vibrant capital region. Also, policies that build human capital across the nation (universal access to quality education, nutrition policies, access to health care) that enhance the capacity of (potential) migrants should be emphasized.
13. Two characteristics of developments in SSA are relevant to chart poverty-reduction policies in Togo, given its context of internal migration. First, there is increasing evidence of the importance of the development of secondary towns for poverty and inequality reduction (World Bank, 2013a). In this context, market-friendly public policies—fostering availability of banking and other tertiary services, investing in local roads and transportation networks, education and health services—are likely to have a more positive and permanent impact than the regional fiscal incentives (i.e., policies based on tax exemptions and free enterprise zones) preferred by the authorities. Second, the informal sector is the new normal in SSA and is leading in employment creation. To

TOGO
38 INTERNATIONAL MONETARY FUND
support its development, tax compliance regulations, accounting, and regulatory policies should be simplified for enterprises below fairly high turnover thresholds.

TOGO
INTERNATIONAL MONETARY FUND 39
Selected References Arze del Granado, Javier, and Isabell Adenauer, 2011, “Burkina Faso—Policies to Protect the Poor
from the Impact of Food and Energy Price Increases, IMF Working Paper 11/202 (Washington: International Monetary Fund).
Chen, Shaohua, and Martin Ravallion, 2003, “Measuring Pro-Poor Growth,” Economic Letters, 78, pp.93-99.
Coulombe, Harold, and Chata Malé, 2012, Togo: Poverty Profile 2006-2011, (Lomé: National Directorate of Statistic and National Accounts).
Garcia, Marito, and Charity M. T. Moore, 2012, The Cash Dividend: The Rise of Cash Transfer Programs in Sub-Saharan Africa. (Washington: World Bank).
IMF, 2011, “How Inclusive Has Africa’s Recent High Growth Episode Been?”Sub-Saharan Africa—Regional Economic Outlook, Fall, (Washington: International Monetary Fund).
Mason, Nicole, William Burke, Arthur Shipekesa, , and T.S. Jayne, , 2011, The 2011 Surplus in Smallholder Maize Production and Zambia: Drivers, Beneficiaries, and Implication for Agricultural and Poverty Reduction Policies, Food Security Research Project Working Paper no. 58.
National Directorate of Statistic and National Accounts, 2011, Questionnaire on Core Welfare Indicators (QUIBB, 2011) (, Lomé: Ministry of Economic Planning, Development and Territorial Management).
National Directorate of Statistic and National Accounts, 2012, Mapping poverty in Togo in 2011 (Lomé: Ministry of Economic Planning, Development and Territorial Management).
World Bank, 2011, “Les Filets Sociaux au Togo” Draft Report (Washington: World Bank).
World Bank, 2013a, Africa Pulse, Volume 7, pp. 20-25, April (Washington: World Bank).
World Bank, 2013b, “Maintaining the Momentum – With a Special Focus on Rwanda’s Pathway out of Poverty”, Rwanda Economic Update: Fourth Edition. (Washington: World Bank).

TOGO
40 INTERNATIONAL MONETARY FUND
Appendix IV. External Sector Stability Assessment and Matrix
This note aims to assess external stability of the Togolese economy. Togo recorded continuous current account deficit since 2000, financed mainly by official aid flows. The current account deficit increased in 2011 to 9.1 percent driven by higher food and oil prices. In 2012, there was further deterioration of the deficit to 11.8 percent on account of higher imports for public and private investments. The current account deficit is expected to remain in the 9-10 percent range until 2016, and improve afterwards upon the completion of the ongoing investment projects. The deterioration in the current account deficit is expected to be financed by a pick-up in inward FDI as well as project loans. The real exchange rate is broadly in line with economic fundamentals. Improving Togo’s competitiveness rests on implementing structural measures to improve the business environment. The external position assessment matrix (Text Table 4) provides a summary of Togo’s external sector stability.
A. Balance Payment Assessment
1. Over the past decade, Togo recorded persistent current account deficits, which are expected to remain high over the next four years. During 2000-11, Togo had an average deficit of about 8.2 percent. This has been mainly financed by official grants and concessional financing, which has been making Togo susceptible to changes in donor support. In 2011, owing to the surge in oil and food prices, the deficit increased to 9.1 percent. In 2012, as capital imports grew—notably due to higher level of public and private investments—the current account deficit increased to 11.8 percent. These include the expansion of the international airport and the port of Lomé, and construction of a new clinker factory. In light of the ongoing investments, the deficit is expected to remain at around 10 percent until 2015. Upon completion of these infrastructure investments, Togo’s production, and thus, export capacity is projected to improve while project-linked capital imports should decrease.
2. The widening of the current account deficit has been financed mostly through aid, and is expected to remain so over the projection period. However, aid decreased in 2012 in the absence of an IMF-supported program.
2000 2001 2002 2003 2004 2005 2006 2007 2008 2009 2010 2011 2012
Current account balance (including grants) -8.9 -8.8 -8.9 -9.3 -10.0 -8.6 -8.7 -6.7 -6.8 -6.6 -6.3 -9.1 -11.8Current account balance (excluding grants) -9.1 -9.0 -8.3 -9.9 -10.8 -8.7 -9.8 -8.1 -8.3 -8.2 -8.3 -11.4 -13.6 Exports 35.3 35.1 40.7 43.2 38.4 45.9 39.4 39.5 35.5 36.7 40.2 40.7 39.6 Imports 48.8 50.4 54.7 58.9 57.6 64.6 57.9 56.8 52.0 52.3 57.3 59.0 58.7
Private flows 6.3 7.9 5.7 7.2 10.3 9.2 9.8 9.7 8.7 8.0 8.0 7.3 6.5
Capital and financial account 7.3 5.8 5.1 2.7 9.4 3.9 0.0 9.4 6.0 0.0 2.9 9.3 5.6
Foreign direct investment 3.3 5.5 3.9 2.4 3.7 5.0 4.3 2.1 1.3 0.4 1.5 1.7 1.6
Errors and omissions -1.1 -0.8 -0.1 1.0 -0.9 -0.4 0.0 0.6 0.6 0.0 0.5 -4.8 -2.7
Overall balance -2.5 -3.5 -3.0 -5.6 -1.5 -4.0 0.0 2.0 1.0 0.0 -2.7 -4.6 -8.9
Source: Country authorities and IMF staff calculations
Text Table 1: Balance of Payments: Selected items
(in percentage of GDP)

TOGO
INTERNATIONAL MONETARY FUND 41
3. Since 2010, Togo’s exports have been around 40 percent of GDP, and are expected to remain at this level until 2017. However, during 2000-10, the country’s exports fluctuated notably, averaging around 32 percent of GDP per annum. This can be attributed to the fluctuations in phosphate and cotton exports. Between 2013 and 2016, the export revenue from these products as a percentage of GDP is projected to remain stable. From 2017 onwards, the planned public investments are expected to result in higher export capacity.
4. Cotton, phosphates, cement and clinker, cocoa and coffee have been Togo’s main exports, and still constitute more than 40 percent of total exports (Text Figure 1). The most notable decrease was observed for cement and clinker exports. The ongoing public and private investment projects are expected to result in higher export capacity of these goods. However, the country can still benefit from further diversification of its export portfolio.
5. In terms of openness, Togo’s share in total world exports of goods and services increased from 0.004 percent in 2000 to 0.007 percent in 2012, documenting an improvement over the past decade (Text Figure 2).
6. Foreign direct investment has been and is expected to remain a stable source of financing in Togo. While FDI slowed down from an average of 3.8 percent in the first half of the 2000s to around 1.5 percent in the second half, it is expected to increase in accordance with the ongoing public and private investments over the projection period. Moreover, improvement in infrastructure is expected to attract higher levels of FDI.
7. Workers’ remittances have been an increasing source of foreign exchange, and constituted around 7 percent of GDP in 2012. Since 2000, they have been on an upward trend and are expected to remain high. When compared with the FDI flows, remittances provided a larger amount of financing over the past decade.
B. Exchange Rate Assessment
0
2,000
4,000
6,000
8,000
10,000
12,000
14,000
16,000
18,000
0.0000%
0.0010%
0.0020%
0.0030%
0.0040%
0.0050%
0.0060%
0.0070%
0.0080%
20
00
20
01
20
02
20
03
20
04
20
05
20
06
20
07
20
08
20
09
20
10
20
11
20
12
Text Figure 2: Exports: World and Togo
TOGO % of world exports World exports ($US billions)
0
2
4
6
8
10
12
2000 2001 2002 2003 2004 2005 2006 2007 2008 2009 2010 2011 2012
% G
DP
Text Figure 3: FDI and Remittances
Workers' Remittances FDI
0
100
200
300
400
500
600
700
0
10
20
30
40
50
60
70
20
00
20
01
20
02
20
03
20
04
20
05
20
06
20
07
20
08
20
09
20
10
20
11
20
12
CFA
F b
illio
ns
% o
f to
tal e
xpo
rts
Text Figure 1: Togo's main exports
Cotton Coffee Cocoa
Phosphates Cement & clinker Total exports (right axis)

TOGO
42 INTERNATIONAL MONETARY FUND
8. The real effective exchange rate (REER) depreciated slightly over the last two years, mainly reflecting weakness of the euro (to which the CFA franc is pegged), reversing an upward trend since 2000. The REER appreciation of about 17 percent during 2000-2009 has been partially offset in the last three years with the REER depreciating by almost 11 percent. While Togo’s exports have benefited, since 2010 imports have been increasing at a faster pace, leading to a widening current account deficit. As shown in the exchange rate assessment section below, Togo’s low level of competitiveness can be attributed to structural issues rather than exchange rate misalignment.
9. The exchange rate assessment finds that Togo’s real effective exchange rate (REER) was broadly in line with economic fundamentals in 2012. The overall findings of this analysis are consistent with the latest WAEMU exchange rate assessment, which finds no significant exchange rate misalignment and documents a depreciation of about 1 percent in 2012. The three CGER methods—macroeconomic balance (MB), equilibrium exchange rate (ERER) and external sustainability (ES) approaches—all suggest that REER was broadly in line with fundamentals in 2012.
10. The ERER method indicates a moderate undervaluation of the exchange rate, by about 3.8 percent. This compares to a 4.4 percent overvaluation in 2010, assessed at the time of the last Article IV consultation.
11. The MB approach indicates that the REER is slightly overvalued by 0.6 percent. The MB approach estimates the exchange rate adjustment necessary to close the gap between the equilibrium current account balance (the “norm”), based on economic fundamentals, and the underlying current account balance. For Togo, the equilibrium and the underlying current account deficits are estimated at about 2.8 percent and 3.6 percent of GDP, respectively. These results indicate that 0.6 percent depreciation in the REER would be needed to close the gap
12. Application of the ES approach to Togo indicates that the REER is slightly overvalued by about 0.4 percent, not a significant deviation from the equilibrium. The ES method
85
90
95
100
105
110
115
Jan-05 Jan-06 Jan-07 Jan-08 Jan-09 Jan-10 Jan-11 Jan-12 Jan-13
Text Figure 4. Togo. REER and NEER, Jan.05–Aug.13(2005=100)
Real Effective Exchange Rate, Consumer Price Index
Nominal Effective Exchange Rate, Consumer Price Index80
85
90
95
100
105
110
115
120
125
130
Text Figure 5. Togo and WAEMU: Effective Exchange Rates, 1995-2012(2000=100)
Togo NEER Togo REER (CPI-based) WAEMU REER
REER1
Methodology Norm Underlying
Macro-Balance -2.8 -3.6 0.6ERER … … -3.8
Ext. Sustainability -3.0 -3.4 0.4
1 "-" indicates undervaluation
Source: IMF staff estimates.
Text Table 2. Togo: Real Effective Exchange Rate Assessment
CAB/GDP

TOGO
INTERNATIONAL MONETARY FUND 43
compares the actual current account balance with the balance that stabilizes the net foreign assets (NFA) at a certain benchmark level. The underlying NFA-to-GDP ratio is -41 percent.
C. Non-Price Competitiveness
13. Survey-based indicators point to low non-price competitiveness. While Togo is not included in the World Economic Forum’s Competitiveness Index, the World Bank’s Doing Business Report 2013 ranks Togo as the 156th out of 185 countries. While Togo ranks at the same level as the average WAEMU country, it still faces particular challenges in protecting investors’ rights, enforcing contracts, starting a business, and accessing financing. Supply of infrastructure remains inadequate and procedures for paying taxes and registering propriety continue to be cumbersome (Panel chart 1).
14. The quality of governance, which has been historically weak, deteriorated since 2000 according to World Governance Indicators. These rankings are based on government effectiveness, regulatory quality, rule of law, control of corruption. Togo ranks below the average for sub-Saharan Africa (Panel chart 1).
15. In terms of political stability, Togo ranks lower than both its SSA and LIC peers. This highlights the need for improving political stability to ensure a more sustainable business environment (Figure 1).

TOGO
44 INTERNATIONAL MONETARY FUND
Figure 1. Togo : Business Environment and Governance
Sources: Doing Business, 2012; World Bank's Governance Indicators, 2011, (average of control of corruption, government effectiveness, rule of law, regulatory quality, political stability and voice and accountability); Economist Intelligence Unit (EIU) ; and IMS staff calculations.SSA = Sub-Saharan Africa; LIC=Low-income country; HIC= High-income countries; UMIC= Upper-middle income country; LMIC= Low-middle-income country; OIL=Oil producers; RR= Resource-rich countries; = ; WBI= World Bank Indicators.
0
25
50
75
100Ea
sier
for d
oing
bus
ines
s
Ease of Doing Business(Percentile rank; 100= better)
2008 2012
050
100150200
Starting a business
Dealing with construction
permits
Getting electricity
Registering property
Getting credit
Paying taxes
Trading across
borders
Enforcing contracts
Doing Business Indicators 2012
TGO Avg.SSAAvg.UMIC Avg.OILAvg.High Income
SSA
LIC
LMICUMIC
Oil-Exp.
RRC
TOGO
1
1.5
2
2.5
3
3.5
4
4.5
5
5.5
6 7 8 9 10 11 12
Log GDP PPP per capita
WGI and GDP per capita (log PPP)
0
10
20
30
40
50
60
TGO
Avg.
SSA
Avg.
LIC
Avg.
LMIC
Avg.
UM
IC
Avg.
OIL
Change in Governance Indicator(Percentile Rank of 6 score average, 100= best)
2000 2011
0.0
1.0
2.0
3.0
4.0
5.0
6.0
0
1
2
3
4
TOGO SSA LIC LMIC UMIC OIL RRC
EIU Democracy Index 2011, score (0 lowest, 10 highest)
WBI Political Stability 2011, estimate (5=highest)
Political and Democracy Stability Score
0.01.02.03.04.0
WBI Control of Corruption 2011,
estimate
WBI Regulatory Quality 2011,
estimate
WBI Government Effectiveness
2011, estimate
WBI Rule of Law 2011, estimate
WBI Political Stability 2011,
estimate
WBI Voice and Accountability 2011, estimate
World Bank Governance Indicators(re-scaled, 0=worst, 5 =best)
TOGOAvg.Low-IncomeAvg.Sub-Saharan Africa

TOGO
INTERNATIONAL MONETARY FUND 45
Text Table 4: External Position Assessment Matrix Current account
Background: The domestic saving rate is low, while the investment needs are high and costly. These have been mostly covered by official aid flows. The deficit has increased notably in the last two years as a result of both exogenous factors and high public and private investment. Assessment: The deficit is expected to remain high until 2016-17, reflecting the planned large-scale public and private investment projects to be undertaken. In 2013, a slight improvement in the deficit is foreseen due to the decrease in global commodity prices, which initially drove up the deficit in 2011. The financing for these investments are expected to be provided by official flows, concessional financing from both traditional and non-Paris Club lenders. In 2012, there was a notable increase in financing from non-traditional lenders, while multilateral financing decreased.
Overall assessment: The external position has been weakening significantly since 2011, and is expected to remain so until 2016/17 due to high amount of public and private infrastructure investments. Concurrently, the external debt position is expected to deteriorate. Potential policy responses: Fiscal consolidation and prudent borrowing should help reduce external vulnerabilities. The investment plans are expected to lead to higher production (export) capacity and lower current account deficit in the medium term. Togo is still facing challenges on competitiveness, which signals to a need of improved business environment.
Real exchange rate
Background: Togo is part of the WAEMU. The CFA franc is pegged to the euro, which depreciated significantly in recent years. Assessment: The three CGER methods do not suggest a significant misalignment. These findings are in line with those for the WAEMU. The underlying reasons for Togo’s low competitiveness is more on the non-price and business environment competitiveness side
Capital account: flows and measures
Background: Togo reached the HIPC completion point in 2010 and received debt relief. While remittances and FDI constitute a major portion of external inflows, the overall balance of payments has been reporting a deficit. Assessment: In 2012, project loans increased significantly and are expected to remain elevated. In line with large private investment projects, FDI is expected to increase over the next few years. The sustainability of capital account flows depends on forceful fiscal consolidation and additional bilateral and multilateral assistance that it could catalyze.
Foreign exchange intervention and reserves
Background: At the WAEMU level, reserves amount to over 5 months of imports, 60 percent of broad money and 100 percent of short-term debt. Common reserves can be used to finance the needs of individual WAEMU countries. Assessment: The level of foreign exchange reserves of the WAEMU is adequate.
Foreign asset and liability position
Background: Togo had a major improvement in its external debt indicators thanks to the 2010 HIPC debt relief it received. Gross external debt was around 18 percent in 2012. It consists of mainly of concessional loans from both official and commercial creditors. Assessment: Togo’s external debt is expected to increase to about 22 percent over the next four years. The DSA indicates moderate debt distress risk.
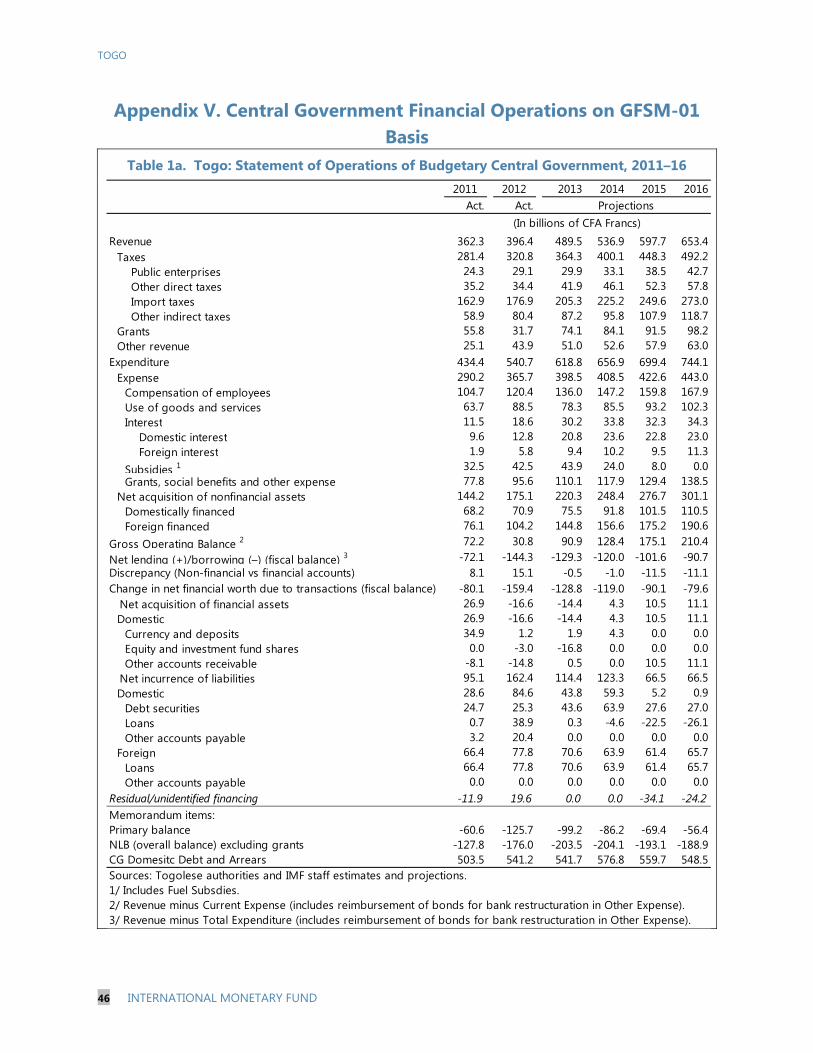
TOGO
46 INTERNATIONAL MONETARY FUND
Appendix V. Central Government Financial Operations on GFSM-01 Basis
Table 1a. Togo: Statement of Operations of Budgetary Central Government, 2011–16 2013 2014 2015 2016
Act. Act.
Revenue 362.3 396.4 489.5 536.9 597.7 653.4Taxes 281.4 320.8 364.3 400.1 448.3 492.2 Public enterprises 24.3 29.1 29.9 33.1 38.5 42.7 Other direct taxes 35.2 34.4 41.9 46.1 52.3 57.8 Import taxes 162.9 176.9 205.3 225.2 249.6 273.0 Other indirect taxes 58.9 80.4 87.2 95.8 107.9 118.7Grants 55.8 31.7 74.1 84.1 91.5 98.2Other revenue 25.1 43.9 51.0 52.6 57.9 63.0
Expenditure 434.4 540.7 618.8 656.9 699.4 744.1Expense 290.2 365.7 398.5 408.5 422.6 443.0
Compensation of employees 104.7 120.4 136.0 147.2 159.8 167.9Use of goods and services 63.7 88.5 78.3 85.5 93.2 102.3Interest 11.5 18.6 30.2 33.8 32.3 34.3 Domestic interest 9.6 12.8 20.8 23.6 22.8 23.0 Foreign interest 1.9 5.8 9.4 10.2 9.5 11.3Subsidies 1 32.5 42.5 43.9 24.0 8.0 0.0Grants, social benefits and other expense 77.8 95.6 110.1 117.9 129.4 138.5
Net acquisition of nonfinancial assets 144.2 175.1 220.3 248.4 276.7 301.1Domestically financed 68.2 70.9 75.5 91.8 101.5 110.5Foreign financed 76.1 104.2 144.8 156.6 175.2 190.6
Gross Operating Balance 2 72.2 30.8 90.9 128.4 175.1 210.4Net lending (+)/borrowing (–) (fiscal balance) 3 -72.1 -144.3 -129.3 -120.0 -101.6 -90.7Discrepancy (Non-financial vs financial accounts) 8.1 15.1 -0.5 -1.0 -11.5 -11.1Change in net financial worth due to transactions (fiscal balance) -80.1 -159.4 -128.8 -119.0 -90.1 -79.6 Net acquisition of financial assets 26.9 -16.6 -14.4 4.3 10.5 11.1
Domestic 26.9 -16.6 -14.4 4.3 10.5 11.1Currency and deposits 34.9 1.2 1.9 4.3 0.0 0.0Equity and investment fund shares 0.0 -3.0 -16.8 0.0 0.0 0.0Other accounts receivable -8.1 -14.8 0.5 0.0 10.5 11.1
Net incurrence of liabilities 95.1 162.4 114.4 123.3 66.5 66.5Domestic 28.6 84.6 43.8 59.3 5.2 0.9
Debt securities 24.7 25.3 43.6 63.9 27.6 27.0Loans 0.7 38.9 0.3 -4.6 -22.5 -26.1Other accounts payable 3.2 20.4 0.0 0.0 0.0 0.0
Foreign 66.4 77.8 70.6 63.9 61.4 65.7Loans 66.4 77.8 70.6 63.9 61.4 65.7Other accounts payable 0.0 0.0 0.0 0.0 0.0 0.0
Residual/unidentified financing -11.9 19.6 0.0 0.0 -34.1 -24.2Memorandum items: Primary balance -60.6 -125.7 -99.2 -86.2 -69.4 -56.4NLB (overall balance) excluding grants -127.8 -176.0 -203.5 -204.1 -193.1 -188.9CG Domesitc Debt and Arrears 503.5 541.2 541.7 576.8 559.7 548.5Sources: Togolese authorities and IMF staff estimates and projections.1/ Includes Fuel Subsdies.2/ Revenue minus Current Expense (includes reimbursement of bonds for bank restructuration in Other Expense).3/ Revenue minus Total Expenditure (includes reimbursement of bonds for bank restructuration in Other Expense).
Projections(In billions of CFA Francs)
2011 2012

TOGO
47 INTERNATIONAL MONETARY FUND
Table 1b. Togo: Statement of Operations of Budgetary Central Government, 2011–16
2013 2014 2015 2016Act. Act.
Revenue 20.4 19.8 22.7 23.0 23.5 23.7Taxes 15.9 16.0 16.9 17.1 17.7 17.8 Public enterprises 1.4 1.5 1.4 1.4 1.5 1.5 Other direct taxes 2.0 1.7 1.9 2.0 2.1 2.1 Import taxes 9.2 8.8 9.5 9.6 9.8 9.9 Other indirect taxes 3.3 4.0 4.0 4.1 4.2 4.3Grants 3.1 1.6 3.4 3.6 3.6 3.6Other revenue 1.4 2.2 2.4 2.3 2.3 2.3
Expenditure 24.5 27.0 28.7 28.1 27.5 26.9Expense 16.4 18.3 18.5 17.5 16.6 16.0
Compensation of employees 5.9 6.0 6.3 6.3 6.3 6.1Use of goods and services 3.6 4.4 3.6 3.7 3.7 3.7Interest 0.6 0.9 1.4 1.4 1.3 1.2 Domestic interest 0.5 0.6 1.0 1.0 0.9 0.8 Foreign interest 0.1 0.3 0.4 0.4 0.4 0.4Subsidies 1 1.8 2.1 2.0 1.0 0.3 0.0Grants, social benefits and other expense 4.4 4.8 5.1 5.0 5.1 5.0
Net acquisition of nonfinancial assets 8.1 8.8 10.2 10.6 10.9 10.9Domestically financed 3.8 3.5 3.5 3.9 4.0 4.0Foreign financed 4.3 5.2 6.7 6.7 6.9 6.9
Gross Operating Balance 2 4.1 1.5 4.2 5.5 6.9 7.6Net lending (+)/borrowing (–) (fiscal balance) 3 -4.1 -7.2 -6.0 -5.1 -4.0 -3.3Discrepancy (Non-financial vs financial accounts) 0.5 0.8 0.0 0.0 -0.5 -0.4Change in net financial worth due to transactions (fiscal balance) -4.5 -8.0 -6.0 -5.1 -3.6 -2.9 Net acquisition of financial assets 1.5 -0.8 -0.7 0.2 0.4 0.4
Domestic 1.5 -0.8 -0.7 0.2 0.4 0.4Currency and deposits 2.0 0.1 0.1 0.2 0.0 0.0Equity and investment fund shares 0.0 -0.2 -0.8 0.0 0.0 0.0Other accounts receivable -0.5 -0.7 0.0 0.0 0.4 0.4
Net incurrence of liabilities 5.4 8.1 5.3 5.3 2.6 2.4Domestic 1.6 4.2 2.0 2.5 0.2 0.0
Debt securities 1.4 1.3 2.0 2.7 1.1 1.0Loans 0.0 1.9 0.0 -0.2 -0.9 -0.9Other accounts payable 0.2 1.0 0.0 0.0 0.0 0.0
Foreign 3.7 3.9 3.3 2.7 2.4 2.4Loans 3.7 3.9 3.3 2.7 2.4 2.4Other accounts payable 0.0 0.0 0.0 0.0 0.0 0.0
Residual/unidentified financing -0.7 1.0 0.0 0.0 -1.3 -0.9Memorandum items: Primary balance -3.4 -6.3 -4.6 -3.7 -2.7 -2.0NLB (overall balance) excluding grants -7.2 -8.8 -9.4 -8.7 -7.6 -6.8CG Domesitc Debt and Arrears 28.4 27.1 25.2 24.7 22.0 19.9Nominal GDP (CFAF billions) 1,772 1,999 2,154 2,337 2,539 2,762Sources: Togolese authorities and IMF staff estimates and projections.1/ Includes Soutien Politique Petrolier.2/ Revenue minus Current Expense (includes reimbursement of bonds for bank restructuration in Other Expense).3/ Revenue minus Total Expenditure (includes reimbursement of bonds for bank restructuration in Other Expense).
Projections
(In percentage of GDP)
2011 2012

TOGO
TOGO
STAFF REPORT FOR THE 2013 ARTICLE IV CONSULTATION—DEBT SUSTAINABILITY ANALYSIS
The analysis based on the joint IMF-World Bank debt sustainability framework for low-income countries shows that Togo remains at moderate risk of debt distress. After full HIPC assistance, MDRI and beyond HIPC assistance, Togo’s external and public debt indicators improved significantly in 2010/11, and remained stable under the previous ECF-supported program. In 2012, Togo contracted significant external debt. While debt indicators are projected to remain below the policy-relevant indicative thresholds in the 20-year period under the baseline scenario, Togo remains vulnerable to certain shocks and could breach the policy-relevant thresholds for the PV of debt-to-GDP, PV of debt-to-exports, PV of debt-to-revenue and debt service-to-revenue ratios under some alternative scenarios in the outer years.
Approved By Michael Atingi-Ego and Peter Allum (IMF) and Jeffrey Lewis and Marcelo Giugale (IDA)
The Debt Sustainability Analysis (DSA) has been prepared jointly by the staffs of the International Monetary Fund and the International Development Association, using the debt sustainability framework for low-income countries approved by the Boards of both institutions.
October 12, 2012 November 20, 2013

TOGO
2 INTERNATIONAL MONETARY FUND
Debto Creditor(billions of CFAF)
(in percent)
(billions of CFAF)
(in percent)
GovernmentMultilateral 137.5 50.8 164.1 45.4
of which:World Bank 0.0 0.0 6.9 3.0AfDB 0.0 0.0 0.0 0.0
BilateralParis Club 16.3 6.0 14.4 4.0Non-Paris Club 61.7 22.8 100.3 27.7
of which:China 36.7 19.7 82.0 22.7Kuwait 23.1 12.4 16.0 4.4Saudi Arabia 1.8 1.1 2.3 0.6
OthersCommercial Banks 1.4 0.5 0.0 0.0GDF-Suez 0.0 0.0 29.5 8.2
State-owned Enterprises 54.0 19.9 53.5 14.8Total
In billions of CFAF 270.9 100 361.8 100in millions of US$ 546.1 724.3in percent of GDP 17.2 18.1
Source: Country authorities and Staff calculations
Text Table 1: Togo. Composition of External Debt StockEnd-2010 End-2012
INTRODUCTION 1. The last joint DSA for Togo was prepared in November 2010 and updated in August 2011, and both concluded that Togo was at moderate risk of debt distress. This debt sustainability analysis (LIC-DSA) for Togo assesses its external and public debt using the forward-looking debt sustainability framework (DSF) for low-income countries.1 The outcome of this analysis was in line with the previous DSAs. Togo reached the completion point of the HIPC Initiative in December 2010 and was granted debt relief from several multilateral and bilateral creditors. The nominal total debt stock, which fell from US$2.5 billion at end-2009 to below US$1.5 billion at end-2010, was US$1.9 billion at end-2012.
2. In the LIC-DSA framework, the present value of Togo’s public and publicly guaranteed (PPG) external debt is US$724 million at end-2012. Around 45 percent of this stock of debt is owed to multilateral creditors and the remainder to bilateral and commercial creditors of which around 28 percent is owed to non-Paris Club bilateral creditors (Text Table 1). Non-Paris Club debt has increased almost by five percentage points of GDP since 2010. Concurrently, domestic debt decreased from 30 percent in 2010 to 27 percent of GDP in 2012.
BASELINE ASSUMPTIONS 3. The baseline macroeconomic assumptions for the present DSA are the following:
a. Real GDP growth is projected to be 5.6 percent in 2013 and average about 5.9 percent over 2014-18, driven by public and private investments in key sectors including agriculture, mining industry and infrastructure (especially in transport). The estimated potential growth rate exceeds historical rates, which were depressed by the dislocations caused by the protracted social, political, and
1 This DSA has been prepared by Fund staff using the Debt Sustainability Framework (DSF) for Low Income Countries (see “Applying the Debt Sustainability Framework for Low-Income Countries Post Debt Relief”, (http://siteresources.worldbank.org/INTDEBTDEPT/PolicyPapers/21154573/DMSDR1S3149398v1DSFPaperforweb.pdf). Togo’s quality of policies and institutions, as measured by the average World Bank’s Country Policy and Institutional Assessment (CPIA) for the period 2010–12 (2.95), places it as a “weak performer”. The corresponding indicative thresholds for the external debt indicators are 30 percent for the NPV of debt-to-GDP ratio, 100 percent of the debt-to-export ratio, 200 percent for NPV of debt-to-revenue ratio, 15 percent for the debt service-to-exports ratio, and 18 percent for the debt service-to-revenue ratio.
TOGO
INTERNATIONAL MONETARY FUND 3
economic crisis that the country experienced up to the mid-2000s.The main downside risks to growth projections are related to the country’s weak management capacity. These may deter the implementation of the planned public investments, which would be one of the main drivers of growth over the medium term. Additionally, while in the short run, public and private investments in key sectors rely on electricity generated by their own resources, the supply of electricity remains a binding constraint in the medium and long run,
b. Public investment is projected to accelerate starting in 2013, reaching 10.4 percent of GDP in 2013 and 10.9 percent in 2014 and retain this upward trend until 2017, slightly slowing down in 2018. Upon completion of the planned investments, it is expected to stabilize around 9.5 percent. About 35 percent of public investments will be financed domestically while the remaining 65 percent will be via external financing. Public investment projects are expected to be mostly directed to infrastructure and will lead GDP growth to increase above its long-term trend for these years. Togo has weak public investment management capacity as documented by the IMF’s 2013 Public Investment Management Index (PIMI).2
c. The projections for key commodity prices (oil, cotton, cocoa, and coffee) through 2018 are based on WEO projections of August 2013 and are assumed constant in real terms afterwards.
d. Inflation over the long-term is projected to remain stable at around 2.5 percent, reflecting sound monetary policy at the regional level.
e. The current account deficit is expected to remain at levels above 10 percent, after a slight improvement in 2013 from 11.8 percent in 2012 to about 10.6 percent. The underlying reason for high projections of the deficit in the first projection years is higher levels of capital imports needed for the planned public and private investments. From 2016 onwards, the current account balances are projected to improve and would fluctuate around 7 percent over the long run.
f. The domestic primary fiscal balance is projected to return to positive territory and remain above 1 percent in the projection period, thereby providing a fiscal anchor to create the fiscal room to generate reductions in the debt-to-GDP stock and thereby ensuring fiscal sustainability over the long term.3
g. The overall balance is expected to improve by 2 percentage points of GDP to a deficit of 3 percent by 2017 and to gradually decline to around 2 percent, reflecting lower infrastructure investment needs in the medium to long term.
2 Togo received a rating of 0.92 in the IMF’s Public Investment Management Index on a scale from 0 to 4 Togo’s rating is lower than those of its WAEMU peers (Benin, Burkina Faso, Cote d’Ivoire, Mali and Senegal). 3 The domestic primary fiscal balance is the authorities’ primary tool for short term fiscal policy, given interest payments and multi-year infrastructure investment plans.

TOGO
4 INTERNATIONAL MONETARY FUND
h. FDI flows are expected to increase over the medium-term reflecting improvements in the investment climate and overall governance as the SCAPE program is expected to address these areas. However, given Togo’s weak track record in governance, these flows, as well as grants, are subject to significant risks, and this may hinder Togo’s concessional financing. FDI is expected to increase from 1.7 percent of GDP in 2012 to 2.5 percent of GDP by 2018, as a result of public and private investments, better infrastructure and improved investment climate.
i. Initially, external financing will be mostly on grant terms, with less concessional financing gradually picking up, leading to a decrease in the grant element of new financing (as shown in Figure 1). The sources of concessional external financing are expected to consist of Togo’s traditional multilateral donors, as well as the recently-increased financing from non-Paris Club creditors (especially China and India). Since the completion of the previous ECF program in 2011, Togo’s creditor profile changed somewhat. As of end-2012, the loans from non-Paris Club (NPC) creditors constituted about 28 percent of total debt stock compared to 24 percent at end-2011. External borrowing by state-owned enterprises totaled 15 percent of total debt stock in 2012.
j. The DSA is based on the new unified discount rate of five percent.4
EXTERNAL DEBT SUSTAINABILITY ANALYSIS Baseline
4. Under the baseline scenario, Togo’s external debt indicators remain below their relevant indicative policy relevant thresholds (Table 1a, Figure 1). The present value (PV) of public and publicly guaranteed (PPG) debt equals to 20.4 percent of GDP in 2013 and remains below the 30 percent threshold until the end of the projected period. Furthermore, both the PV of external debt relative to revenues and exports stay relatively stable and below their respective indicative threshold until 2033. The share of concessional loans in new financing is projected to decline, which results in the concessionality of new loans to decrease from nearly 50 percent to around 18 percent over the period 2013 to 2033. The rate of debt accumulation is projected to stabilize around 1.5 percent per annum in the long run.5,6
Alternative Scenarios and Stress Tests
4 On October 11, 2013, the Executive Boards of the IMF and the World Bank approved the reform of the discount rates presented in SM/12/271, resulting in a unique, unified 5 percent rate to be applied both to DSAs and to the calculation of the grant element (Board Decision N. 15462-(13–97)). 5 The residual for endogenous debt dynamics presented in Table 1a is largely due to exceptional financing, price and exchange rate changes, and debt flow relief. For the period 2013-17, the ECF financing has also been taken into account, as well as other identified donor financing. 6 The accumulation of nominal external debt as a percentage of GDP throughout the projection period is largely driven by project loans (remaining around 2.5-3 percent of GDP), which can be attributed to Togo’s long-term investment needs.

TOGO
INTERNATIONAL MONETARY FUND 5
5. Togo’s external debt outlook remains vulnerable to shocks especially toward the end of the projection period (Table 1b, Figure 1). The policy thresholds for four key ratios are breached under the most extreme stress tests. First, the PV of external debt to GDP’ indicators deteriorate under the terms shock scenario in which new loans are obtained on less favorable terms. In this case, the threshold is breached in 2023. Secondly, the PV of debt-to-exports ratio surpasses the indicative threshold in 2033 under the terms shock scenario. The PV of debt-to-revenue ratio breaches the 200 percent threshold in 2029 under the same scenario. Lastly, the PV of debt service-to-revenue ratio surpasses the indicative thresholds in 2026 under the one-time 30 percent nominal depreciation shock.
6. In light of the results from the baseline and alternative scenarios as well as the stress tests, staff concludes that Togo still is at moderate risk of debt distress.
PUBLIC SECTOR DEBT SUSTAINABILITY
Baseline
7. The inclusion of Togo’s domestic public debt in the analysis emphasizes the vulnerability of the baseline scenario (Table 2a, Figure 2). Togo’s domestic debt burden reflects years of weak fiscal management and domestic arrears accumulation, as well as the need to recapitalize ailing banks. Much of the debt burden stemmed from the government’s recognition of liabilities arising from liquidated loss-making SOEs. Under the baseline scenario, the PV of total public debt ratios are projected to decrease over the projection period. On average, the PV of debt to GDP ratio amounts to around 23 percent over 2013-2033. For debt ratios to remain at a reasonable level over the long-run, both an improvement in the macroeconomic outlook and a more cautious debt strategy are critical factors.
Alternative Scenarios and Stress Tests
8. The evolution of the debt indicators would be highly sensitive to growth shocks, which would increase the debt level and debt service over the long run. Total public debt dynamics are particularly vulnerable to a growth shock (Table 2b, Figure 2). This highlights the importance of a reform agenda that improves the business environment to support public and foreign investment for growth.
CONCLUSION 9. The DSA indicates that Togo is at moderate risk of debt distress, though is susceptible to macroeconomic developments and any changes in its debt management strategy and capacity. The authorities generally agreed with the assessment while considering staff’s long-term growth projections to be conservative. Under the baseline scenario, the debt ratios remain below the thresholds for the projected period, but under alternative scenarios thresholds would be breached in the outer years. These dynamics highlight the vulnerability of the Togolese economy to certain shocks (in particular less favorable terms on new financing), and stress the need for a prudent approach to new borrowing. This also pronounces the importance of improving debt management capacity in Togo to have a realistic and overall assessment of
TOGO
6 INTERNATIONAL MONETARY FUND
the risks posed by various sectors including fiscal. While heavy public investment is expected to lead to sustained growth, Togo’s weak public investment management capacity may impose risks on the underlying public investment-growth nexus. Additionally, public investments based on a public-private partnership framework would imply a higher risk of potential fiscal liabilities.
10. Maintaining a robust external debt outlook will depend on a sustained pick-up of real GDP growth, and foreign direct investment, as well as prudent debt management and solid fiscal performance. The inclusion of Togo’s domestic debt in the analysis reinforces the conclusions of the external DSA and stresses the risks to Togo’s debt prospects. In this context, it is essential that the Togolese authorities ensure efforts to strengthen public finance management and debt management, restructure the banking system and promote financial development, reform state-owned enterprises, and improve the investment climate, hence laying the foundation for accelerating growth prospects.

TOGO
INTERNATIONAL MONETARY FUND 7
Sources: Country authorities; and staff estimates and projections.
Figure 1. Togo: Indicators of Public and Publicly Guaranteed External Debt under Alternatives Scenarios, 2013-2033 1/
1/ The most extreme stress test is the test that yields the highest ratio in 2023. In figure b. it corresponds to a Terms shock; in c. to a Terms shock; in d. to a Terms shock; in e. to a Exports shock and in figure f. to a One-time depreciation shock
0
5
10
15
20
25
2013 2016 2019 2022 2025 2028 2031
Baseline Historical scenario Most extreme shock 1/ Threshold
f.Debt service-to-revenue ratio
0
10
20
30
40
50
60
0
1
2
3
4
5
6
2013 2016 2019 2022 2025 2028 2031Rate of Debt AccumulationGrant-equivalent financing (% of GDP)Grant element of new borrowing (% right scale)
a. Debt Accumulation
0
10
20
30
40
50
60
70
80
2013 2016 2019 2022 2025 2028 2031
b.PV of debt-to GDP ratio
0
20
40
60
80
100
120
140
160
2013 2016 2019 2022 2025 2028 2031
c.PV of debt-to-exports ratio
0
50
100
150
200
250
300
350
2013 2016 2019 2022 2025 2028 2031
d.PV of debt-to-revenue ratio
0
2
4
6
8
10
12
14
16
2013 2016 2019 2022 2025 2028 2031
e.Debt service-to-exports ratio

TOGO
8 INTERNATIONAL MONETARY FUND
Figure 2. Togo: Indicators of Public Debt Under Alternative Scenarios, 2013-2033 1/
Sources: Country authorities; and staff estimates and projections.1/ The most extreme stress test is the test that yields the highest ratio in 2023. 2/ Revenues are defined inclusive of grants.
0
50
100
150
200
250
300
2013 2015 2017 2019 2021 2023 2025 2027 2029 2031
PV of Debt-to-Revenue Ratio 2/
0
10
20
30
40
50
60
2013 2015 2017 2019 2021 2023 2025 2027 2029 2031
Baseline Fix Primary Balance Most extreme shock Growth Historical scenario
PV of Debt-to-GDP Ratio
0
5
10
15
20
25
30
35
2013 2015 2017 2019 2021 2023 2025 2027 2029 2031
Debt Service-to-Revenue Ratio 2/

TOGO
INTERNATIONAL MONETARY FUND 9
Historical6/
Standard6/
Average Deviation 2013-2018 2019-2033
2010 2011 2012 2013 2014 2015 2016 2017 2018 Average 2023 2033 Average
External debt (nominal) 1/ 18.5 17.2 20.1 21.2 22.2 23.5 24.4 25.0 25.4 31.7 37.6o/w public and publicly guaranteed (PPG) 17.2 15.6 18.1 18.9 19.7 20.8 21.6 22.1 22.4 28.5 34.6
Change in external debt -34.7 -1.3 3.0 1.0 1.0 1.3 0.9 0.6 0.4 0.8 0.4Identified net debt-creating flows 4.6 4.5 9.5 7.9 7.2 6.2 5.1 4.6 4.6 0.7 -2.7
Non-interest current account deficit 5.9 8.9 11.5 8.3 1.9 10.4 10.6 9.9 8.9 8.4 8.1 3.7 0.4 3.4Deficit in balance of goods and services 17.1 20.7 21.5 22.7 23.3 22.6 21.0 19.3 17.3 12.5 8.4
Exports 40.2 40.7 39.6 39.5 39.2 39.4 39.4 39.5 39.2 39.8 44.7Imports 57.3 61.4 61.1 62.2 62.5 62.0 60.4 58.8 56.5 52.4 53.1
Net current transfers (negative = inflow) -11.2 -9.7 -8.3 -10.1 1.2 -9.4 -9.1 -8.8 -8.3 -7.8 -6.7 -6.5 -6.2 -6.5o/w official -2.0 -2.3 -1.8 -3.4 -3.6 -3.6 -3.6 -3.3 -3.0 -2.5 -1.7
Other current account flows (negative = net inflow) 0.0 -2.1 -1.7 -2.9 -3.6 -4.0 -3.8 -3.1 -2.4 -2.4 -1.8Net FDI (negative = inflow) -1.5 -1.7 -1.6 -2.3 1.3 -1.7 -2.5 -2.5 -2.5 -2.5 -2.5 -2.5 -2.5 -2.5Endogenous debt dynamics 2/ 0.3 -2.7 -0.4 -0.8 -0.9 -1.2 -1.2 -1.2 -1.0 -0.5 -0.6
Contribution from nominal interest rate 0.4 0.2 0.3 0.2 0.3 0.1 0.1 0.0 0.2 0.6 0.8Contribution from real GDP growth -2.2 -0.7 -1.0 -1.0 -1.2 -1.2 -1.3 -1.3 -1.3 -1.2 -1.4Contribution from price and exchange rate changes 2.0 -2.1 0.3 … … … … … … … …
Residual (3-4) 3/ -39.3 -5.8 -6.5 -6.8 -6.2 -4.9 -4.3 -4.1 -4.2 0.2 3.1o/w exceptional financing 9/ -2.6 -2.6 -0.8 -0.8 -0.5 0.0 0.0 0.0 0.0 0.0 0.0
PV of external debt 4/ ... ... 15.3 15.6 15.7 16.1 16.3 16.5 17.3 22.4 26.2In percent of exports ... ... 38.5 39.4 40.1 40.9 41.5 41.7 44.2 56.2 58.5
PV of PPG external debt ... ... 13.2 13.3 13.2 13.4 13.5 13.6 14.4 19.2 23.2In percent of exports ... ... 33.4 33.6 33.6 34.1 34.4 34.4 36.7 48.3 52.0In percent of government revenues ... ... 72.5 68.7 68.0 67.5 67.3 67.1 70.8 94.4 113.0
Debt service-to-exports ratio (in percent) 4.7 2.0 2.8 2.6 3.0 2.9 3.1 2.8 2.6 5.8 7.3PPG debt service-to-exports ratio (in percent) 4.7 2.0 2.8 2.6 3.0 2.9 3.1 2.8 2.6 5.8 7.3PPG debt service-to-revenue ratio (in percent) 10.3 4.7 6.1 5.4 6.1 5.8 6.1 5.5 5.1 11.3 15.9Total gross financing need (Billions of U.S. dollars) 0.2 0.3 0.5 0.5 0.5 0.5 0.5 0.5 0.5 0.5 0.4Non-interest current account deficit that stabilizes debt ratio 40.6 10.2 8.5 9.4 9.6 8.5 8.0 7.8 7.7 2.8 0.0
Key macroeconomic assumptions
Real GDP growth (in percent) 4.1 4.8 5.9 3.5 1.5 5.6 6.0 6.0 6.1 5.8 5.5 5.8 4.0 4.0 4.2GDP deflator in US dollar terms (change in percent) -3.7 12.9 -1.6 6.8 8.6 4.6 3.3 3.5 3.5 3.3 3.3 3.6 2.2 2.2 2.2Effective interest rate (percent) 5/ 0.7 1.2 2.0 0.5 0.6 1.1 1.4 0.3 0.4 0.2 1.1 0.8 2.2 2.2 2.2Growth of exports of G&S (US dollar terms, in percent) 9.6 19.8 1.5 11.6 10.7 10.2 8.5 10.4 9.7 9.6 8.2 9.4 7.4 8.3 7.4Growth of imports of G&S (US dollar terms, in percent) 9.7 26.7 3.8 13.2 11.6 12.5 10.0 8.9 7.0 6.4 4.7 8.2 5.4 6.7 6.0Grant element of new public sector borrowing (in percent) ... ... ... ... ... 50.8 50.1 49.6 49.6 49.6 22.1 45.3 24.8 22.8 23.4Government revenues (excluding grants, in percent of GDP) 18.4 17.3 18.2 19.3 19.4 19.9 20.1 20.2 20.3 20.4 20.6 20.4Aid flows (in Billions of US dollars) 7/ 0.4 0.3 0.3 0.3 0.3 0.4 0.4 0.4 0.3 0.5 0.7
o/w Grants 0.1 0.1 0.1 0.1 0.2 0.2 0.2 0.2 0.2 0.2 0.3o/w Concessional loans 0.3 0.2 0.2 0.1 0.2 0.2 0.2 0.2 0.1 0.2 0.4
Grant-equivalent financing (in percent of GDP) 8/ ... ... ... 5.0 5.3 5.6 5.5 5.1 3.7 3.5 2.9 3.3Grant-equivalent financing (in percent of external financing) 8/ ... ... ... 77.2 75.5 73.1 73.4 73.7 59.8 52.9 42.6 49.2
Memorandum items:Nominal GDP (Billions of US dollars) 3.2 3.8 3.9 4.3 4.7 5.2 5.7 6.2 6.8 9.5 16.4Nominal dollar GDP growth 0.2 18.3 4.3 10.5 9.4 9.7 9.8 9.3 9.0 9.6 6.3 6.3 6.5PV of PPG external debt (in Billions of US dollars) 0.5 0.6 0.6 0.7 0.8 0.9 1.0 1.9 3.9(PVt-PVt-1)/GDPt-1 (in percent) 1.2 1.3 1.7 1.5 1.5 2.3 1.6 1.9 1.9 2.0Gross workers' remittances (Billions of US dollars) 0.3 0.3 0.2 0.3 0.3 0.3 0.3 0.3 0.3 0.4 0.7PV of PPG external debt (in percent of GDP + remittances) ... ... 12.4 12.5 12.5 12.8 12.9 13.0 13.9 18.5 22.2PV of PPG external debt (in percent of exports + remittances) ... ... 28.8 29.2 29.5 30.2 30.6 30.8 33.5 43.9 47.3Debt service of PPG external debt (in percent of exports + remittances) ... ... 2.4 2.3 2.7 2.6 2.8 2.5 2.4 5.3 6.6
Sources: Country authorities; and staff estimates and projections.€ 1/ Includes both public and private sector external debt.2/ Derived as [r - g - ρ(1+g)]/(1+g+ρ+gρ) times previous period debt ratio, with r = nominal interest rate; g = real GDP growth rate, and ρ = growth rate of GDP deflator in U.S. dollar terms. 3/ Includes exceptional financing (i.e., changes in arrears and debt relief); changes in gross foreign assets; and valuation adjustments. For projections also includes contribution from price and exchange rate changes.4/ Assumes that PV of private sector debt is equivalent to its face value.5/ Current-year interest payments divided by previous period debt stock. 6/ Historical averages and standard deviations are generally derived over the past 10 years, subject to data availability. 7/ Defined as grants, concessional loans, and debt relief.8/ Grant-equivalent financing includes grants provided directly to the government and through new borrowing (difference between the face value and the PV of new debt).9/ Budget support
Actual
Table 1a.: External Debt Sustainability Framework, Baseline Scenario, 2010-2033 1/(In percent of GDP, unless otherwise indicated)
Projections

TOGO
10 INTERNATIONAL MONETARY FUND
2013 2014 2015 2016 2017 2018 2023 2033
Baseline 13 13 13 14 14 14 19 23
A. Alternative Scenarios
A1. Key variables at their historical averages in 2013-2033 1/ 13 11 11 11 11 12 28 63A2. New public sector loans on less favorable terms in 2013-2033 2 13 14 16 17 18 18 30 47
B. Bound Tests
B1. Real GDP growth at historical average minus one standard deviation in 2014-2015 13 14 15 15 15 16 22 26B2. Export value growth at historical average minus one standard deviation in 2014-2015 3/ 13 16 21 21 21 21 25 26B3. US dollar GDP deflator at historical average minus one standard deviation in 2014-2015 13 14 15 15 15 16 22 27B4. Net non-debt creating flows at historical average minus one standard deviation in 2014-2015 4/ 13 15 16 16 16 17 22 25B5. Combination of B1-B4 using one-half standard deviation shocks 13 15 19 19 19 20 25 27B6. One-time 30 percent nominal depreciation relative to the baseline in 2014 5/ 13 19 19 19 20 21 28 34
Baseline 34 34 34 34 34 37 48 52
A. Alternative Scenarios
A1. Key variables at their historical averages in 2013-2033 1/ 34 29 27 27 27 31 71 142A2. New public sector loans on less favorable terms in 2013-2033 2 34 36 39 42 44 47 75 105
B. Bound Tests
B1. Real GDP growth at historical average minus one standard deviation in 2014-2015 34 34 35 35 35 38 50 54B2. Export value growth at historical average minus one standard deviation in 2014-2015 3/ 34 43 62 62 61 64 74 69B3. US dollar GDP deflator at historical average minus one standard deviation in 2014-2015 34 34 35 35 35 38 50 54B4. Net non-debt creating flows at historical average minus one standard deviation in 2014-2015 4/ 34 38 41 42 42 44 55 56B5. Combination of B1-B4 using one-half standard deviation shocks 34 39 48 48 48 50 61 60B6. One-time 30 percent nominal depreciation relative to the baseline in 2014 5/ 34 34 35 35 35 38 50 54
Baseline 69 68 67 67 67 71 94 113
A. Alternative Scenarios
A1. Key variables at their historical averages in 2013-2033 1/ 69 59 53 52 54 59 138 308A2. New public sector loans on less favorable terms in 2013-2033 2 69 73 78 82 87 90 146 229
B. Bound Tests
B1. Real GDP growth at historical average minus one standard deviation in 2014-2015 69 71 74 74 74 79 106 127B2. Export value growth at historical average minus one standard deviation in 2014-2015 3/ 69 81 105 103 101 104 122 126B3. US dollar GDP deflator at historical average minus one standard deviation in 2014-2015 69 72 76 76 76 81 109 131B4. Net non-debt creating flows at historical average minus one standard deviation in 2014-2015 4/ 69 77 82 81 81 85 107 121B5. Combination of B1-B4 using one-half standard deviation shocks 69 79 97 96 95 99 121 133B6. One-time 30 percent nominal depreciation relative to the baseline in 2014 5/ 69 97 96 97 97 103 138 166
PV of debt-to-exports ratio
PV of debt-to-revenue ratio
Table 1b.Togo: Sensitivity Analysis for Key Indicators of Public and Publicly Guaranteed External Debt, 2013-2033(In percent)
PV of debt-to GDP ratio
Projections

TOGO
INTERNATIONAL MONETARY FUND 11
Baseline 3 3 3 3 3 3 6 7
A. Alternative Scenarios
A1. Key variables at their historical averages in 2013-2033 1/ 3 3 3 3 2 2 5 9A2. New public sector loans on less favorable terms in 2013-2033 2 3 3 3 3 3 3 3 10
B. Bound Tests
B1. Real GDP growth at historical average minus one standard deviation in 2014-2015 3 3 3 3 3 3 6 7B2. Export value growth at historical average minus one standard deviation in 2014-2015 3/ 3 3 4 4 4 4 8 9B3. US dollar GDP deflator at historical average minus one standard deviation in 2014-2015 3 3 3 3 3 3 6 7B4. Net non-debt creating flows at historical average minus one standard deviation in 2014-2015 4/ 3 3 3 3 3 3 6 8B5. Combination of B1-B4 using one-half standard deviation shocks 3 3 3 4 3 3 7 8B6. One-time 30 percent nominal depreciation relative to the baseline in 2014 5/ 3 3 3 3 3 3 6 7
Baseline 5 6 6 6 6 5 11 16
A. Alternative Scenarios
A1. Key variables at their historical averages in 2013-2033 1/ 5 6 5 5 5 4 10 21A2. New public sector loans on less favorable terms in 2013-2033 2 5 6 6 7 6 6 7 21
B. Bound Tests
B1. Real GDP growth at historical average minus one standard deviation in 2014-2015 5 6 6 7 6 5 12 17B2. Export value growth at historical average minus one standard deviation in 2014-2015 3/ 5 6 6 7 7 6 14 18B3. US dollar GDP deflator at historical average minus one standard deviation in 2014-2015 5 6 6 7 6 6 13 18B4. Net non-debt creating flows at historical average minus one standard deviation in 2014-2015 4/ 5 6 6 7 6 5 12 17B5. Combination of B1-B4 using one-half standard deviation shocks 5 6 7 7 7 6 14 18B6. One-time 30 percent nominal depreciation relative to the baseline in 2014 5/ 5 9 8 9 8 7 16 22
Memorandum item:Grant element assumed on residual financing (i.e., financing required above baseline) 6/ 15 15 15 15 15 15 15 15
Sources: Country authorities; and staff estimates and projections.
1/ Variables include real GDP growth, growth of GDP deflator (in U.S. dollar terms), non-interest current account in percent of GDP, and non-debt creating flows. 2/ Assumes that the interest rate on new borrowing is by 2 percentage points higher than in the baseline., while grace and maturity periods are the same as in the baseline.3/ Exports values are assumed to remain permanently at the lower level, but the current account as a share of GDP is assumed to return to its baseline level after the shock (implicitly assuming an offsetting adjustment in import levels). 4/ Includes official and private transfers and FDI.5/ Depreciation is defined as percentage decline in dollar/local currency rate, such that it never exceeds 100 percent.6/ Applies to all stress scenarios except for A2 (less favorable financing) in which the terms on all new financing are as specified in footnote 2.
Debt service-to-revenue ratio
Debt service-to-exports ratio
Table 1b.Togo: Sensitivity Analysis for Key Indicators of Public and Publicly Guaranteed External Debt, 2013-2033 (continued)(In percent)

TOGO
12 INTERNATIONAL MONETARY FUND
Estimate
2010 2011 2012Average
5/ Standard Deviation
5/
2013 2014 2015 2016 2017 20182013-18 Average 2023 2033
2019-33 Average
Public sector debt 1/ 47.3 44.0 45.2 44.0 44.3 42.9 41.5 40.3 39.4 35.8 23.3o/w foreign-currency denominated 17.2 15.6 18.1 18.9 19.7 20.8 21.6 22.1 22.4 28.5 20.3
Change in public sector debt -26.0 -3.4 1.2 -1.1 0.3 -1.5 -1.4 -1.2 -0.9 -1.5 0.0Identified debt-creating flows -40.0 -1.9 1.6 2.1 0.9 -0.3 -0.9 -1.4 -1.5 0.9 0.5
Primary deficit 1.1 2.6 5.6 1.4 2.4 4.2 3.3 2.5 1.9 1.4 0.9 2.4 2.3 1.2 2.3
Revenue and grants 20.4 20.4 19.8 22.7 23.0 23.5 23.7 23.5 23.3 22.9 22.6of which: grants 2.0 3.1 1.6 3.4 3.6 3.6 3.6 3.3 3.0 2.5 1.9
Primary (noninterest) expenditure 21.5 23.1 25.5 27.0 26.3 26.1 25.6 24.9 24.2 25.2 23.8Automatic debt dynamics 2.6 -4.6 -4.0 -2.1 -2.4 -2.8 -2.8 -2.8 -2.4 -1.3 -0.7
Contribution from interest rate/growth differential -2.6 -4.6 -4.1 -2.1 -2.2 -2.6 -2.5 -2.4 -2.1 -1.3 -0.7of which: contribution from average real interest rate 0.2 -2.5 -1.6 0.3 0.3 0.0 -0.1 -0.2 0.0 0.1 0.2of which: contribution from real GDP growth -2.9 -2.2 -2.5 -2.4 -2.5 -2.5 -2.5 -2.3 -2.1 -1.4 -0.9
Contribution from real exchange rate depreciation 5.3 0.1 0.0 -0.1 -0.3 -0.3 -0.3 -0.3 -0.3 ... ...Other identified debt-creating flows -43.7 0.0 0.0 0.0 0.0 0.0 0.0 0.0 0.0 0.0 0.0
Privatization receipts (negative) 0.0 0.0 0.0 0.0 0.0 0.0 0.0 0.0 0.0 0.0 0.0Recognition of implicit or contingent liabilities 0.0 0.0 0.0 0.0 0.0 0.0 0.0 0.0 0.0 0.0 0.0Debt relief (HIPC and other) -43.7 0.0 0.0 0.0 0.0 0.0 0.0 0.0 0.0 0.0 0.0Other (specify, e.g. bank recapitalization) 0.0 0.0 0.0 0.0 0.0 0.0 0.0 0.0 0.0 0.0 0.0
Residual, including asset changes 14.0 -1.4 -0.4 -3.2 -0.6 -1.2 -0.5 0.2 0.7 -2.4 -0.5
Other Sustainability Indicators
PV of public sector debt ... ... 40.3 38.4 37.8 35.5 33.4 31.8 31.4 26.5 19.8
o/w foreign-currency denominated ... ... 13.2 13.3 13.2 13.4 13.5 13.6 14.4 19.2 16.8
o/w external ... ... 13.2 13.3 13.2 13.4 13.5 13.6 14.4 19.2 16.8
PV of contingent liabilities (not included in public sector debt) ... ... ... ... ... ... ... ... ... ... ...
Gross financing need 2/ 3.2 4.2 9.3 7.0 5.5 4.2 3.6 2.8 2.3 4.8 4.2PV of public sector debt-to-revenue and grants ratio (in percent) … … 203.2 169.0 164.8 150.8 141.1 135.0 134.5 116.0 87.9PV of public sector debt-to-revenue ratio (in percent) … … 220.8 199.2 195.4 178.0 166.1 157.1 154.3 130.2 95.9
o/w external 3/ … … 72.5 68.7 68.0 67.5 67.3 67.1 70.8 94.4 81.0Debt service-to-revenue and grants ratio (in percent) 4/ 10.6 7.5 18.4 12.2 9.6 7.0 7.0 6.2 5.8 11.0 13.1
Debt service-to-revenue ratio (in percent) 4/ 11.8 8.9 20.0 14.3 11.4 8.2 8.3 7.2 6.7 12.4 14.3Primary deficit that stabilizes the debt-to-GDP ratio 27.1 6.0 4.4 5.4 3.0 4.0 3.3 2.6 1.8 3.8 1.2
Key macroeconomic and fiscal assumptions
Real GDP growth (in percent) 4.1 4.8 5.9 3.5 1.5 5.6 6.0 6.0 6.1 5.8 5.5 5.8 4.0 4.1 4.2
Average nominal interest rate on forex debt (in percent) 0.7 1.3 2.2 0.6 0.7 1.3 1.6 0.4 0.4 0.2 1.2 0.9 2.5 3.4 2.4
Average real interest rate on domestic debt (in percent) 2.1 -5.2 -3.7 -1.3 6.4 1.8 1.9 1.5 1.5 1.5 1.4 1.6 0.2 -1.2 -0.7
Real exchange rate depreciation (in percent, + indicates depreciation) 10.5 0.4 0.3 -2.0 10.1 -0.5 ... ... ... ... ... ... ... ... ...Inflation rate (GDP deflator, in percent) 1.1 7.6 6.5 3.4 6.3 2.0 2.4 2.5 2.5 2.5 2.5 2.4 2.2 2.1 2.2
Growth of real primary spending (deflated by GDP deflator, in percent) 0.1 0.1 0.2 0.1 0.1 0.1 0.0 0.1 0.0 0.0 0.0 0.1 0.0 0.0 0.0
Grant element of new external borrowing (in percent) ... ... ... … … 50.8 50.1 49.6 49.6 49.6 22.1 45.3 24.8 2.4 ...
Sources: Country authorities; and staff estimates and projections.1/ Central Government.
2/ Gross financing need is defined as the primary deficit plus debt service plus the stock of short-term debt at the end of the last period.
3/ Revenues excluding grants.
4/ Debt service is defined as the sum of interest and amortization of medium and long-term debt.
5/ Historical averages and standard deviations are generally derived over the past 10 years, subject to data availability.
Table 2a.Togo: Public Sector Debt Sustainability Framework, Baseline Scenario, 2010-2033(In percent of GDP, unless otherwise indicated)
Actual Projections
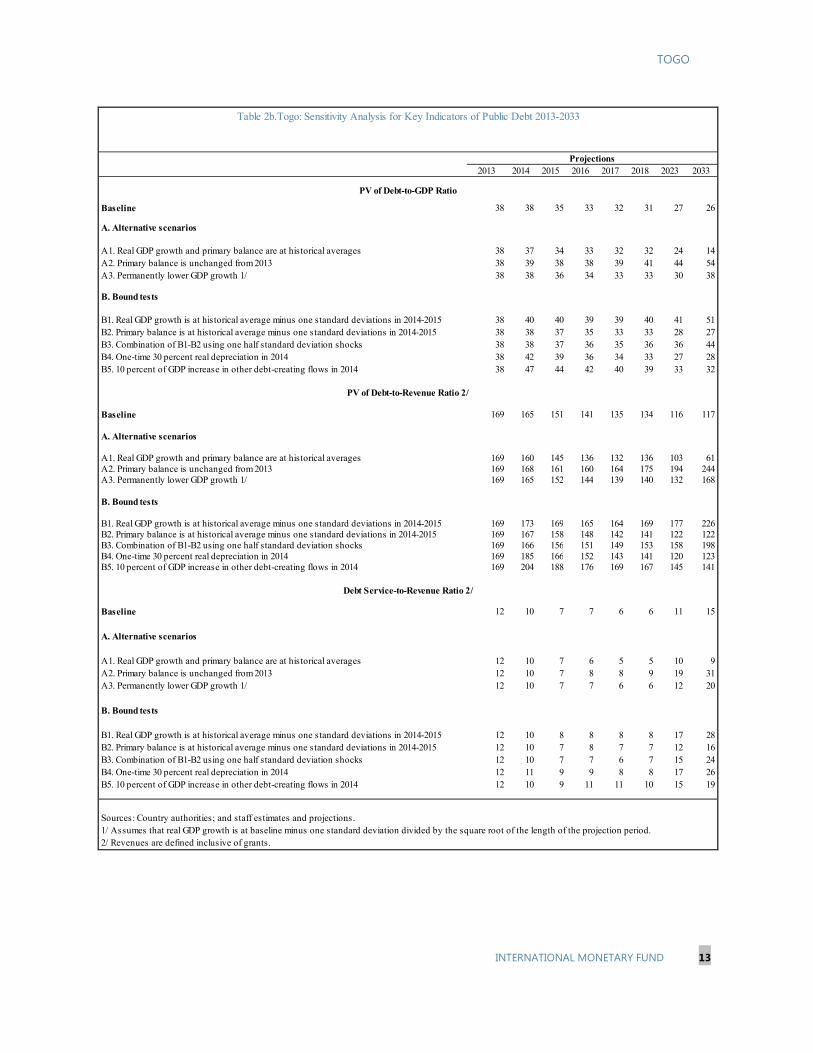
TOGO
INTERNATIONAL MONETARY FUND 13
Table 2b.Togo: Sensitivity Analysis for Key Indicators of Public Debt 2013-2033
2013 2014 2015 2016 2017 2018 2023 2033
Baseline 38 38 35 33 32 31 27 26
A. Alternative scenarios
A1. Real GDP growth and primary balance are at historical averages 38 37 34 33 32 32 24 14A2. Primary balance is unchanged from 2013 38 39 38 38 39 41 44 54A3. Permanently lower GDP growth 1/ 38 38 36 34 33 33 30 38
B. Bound tests
B1. Real GDP growth is at historical average minus one standard deviations in 2014-2015 38 40 40 39 39 40 41 51B2. Primary balance is at historical average minus one standard deviations in 2014-2015 38 38 37 35 33 33 28 27B3. Combination of B1-B2 using one half standard deviation shocks 38 38 37 36 35 36 36 44B4. One-time 30 percent real depreciation in 2014 38 42 39 36 34 33 27 28B5. 10 percent of GDP increase in other debt-creating flows in 2014 38 47 44 42 40 39 33 32
Baseline 169 165 151 141 135 134 116 117
A. Alternative scenarios
A1. Real GDP growth and primary balance are at historical averages 169 160 145 136 132 136 103 61A2. Primary balance is unchanged from 2013 169 168 161 160 164 175 194 244A3. Permanently lower GDP growth 1/ 169 165 152 144 139 140 132 168
B. Bound tests
B1. Real GDP growth is at historical average minus one standard deviations in 2014-2015 169 173 169 165 164 169 177 226B2. Primary balance is at historical average minus one standard deviations in 2014-2015 169 167 158 148 142 141 122 122B3. Combination of B1-B2 using one half standard deviation shocks 169 166 156 151 149 153 158 198B4. One-time 30 percent real depreciation in 2014 169 185 166 152 143 141 120 123B5. 10 percent of GDP increase in other debt-creating flows in 2014 169 204 188 176 169 167 145 141
Baseline 12 10 7 7 6 6 11 15
A. Alternative scenarios
A1. Real GDP growth and primary balance are at historical averages 12 10 7 6 5 5 10 9A2. Primary balance is unchanged from 2013 12 10 7 8 8 9 19 31A3. Permanently lower GDP growth 1/ 12 10 7 7 6 6 12 20
B. Bound tests
B1. Real GDP growth is at historical average minus one standard deviations in 2014-2015 12 10 8 8 8 8 17 28B2. Primary balance is at historical average minus one standard deviations in 2014-2015 12 10 7 8 7 7 12 16B3. Combination of B1-B2 using one half standard deviation shocks 12 10 7 7 6 7 15 24B4. One-time 30 percent real depreciation in 2014 12 11 9 9 8 8 17 26B5. 10 percent of GDP increase in other debt-creating flows in 2014 12 10 9 11 11 10 15 19
Sources: Country authorities; and staff estimates and projections.1/ Assumes that real GDP growth is at baseline minus one standard deviation divided by the square root of the length of the projection period.2/ Revenues are defined inclusive of grants.
PV of Debt-to-GDP Ratio
Projections
PV of Debt-to-Revenue Ratio 2/
Debt Service-to-Revenue Ratio 2/
TOGO STAFF REPORT FOR THE 2013 ARTICLE IV CONSULTATION—INFORMATIONAL ANNEX Prepared By
The African Department (In consultation with other departments)
RELATIONS WITH THE FUND ____________________________________________________________ 2
JOINT WORLD BANK-IMF WORK PROGRAM, 2013-14 ________________________________ 5
STATISTICAL ISSUES ______________________________________________________________________ 8
CONTENTS
November 20, 2013

TOGO
2 INTERNATIONAL MONETARY FUND
RELATIONS WITH THE FUND (as of August 31, 2013)
Membership Status: Joined August 1, 1962; Article VIII General Resources Account: SDR million % of Quota
Quota 73.40 100.00 Fund holdings of currency 72.99 99.32 Reserve Position 0.53 0.72 SDR Department: SDR million % of Quota
Net cumulative allocation 70.33 100.00 Holdings 59.28 84.28 Outstanding Purchases and Loans: SDR million % of Quota
ECF Arrangements 95.25 129.77 Financial Arrangements:
Type
Approval Date
Expiration Date
Amount Approved (SDR million)
Amount Drawn (SDR million)
ECF1 Apr 21, 2008 Jul 26, 2011 95.41 95.41 ECF1 Sep 16, 1994 Jun 29, 1998 65.16 54.30 ECF1 May 31, 1989 May 19, 1993 46.08 38.40
1Formerly PRGF.
Projected Payments to the Fund12 (SDR million; based on existing use of resources and present holdings of SDRs)
Forthcoming
2013 2014 2015 2016 2017 Principal 1.17 8.04 11.60 17.32 19.08 Charges/Interest 0.00 0.01 0.21 0.17 0.13 Total 1.17 8.05 11.81 17.50 19.21
12 When a member has overdue financial obligations outstanding for more than three months, the amount of such arrears will be shown in this section.

TOGO
INTERNATIONAL MONETARY FUND 3
Implementation of HIPC Initiative:
I. Commitment of HIPC assistance Framework Decision point data Assistance committed By all creditors (US$ Million) ¹
Of which: IMF assistance (US$ million) (SDR equivalent in millions)
Completion point date
Nov 2008
282.00 0.32 0.22
Dec 2010
II. Disbursement of IMF assistance (SDR Million) Assistance disbursed to the member
Interim assistance Completion point balance
Additional disbursement of interest income ² Total disbursements
0.22 0.08 0.14 0.01
0.22
¹ Assistance committed under the original framework is expressed in net present value (NPV) terms at the
completion point, and assistance committed under the enhanced framework is expressed in NPV terms at the
decision point. Hence these two amounts cannot be added.
² Under the enhanced framework, an additional disbursement is made at the completion point corresponding to
interest income earned on the amount committed at the decision point but not disbursed during the interim
period.
Exchange Arrangement
Togo is a member of the West African Economic and Monetary Union (WAEMU) and has no separate legal tender. The exchange system, common to all WAEMU countries, is free of restrictions on the making of payments and transfers for current international transactions. The union’s common currency, the CFA franc, is pegged to the euro at a rate of CFAF 655.957 = EUR 1, consistent with the official conversions rate of the French franc to the euro and the previous fixed rate of the CFA franc to the French franc of CFAF 100= F 1. On April 28, 2006, the rate of the CFA franc in terms of SDR was CFAF 769.68 = SDR 1.0. Effective January 1, 2007, the exchange arrangement of the WAEMU countries has been reclassified to the category of conventional pegged arrangement from the category of exchange arrangement with no separate legal tender. The new classification is based on the behavior of the common currency, whereas the previous classification was based on the lack of a separate legal tender. The new classification thus only reflects a definitional change, and is not based on a judgment that there has been a substantive change in the exchange regime or other policies of the currency union or its members.

TOGO
4 INTERNATIONAL MONETARY FUND
Safeguards Assessments
The Central Bank of West African States (BCEAO) is a common central bank of the countries of the West African Economic and Monetary Union (WAMU). The 2013 assessment of the BCEAO is substanstially complete. The assessment found that the bank continues to have a strong control environment and has, with the implementation of the 2010 Institutional Reform of the WAMU, enhanced its governance framework. Specifically, an audit committee was established to oversee the audit and financial reporting processes, transparency has increased with more timely publication of the audited financial statements, and the BCEAO is committed to IFRS implementation by end-2014. The assessment also identified some limitations in the external audit process and recommended that steps be taken to ensure the adequacy of the mechanism through selection of a second experienced audit firm to conduct joint audits.

TOGO
INTERNATIONAL MONETARY FUND 5
JOINT WORLD BANK-IMF WORK PROGRAM, 2013-14 The IMF Togo team led by Mr. Mlachila (mission chief) held a discussion with the World Bank Togo team led by Mr. Hoogeveen (mission chief) on June 20th, 2013, to identify macro-critical structural reforms and coordinate the two teams’ work for the period August 2013-December 2016. Continuous collaboration is taking place, including coordination of timing of missions and conducting joint studies.
The teams agreed that Togo’s main macroeconomic challenges are to raise the level of economic growth and making it more inclusive. In this regard, there would be need to accelerate structural reforms, particularly resetting fiscal policy to ensure fiscal sustainability, enhance public financial management, and strengthen financial sector stability and promote financial development, including through privatization of government-owned banks. Reforms in other key areas such as energy, telecommunications, business environment and phosphates are needed to reduce bottlenecks and raise potential growth. At the same time, measures to render growth more inclusive, such as targeted transfers, should also be considered a priority. Areas of close collaboration between the Fund and the Bank include the financial sector, debt policy, and poverty analytics and policies. Details on division of labor in other areas are presented below.
Title Products Provisional Timing of missions
Expected Delivery Date
A. Mutual information on relevant work programs World Bank work program in the next 12 months Lending/ Grants: Community Development Project Ongoing Education for All Ongoing
Emergency Infrastructure Rehabilitation & Energy Project
Ongoing
Financial Sector and Governance Project Ongoing Private Sector Development Project Ongoing Agriculture Sector Project Ongoing West Africa Productivity Program Ongoing
Emergency Urban Rehabilitation Additional Financing Ongoing
Integrated Disaster and Land Management Project Ongoing

TOGO
6 INTERNATIONAL MONETARY FUND
Infrastructure Additional Financing Ongoing
Community Development /Youth Employment
Ongoing
WARCIP Broadband connectivity Ongoing
DPO VI––Economic Governance and Growth Credit November 2013
Maternal and Child Health operation April 2014
DPO VII––Economic Governance and Growth Credit May 2014
Economic and Sector Work: FY 2014 Policy notes May 2014 Public Expenditure Review June 2014 Technical assistance/other analytical: Use of Country Systems December 2013 ICT Strategy Development June 2015 Mineral Sector February 2014 Post- basic Education April 2014 Statistical November 2013
Strengthening the capacity of the accountancy profession December 2013
Others: Country Partnership Strategy July 2014 IMF work program in the next 12 months Lending:
Finalization of discussion on potential new ECF arrangement February 2014 April 2014 First review under potential new ECF arrangement September 2014 November 2014
Technical assistance:
Public Financial Management (Accounting and Fiscal Reporting) (FAD) September 2013 September 2014
Public Financial Management (Reform strategy and coordination) (FAD) September 2013 March 2014
Liability Management (AFRITAC West) October 2013 October 2013 Tax Administration (AFRITAC West) October 2013 October 2013
Debt Sustainability Analysis National Workshop (AFRITAC West) October 2013 October 2013 Cash Management (FAD) October 2013 November 2013
Public Financial Management (AFRITAC West) October 2013 April 2014 Organic Law Implementation Strategy (FAD) November 2013 November 2013

TOGO
INTERNATIONAL MONETARY FUND 7
Procurement plan (FAD) November 2013 November 2013 Ministry of Finance Organization (FAD) November 2013 November 2013 Customs Administration (AFRITAC West) November 2013 December 2013
Diagnostic Revenue Administration December 2013 December 2013 Accounting Closure (FAD) February 2014 February 2014
B. Requests for work program inputs Fund requests to Bank
Technical support and collaboration on expenditure policy on social safety nets due to the significant fiscal impact of measures to mitigate the impact of increases in fuel prices on the poor.
Bank request to Fund
Technical support and collaboration in the areas of public finance management and the banking sector.
C. Agreement on joint products and missions Joint Bank-Fund products in the next 12 months
Joint LIC Debt Sustainability Analysis
November 2013
Joint Staffs Advisory Note on PRSP January 2014

TOGO
8 INTERNATIONAL MONETARY FUND
STATISTICAL ISSUES 1. Data provision is broadly adequate for surveillance, but weaknesses in the quality and timeliness of data hamper staff’s analysis. National accounts and balance of payments statistics are compiled based on very limited information, with only few surveys and scarce data on primary agriculture and private sector services. Moreover, government finance statistics are derived from a weak accounting and reporting system, and monetary data are reported by the BCEAO with a two-month lag.
2. The country has participated in the General Data Dissemination System (GDDS) since November 2001. Metadata on the national statistical system, including plans for improvement posted to the Fund’s Dissemination Standard Bulletin Board, were last updated in December 2004.
National accounts and consumer price index (CPI)
3. Like other West African Economic and Monetary Union (WAEMU) member states, Togo embarked in late 2002 on implementing the System of National Accounts 1993 (1993 SNA), using the ERETES software. The national accounts for the new base year (2000) were completed in 2005, but in 2006 due to a number of difficulties such as lack of staff, material and financial resources, the program was suspended and the NA for 2001 was not finalized. Only in March 2009 did the implementation process resume and the Direction Générale de la Statistique et de la Comptabilité Nationale (DGSCN) started working on the compilation of data for 2007 (the most recent year for which enough data was available). Since then, several AFRITAC West and AFRISTAT missions have assisted in the completion of data collection, in the preparation of source data, in ensuring consistency across primary data sources, and in preparing preliminary accounts. Estimates of production in the informal sector were also produced. The efforts related to end-2010 population census exercise, which required the full attention of staff in the DGSCN, have further delayed the completion of the 2007 National Accounts. Furthermore, a May 2011 AFRITAC West TA report pointed to serious anomalies in the provisional 2007 national accounts (concerning value added in the informal sector, low fixed capital formation, high consumption to GDP ratio, among others), which were corrected during the mission. Final National Accounts numbers for 2006 and 2007 have been validated by the Comité PIB. Despite the delays the authorities remain committed to achieving the objective of finalizing the national accounts referring to the years up to 2010 by 2014, reporting the previous target of June 2012.
4. The CPI basket was revised in 2010. The WAEMU commission, supported by AFRISTAT and the BCEAO, launched a revision of the harmonized CPI basket in the region in 2008. The reform included expanding CPI surveys, and updating the weights of various sub-components to reflect consumption habits. The DGSCN is constructing a consumer price index with national coverage. The collection of the first observations is planned for January 2014, and the index will be published after January 2015 when the first 12 month variation becomes available.

TOGO
INTERNATIONAL MONETARY FUND 9
External sector statistics
5. Balance of payments statistics and international investment position data are compiled based on bank reports, a survey of enterprises, and customs data. Statistics are compiled following the principles of the 5th balance of payment manual, with a six-month delay and are revised twice a year. Export figures, net of transit trade, are appropriately reported since the latest STA technical assistance mission in balance of payments statistics in 2008. The Central bank continues its efforts for a better covering of informal trade notably with the subregional unit for the reconciliation of intra-WAMU trade.
Government accounts and public debt data
6. The Government finance statistics accounting system is undergoing improvements. The new WAEMU budget nomenclature now permits the economic and ministerial classification of expenditure, with functional classification under development. The monthly TOFE (Table of Central Government Financial Operations) is based on a mixture of administrative and accounting data and is sent to AFR with a two-month lag. The debt database weakened since the HIPC completion point at end 2010. Government recognition of old domestic arrears and their liabilities has further complicated the compilation of a reliable and consistent database. Only budgetary central government data are reported for publication in the Government Finances Statistics Yearbook (GFSY), government finance high frequency data are not reported for publication in the IFS. In the context of the 2013 Article IV consultation, with assistance from STA, the authorities established a bridge table allowing transposition of TOFE data, which is based on the 1986 Government Finance Statistics Manual (GFS86), to the 2001 Government Finance Statistics Manual (GFSM01), as well as a table on Government Financial Operations for 2009-16 based on GFSM01 principles (Appendix V).
Monetary statistics
7. Monthly data for Togo, along with data for other members of the West African Monetary Union are regularly disseminated by the Central Bank of the West African Monetary Union (BCEAO) with a lag of about two months. Data on lending and borrowing rates, charged by domestic banks, are now compiled and available monthly.

TOGO
10 INTERNATIONAL MONETARY FUND
Togo: Table of Common Indicators Required for Surveillance (as of October 2013)
Economic Variable Date of
latest observation
Datereceived
Frequency of Data2
Frequency of
Reporting2
Frequency of
publication2
Exchange Rates September 2013
October 2013
M M Published
International Reserve Assets and Reserve Liabilities of the Monetary Authorities
August 2013 October 2013
M M Published
Reserve/Base Money August 2013 October 2013
M M Published
Broad Money August 2013 October 2013
M M Published
Central Bank Balance Sheet August 2013 October 2013
M M Published
Consolidated Balance Sheet of the Banking System
August 2013 October 2013
M M Published
Interest Rates August 2013 September 2013
M M Published
Consumer Price Index August 2013 September 2013
M M Published
Revenue, Expenditure, Balance and Composition of Financing – General Government
n.a. n.a. n.a. n.a. Not published
Revenue, Expenditure, Balance and Composition of Financing– Central Government
July 2013 September 2013
M M Published
Stocks of Central Government and Central Government-Guaranteed Debt
June 2013 August 2013
M M Not published
External Current Account Balance
December 2012
August 2013
A OM Not published
Exports and Imports of Goods and Services
December 2012
August 2013
M OM Not published

TOGO
INTERNATIONAL MONETARY FUND 11
GDP/GNP December 2012
August 2013
A OM Not published
Gross External Debt December 2012
August 2013
A OM Not published
International Investment Position3
2011 2012 A OM Not published
1 The general government consists of the central government (budgetary funds, extra-budgetary funds, semi-autonomous government agencies and institutions, and social security funds) and state and local governments. 2 Monthly (M), Quarterly (Q), Semi Annually (SA), Annually (A), on mission (OM). 3 Includes external gross financial asset and liability positions vis-à-vis nonresidents.

Press Release No. 13/514 FOR IMMEDIATE RELEASE December 16, 2013
IMF Executive Board Concludes 2013 Article IV Consultation with Togo
The Executive Board of the International Monetary Fund (IMF) on December 6, 2013 concluded the Article IV consultation with Togo.1 Togo has made significant progress in macroeconomic stability, but challenges remain in accelerating economic reforms and reducing poverty. Real economic growth accelerated from almost 4½ in 2010-11 to 5¾ in 2012-13, reflecting dynamism in agriculture, mining, construction and public works, particularly in transportation infrastructure. Growth has been accompanied by a widening of the current account deficit, financed mainly through foreign direct investment. Inflation has been low, on average slightly below 2½ percent during 2012-13. Under election-related pressures, fiscal policy deteriorated in 2012 and early 2013, with the approval of expansionary budgets that led to financing shortfalls. In mid-2013 the authorities took strong corrective measures, including by adopting a revised budget. These measures have placed Togo on a path of fiscal consolidation, anchored by an improvement in the primary domestic fiscal balance that could lead to a gradual reduction of debt. On the fiscal policy front, challenges remain in achieving greater prioritization of public investment projects, reducing fuel subsidies, and containing the public wage bill, in order to create the needed fiscal space for higher social and infrastructure spending. More generally, there is need to formulate annual budgets in the context of medium-term budget policies and improve public debt management to ensure continued debt sustainability.
1 Under Article IV of the IMF's Articles of Agreement, the IMF holds bilateral discussions with members, usually every year. A staff team visits the country, collects economic and financial information, and discusses with officials the country's economic developments and policies. On return to headquarters, the staff prepares a report, which forms the basis for discussion by the Executive Board.
International Monetary Fund Washington, D.C. 20431 USA

2
Progress in structural reforms has recently accelerated with a re-energized program of public financial management reform, and the project to establish a revenue authority by merging tax and customs administrations. The proposed revenue authority could be leveraged to modernize revenue administration efficiency and increase revenue by bringing appropriate structures, operations, and management processes to modern international standards. Poverty declined during 2006-2011. However, growth has not been inclusive as income distribution worsened. Poverty in rural areas has actually increased, while it declined, across all income levels, in the capital area where most economic growth is concentrated. Internal migration contributed to poverty reduction. Sustainable growth is hampered by major obstacles. Chief among these are infrastructure bottlenecks, particularly in the electricity and transport sectors, high telecommunication costs, and a generally weak business environment. Togo’s financial sector has deepened and its aggregate financial indicators are sound. Two state-owned banks have been privatized, new banks are expanding operations, and the microfinance sector has grown rapidly. The authorities’ objective remains to divest from the banking sector. However, individual banks face difficult situations and the authorities have taken initial steps to stem asset deterioration. The supervision framework of the micro-finance sector needs to be improved, licensing regulations enforced and pyramid-like schemes closed. Executive Board Assessment2 Directors commended the authorities’ actions to control the fiscal deficit and to set Togo on a sustainable debt path. They emphasized the importance of improving debt management and seeking financing on terms consistent with debt sustainability. To free budget space for social and infrastructure expenditure, Directors encouraged a progressive reduction in poorly-targeted fuel subsidies and lower growth of public sector wages. They noted that improvements in the financing and management of projects will be necessary to support a scaling-up of public investment. Directors also recommended the swift implementation of long-planned fiscal reforms, including the establishment of a single treasury account and a new revenue authority, which should enhance revenue administration and mobilization.
Directors took note of the progress made in promoting financial development. Nonetheless, they underscored the need to intensify financial sector oversight and resolve problem banks.
2 At the conclusion of the discussion, the Managing Director, as Chairman of the Board, summarizes the views of Executive Directors, and this summary is transmitted to the country's authorities. An explanation of any qualifiers used in summings up can be found here: http://www.imf.org/external/np/sec/misc/qualifiers.htm.
3
Specifically, they called for stronger supervision of microfinance institutions and further restructuring of public banks.
Directors agreed that structural reforms remain critical to improve competitiveness and reduce poverty. In this context, they encouraged the authorities to address bottlenecks in the energy sector, reform public enterprises, and make further efforts to improve the business environment. More effective poverty reduction policies and renewed attention to agricultural productivity and employment should also remain top policy priorities.
Directors welcomed the authorities’ intention to remain in close engagement with the Fund, including through a possible Fund-supported program and continued technical assistance in key reform areas.

4
Togo: Selected Economic Indicators, 2010–13
2010 2011 2012 2013 2014
Est. Proj. Proj. (Annual percentage change)
Income and Prices
GDP at constant prices 4.1 4.8 5.9 5.6 6.1
Consumer price index (average) 1.4 3.6 2.6 2.2 2.4
Real effective exchange rate (minus = depreciation) -6.0 0.7 -4.0 … … Money and credit
Net foreign assets 1 3.0 4.4 -2.1 -3.1 -2.4 Broad money (M2) 16.3 15.9 8.9 15.9 9.5 Credit to nongovernment sector 1 10.3 20.5 11.6 10.0 6.6 Credit to government 1 4.3 -5.6 3.7 2.0 0.7
(Percent of GDP)
Investment and Saving
Gross domestic investment 18.9 18.6 19.1 20.3 21.1
Gross national saving 12.6 9.6 7.3 9.7 10.2
External sector
Current account balance -6.3 -9.1 -11.8 -10.6 -10.9
Trade balance -14.3 -15.4 -15.7 -16.2 -16.3
Central government finance
Total revenue and grants 20.4 20.4 19.8 22.7 23.0
Expenditure and net lending 22.5 23.8 26.4 28.1 27.6
Domestic primary balance 2 1.7 -1.6 -2.0 -0.7 0.0 Overall balance (cash basis, incl. grants & change in arrears) -4.3 -3.5 -7.2 -6.3 -5.3
Sources: Togolese authorities; IMF staff estimates and projections.
1 Change in percent of beginning-of-period broad money. 2 Total revenue minus current primary expenditure, domestically-financed capital expenditure, and net lending.

Statement by Mr. Assimaidou on Togo Executive Board Meeting
December 6, 2013 On behalf of my Togolese authorities, I would like to thank the Board, Management and staff for the constant support to their policy efforts, both under or off Fund-supported programs, throughout the years. This support is most valuable in the current challenging external environment. They are especially appreciative of the candid discussions and the policy advice provided by staff during the Article IV consultation discussions. Following a decade and a half of socio-political crisis and economic stagnation, Togo was able to improve its macroeconomic performance under Fund-supported program and on the path towards the HIPC completion point. The implementation of the ECF-supported program has been generally satisfactory, with the completion of all six reviews. Real GDP growth in 2012 and 2013 averaged more than 5 percent with inflation at about 2 percent. Moreover, under the ECF-supported program, the authorities realized strong budget execution, with revenue collection often exceeding targets thanks to actions in broadening the tax base and administrative reforms, and current expenditures kept within program ceilings. The authorities have, among other reforms, improved public financial management, established a treasury cash management committee which needs to be revamped, initiated steps towards a single treasury account, and completed a financial and organizational audit and an actuarial study of the civil service’s pension fund. The authorities also started the establishment of a one-stop window at the Port Autonome de Lomé (PAL), supported the financial restructuring of problem banks and privatized two of them. More broadly, the program’s general objectives of macroeconomic stability and growth were achieved despite significant exogenous shocks (global economic crisis, floods, political and social unrests, etc.). The growth performance has translated into per capita income rising—albeit modestly—finally reversing a downward trend during the country’s long crisis of the 1990s and early 2000s. The Remaining Medium-term Agenda The Togolese authorities are well cognizant that much more needs to be done in several structural areas. The record on this front up to now has been mixed due to technical capacity constraints and lengthy consultative and legal processes. In the financial sector, although progress was made as regards financial deepening, the privatization process has fallen short of plans. In the energy sector, considerable liabilities weigh on the government budget while actual and potential supply shortages impede potential growth. On infrastructure, there are still gaps to be bridged to boost potential growth, and more efforts are required in the broader area of business environment.

2
My authorities are committed to tackle these structural problems over the medium term and intend to remain closely engaged with the Fund and other partners to this end. As Togo remains a fragile state, continued policy advice, technical assistance and financial support will be key to the Togolese authorities’ efforts to succeed in these endeavors while pursuing revenue-enhancing measures to ensure fiscal sustainability and tackling poverty. The second-generation PRSP embodied in the authorities’ Stratégie de Croissance Accélérée et de Promotion de l’Emploi (SCAPE), which builds on the first poverty reduction strategy, aims at making growth stronger, more sustainable and more inclusive. My authorities are in the process of implementing an adjustment program that meets these objectives while also ensuring macroeconomic stability. Ensuring Fiscal Sustainability and Preserving Debt Sustainability The authorities have expressed their firm commitment to pursue the fiscal reforms and ensure that fiscal policy remains on a sustainable path. Going forward, the objectives are to increase significantly revenue mobilization and contain current expenditure so as to finance much-needed infrastructure and social needs. Fiscal policy targets a return to positive primary domestic fiscal balance and a reduction of the overall fiscal deficit by 2014. The intended medium-term (2013-2016) fiscal adjustment will be frontloaded. Already, the revised 2013 budget is better aligned with execution capacity, leans on more realistic revenue projections, and provides more sensible allocations for fuel subsidies. Efforts on the revenue side will build on ongoing reforms to rationalize import and other exemptions through tighter monitoring of those entitlements. The authorities will push forward programmed reforms in tax and customs administrations with the view to raise revenue further. On the expenditure front, the authorities reiterated their intention to resist wage increase pressures from unions that would bring the budget envelopes beyond the current medium-term spending framework. On fuel subsidies, the authorities see merit in eliminating these generalized assistance measures, with the exception of kerosene which is mostly used by the poor. However, they continue to believe that the removal of those subsidies should be done in a gradual manner to maintain social stability, as previous attempts to remove the subsidies have been met by strong social resistance with damages to property. My authorities will continue the efforts in trimming subsidies which are set to be reduced by an amount equivalent to 1 percent of GDP as early as 2014 after having secured an agreement with labor union partners on pay and tax packages notably for transporters. Public financial management reforms will focus on pursuing efforts towards establishing a single treasury account, further improving cash and treasury projections and management, and simplifying the expenditure circuit. My authorities also agree on the need to better

3
prioritize, execute and monitor investment projects which they intend to do with technical assistance from partners. Capacity constraints are also acute in the area of debt management. Therefore, measures to strengthen the technical and operational capacity of the debt management unit (Direction de la Dette Publique) within the Ministry of Economy and Finance are being envisaged. The authorities have requested additional technical assistance in this area. Debt sustainability also requires the contracting of highly concessional financing packages. While noting that concessional financing is not available in amounts required to meet development needs, my authorities will do their utmost to seek financing on terms consistent with debt sustainability as guided by the DSA. Enhancing the Financial Sector The authorities appreciate the analysis of staff on the financial sector vulnerabilities, and agree with the recommendations to address them as well as improve the regulatory and supervisory frameworks. They remain committed to tackling the management difficulties faced by some banking and microfinance institutions, along the lines suggested by staff, with the view to preserve financial stability. My authorities intend to step up the capacity of the specialized unit within the Ministry of Economy and Finance (CAS-IMEC) to monitor under-regulated institutions and close illegal entities in the microfinance sector. They continue to work closely with the regional Banking Commission within the Western African Economic and Monetary Union (WAEMU) to require banks to comply with prudential standards. At the same time, it is to be noted that only decisions at the WAEMU level can change and simplify the banking regulatory framework. There is full agreement between the authorities and staff on the medium-term policies for the financial sector, which is to support growth through greater financial intermediation. This requires ensuring that banks, microfinance institutions as well as pension funds become and remain financially sound. Toward Stronger and More Inclusive Growth The authorities have made stronger, sustainable, and inclusive growth a priority objective in their SCAPE (2013-2017) which benefited from a large consultative process, including the 2012 National Economic Forum which involved all domestic stakeholders and developments partners. The strategy is articulated around five pillars: developing sectors with high growth potential; economic infrastructure; human capital and employment; governance; and participatory, inclusive and durable development. Making growth stronger and sustainable requires addressing the weaknesses of the energy and other infrastructure sectors. The authorities are aware that financial difficulties faced by

4
national power companies and the rapid increase of demand for electricity could lead to power shortages, especially as external sources of electricity may face supply constraints, thereby undermining growth prospects. To address this challenge, the Togolese authorities intend to implement measures to clear the accumulated arrears to the electricity companies and to avoid their re-emergence through a diagnostic and action plan. Closing the infrastructure gaps in this sector as well as in the transportation sector (roads, airport, and port) is also essential to boosting potential growth. Strengthening competitiveness and the business environment through governance reforms is also a cornerstone of the authorities’ medium term growth agenda. The authorities welcome the findings that Togo’s external sector risks are generally manageable and that the real effective exchange rate is broadly in line with economic fundamentals. However, they view seriously the deficiencies in non-price competitiveness and the business climate. They will strive to improve the business environment and the quality of governance, notably through contract enforcement, protection of investors’ rights, and access to finance. The authorities put emphasis on ensuring that economic growth benefits the larger population. Specific measures to reduce poverty and make growth more inclusive, especially in rural areas, include constructing small dams and increasing access to water to enhance productivity; expanding feeder roads to increase market access; and addressing youth unemployment through targeted support to young entrepreneur projects. They take good note of the recommendation for—and will reflect on—urban planning as a way to increase poverty reduction gains brought about by internal migration to the cities. Conclusion Important and concrete progress has been achieved in the past five years in the area of macroeconomic sustainability and also in terms of reversing the decline in per capita GDP. Real GDP has been growing at a high rate and many critical reforms have been initiated under the previous ECF-supported program. Going forward, my Togolese authorities remain committed to pursue the reforms started and address the bottlenecks that still constrain the development of the economy. My authorities place a very high importance on measures that will create private sector-led employment and reduce poverty while ensuring fiscal sustainability. However, Togo remains a fragile state with significant capacity constraints. Thus, my authorities look forward to the continued support from the international community, including the Fund, to assist them in their efforts to implement the needed wide-ranging reforms.