today’s lecture - ut aerospace engineering & … · today’s lecture • pitot-static...
TRANSCRIPT
Revised byGreg Holt
ASE 167M Lecture One
Aircraft SystemsFlight 1 Briefing
2/2/2004 ASE167M Lecture 1 2
Lecture #1
Today’s lecture
• Pitot-static systems• Bernoulli’s equation• Airspeed definitions• Flight Instruments• Flight control systems• Flight 1 briefing
2/2/2004 ASE167M Lecture 1 3
Lecture #1
Pitot-Static Systems• Essential requirements in the measurement of a/c performance
are: (1) state of atmosphere and (2) relative motion betweenthe a/c and the air mass ⇒ air data systems
• Of the primary flight instruments (Altimeter, airspeed, VVI,compass, turn coordinator), the first three use the Pitot-staticsystem
• The Pitot-static systems, drive instruments (movement of apointer mechanically) that use difference between static andtotal pressure, or just static pressure (independent of electricalpower supply)
• System includes a pitot tube for measuring impact (ram)pressure, and static ports for measuring barometric staticpressure.
2/2/2004 ASE167M Lecture 1 4
Lecture #1
Pitot-Static Systems (2)

2/2/2004 ASE167M Lecture 1 5
Lecture #1
Bernoulli’s Equation• Total pressure at a given point is that which would exist if
the flow were slowed down isentropically to zero.• Assumptions?
– Isentropic– Incompressible
• Derived from Newton’s 2nd Law (F = ma)
( )
21
2
12 1 21 . 12 T
P P V
P V P const along streamline
ρ
ρ
− =
+ = =
Static Pressure
Dynamic Pressure
Total Pressure
PT
P
Static Port
Pitot TubeFlowV1,P1V2=0
P2
2/2/2004 ASE167M Lecture 1 6
Lecture #1
Airspeed Definitions• True Airspeed: Solve (1) for V:
– Keep– P and ρ are corrected for at flight condition
• Calibrated Airspeed:– Speed read on a perfect airspeed indicator (i.e. no instrument error
and true static pressure)– Corrections may be particular to a/c and instruments– Take into account position errors
Vtrue =2 PT − P( )
ρ⇒ Function of 2 variables
)Atmosphere StandardLevel(Seaslρρ =
. .calibrated indicated posit instV V V V= + ∆ + ∆
2/2/2004 ASE167M Lecture 1 7
Lecture #1
Airspeed Definitions (2)• Equivalent Airspeed
– Corrected for compressibility effects– Corrected for altitude/density changes– For incompressible flow we use
– We will assume:
• Indicated Airspeed– As measured by airspeed indicator– We will assume:
( )22 21 12 2
Tsl equiv cal true
sl sl
P Pq V V V V
ρ ρρ ρρ ρ−
= = ⇒ = =
equiv calV V=
trueindicated VV =
1
02 1 11
( 1.4 )
truep ppV
p
ratio of specific heats for air
γγγ
γ ρ
γ γ
−
− ⇒ = + − −
⇒ =
2/2/2004 ASE167M Lecture 1 8
Lecture #1
Airspeed Definitions (3)• white arc
– flap operating range– stall speed (with full flaps + landing
gear – landing configuration) tomax. flap operating speed
• green arc– normal operating range– stall speed (power-off in clean
configuration) to caution range• yellow arc
– caution range• red line
– never exceed speed

2/2/2004 ASE167M Lecture 1 9
Lecture #1
Altimeter• Measures the weight of the air above
the A/C ⇒ fly at a constant pressurelevel
• Pressure typically decreases, in thelower atmosphere, by a known amountwith altitude.(standard lapse rate)
≈ - 1.00”Hg/1000 ft
• Static pressure readings are comparedto a table of pressures to calculatealtitude
0 /
0
0 0
1R g
T pHp
β
β
− = −
2/2/2004 ASE167M Lecture 1 10
Lecture #1
Vertical Velocity Indicator (VVI)
• Rate of static pressurechange is measured to givean indication of rate ofaltitude change.
• System exhibits a 4-8 seconddelay before steady statereading is accurate.
• Shows Trend (immediateindication) and rate(stabilized) of climb
2/2/2004 ASE167M Lecture 1 11
Lecture #1
Example Problem• Altimeter and airspeed indicator read 8000 ft.
and 120 mph, respectively. Assume that allinstruments are perfect.
• A pitot-static tube measures the dynamicpressure.– What is the true airspeed?
• Assume the a/c flies at the same altitude andenters an area of lower pressure.– What happens to the altimeter reading?– What happens to the airspeed indicator reading?– What happens to the VVI reading?
2/2/2004 ASE167M Lecture 1 12
Lecture #1
Example Solution (1)• True Airspeed
mphVft
slugft
slug
mphVV
ftslugft
slug
true
SLcaltrue
ft
SL
4.135
00186.0
00237.0120
00186.0
00237.0
3
3
38000
3
=
==
=
=
ρρ
ρ
ρ

2/2/2004 ASE167M Lecture 1 13
Lecture #1
Example Solution (2)• (altitude) As the altitude increases, static
pressure decreases. Therefore, the altimeter willshow an increase.
• (airspeed) Assuming constant density, there willbe no change in the airspeed indication as thedynamic pressure measured by the pitot-statictube will not change.
• (VVI) The static pressure will appear to havedecreased with time; therefore, the VVI will showa climbing rate.
2/2/2004 ASE167M Lecture 1 14
Lecture #1
Gyroscopic Systems• Attitude indicator, heading indicator, and turn &
slip indicator or turn coordinator.• These devices exploit two properties: (1) rigidity
and (2) precession which are based upon theconservation of angular momentum.– Rigidity is the property which resists any force
tending to change the plane of rotation of the rotor.– Precession is the actual change in the direction of the
plane of the rotation under the influence of an appliedforce.
2/2/2004 ASE167M Lecture 1 15
Lecture #1
Gyroscopic Systems (2)
2/2/2004 ASE167M Lecture 1 16
Lecture #1
Attitude Indicators• Universally mounted gyroscope (rotates free in any plane)• Horizon bar is attached to a gyro to remain parallel to natural
horizon (Gyro acts as a pendulum)

2/2/2004 ASE167M Lecture 1 17
Lecture #1
Attitude Indicator (2)
2/2/2004 ASE167M Lecture 1 18
Lecture #1
Heading Indicators• Formerly called the Directional Gyro• Heading indicator is mounted vertically
– Susceptible to precession errors
2/2/2004 ASE167M Lecture 1 19
Lecture #1
Turn Coordinator or Turn-and-SlipIndicator
• Displays rate and quality of turn• Turn rate, bank angle, and velocity related when
performing a coordinated turn• “Step on the ball”
2/2/2004 ASE167M Lecture 1 20
Lecture #1
Flight Control Systems• Elevators
– Horizontal surfaces on tail of a/c that induce pitch• Ailerons
– Horizontal surfaces on wing of a/c that act in oppositedirections to induce roll
• Rudder– Vertical surface on tail of a/c that induces yaw
• Trim Tabs– Supplemental surface on elevators, ailerons, and
rudder than can be used to create “fingertip” yokerequirement under continual control surfacedisplacement

2/2/2004 ASE167M Lecture 1 21
Lecture #1
Flight Control Systems (2)
Flaps
2/2/2004 ASE167M Lecture 1 22
Lecture #1
Flight Control Systems (3)• Flaps
– increase lift– increase drag
2/2/2004 ASE167M Lecture 1 23
Lecture #1
Power Plant Systems (1)• Carburetor : Use Carburetor Heat
2/2/2004 ASE167M Lecture 1 24
Lecture #1
Power Plant Systems (2)• MagnetosTest L and R
2/2/2004 ASE167M Lecture 1 25
Lecture #1
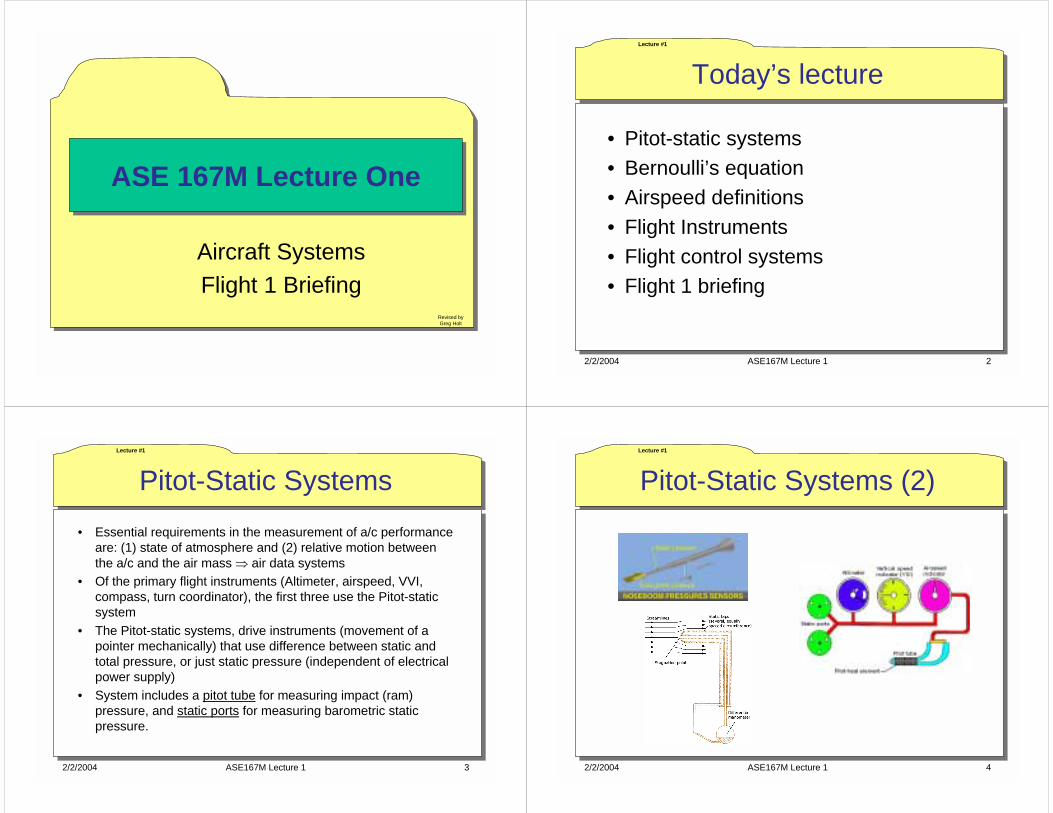
Power Plant Systems (3)• Cowl Flaps
2/2/2004 ASE167M Lecture 1 26
Lecture #1
Power Plant Systems (4)• Propellers
– RPM controls Pitch ofthe propellers
Fuel Flow Control
RPM Control Manifold Pressure
(MP) or Throttle
Control
RPM ControlManifold Pressure (MP)or Throttle Control
Fuel Flow Control
2/2/2004 ASE167M Lecture 1 27
Lecture #1
Lab Schedule
2/2/2004 ASE167M Lecture 1 28
Lecture #1
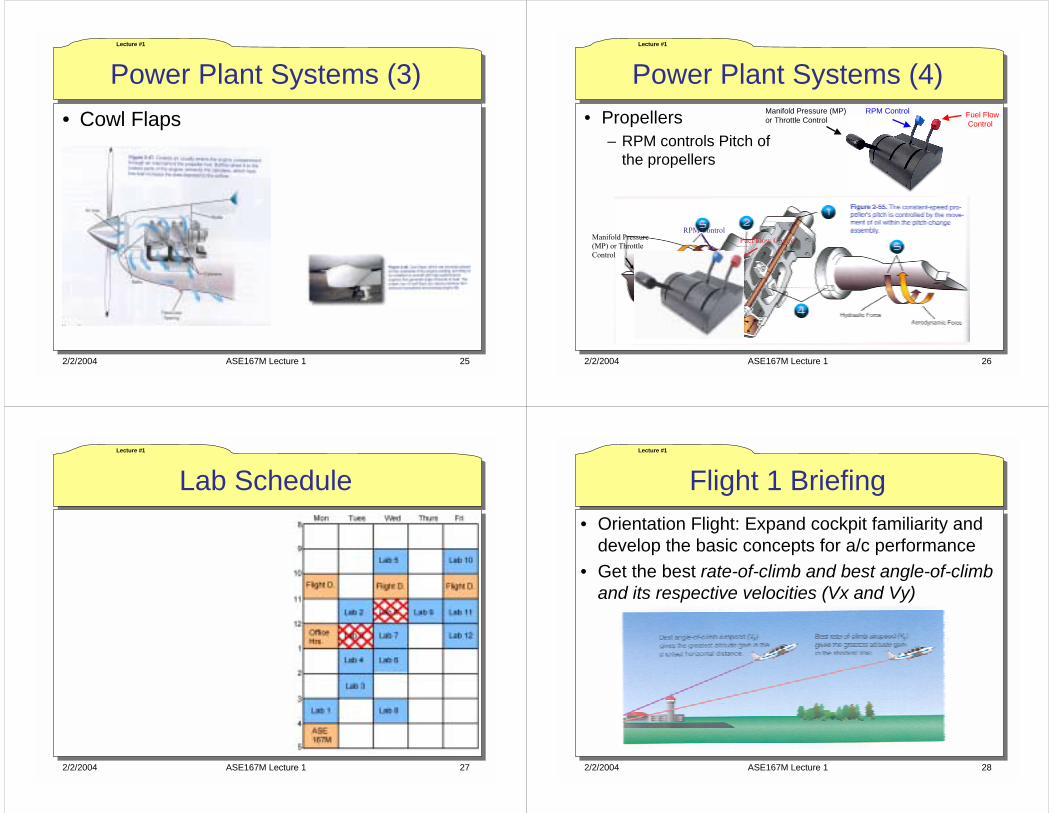
Flight 1 Briefing• Orientation Flight: Expand cockpit familiarity and
develop the basic concepts for a/c performance• Get the best rate-of-climb and best angle-of-climb
and its respective velocities (Vx and Vy)

2/2/2004 ASE167M Lecture 1 29
Lecture #1
Flight 1 Briefing (2)• In theory we would have to get those
performances at a constant altitude ⇒ wait untilflight #5
• We are going to climb and read R/C for severalaltitudes, velocities and power settings and wewill assume that they were read at H=const.
Read R/C at constant altitude
H=const
2/2/2004 ASE167M Lecture 1 30
Lecture #1
Equations of Motion in a VerticalPlane
• EOM:
( )
( )
0
0
cossin
cos sin
sin cos
x Vh V
gV T D WWg T L W
WVW CT
γγ
ε α γ
γ ε α γ
= = = + − − = + + − = −
&&
&
&
&
PITCH ANGLEO
V
xw – Relative Wind directionxb – x body directionxh – x local horizon direction
γ
α
xb
xw
xh
θ
x
h
E i
k
ANGLE OF ATTACK
FLIGHT PATH ANGLE
L
D
T
W
2/2/2004 ASE167M Lecture 1 31
Lecture #1
Flight 1 Briefing (2)• Record airspeed
and rate of climbdata for climbs anddescents.
• Go to specifiedairspeed, allow timefor VVI to stabilize(to ensure steadystate reading ofdata).
Event MP = Manifold Pressure (“ of Hg)
Rate of Climb (ft/mim)
Airspeed (knots)
Preflight Checklist; RPM = Max ; MP = Max 0 0
Takeoff (Rotate at 75 knots); Raise Landing Gear 0 75
Climb at 100 knots to 2000 ft MSL; Read R/C at 1800 ft; Set RPM = Max; MP = Max
100
Climb at 120 knots to 3000 ft. Read R/C at 2800 ft 120
Climb at 85 knots to 4000 ft. Read R/C at 3800 ft 85
Climb at 70 knots to 5000 ft. Read R/C at 4800 ft 70
Climb at 65 knots to 6000 ft. Read R/C at 5800 ft 65
Level off at 6000 ft. Set autopilot and Stabilize for 1 mim. Read Airspeed 0
Reduce RPM = 2300; MP = 21 “Hg. Read Airspeed after stabilized 0
Reduce RPM = 2000; MP = 20 “Hg. Read Airspeed after stabilized 0
Set RPM = 2400; MP = Max. Read Airspeed after stabilized. 0
Lower ½ flaps. Read Airspeed after stabilized 0
Lower Full flaps. Read Airspeed after stabilized. Raise ½ flaps and then retract all flaps.
0
Set RPM = 1800, MP = 17 “ Hg; adjust pitch for 120 knots descending. Descend to 4000 ft. Read R/C at 4200 ft.
120
Adjust pitch for 100 knots. Descend to 3000 ft. Read R/C at 3100 ft. 100
Adjust pitch for 90 knots. Record R/C, then Lower ½ flaps. 90
Set RPM = 1500; MP = 15 “Hg; Adjust pitch for 80 knots. Descend to 1000 ft MSL. Note R/C
80
Lower Full Flaps. Set RPM = Min., MP = Min. Descend at 80 knots. Read R/C
80
Lower Landing Gear. Continue Descent to landing 80
Accomplish shutdown checklist 0
2/2/2004 ASE167M Lecture 1 32
Lecture #1
Flight 1 Briefing (3)• Plot dh/dt vs. V for 5 points in the flight (Steps 3 to 7). Fit data to
– Use a least squares curve fit (available on most plottingpackages)
• Calculate and from parabolic constants andfrom graphical representation
2210/ VaVaahCR ++== &
maxmax hdtdh &= maxγ
h
x
h max
γ max
x
h
V
x
xb
γ
h

2/2/2004 ASE167M Lecture 1 33
Lecture #1
Flight 1 Briefing (4)• Calculate theoretical max dh/dt by solving:
• Calculate theoretical max γ by solving:
02 21 =+= VaahV
&∂∂
( ) 0sin
sin/
220 =+−=
=
∂∂
==
aVa
Vh
VV
VhCR&
&
∂∂γ
γ
2/2/2004 ASE167M Lecture 1 34
Lecture #1
Flight 1 Briefing (5)• Why does this provide max γ?
– In this a/c -900< γ <900 so thatmax γ = max sin(γ)
– Note that this also has a linear geometricalinterpretation.
( ) mVaaVa
Vh =++== 21
0sin&
γ
2/2/2004 ASE167M Lecture 1 35
Lecture #1
Flight 1 Briefing (7)• Report:
– Answer 4 questions in lab manual, put in eitherDiscussion or Test Results section.
– Plot h vs. x (use intuitive x, since ground distance isnot actually measured).
– Discuss the effects of flaps on the lift and dragcharacteristics of the a/c. What is the purpose offlaps?
And…– look at report requirements on the web and in lab
manual– include every section– Do not hesitate to ask questions …
2/2/2004 ASE167M Lecture 1 36
Lecture #1
Lab Administration• Reports
– Groups of 5– Individual Work and Lab Reports– Due in two weeks
• Look at the website for procedures• Look at the website for Schedule (When
should I fly?)– Fly after a briefing class

2/2/2004 ASE167M Lecture 1 37
Lecture #1
Next Week:The Atmosphere
Computer Project 1
This Week:Flight 1 – Orientation Flight
Report Due: 02/16