today’s webinar will begin momentarily… · this presentation is based solely on an analysis...
TRANSCRIPT

Today’s webinar will begin momentarily…
• Make sure your computer speakers are on and
adjusted to the volume of your choice.
• Close additional browser windows and online
applications.
• If you experience technical difficulties, please
close your browser and log back in.
Here are a few tips to improve your viewing experience

Kimberly KisselDirector of [email protected]
Ask the speakers questions throughout this webinar using the Q&A function -- in your GoToWebinar Control Panel, type in any questions you have for the speaker in the Questions box under the Questions tab.

Thomas BaldwinProduct Manager,
Management Science Associates, Inc.
Mike FarrahClient Relationship Director, Management Science Associates, Inc.
3

Marketplace Trends During COVID-19 – Part 2
Warehouse-delivered Products
May 28, 2020
NOTICE:
This presentation is based solely on an analysis conducted by Management Science Associates, Inc. (MSAi) and does not necessarily reflect the opinion of any client.
Unless stated otherwise, NACS category definitions are used in thefollowing presentation.
Data source: InfoMetrics and C-Metrics® Projected Data for warehouse delivered products
5

Agenda
• Marketplace Behavior
• C-Store Performance
• Top Categories
• Sub Category Performance
• Regional Performance
• Summary

Marketplace Behavior
All states re-opening at varying degrees
Some stores limiting the number of customers entering
Stores selling new items
Online grocery/delivery services
Store cleanliness/Employee Safety

C-Store Performance - Dollars
Average weekly dollars for 65 weeks ending 2/29/20 are $177.7M.
Category3 weeks ending
3/21/203/28/20 4/4/20
Total C-Store Up 2% Up 7% Down 14%
Category3 weeks ending
3/21/20
Week ending
3/28/204/4/20 4/11/20 4/18/20 4/25/20 5/2/20 5/9/20 5/16/20
Total C-Store
Up 5.5% Up 1.9%Down 11.4%
Down 8.2%
Down 1.9%
Up .1% Up 5.8% Up 8.6% Up 6.7%

C-Store Performance - Units
Average weekly units for 65 weeks ending 2/29/20 are 59.7M units.
Category3 weeks ending
3/21/20
Week ending
3/28/20
Week ending4/4/20
4/11/20 4/18/20 4/25/20 5/2/20 5/9/20 5/16/20
Total C-Store
Up 2%Down 14.7%
Down 22.9%
Down24%
Down 19.4%
Down 15.3%
Down11%
Down5.4%
Down 6.5%
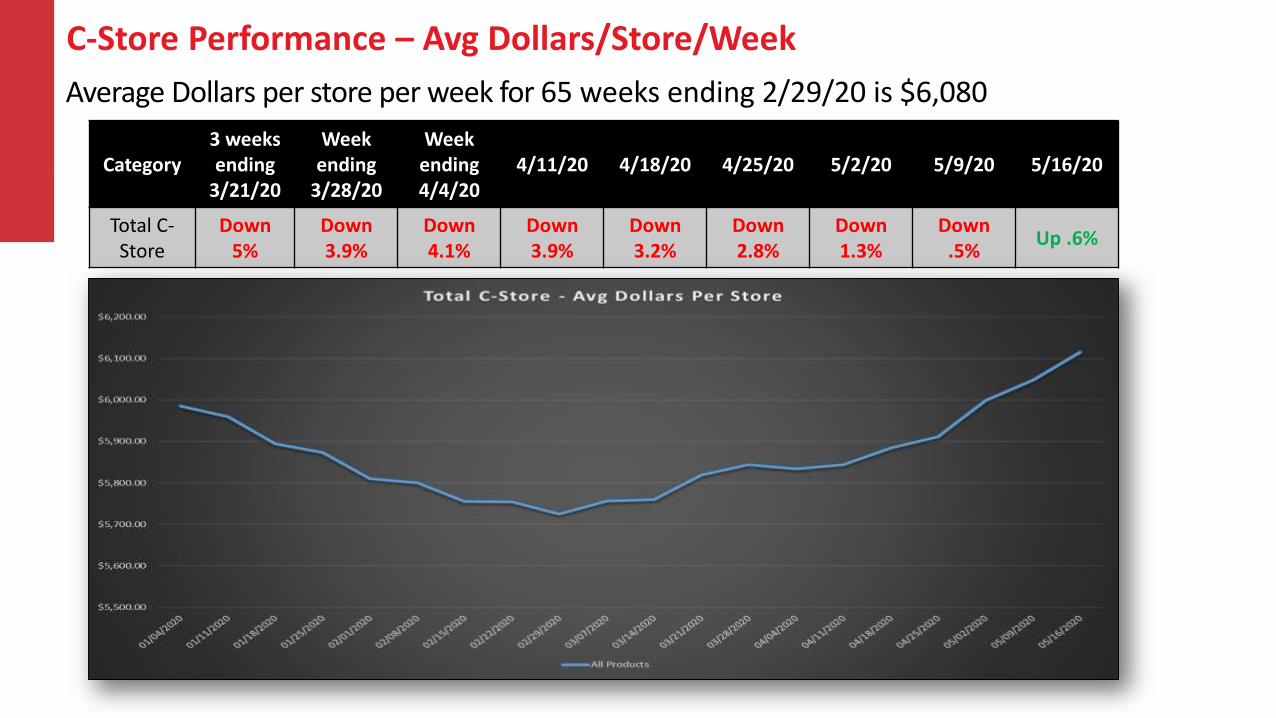
C-Store Performance – Avg Dollars/Store/Week
Average Dollars per store per week for 65 weeks ending 2/29/20 is $6,080
Category3 weeks ending
3/21/20
Week ending
3/28/20
Week ending4/4/20
4/11/20 4/18/20 4/25/20 5/2/20 5/9/20 5/16/20
Total C-Store
Down 5%
Down 3.9%
Down 4.1%
Down3.9%
Down 3.2%
Down 2.8%
Down1.3%
Down.5%
Up .6%

Chain versus Independent – Dollar Performance
Type3 weeks ending
3/21/20
Week ending3/28/20
Week ending4/4/20
4/11/20 4/18/20 4/25/20 5/2/20 5/9/20 5/16/20
CHAIN Up 6.7% Up 4%Down 9.7%
Down7.4%
Down 3.6%
Down 1.1%
Up 4.2 Up 7.1% Up 5.7%
INDEPENDENTS Up 4.8% Up 0.8%Down 12.3%
Down 8.6%
Down 1.1%
Up .7% Up 6.6% Up 9.4% Up 7.2%

Category Performance – Dollars

Category Performance – Units

Category Performance – Cigarettes & OTP - Dollars
Category3 weeks ending
3/21/20
Week ending
3/28/20
Week ending4/4/20
4/11/20 4/18/20 4/25/20 5/2/20 5/9/20 5/16/20
Cigarettes Up 6% Up 4% Down 10% Down 6% Even Even Up 6% Up 8% Up 7%
OTP Up 6% Up 11% Down 5% Down 1% Up 7% Up 14% Up 17% Up 16% Up 13%
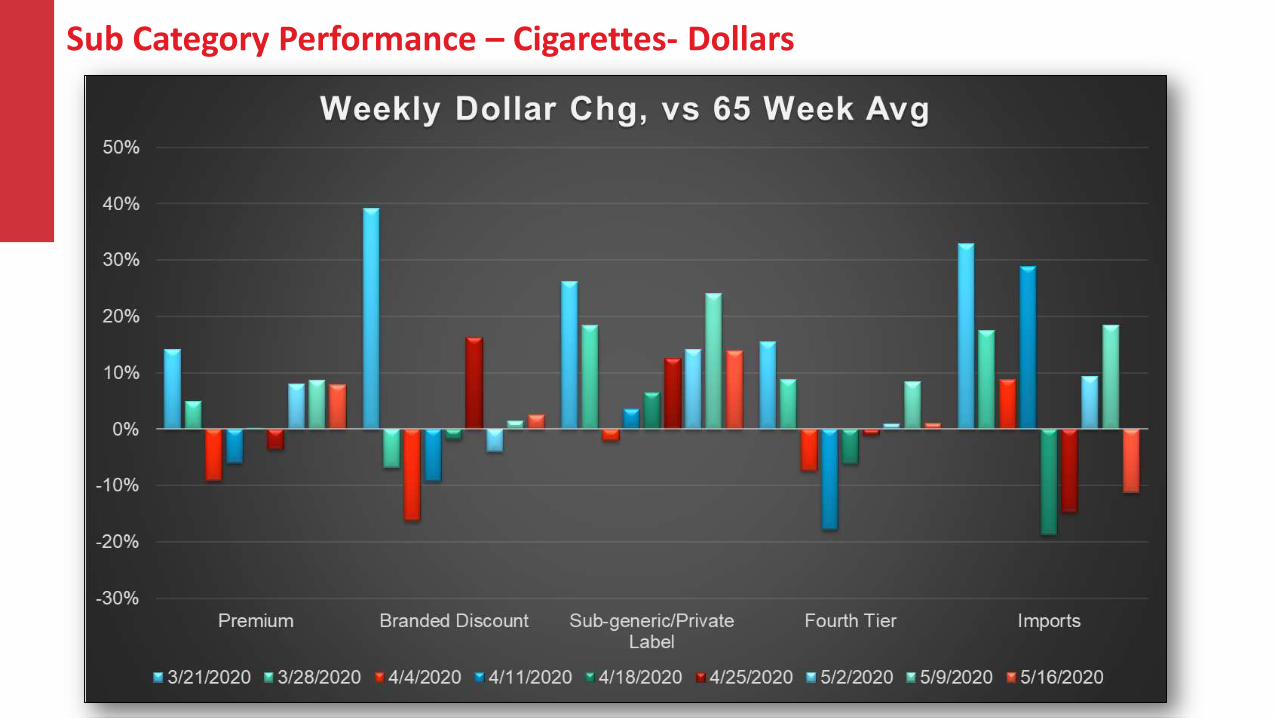
Sub Category Performance – Cigarettes- Dollars

Sub Category Performance – Other Tobacco Products - Dollars

Category Performance – Cigarettes & OTP - Units
Category3 weeks ending
3/21/20
Week ending
3/28/20
Week ending4/4/20
4/11/20 4/18/20 4/25/20 5/2/20 5/9/20 5/16/20
Cigarettes Up 3% Up 3% Down 11% Down 9% Down 2% Down 2% Up 4% Up 6% Up 5%
OTP Up 8% Up 9% Up 2% Up 1% Up 15% Up 20% Up 22% Up 16% Up 16%

Sub Category Performance – OTP - Units

Sub Category Performance – Other OTP - Units

Category Performance – CBD - Dollars
Category3 weeks ending
3/21/20
Week ending
3/28/20
Week ending4/4/20
4/11/20 4/18/20 4/25/20 5/2/20 5/9/20 5/16/20
CBD Up 25.7%Down 45.2%
Down 38.7%
Down 23% Down 34% Down 17% Down 51% Up 96% Down 34.2

Category Performance – Non-Tobacco Top Categories - Dollars
Category3 weeks ending
3/21/20
Week ending3/28/20
Week ending4/4/20
4/11/20 4/18/20 4/25/20 5/2/20 5/9/20 5/16/20
Candy Up 6.3% Down 14.7% Down 17.6% Down-13% Down 11% Down 6% Down 1% Up 9% Up 5%
Foodservice Down 0.7% Down 27% Down 35.2% Down 33% Down 31% Down 24% Down 19% Down 13% Down 12.4%
Salty Snacks Up 0.9% Down 23.9% Down 33.2% Down 34% Down 27% Down 17% Down 11% Down 3% Down 3.6%
Pkg Sweet Snacks
Up 5.4% Down 12.2% Down 15.7% Down 15% Down 11% EVEN Down 1% Up 6% Up 3.9%
Alternative Snacks
Up 1.9% Down 24% Down 34.6% Down 33% Down 28% Down 14% Down 9% Down 3% Down 1.9%

Category Performance – Non-Tobacco Top Categories - Units
Category3 weeks ending
3/21/20
Week ending 3/28/20
Week ending4/4/20
4/11/20 4/18/20 4/25/20 5/2/20 5/9/20 5/16/20
Candy Down 0.3% Down 18.9% Down 21.6% Down 20% Down 17% Down 14% Down 8% Up 1% Down -2.1%
Foodservice Up 0.6% Down 28.8% Down 36.5% Down 36% Down 32% Down 27% Down 25% Down 19% Down -20.3%
Salty Snacks Down 0.6% Down 26.2% Down 36.3% Down 38% Down 31% Down 22% Down 16% Down 8% Down -9.2%
Pkg Sweet Snacks
Up 3.4% Down 15.8% Down 20% Down 23% Down 21% Down 17% Down 11% Up 5% Down .9%
Alternative Snacks
Down 0.9% Down 27.2% Down 35.4% Down 35% Down 30% Down 18% Down 14% Down 9% Down 8.9%

Sub Category Performance – Candy - Dollars

Sub Category Performance – Salty Snacks - Dollars
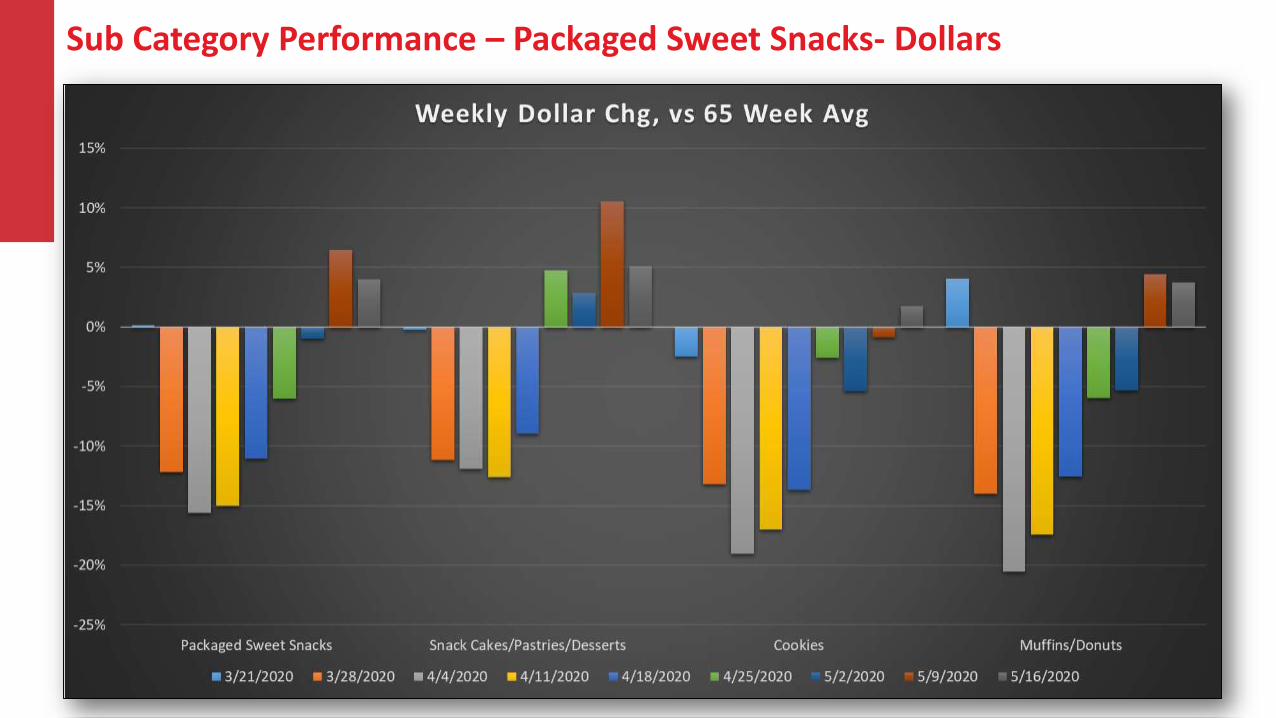
Sub Category Performance – Packaged Sweet Snacks- Dollars

Sub Category Performance – Alternative Snacks- Dollars
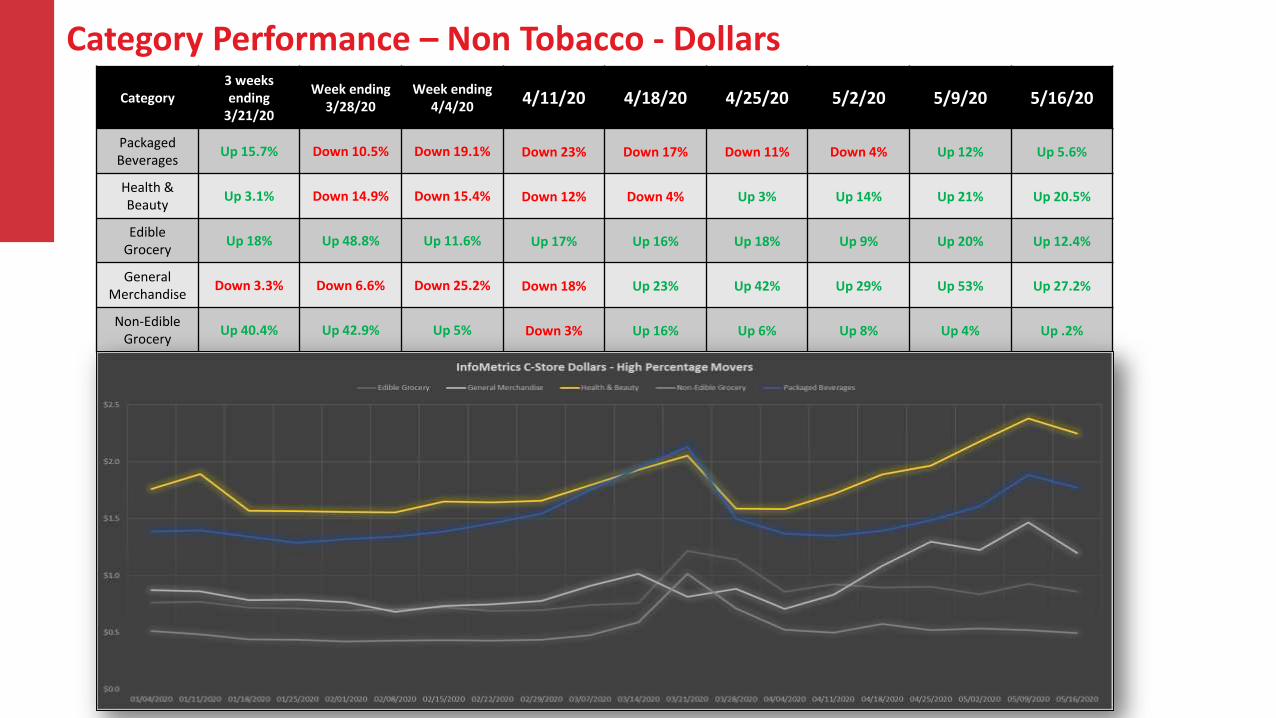
Category Performance – Non Tobacco - Dollars
Category3 weeks ending
3/21/20
Week ending3/28/20
Week ending4/4/20
4/11/20 4/18/20 4/25/20 5/2/20 5/9/20 5/16/20
Packaged Beverages
Up 15.7% Down 10.5% Down 19.1% Down 23% Down 17% Down 11% Down 4% Up 12% Up 5.6%
Health & Beauty
Up 3.1% Down 14.9% Down 15.4% Down 12% Down 4% Up 3% Up 14% Up 21% Up 20.5%
Edible Grocery
Up 18% Up 48.8% Up 11.6% Up 17% Up 16% Up 18% Up 9% Up 20% Up 12.4%
General Merchandise
Down 3.3% Down 6.6% Down 25.2% Down 18% Up 23% Up 42% Up 29% Up 53% Up 27.2%
Non-Edible Grocery
Up 40.4% Up 42.9% Up 5% Down 3% Up 16% Up 6% Up 8% Up 4% Up .2%
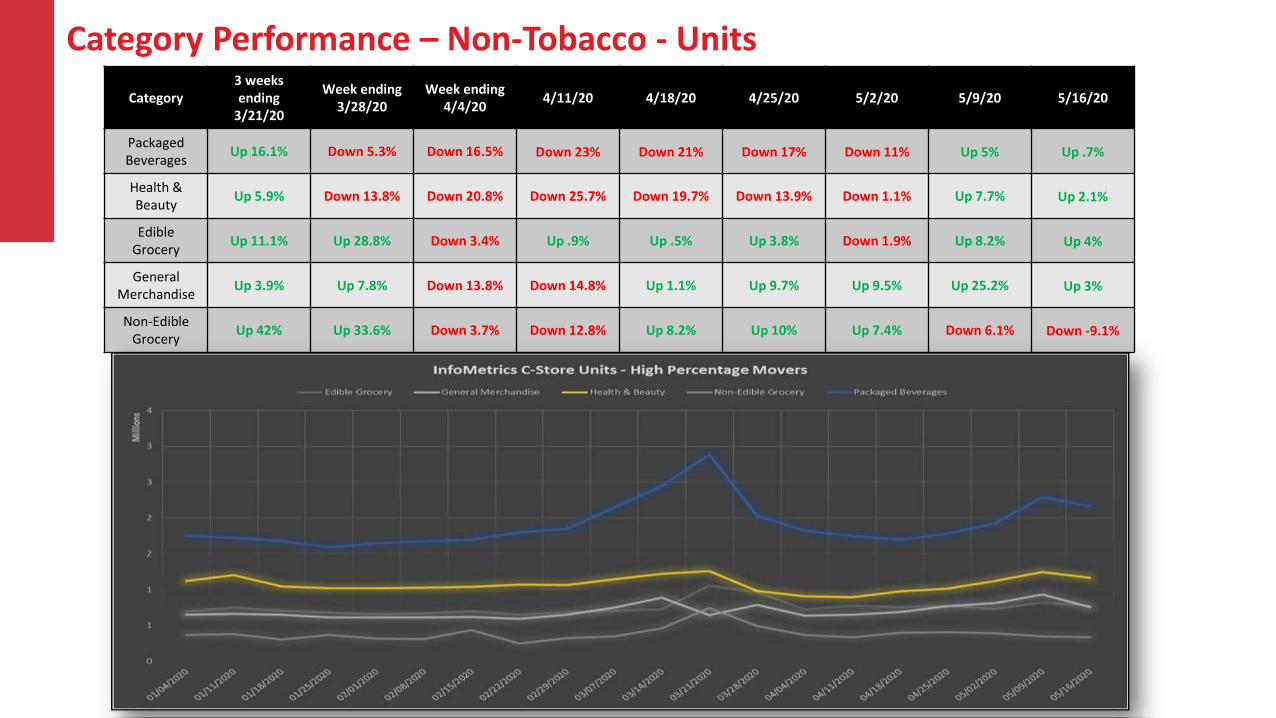
Category Performance – Non-Tobacco - Units
Category3 weeks ending
3/21/20
Week ending3/28/20
Week ending4/4/20
4/11/20 4/18/20 4/25/20 5/2/20 5/9/20 5/16/20
Packaged Beverages
Up 16.1% Down 5.3% Down 16.5% Down 23% Down 21% Down 17% Down 11% Up 5% Up .7%
Health & Beauty
Up 5.9% Down 13.8% Down 20.8% Down 25.7% Down 19.7% Down 13.9% Down 1.1% Up 7.7% Up 2.1%
Edible Grocery
Up 11.1% Up 28.8% Down 3.4% Up .9% Up .5% Up 3.8% Down 1.9% Up 8.2% Up 4%
General Merchandise
Up 3.9% Up 7.8% Down 13.8% Down 14.8% Up 1.1% Up 9.7% Up 9.5% Up 25.2% Up 3%
Non-Edible Grocery
Up 42% Up 33.6% Down 3.7% Down 12.8% Up 8.2% Up 10% Up 7.4% Down 6.1% Down -9.1%

Sub Category Performance – Non Edible Grocery

Regional Performance

Regional Performance - Cigarettes
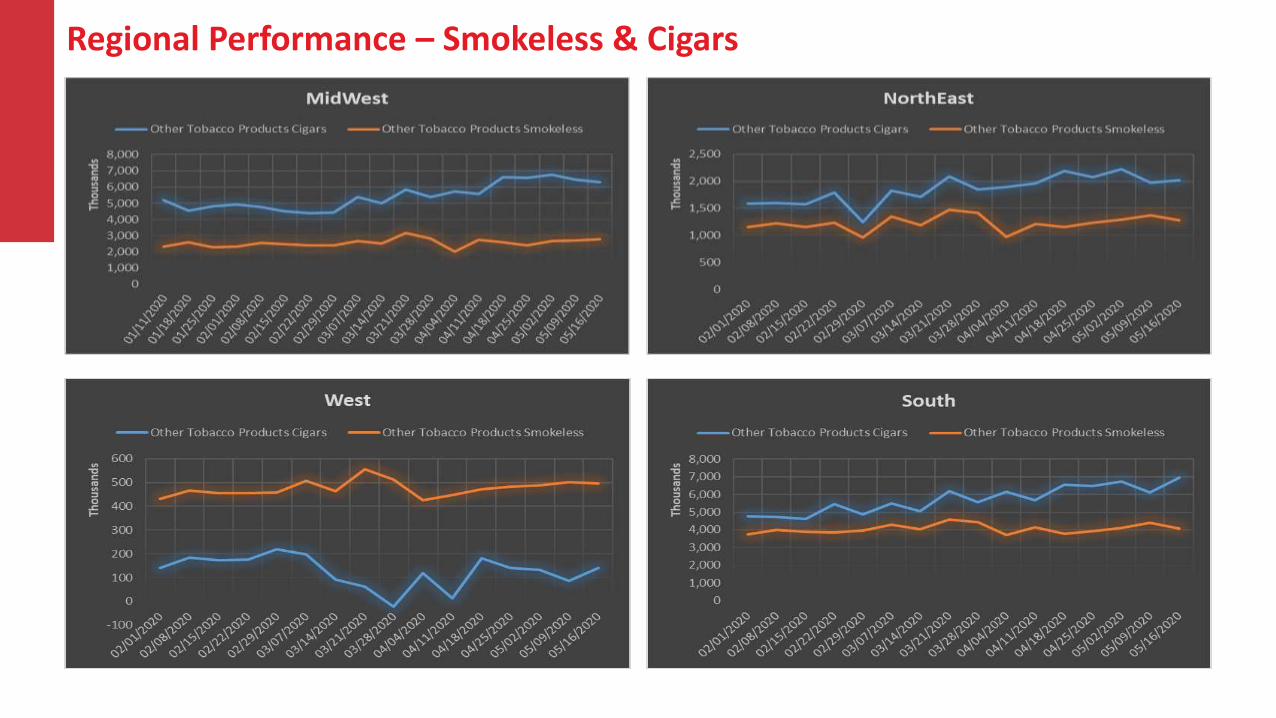
Regional Performance – Smokeless & Cigars

Regional Performance - Candy

Regional Performance - Vaping

Regional Performance – Health & Beauty

Regional Performance – Non-Edible Grocery

Summary
The Come Back - Total C-Store distribution – Units are DOWN, Dollars are UP
Cigarette & OTP distribution performing well above the 65-week average.
Alternative Snacks has some improvement to make and is trending upward.
Keep an eye on Skin Care/External Care

Thank You&
Stay Safe and Healthy!
Mike FarrahClient Relationship [email protected] 412-924-3813
Thomas BaldwinProduct Manager, [email protected]