today: some things mendel did not tell us… plus mapping and epigenetics –exam #3 w 7/30 in class...
TRANSCRIPT

Today: some things Mendel did not tell us… Today: some things Mendel did not tell us… plus Mapping and Epigeneticsplus Mapping and Epigenetics
––Exam #3 W 7/30 in class (bonus #2 due)–Exam #3 W 7/30 in class (bonus #2 due)–

Single genes controlling a single trait are unusual. Inheritance of most genes/traits is much more complex…
Dom. Rec. Rec. Dom.

PhenotypeGenotype
Genes code for proteins (or RNA). These gene products give rise to traits…
It is rarely this simple.

Fig 4.4

Fig4.7
Sickle-cell anemia is caused by a point mutation

Sickle and normal red blood cells Fig4.7

Mom = HS Dad = HS
H or S
H or S
HH
HS SS
HS possible offspring75% Normal25% Sickle-cell
Mom
Dad
S=sickle-cell
H=normal
Sickle-Cell Anemia:A dominant or recessive allele?
Fig4.7
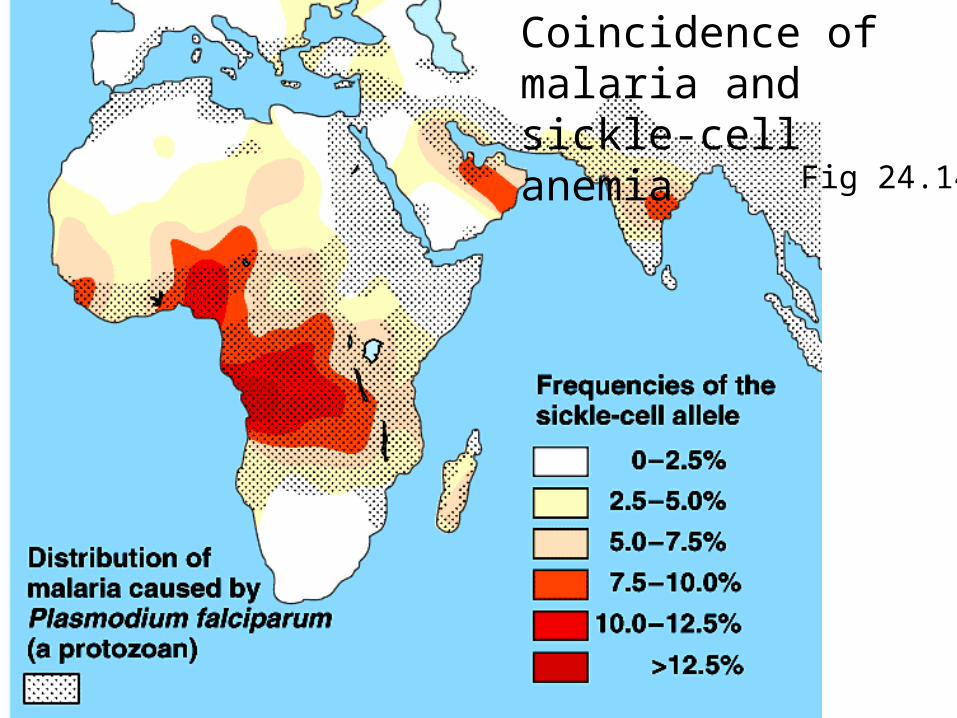
Coincidence of malaria and sickle-cell anemia
Fig 24.14

Mom = HS Dad = HS
H or S
H or S
HH
HS SS
HS
possible offspringOxygen transport:75% Normal25% Sickle-cell
Malaria resistance:75% resistant25% susceptible
Mom
Dad
Sickle-Cell Anemia:A dominant or recessive allele?
S=sickle-cell
H=normal
Fig4.7

The relationship between genes and traits is often complex
Complexities include:
• Complex relationships between alleles

Sex determination is normally inherited by whole chromosomes or by number of chromosomes.
Fig 3.18

X/Y chromosomes in humans

The X chromosome has many genes; the Y chromosome only has genes for maleness.

Human sex chromosomes
(includes Mic2 gene)
Fig 4.14

Sex-linked traits are genes located on the X chromosome

Color Blind Test

Sex-linked traits: Genes on the X chromosome
No one affected, female carriers
A= normal; a= colorblind
colorblindnormal
similar to Fig 4.13

Sex-linked traits: Genes on the X chromosome
50% of males affected, 0 % females affected
A= normal; a= colorblind
normalnormal
similar to Fig 4.13
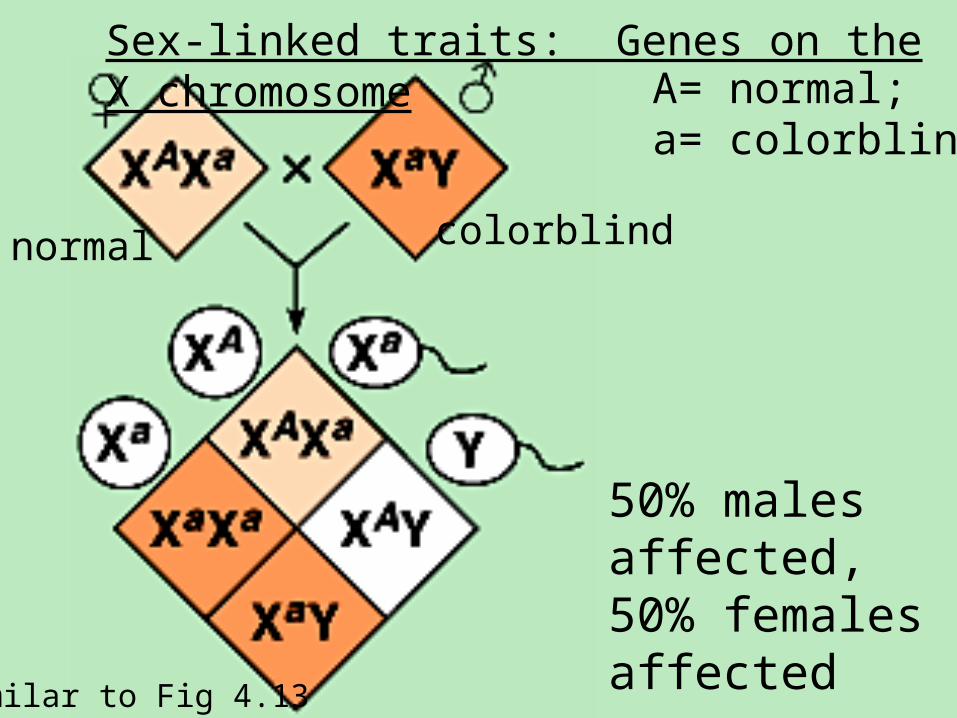
Sex-linked traits: Genes on the X chromosome
50% males affected, 50% females affected
A= normal; a= colorblind
colorblindnormal
similar to Fig 4.13

Sex-linked traits: Genes on the X chromosome
No one affected, female carriers
50% of males affected, 0 % female affected
50% males affected, 50% females affected
A= normal ; a= colorblind
similar to Fig 4.13

males and females may have different numbers of chromosomes
Fig 3.18
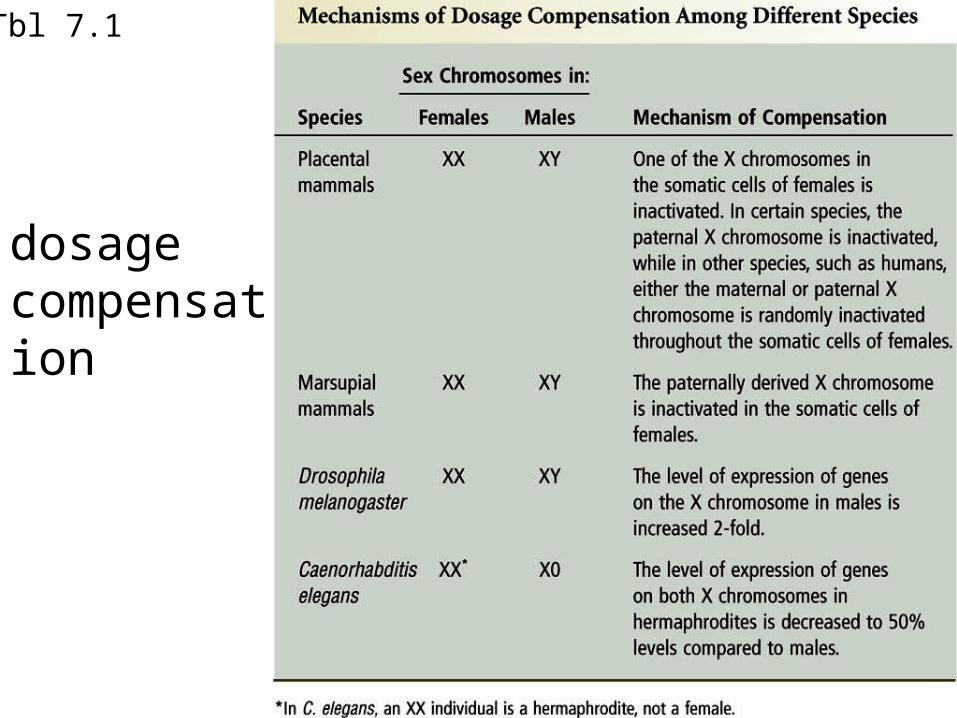
Tbl 7.1
dosage compensation

At an early stage of embryonic development
The epithelial cells derived from this
embryonic cell will produce a patch of
white fur
While those from this will produce a patch of black fur
Fig 7.4

Promotes compaction
Prevents compaction
Mammalian X-inactivation involves the interaction of 2 overlapping genes.

The Barr body is replicated and both
copies remain compacted
Barr body compaction is heritable within an individual

• A few genes on the inactivated X chromosome are expressed in the somatic cells of adult female mammals– Pseudoautosomal genes
(Dosage compensation in this case is unnecessary because these genes are located both on the X and Y)
– Up to a 25% of X genes in humans may escape full inactivation
• The mechanism is not understood

Epigenetics: http://www.pbs.org/wgbh/nova/sciencenow/3411/02.html
Lamarck was right? Sort of…
Image from: http://www.sparknotes.com/biology/evolution/lamarck/section2.rhtml

Genomic Imprinting
• Genomic imprinting is a phenomenon in which expression of a gene depends on whether it is inherited from the male or the female parent
• Imprinted genes follow a non-Mendelian pattern of inheritance
– Depending on how the genes are “marked”, the offspring expresses either the maternally-inherited or the paternally-inherited allele **Not both

Genomic Imprinting:Methylation of genes during gamete production.

A hypothetical example of imprinting
A=curly hair
a=straight hair
B=beady eyes
b=normal
*=methylation
A* in males
B* in females
aB*
aB* A*
bA*b

A hypothetical example of imprinting
A=curly hair
a=straight hair
B=beady eyes
b=normal
*=methylation
A* in males
B* in females
A*abB*
A*abB*
aB*
aB* A*
bA*b

A hypothetical example of imprinting
A=curly hair
a=straight hair
B=beady eyes
b=normal
*=methylation
A* in males
B* in females
A*abB*
A*abB*
A*abB
AabB*
aB*
aB* A*
bA*b

A hypothetical example of imprinting
A=curly hair
a=straight hair
B=beady eyes
b=normal
*=methylation
A* in males
B* in females
A*abB*
A*abB*
A*abB
AabB*
A*b, A*B,ab, aB
Ab, AB*,ab, aB*
aB*
aB* A*
bA*b
similar to Fig 7.10

Thus genomic imprinting is permanent in the somatic cells of an animal
– However, the marking of alleles can be altered from generation to generation

• Genomic imprinting must involve a marking process
• At the molecular level, the imprinting is known to involve differentially methylated regions– They are methylated either in the oocyte or
sperm• Not both
Imprinting and DNA Methylation

• For most genes, methylation results in inhibition of gene expression
–However, this is not always the case

Haploid female gametes transmit an unmethylated gene Haploid male gametes transmit
a methylated gene
Fig 7.11Changes in methylation during gamete development alter the imprint

To date, imprinting has been identified in dozens of mammalian genes
Tbl 7.2

Tbl 7.2

Imprinting plays a role in the inheritance of some human diseases: Prader-Willi syndrome (PWS) and Angelman syndrome (AS)
–PWS is characterized by: reduced motor function, obesity, mental deficiencies
–AS is characterized by: hyperactivity, unusual seizures, repetitive muscle movements, mental deficiencies
Usually, PWS and AS involve a small deletion in chromosome 15
–If it is inherited from the mother, it leads to AS–If it is inherited from the father, it leads to PWS

• AS results from the lack of expression of UBE3A (encodes a protein called EA-6P that transfers small ubiquitin molecules to certain proteins to target their degradation)
– The gene is paternally imprinted (silenced)
• PWS results (most likely) from the lack of expression of SNRNP (encodes a small nuclear ribonucleoprotein that controls gene splicing necessary for the synthesis of critical proteins in the brain)
– The gene is maternally imprinted (silenced)

Fig 7.12The deletion is the same in males and females, but the expression is different depending on who you received the normal version from.

The relationship between genes and traits is often complex
Complexities include:
• Multiple genes controlling one trait

Two genes control coat color in mice
Fig 4.21

The interaction of these two proteins explains their affect on a single trait (in fruit flies).

Variation in Peas
Fig 3.2

Fig 2.8
Inheritance of 2 independent genes

Y y
r R
Gene for seed color
Gene for seed shape
Approximate position of seed color and shape genes in peas
Chrom. 1/7 Chrom. 7/7

There must be a better way…Fig 2.9

Inheritance can be predicted by probability
Section 2.2, pg 30-32

Sum rule
• The probability that one of two or more mutually exclusive events will occur is the sum of their respective probabilities
• Consider the following example in mice
• Gene affecting the ears– De = Normal allele– de = Droopy ears
• Gene affecting the tail– Ct = Normal allele– ct = Crinkly tail

• If two heterozygous (Dede Ctct) mice are crossed• Then the predicted ratio of offspring is
– 9 with normal ears and normal tails– 3 with normal ears and crinkly tails– 3 with droopy ears and normal tails– 1 with droopy ears and crinkly tail
• These four phenotypes are mutually exclusive– A mouse with droopy ears and a normal tail cannot have normal ears and a crinkly tail
• Question– What is the probability that an offspring of the above cross will have normal ears and a normal tail or
have droopy ears and a crinkly tail?

• Applying the sum rule– Step 1: Calculate the individual probabilities
9 (9 + 3 + 3 + 1) = 9/16 P(normal ears and a normal tail) =
1 (9 + 3 + 3 + 1) = 1/16 P(droopy ears and crinkly tail) =
– Step 2: Add the individual probabilities
9/16 + 1/16 = 10/16
• 10/16 can be converted to 0.625– Therefore 62.5% of the offspring are predicted to have normal ears
and a normal tail or droopy ears and a crinkly tail

Product rule
• The probability that two or more independent events will occur is equal to the product of their respective probabilities
• Note– Independent events are those in which the
occurrence of one does not affect the probability of another

• Consider the disease congenital analgesia – Recessive trait in humans– Affected individuals can distinguish between sensations
• However, extreme sensations are not perceived as painful
– Two alleles• P = Normal allele
• p = Congenital analgesia
• Question– Two heterozygous individuals plan to start a family– What is the probability that the couple’s first three children will all have
congenital analgesia?

• Applying the product rule– Step 1: Calculate the individual probabilities
• This can be obtained via a Punnett square
1/4 P(congenital analgesia) =
– Step 2: Multiply the individual probabilities
1/4 X 1/4 X 1/4 = 1/64
• 1/64 can be converted to 0.016– Therefore 1.6% of the time, the first three offspring of a
heterozygous couple, will all have congenital analgesia

Crossing-Crossing-overover
Meiosis I
Meiosis II
4 Haploid cells, each unique
(Ind. Assort.)(Ind. Assort.)
Different genes are not always independent

The haploid cells contain the same combination of
alleles as the original chromosomes
The arrangement of linked alleles has not been altered
Fig 5.1

These haploid cells contain a combination of alleles NOT
found in the original chromosomes
These are termed parental or non-recombinant cells
This new combination of alleles is a result of
genetic recombination
These are termed recombinant cells
Fig 5.1

Linked alleles tend to be inherited together

Crossing over produces new allelic combinations

Recombinants are produced by crossing over

For linked genes, recombinant frequencies are less than 50 percent

Homologouspair of chromosomes

Does this pedigree show recombination or linkage?

Does this pedigree show recombination or linkage?

Longer regions have more crossovers and thus higher recombinant frequencies

Some crosses do not give the expected results

=25%
8%9%41%42%

These two genes are on the same chromosome


By comparing recombination frequencies, a linkage map can be constructed
= 17 m.u.

Linkage map of Drosophila chromosome 2:This type of map, with mapping units more than 50, can only be put together by making comparisons of linked genes.

Today: some things Mendel did not tell us… Today: some things Mendel did not tell us… plus Mapping and Epigeneticsplus Mapping and Epigenetics
––Exam #3 W 7/30 in class (bonus #2 due)–Exam #3 W 7/30 in class (bonus #2 due)–
Lecture ended here, but I am leaving in the following material so you can get a preview of the mapping problem we will work on to start class on M 7/28.

A much greater proportion of the two types found in the parental generation
Fig 5.2

The probability of crossing over can be used to determine the spatial relationship of different genes

Double recombinants arise from two crossovers
Recombinant

Double recombinants can show gene order

similar to Fig 5.3,also see Fig 5.9,and pg 115-117
What is the relationship between these 3 genes? What order and how far apart?

similar to Fig 5.3
What is the relationship between these 3 genes?What order and how far apart?
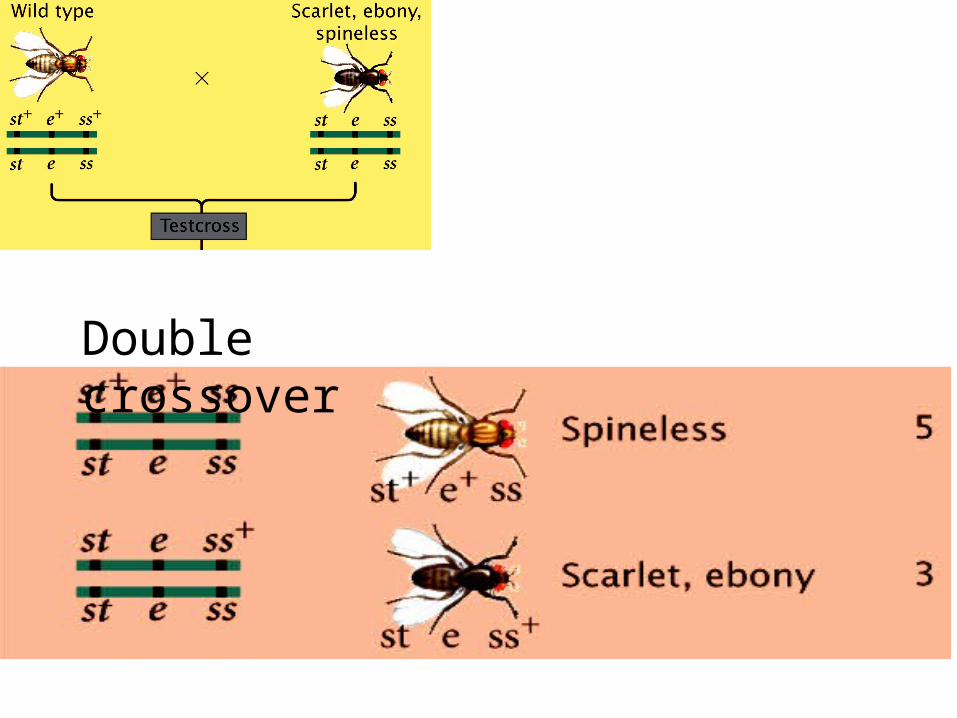
Double crossover

Which order produces the double crossover?

Which order produces the double crossover?

We have the order.What is the distance?

Recombinants between st and ss:
(50+52+5+3)/755=14.6%

Recombinants between ss and e:
(43+41+5+3)/755=12.2%

st ss e
14.6 m.u.
26.8 m.u.
12.2 m.u.
Put it all together…

Drosophila linkage map

Linkage map of Drosophila chromosome 2

Yeast chromosome 3
physical distance linkage
map
Recombination is not completely random.

Alignment of physical and recombination maps

PhenotypeGenotype
Genes code for proteins (or RNA). These gene products give rise to traits…
It is rarely this simple.
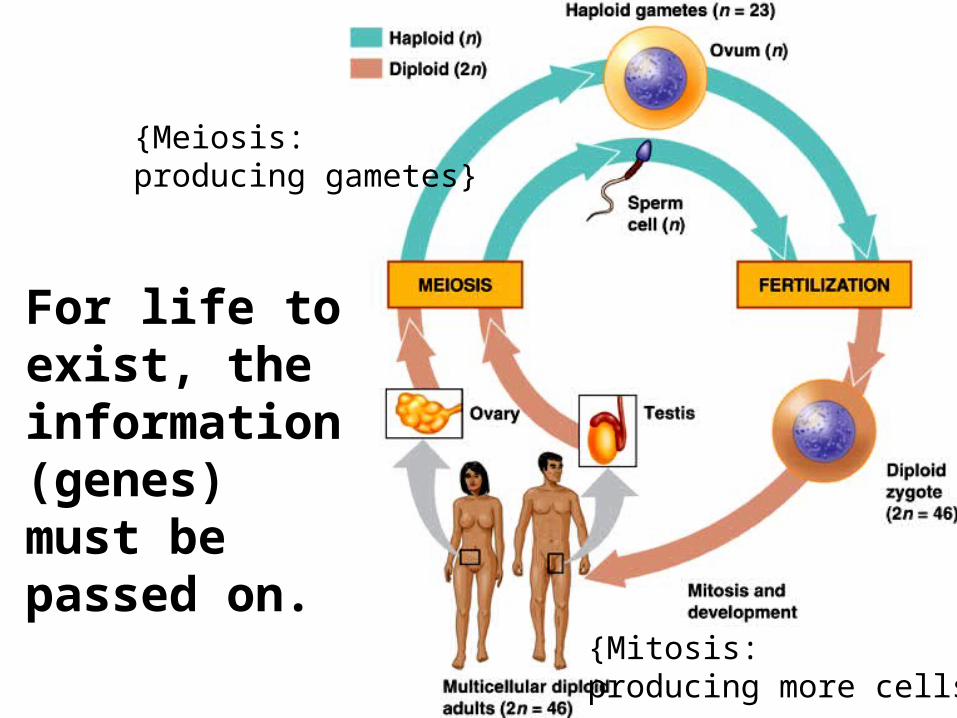
For life to exist, the information (genes) must be passed on.
{Mitosis:producing more cells}
{Meiosis:producing gametes}