tobii technology tobii studio tm 3 · eye gaze data recording eye gaze data is a main feature of...
TRANSCRIPT

Tobii StudioTM 3.X
Product Description
www.tobii.com
Tobii® Technology
Software Release 3.2.1

2
Product Description

Introduction 4Test design 5Recording 7Replay 10Visualization 12Statistics 16Data export 17Tobii Glasses tools 18
Appendix I: Feature chart 19Appendix II: System configuration 22
••••••••
••
Product Description for Tobii StudioTM
This document contains information proprietary to Tobii Technology AB. The contents
are confidential and any disclosure to persons other than officers, employees, agents, or
subcontractors of the owner or licensee of this document, without the prior written consent of
Tobii Technology AB, is strictly prohibited. No part of this publication may be reproduced, stored in
a retrieval system, or transmitted in any form or by any means, electronic or mechanical, including
photocopying and recording, without the prior consent of the copyright holder.
Document revision - December 2012
Tobii Technology AB reserves the right to change the content of this manual without any prior notice.
Changes due to typographical errors, inaccuracies or modifications in programs and/or equipment
might be implemented at any time. Please check the Tobii website www.tobii.com for updated
versions of this document.
All rights reserved.
© Tobii Technology AB
Table of Contents
Tobii® Technology
Tobii StudioTM 3.X
Software Release 3.2
Tobii StudioTM 3.X
3
Product Description
IntroductionOverview
Tobii Studio™ offers a comprehensive platform for recording and analysis of eye gaze data, facilitating interpretation of human behavior, consumer responses, and physiology.
Combining easy preparation of test procedures and advanced tools for visualization and analysis, eye tracking data is easily processed for useful comparison, interpretation, and presentation.
A broad range of studies is supported, ranging from usability testing and market research to psychology and ocular-motor physiological experiments. The intuitive workflow and the advanced analysis tools allow for both small and large studies to be carried out in a timely and cost-efficient way without the need for extensive training.
Tobii Studio™ supports a large variety of stimuli and allows both multiple and different stimuli types to be combined in one single recording. A holistic view of behavior is achieved by integrating recording of eye tracking data with user video, sound, keystrokes, mouse clicks, questionnaires, RTA recordings, and other data sources in a single solution.
Tobii Studio is only compatible with Tobii Eye Trackers.
Version Information
This document describes the features and functionality of Tobii Studio™ release 3.X.
The Tobii Studio™ software is continuously being developed and refined. Please visit www.tobii.com for the most recent specifications.
Related Information
Other related documents such as system requirements and product descriptions for other Tobii products can be found in the Library section on the Tobii website (www.tobii.com)
Licence information
Tobii offers single-user and multi-user licenses of Tobii StudioTM. A single-user license includes a key for each copy purchased. A multi-user license includes one key with permissions to install the software on multiple workstations.
For each user licence purchased you may install and use one copy of the software on a single computer at a time (and only by one user at a time). It is only possible to use a single-user licence on one computer and by one single user at any time. To use the same licence key on several computers or by several users, the licence must be deactivated and reactivated between each switch between computer or user.
Tobii Studio™ comes in three editions: Basic, Professional, and Enterprise. For each edition, a non-recording licence type is also available. The non-recording licence has the limitation that it cannot be used to do eye tracking recordings or importing Tobii Glasses recordings, but can be used for designing and analyzing eye tracking recordings. For an overview of the features of each edition, please refer to Appendix I: Feature Chart..
Related Information
Other related documents such as system requirements and product descriptions for other Tobii products can be found in the Library section on the Tobii website (www.tobii.com)
4
Product Description

Test design
Projects
All tests, test participants, recordings, and analyses of a study are saved in a project. A single project may include several types of tests. Already existing projects may be exported to a file that can be imported on any computer running a compatible Tobii Studio installation. When exporting/importing, you can choose the parts of the project that are to be included.
The data for each Tobii Studio project is saved in separate folders and organized by individual databases in order to assure time efficient as well as secure data handling. To backup the data, a copy of the project folder can be made and saved in a secure location.
Participants
If many participants are to be included in your study, the auto-generation tool enables quick creation of the partici-pants. With auto-generation, you simply enter the desired number of participants and all participants will be created simultaneously.
Independent variables such as “Age” and “Gender” may be defined and associated with the participants. This is useful during later analysis in order to be able to classify your test results according to specific parameters. Independent variables can also be created using the answers to questionnaires (stimulus element). Any variables valuable to your study can be defined, entered and edited before, during or after a study is completed.
The eye gaze calibration performed before recording is saved together with the other defined user settings for each participant and can be reused in multiple recordings.
Stimuli
Tobii Studio supports a wide range of stimuli to be presented to the participants. While the test regulates the order in which the stimuli is presented, each stimuli element controls how long a stimuli is to be shown and how to proceed from one stimuli element to the next on the test timeline. The visibility duration of a stimuli can either be set to a fixed time or tied to a user initiated event such as a key press or mouse click.
Stimuli can be added to the test timeline by simply dragging and dropping the desired stimuli media element into the test workspace. For each selected stimulus a variety of settings can be chosen and then previewed prior to running the test. The entire test can also be previewed.
Tests
A test contains a timeline, which regulates in what order stimuli is presented. It is possible to counterbalance stimuli presentation using the counterbalancing/randomization feature in Tobii Studio. Tests that have already been created can easily be redesigned, for example, by changing the stimuli order. Different types of stimuli can be included in the same test.
Gaze data for visualizations are grouped by tests. This means that only gaze data from one test at a time can be shown on a stimuli in the visualizations tool of Tobii Studio. However, gaze data from multiple tests can be combined for statistical analysis by the use of AOI groups.
Tobii Studio features are categorized in this Product description as belonging to different aspects of an eye tracking project. The categories are Test design, Recording, Replay, Visualizations, Statistics, Data export and Tobii Glasses tools. In this section, features relating to test design are described.
Tobii StudioTM 3.X
5

Stimuli ElementsStimulus Description
Instruction Instructions can be included as a part of a stimuli sequence and added to the test as any other stimulus. An instruction is a text displayed before or after another stimulus to give the participant information or instructions. The text included can be any text considered valuable to the study and can be entered by the person who sets up the study. It is also possible to add an image as a background to the instruction text.
Image Plain images as stimuli are used for many basic gaze analysis applications, including psychological studies and advertising testing.
Tobii studio does not resize images to fit the resolution of the used screen. Therefore, for an entire image to be seen on the screen as a stimuli, the maximum size of the image cannot exceed the size of the screen (in pixels).
Movie Predefined movies can be used as stimuli.
Tobii studio does not resize movies to fit the resolution of the used screen. Therefore, for an entire movie to be seen on the screen as a stimuli, the maximum size of the movie cannot exceed the size of the screen (in pixels).
Web The web stimulus allows the participant to naturally browse a website using Microsoft Internet Explorer during the test session. Tobii Studio records all data from the session by recording all screen contents on the participant’s screen together with events such as scrolling and page transitions. During the recording Tobii Studio also captures a bitmap of the full web page.
Screen recording The screen recording stimulus is not a predefined stimulus as such. Instead, it makes use of whatever is present on the participant’s screen as stimulus. This is achieved whereby Tobii Studio generates a software-based video recording of the contents of the participant’s screen. By using the screen recording stimulus, eye tracking studies of software or stimuli otherwise not available as separate stimuli elements can be performed.
Scene camera With the scene camera stimulus the participant can be eye tracked while looking at a real-world, stationary, physical object or scene during the test session, for example, a real newspaper.
A scene camera records an exact view of what the participant is looking at. During the stimulus setup, the perspective of the scene camera is calibrated relative to the perspective of the participant, allowing gaze data to be recomputed later to accurately compensate for the perspective differences.
External video Tobii Studio can also record stimuli presented via a different device, such as a DVD player, interactive TV, game console, or separate computer.
Questionnaires The questionnaire element allows you to present a set of multiple choice-single answer questions during a Tobii Studio test. The questionnaire element is placed as a stimulus on Tobii Studio Design and Recording view timeline. The answers to the questionnaire can later be used as independent variables to filter the eye tracking data on visualizations and descriptive statistics reports.
Questionnaire elements are not available for visualisations.
PDF PDF documents can be used as stimulus, facilitating display of print ads, newspaper spreads and other study objects. PDF stimulus allows participants to navigate through the PDF document and move back and forth between the pages. This is a more natural way for participants to interact with stimuli such as magazine spreads.
Interaction with PDFs containing form fields, links or other dynamic elements are not supported by the PDF stimuli in Tobii Studio. PDFs containing these kinds of elements will be displayed as stimuli on the screen, but it will not be possible to interact with the interactive elements.
6
Product Description

* The Tobii T Series Eye Trackers have an embedded user camera.
Recording
Recorded DataRecording Description
Eye gaze data Recording eye gaze data is a main feature of Tobii Studio. All calculations and visualizations are based on and synchronized with the recorded gaze data.
The following is recorded for each eye separately by Tobii’s stationary eye trackers:
• Eye gaze position• Eye position in 3D space• Pupil size• Timestamp for each data sample• Validity code
Stimuli All stimuli displayed in a test session are recorded, providing a test presentation possible to replay at any time. When a new webpage is launched during a recording, a screenshot of the entire page including parts not currently visible due to screen size is taken and later used for visualisations such as gaze plots and heatmaps. When the participant interacts with the page, Tobii Studio keeps track of the page’s URL, contentID, name, what part of the page is currently within view on the screen etc. in order to facilitate aggregation of gaze data which is later available for analysis.
Tobii Studio cannot accurately record certain types of webpage content for data aggregation from multiple recordings, particularly highly dynamic content such as Flash and dynamic JavaScript. These limitations primarily affect the ability to make Gaze plots, Heat map and Cluster visualizations. Doing analysis of dynamic websites using AOIs is possible, but requires more manual work than for static websites. The Replay tool works accurately for all types of web content, including highly dynamic content.
When using the screen-recording stimulus, a video of the contents on the participant’s screen is recorded to an ASF file. When the external video or scene camera stimuli are used, an ASF recording of the input stream specified in the stimuli element is recorded. The input stream can come from various sources such as web cameras, game consoles, other computers, etc. To capture input streams from sources such as game consoles or computers does require additional hardware to be added to the computer running Tobii Studio in the form of a video capture card.
Timestamps Tobii Studio records timestamps to allow for accurate data synchronization, including:• Recording timestap - Timestamp counted from the start of the recording to which all events and data including
gaze samples and media events are synchronized.• Local timestamp - The timestamp in the date format provided by the computer running Tobii Studio.• EyeTracker timestamp - The timestamp provided in microseconds provided by the eye tracker firmware clock.Read the Timing Guide for Tobii Eye Trackers and Eye Tracking Software (www.tobii.com), for more information on the timing accuracy of Tobii Studio recordings.
Events Events automatically recorded by Tobii Studio include:
• Mouse clicks (left/right)• Key presses (including which key was pressed)• Image start time/Image end time• Movie start time/Movie end time• PDF page start time/PDF page end time• Scene start time/Scene end time• URL start time/URL end time• Instruction start time/Instruction end time• Screen recording start time/Screen recording end time• Event Markers
Besides these, other valuable events such as facial expressions of the test participants can be manually logged after a recording is completed. To quickly add events after the test, predefined shortcuts can be used. Manually logged events will be displayed in the analysis tool together with the automatically registered events and also be available for export in the Data Export tool.
User camera and audio To observe facial expressions, gestures, and comments of the test participant, a user camera* and microphone can be integrated into the setup.
With a user camera, a video of the test participant can be recorded as an ASF file. If a microphone is included and sound recording enabled in Tobii Studio, all sounds during the test session are also recorded. The test leader may remotely view a live stream of the user camera and listen to the participants during the test session.
Videos and sounds will also be a part of the recording done during a test session and can be reviewed in the Replay Tool, giving a synchronized view of user responses by observing posture, facial expressions, and vocalizations.
Gaze data is a very powerful source of information for studies of behavior and is the core data of Tobii Studio. By combining gaze data with other sources of data, a holistic view of participant responses is achieved.
To enable comprehensive analysis and interpretation, Tobii Studio records much more than just gaze data. It is also designed to provide an easy to use yet effective recording of workflow, allowing you to quickly collect data from large groups of participants.
Tobii StudioTM 3.X
7

Monitoring the Recording with a Local Live Viewer
Tobii Studio Local Live Viewer is a feature that allows the test leader to monitor the eye tracking session in realtime on a secondary monitor. The test leader will be able to view whatever is presented on the participant’s screen with the live gaze data superimposed. The local live viewer can be combined with a track status and/or a user camera window.
Remote Viewing with Tobii Studio Remote Viewer
The Tobii Studio Remote Viewer provides a way to remotely view the eye tracking session in realtime over a local area network. A live feed of whatever is presented on the participant’s screen or what is seen by a scene camera will be displayed with the eye tracking data superimposed. Track status, user camera, and user audio are also presented.
Tobii Studio currently only supports one client computer connected to the Tobii Studio computer at any time.
Calibration
Tobii Studio offers a number of options to easily, quickly, and robustly perform eye-tracking calibrations. Since calibrations with the Tobii eye trackers are long lasting, each calibration is saved as a part of the participant’s personal profile and can be reused in later sessions recorded for the same project.
Three types of calibration procedures are available:
• Auto calibration: This is the standard option and provides an automatic, easy to use calibration procedure displaying a series of dots moving across the screen. A normal calibration takes less than 10 seconds.
• Infant calibration: This calibration is intended for infants and other participants with difficulties concentrating on viewing a static stimulus. The process involves playing AVI movies with sound at different sections on the screen. It also includes a number of options for starting, pausing, and aborting calibration points, as well as the possibility to play a movie that recaptures attention at any time during the process.
• Manual calibration: The manual calibration is meant to be used to aid calibration when no screen is shown to the participant. The calibration stimuli consists of a cross shown on the moderator’s screen where the intersection of the lines in the cross describes the position of the calibration point. During the calibration the moderator will ask the participant to look at the position indicated by the cross on the moderator’s screen on a calibration board on which the calibration points have been marked in the same plane as the stimuli to be studied. The progress from one point to the next is controlled by the moderator.
It is also possible to adjust the number of calibration points (2, 5, or 9), the backgorund color of the calibration screen, the color of the calibration stimuli point and the calibration speed (in the automatic calibration routine).
When the calibration is finished, a calibration plot illustrates the quality of the calibration. Points for which the calibration feedback indicates bad quality can be recalibrated.
Moving points are displayed on the screen during calibration.The result is presented directly after the calibration is completed.
8
Product Description

RTA - Retrospective Think Aloud Recording
Retrospective Think Aloud (RTA) is a commonly used methodology where participants in a usability test provide an oral description of their experiences after performing one or more tasks. Tobii Studio’s RTA feature allows you to conduct and record an RTA interview while doing a screen recording, which allows you to show, e.g., a playback of the original Tobii Studio recording or a Tobii Studio visualization of the collected gaze data. The RTA recordings will later be available in the recordings list for playback and further analysis.
No gaze data is recorded during an RTA session.
Tobii StudioTM 3.X
9
Replay
Timeline
The Replay tool displays a timeline representing the complete recording. Clicking anywhere on the timeline will fast-forward or rewind the recording to that particular moment.
The speed of the replay can be adjusted in order for closer analysis of quick events or to fast-forward during sections of less interest. You can also change the scale of the timeline clicking and dragging at the edges of the bar below the timeline. For example, his is useful when wanting to study events that happen close in time.
Replay Tool
With the Replay tool you can replay a complete test session time with the gaze points of the participants superimposed. Tools are included for creating segments and scenes, providing the option to make a closer analysis of certain fragments of the recording. Post recording logging of events and filtering of events is also possible within the Replay tool.
During replay, the recording from the user camera and user audio are also presented by default. The playback of the user camera and/or audio recording can be disabled. It is possible to present and study replays of individual test sessions in full screen mode.
Scene Tool
With the scene tool, any movie-based recording may be split up into a sequence of images like a storyboard, which makes quantitative data analysis much easier and more relevant.
For each scene you will be able to view Gaze plots, Heat maps and Clusters as for any other media, as well as define areas of interest and compute statistics.
Manual Event Logging (coding schemes)
Keeping track of all types of activities during a recording, such as mouse clicks and facial expressions, is crucial to gaze data analysis. In addition to events automatically logged during recording such as mouse clicks and key presses, it is also possible to manually add events on the timeline and write comments while analyzing the results.
Automatically logged events as well as manually logged events are represented on the timeline by colored markers. By holding the cursor over an event you will see the event type and the exact time it occurred. Quick navigation to the time of a specific event is done by clicking on the event in the Events window to the left of the timeline. The Events window can also be set to only show specific types of events and a search function allows for an easy way to find when a certain event occured on the timeline.
Automatic Scene Generation Tool for E-Prime Extensions for Tobii
This feature currently applies to Tobii Studio and E-Prime software setups, where E-Prime and Tobii Studio are run on separate computers and communicate with each other over a LAN network (TCP/IP protocol). The image or video presented by E-prime on the eye tracker’s display is recorded by Tobii Studio using the external video stimulus and synchronized with the gaze data. The image or video recording is done via a video capture card installed on the Tobii Studio computer. The E- Prime computer sends stimulus related triggers to the Studio computer via the network that allows Tobii Studio to automatically create scenes (se above) that can be used for analysis.
In the Replay tab of Tobii Studio, a number of features that can be used to aid the analysis of the eye tracking data is available such as a replay as well as the possibility to log events and create segments and scenes.
10
Product Description
Segment Tool
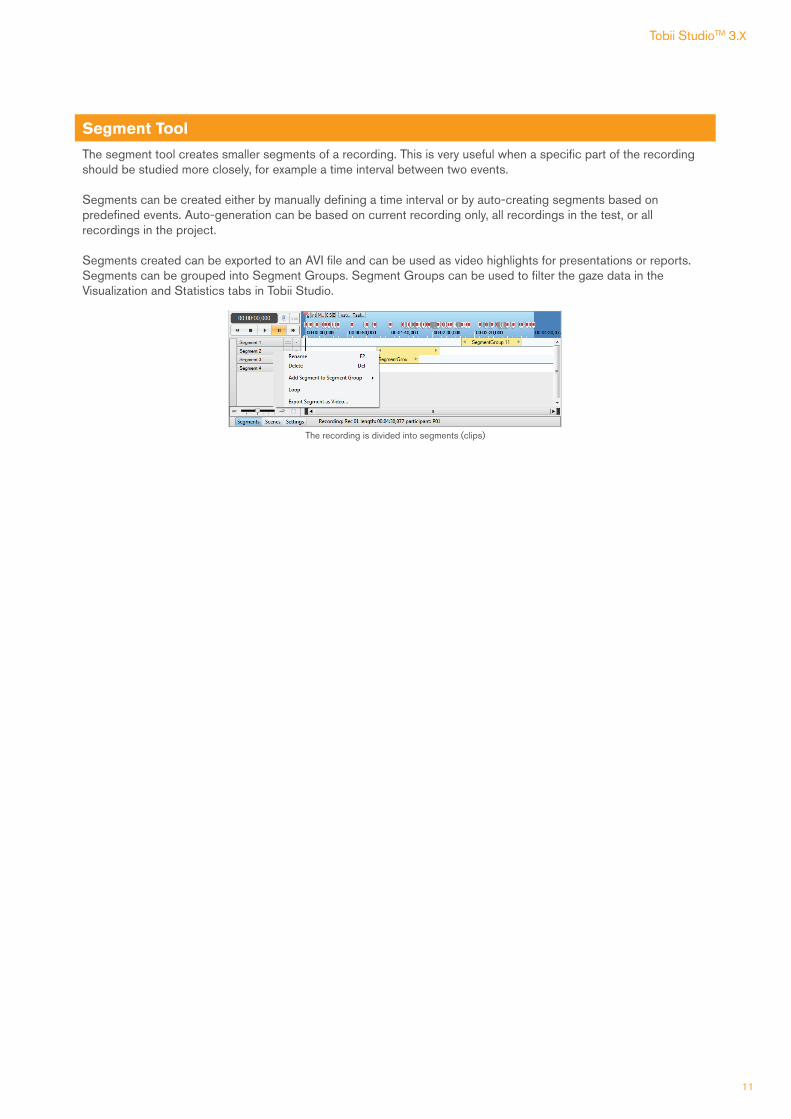
The segment tool creates smaller segments of a recording. This is very useful when a specific part of the recording should be studied more closely, for example a time interval between two events.
Segments can be created either by manually defining a time interval or by auto-creating segments based on predefined events. Auto-generation can be based on current recording only, all recordings in the test, or all recordings in the project.
Segments created can be exported to an AVI file and can be used as video highlights for presentations or reports.Segments can be grouped into Segment Groups. Segment Groups can be used to filter the gaze data in the Visualization and Statistics tabs in Tobii Studio.
The recording is divided into segments (clips)
Tobii StudioTM 3.X
11

VisualizationsTobii Studio provides a number of powerful tools for analysis of eye gaze data. It provides unique features for gaze visu-alization and multi-person analysis. The system automatically keeps track of and compensates for events such as image transitions and scrolling, and synchronizes gaze data with the stimuli.
For each stimulus, you select whether to base visualizations on one single recording or several recordings simultaneously. You may also filter recordings according to predefined variables such as age or gender.
Each visualization tool also offers a number of optional settings.
Gaze Plot
The Gaze plot tool summarizes gaze data from one or multiple recordings and displays gaze points, fixations, and scan paths superimposed over the stimuli included in your test. You may also zoom in on time segments. You can replay the gaze plots for numerous participants over time.
Gaze data is visualized by using the Gaze plot tool
Heat Map
The Heat map tool creates a heat map based on the aggregation of gaze data from one or multiple recordings. The heat map can be based on different data, i.e. fixation counts and absolute or relative gaze duration. You may also zoom in on time segments. You can replay the heat map for numerous participants over time.
In the Heat map tool it is possible to change the colors representing the different levels of visual attention as well as to invert the visualisation to highlight instead of hide areas to which more visual attention was devoted.
The Heat map tool is used to visualize a summary of the gaze data
12
Product Description

Cluster
The Cluster tool visualizes areas of visual attention in a slightly different way than the Heat map tool. To define the cluster areas, a spatial threshold is set, which limits how far away two fixations can be from each other before being separated into different clusters. For each cluster, the information is given of how large percentage of the recordings or participants who have fixations included in the cluster. With this tool you can also zoom in on time segments. You can replay the clusters for numerous participants over time.
The clusters displayed may be transformed into AOIs.
Here, several clusters are clearly visible.
Animated Visualizations
Animated gaze plots, heatmaps and cluster visualizations show where participants look over time. The visualizations can either show how the gaze data accumulates gradually up until the end of the timeline for the stimuli or for a short time window that moves along the timeline. Animated visualizations can be replayed in Tobii Studio or exported to an AVI file, representing the gaze data of a single participant or the accumulated gaze data of several participants.
Animated visualizations can be created for both static media (e.g. images) or dynamic media (e.g. movies or dynamic content on web pages).
Tobii StudioTM 3.X
13

Areas of Interest (AOIs) and AOI Groups
The Areas of Interest (AOIs) tool allows you to easily define areas of certain interest on your stimuli.
AOIs can be used to get statistics for eye tracking metrics such as time to first fixation or visit count for areas within stimuli for one or many recordings.
AOIs are created by drawing ellipses, rectangles, or polygons over any type of stimuli. AOIs that have already been created may easily be reshaped and copied to other stimuli. AOIs drawn on dynamic stimuli like web recordings or movies can be reshaped, deactivated and reactivated to compensate for changes of objects shown within the stimuli. By the use of keyframes where the shape of an AOI is defined by the user at specific times on the stimuli timeline, it is possible to get a linear reshaping of the AOI between these keyframes.
If a stimulus contains several static images, as for web sessions, the tool allows you to define AOIs for each individual image. The gaze data for each recording is automatically adjusted relative to the AOI positions to compensate for scrolling, moving windows, and page transitions.
Eye tracking and click data from several AOIs within or across stimuli and tests can be accumulated and analyzed as an AOI group.
Here, 5 AOIs were created to provide eye tracking metrics statistics for 5 elements present in the image
Web Group Tool
In many cases, a webpage or a webpage URL will look slightly different each time it is presented, for example due to looping advertisements or because sessionIDs are used by the website. The Web Group tool allows for both manual and automatic grouping of webpages based on, e.g., ContentID, URL, page name etc. If manual grouping is used it is possible to choose to group similar pages that all contain objects of interest and where the differences in the webpages’ shape are not relevant for the study. Webpages saved as a group will be shown as one single stimulus in the list of included media.
Similar webpages can be grouped in the web group tool
14
Product Description

Participant and Segment Group Filters for Visualizations and Statistics
Recordings may be filtered based on participant variables – entered manually or acquired through a questionnaire – providing a simple and efficient way of categorizing gaze data during analysis. If, for example, the variables “female” and “male” are predefined and matched to each participant, you can filter so only recordings from participants that match a selected criteria, e.g. “male”, are used when doing visualizations such as gaze plots or when calculating statistics.
You can also create more complex participant groups. You might, for example, want to study women aged between 20 and 30, which can be done by creating a filter where the variable values “Woman” and “20-30” are selected.
Participant groups that have been created once can be reused and edited in all sections of Tobii Studio where filtering by participant variables can be done. New participant groups can also be created anywhere in the software where the option to do this kind of recording filtering is available.
You can also filter the data by the Segment Groups. Segment Groups that have been created in the Replay area can be reused to filter the data anywhere in the software where the option to do this kind of recording filtering is available.
To visualize just a selection of data you can filter the data after the test
Pre-processing Filters for Gaze Data
Tobii Studio performs automatic filtering of gaze data in several ways. Filtering is important in reducing the amount of data that is to be processed, as well as filtering out less reliable data. All filtering options are available for the data visualization within Tobii Studio as well as for export functions.
• Eye filters: The Tobii Eye Tracker performs binocular recording when both eyes are visible, or otherwise monocular recording. Tobii Studio provides the option to use the input from each eye separately or the average of the two eyes.
• Fixation filters: Fixation filtering is used to extract fixations from the recorded gaze data. Tobii Studio has three adjustable fixation-filtering algorithms (the ClearView Fixation Filter, the Tobii Fixation Filter and the I-VT filter) as well as the option to use the unfiltered (raw) gaze data with or without noise reduction. The noise reduction options included in Tobii Studio is a moving average noise reduction algorithm and a moving medina noise reduction algorithm.
As different studies might require different filter settings, it is possible to save and load already saved filter configurations.
Gaze Data and Gaze Velocity Visualization tool
The VelocityChart tool, which is available from the Replay tab, provides the option to review unprocessed gaze data, gaze velocity, the selected velocity threshold, detected fixations, and gaze data which has been processed in the fixation filter from part of a recording in a single chart.
The tool has a built-in functionality for manipulating the fixation filter settings and reviewing the impact the manipulations have on the gaze data and detected fixations without influencing the fixation filter settings in Tobii Studio.
The type of data shown in the chart can also be exported for an entire recording either to the clipboard for pasting into a suitable software application or as an .xls file.
Tobii StudioTM 3.X
15

Statistics
Tobii Studio offers an embedded Statistics tool to calculate eye tracking metrics, based on Areas of Interest (AOIs) and AOI groups.
The following represent examples of statistics provided, but does not constitute the full list of metrics:
• Fixation count (number of fixations on each AOI)• Total visit duration (total time each AOI was viewed)• Average visit duration (average time of fixation per AOI)• Time to first fixation (time from when each participant first saw a specific stimuli until an AOI within the stimuli
was fixated on for the first time)• Percentage fixated (percentage of participants that have fixated on a AOI)• Mouse click statistics (time from fixation to click, time to first mouse click, mouse click count)• First fixation duration
The Statistics tool also offers a time segmentation zoom option and an export tool that can be used to export AOI Statistics to SPSS, Excel or other suitable data analysis software for further analyses.
StatisticsTobii Studio offers a powerful statistics module that provides a framework for eye tracking and mouse click data analysis. The solution offers comprehensive, flexible, easy-to-interpret tables and bar charts that incorporate advanced calculations of gaze and click metrics. It allows you to easily and quickly extract descriptive statistics without having to develop your own tools.
Tables
One of the two views available in the Statistics tool is the Tables view. As the title suggests, the data is viewed in the form of one or more tables, including all the selected variables and values.
Tobii Studio allows cross test stimuli analysis (comparison between media from different tests) and the production of cross tabulation tables based on participants’ independent variables.
Several eye tracking metrics can be presented in a single table.
A sample of the table view
Charts
The other view is the Charts view. Using this view allows you to analyze and compare the data from the recordings. Values are shown using a bar chart.
Charts can be saved as images or copied and pasted into Power point presentations or other suitable software.
16
Product Description

Data export
It is possible to export the data recorded by the eye tracker and Tobii Studio and do further analysis using other software such as Matlab or Excel. The data can be exported per recording, per segment or per media (e.g. image, webpage or scene). It is also possible to export the data for several recordings, segments or media at once to the same or to separate files.
The 83 data types available for export are divided into 8 groups in order to simplify navigation and selection within them. These groups are:
• General data - Contains data about export data, studio version, project and test name, participant characteristics, recording information and current fixation filter
• Media data - Contains data about media name, position and size• Segment and scene data - Contains data about segments and scenes• Timestamp data - Contains data about the timestamps available for export• Recording event data - Contains data about events recorded during a recording such as mouse clicks, key
presses, studio events and external events• Gaze event data and AOI activity information - Contains data about gaze event data such as fixations and
saccades as well as about AOI activity information• Gaze tracking data - Contains the raw gaze point of each data sample expressed in pixels or millimeters for each
eye individually or as an average• Eye tracking data and validity codes - Contains data such as eye position, pupil size and validity codes
Within the Data export tool it is possible to create presets for frequently exported data type combinations. It is also possible to specify the format of the exported data in terms of characters used for no data and to separate decimals so it corresponds to the format requested by the software used for further data analysis, e.g. Matlab or Excel.
Data export
Tobii StudioTM 3.X
17

Import Recordings and Snapshot Images
Tobii Glasses recordings can be imported into Tobii Studio by inserting the Recording Assistant’s memory card in the computer’s card reader. The import process also allows you to import snapshots (still images captured by the scene camera) associated with the recordings and correct for parallax offsets. This correction allows you to map the gaze data more accurately on the scene camera video and snapshots.
To produce visualizations other than replays using a Tobii Glasses recording, you first need to import a snapshot of the Area of Analysis (AOA). This can be done in two ways: by using an image taken with the scene camera built into the Tobii Glasses, or by using any image taken with a digital camera.
Tobii Glasses tools
Glasses Data Viewer
The Glasses Data Viewer allows you to replay and analyze the video of the scene camera and the gaze position (coordinates) frame by frame. With the Enterprise edition of Tobii Studio you can also review IR marker detection. The Glasses Data Viewer then displays information on the IR markers’ ID and position, which can be exported as a .tsv file with information for each video frame.
Tobii Studio provides qualitative and quantitative tools to analyze eye tracking data from the Tobii Glasses. With Tobii Studio you can aggregate the data from multiple test participants and create illustrative visualizations and retrieve relevant statistics for Tobii Glasses recordings.
Snapshot Tool
When using a Tobii Glasses scene camera snapshot, the IR markers’ positions and IDs are set automatically by Tobii Studio. The Snapshot Tool is used to visualize the mapping of the IR markers and to activate or deactivate the IR markers on the imported snapshots. This tool is also used to manually map the IR markers’ positions and IDs on images from other sources such as any digital camera, which are imported as a snapshot.
Parallax Correction Tool and Snapshot Coverage Tool
The Parallax Correction Tool allows you to correct for parallax/distance offsets that occur when using Glasses to view objects at different distances during a single recording. This tool allows you to set different distance settings for different segments of a Glasses recording.
The Snapshot Coverage Tool displays the IR marker detection coverage for each imported snapshot.
A timeline with the Parallax Correction Tool and the Snapshot Coverage Tool in the Replay view
18
Product Description

Appendix I: Feature chartDesignFeature Live Professional Enterprise
Instruction and image stimuli X X
Movie, web, pdf, questionnaires stimuli X X
Scene camera and Screen capture stimuli X X X
External video
Independent variables X X X
Full test preview and individual preview of all stimuli elements X X
“Randomization” of stimuli order (Latin Square method) X X
CalibrationFeature Live Professional Enterprise
Manual and automatic calibration X X X
Infant calibration and attention grabbers X X X
Calibration plot X X X
2, 5 or 9 point calibration X X X
RecordingFeature Live Professional Enterprise
Eye tracking data1 X X X
Stimuli information1 X X X
Stimulus1 X X X
Subject responses1:• Mouse clicks• Keystrokes
X X X
Tobii Studio Remote Viewer1 X X
Auto event logging (e.g. mouse clicks and key presses)1 X X X
User camera1 X X X
User audio1 X X X
ReplayFeature Live Professional Enterprise
Recording playback X X X
Full screen recording playback X X X
User camera and sound X X X
Segment tool:• Definition of video clips• Auto-generation of segments• Segment groups
X X X
Scene tool• Definition of scenes for visualizations• Auto-generation of scenes using events from E-Prime tests
X X
RTA recording X X
Event searching and manual logging X X X
1Not available for Non-Recording Licenses.
Tobii StudioTM 3.X
19

AnalysisFeature Live Professional Enterprise
Gaze plot visualization X X
Heat map visualization X X
Animated visualizations X X
Cluster visualization X
Area of Interest (AOI) tool and AOI groups, with:• Static AOIs• Dynamic AOIs2
X X
Statistics tool(Based on eye tracking metrics. For example, fixation count, visit duration, time to first fixation, percentage fixated/clicked)
X X
Gaze data filters:• Fixation filters• Eye filter• Noise reduction functions
X X X
Velocity chart X X
Participant filters X X X
ExportFeature Live Professional Enterprise
Data export:• Eye tracking and recording data *.tsv files• Descriptive statistics tables as *.txt files• Descriptive statistics charts as *.png files
X X X
Gaze data and fixation filter settings export from the VelocityChart tool as *.xls
X X
Bmp, Jpg, or png image export of:• Gaze plots• Heat maps• AOIs
X X
Bmp, Jpg, or png image export of:• Clusters
X
AVI export of complete recording with gaze superimpozed X X X
AVI export of segments of recording with gaze superimposed, user camera and user audio
X X X
AVI export of:• Gaze Plots• Heat Maps• Clusters
X X
AVI export of RTA recording X X
2 Only for the Stimuli type supported by the License, e.g. Dynamic AOIs on Movies are not supported by Tobii Studio Basic
20
Product Description

System ConfigurationFeature Live Professional Enterprise
Dual monitor setup option (for separate participant and test leader views)
X X X
Local Live Viewer:• Real-time viewing on second screen• Stimuli with gaze data superimposed• User camera view• Track status
X X X
Tobii Remote Live Viewer:• Remote viewing over IP• Stimuli with gaze data superimposed• Track status
X X
Integration with E-Prime X X
Tobii Glasses ToolsFeature Live Professional Enterprise
Import recordings1 X X
Import snapshot images1 X
Snapshot tool X
Glasses data viewer X X
Parallax correction tool X X
Snapshot coverage tool X
1Not available for Non-Recording Licenses
Tobii StudioTM 3.X
21

Appendix II: System configuration
Setup
There are several ways of setting up a Tobii Eye Tracker with Tobii Studio™, allowing you to choose the most appropriate setup for your study.
A setup with two computers and two monitors, using Tobii Studio Remote Viewer, allows you to remotely view your recordings over IP (available with Tobii Studio™ Enterprise edition). With this setup you may observe the participant from a separate room.
You may also use one computer with dual monitors connected (available with Tobii Studio™ Professional and Enterprise edition), or one computer with a single monitor (available with Tobii Studio™ Basic edition).
By combining the Tobii Studio™ software with Tobii Eye Tracking hardware (and/or other compatible software components such as Eprime), you get a complete system for usability testing, advertising testing, or psychology research.
Recommendations for System Setups and Accessories
Tobii Studio™ integrates with Tobii Eye Trackers as well as a range of other hardware devices, forming a complete system. Configuration may be performed in various ways, for instance as stationary or portable labs. More information about available setups for the respective eye tracker models can be found in the eye tracker’s user manual. Information about available and compatible accessories can be found in the Product section at www.tobii.com. In the Library section at www.tobii.com information about system recommendations for a computer running Tobii Studio is available.
System Recommendations
For best performance of Tobii Eye Tracking hardware and software it is recommended that you use computers with certain specifications. The System Recommendations document can be obtained via your sales agent or online in the Library section at www.tobii.com
Tobii Studio™ is compatible with the following Operating Systems:• Windows XP® (only 32-bit edition)• Windows 7® (32-bit and 64-bit)
Microsoft, Windows, Windows XP and Windows 7 are either registered trademarks or trademarks of Microsoft corporation or its subsidiaries in the United states and/or other countries.
22
Product Description


www.tobii.com
© Tobii®. Illustrations and specifications do not necessarily apply to products and services offered in each local market. Technical specifications are subject to change without prior notice. All other trademarks are the property of their respective owners.
HEADQUARTERS, SWEDENTobii Technology ABKarlsrovägen 2DBox 743S-182 17 Danderyd Sweden+46 8 663 69 90 Phone+46 8 30 14 00 [email protected]
CENTRAl EURopETobii Technology GmbHNiedenau 45D-60325 Frankfurt am MainGermany+49 69 24 75 03 40 Phone+49 69 24 75 03 429 [email protected]
NoRTH AmERICATobii Technology, Inc.510 N. Washington StreetSuite 200 - Falls Church, VA 22046 - USA+1-703-738-1300 Phone+1-888-898-6244 Phone+1-703-738-1313 [email protected]
JApANTobii Technology, Ltd.3-4-13 Takanawa, Minato-kuTokyo 108-0074Japan+81-3-5793-3316 Phone+81-3-5793-3317 [email protected]
CHINATobii Electronics Technology Suzhou Co., LtdNo. 678, Fengting AvenueLand Industrial ParkWeiting, SuzhouPost code: 215122China+86 13585980539 [email protected]
Tobii_ProductD
escription_TobiiStudioP
roductDescription_3
_2_1
_04
07
13
_EN
G