tobias doyle final thesis
TRANSCRIPT

JAMES COOK UNIVERSITY
SCHOOL OF ENGINEERING &
PHYSICAL SCIENCES
EG4011
Mechanical Engineering
Design & Experimentation of Un-sprung
Suspension Components for Formula S.A.E.
Vehicles
Tobias Doyle
Thesis submitted to the School of Engineering & Physical Sciences in
partial fulfilment of the requirements of the degree of
Bachelor of Engineering with Honours (Mechanical)
5th October 2012
Doyle, T. Design & Experimentation of Un-sprung Suspension Components
2 | P a g e
Statement of Access
I, the undersigned, the author of this thesis, understand that James Cook University will
make it available for use within the University Library and, by microfilm or other means,
allow access to users in other approved libraries. All users consulting with this thesis will
have to sign the following statement:
In consulting this thesis I agree not to copy or closely paraphrase it in whole or
in part without written consent of the author; and to make proper public written
acknowledgement for any assistance which I have obtained from it.
Beyond this, I do not wish to place any restriction on access to this thesis.
Tobias William Doyle Date

Doyle, T. Design & Experimentation of Un-sprung Suspension Components
3 | P a g e
Sources Declaration
I declare that this thesis is my own work and has not been submitted in any form for another
degree or diploma at any university or other institution of tertiary education. Information
derived from the published or unpublished work of others has been acknowledged in the text
and a list of references is given.
Tobias William Doyle Date

Doyle, T. Design & Experimentation of Un-sprung Suspension Components
4 | P a g e
Abstract
Formula S.A.E. is an international undergraduate competition that involves students
designing and building an open wheel style race car. The design and fabrication of the car is
proven in various events aimed at testing performance and safety. Currently the James Cook
University Motorsports team is designing and building a first generation car for competition
in the Australasian Formula S.A.E competition.
This project is aimed at developing and implementing a suspension verification process for
the James Cook University Motorsport vehicle. In order to be competitive in the Formula
S.A.E competition vehicles must be safe and reliable, which is only achievable through
testing and continuous development. However, as James Cook University Motorsports team
is building a first generation car there is no current method of testing components or
determining with confidence forces for design.
As a part of this project a suspension test apparatus has been designed and manufactured to
allow laboratory testing to be undertaken to test suspension components without having to
drive the car. This also allows verification of modelling techniques against experimental data
to increase confidence in design methods. This iterative process will allow for development
and optimization of design and ultimately result in safer and more reliable designs.
Using the designed apparatus strain results were collected showing that the most stressed
component of the suspension system is the bottom A-Arm. Using the strain results as a
comparison, FEA models of the suspension varied in accuracy. Two of the models
developed had an accuracy of approximately 30%. Further investigation in to modelling
techniques for the suspension can be developed based on these models, and the assumptions
made in these models.
The Upright and Hub shaft have been designed and verified and are ready for manufacture.
FEA modelling on these components was performed with multiple load cases. Both
components are expected to have an infinite, as both components have adequate fatigue
safety factors.

Doyle, T. Design & Experimentation of Un-sprung Suspension Components
5 | P a g e
Acknowledgements
I would like to thank Dr David Holmes, my thesis supervisor and lecturer at James Cook
University for his help and guidance throughout this thesis and for his input in to this final
thesis report.
I would also like to thank Curtis Arrowsmith for his guidance and knowledge in
manufacturing techniques and for his involvement in the fabrication of thesis based
components.
Doyle, T. Design & Experimentation of Un-sprung Suspension Components
6 | P a g e
Table of Contents Statement of Access ............................................................................................................ 2
Sources Declaration ............................................................................................................ 3
Abstract .............................................................................................................................. 4
Acknowledgements ............................................................................................................. 5
List of Figures ..................................................................................................................... 9
List of Tables .................................................................................................................... 11
List of Symbols ................................................................................................................. 12
1 Introduction ................................................................................................................... 13
1.1 Problem Definition .................................................................................................. 13
1.2 Project Aims ............................................................................................................ 13
1.3 Motivation ............................................................................................................... 14
1.4 Suspension Components .......................................................................................... 14
2 Literature Review ........................................................................................................... 16
2.1 Analytical and Computational Methods for Suspension Design ................................ 17
2.1.1 Past JCU Motorsport Analysis............................................................................ 18
2.1.2 Other FSAE Designs ........................................................................................... 22
2.2 Vehicle Behaviour Inputs ........................................................................................ 23
2.3 Suspension Test Methods ........................................................................................ 25
2.3.1 Formula 1 Honda Racing Team Suspension Testing ........................................... 26
2.4 Data Acquisition ...................................................................................................... 29
2.5 Fatigue Life Calculation .......................................................................................... 30
2.6 FSAE Specific Load Cases ...................................................................................... 30
2.7 Conclusion .............................................................................................................. 31
3 Design Methodology ...................................................................................................... 32
3.1 Test Apparatus Design ............................................................................................. 32
3.2 Detailed Apparatus Design ...................................................................................... 37
3.3 Analysis and Verification of Apparatus .................................................................... 40
4 Experimental Analysis ................................................................................................... 46
4.1 Experimental Apparatus Setup Procedure ................................................................ 46

Doyle, T. Design & Experimentation of Un-sprung Suspension Components
7 | P a g e
4.2 Apparatus Experimental Procedure .......................................................................... 50
4.2.1 Risk Assessment................................................................................................ 50
4.3 Apparatus Experimental Results .............................................................................. 51
4.3.1 Apparatus Experimental Results........................................................................ 51
4.3.2 Experimental Discussion ................................................................................... 56
5 Computational Simulation .............................................................................................. 58
5.1 Computational Simulation Results ........................................................................... 58
5.1.1 Further Model Investigation.............................................................................. 64
5.1.2 Further Push Rod Simulation ............................................................................. 67
5.2 Computational Simulation Discussion...................................................................... 69
6 Upright Verification ....................................................................................................... 71
6.1 Detailed Upright Analysis........................................................................................ 73
6.3 Upright Recommendations ...................................................................................... 78
7 Hub Shaft Redesign ........................................................................................................ 79
7.1 Hub Shaft Testing Method Investigation .................................................................. 81
7.2 Hub Shaft Detailed Design ...................................................................................... 85
7.3 Keyway Detailed Analysis ....................................................................................... 91
7.3.1 Weld Analysis ................................................................................................... 94
7.4 Hub Shaft Recommendations ................................................................................... 95
8 Conclusion ..................................................................................................................... 98
9 References ................................................................................................................... 100
Appendix ........................................................................................................................ 102
A.1 Apparatus Drawings ............................................................................................. 102
A.3 Hub Shaft Drawings ............................................................................................. 107
A.4 Relevant FSAE Suspension Rules ......................................................................... 117
A.5 Project Timeline ................................................................................................... 118
A.6 Hand Calculations ................................................................................................ 119
A.6.1 Weight Arm Calculations ................................................................................ 119
A.6.2 Push Rod Strain Calculations ........................................................................... 119
A.6.3 Hub Shaft Weld Calculations ........................................................................... 120

Doyle, T. Design & Experimentation of Un-sprung Suspension Components
8 | P a g e
A.7 Bolt Calculations .................................................................................................. 121
A.8 Risk Assessment Documents ................................................................................ 127
A.10 HBM Strain Gauge Calibration Data ................................................................... 129
A.11 Material Properties and Data Sheets .................................................................... 130
A.11.1 Alumec Material Properties .......................................................................... 130
A.11.2 7075 Aluminium Alloy Fatigue Data .............................................................. 131
A.11.3 4140 Steel Properties ................................................................................... 132
A.11.4 Welding Properties ....................................................................................... 133
Word Count: 19, 110

Doyle, T. Design & Experimentation of Un-sprung Suspension Components
9 | P a g e
List of Figures
Figure 1: Solidworks Drawing of Omega with Basic Suspension Components [3] ............. 14
Figure 2: Front Suspension Geometry Diagram without Wheel* ........................................ 15
Figure 3: Design Process ................................................................................................... 16
Figure 4: Transient Structural Analysis using Spring, for Un-sprung Mass [3] ................... 18
Figure 5: Point Mass Study [1] .......................................................................................... 18
Figure 6: Remote Force Application to Wheel, Hub Shaft and Upright [1] ......................... 19
Figure 7: Upright 2011 Design [1] ..................................................................................... 20
Figure 8: Exploded View of Recommended 2011 Hub Shaft Design [2] ............................ 20
Figure 9: Final Upright FEA Model (McMune et al [11]) .................................................. 23
Figure 10: Vehicle Pitch, Roll and Yaw [13] ..................................................................... 24
Figure 11: Wheel Camber [15] .......................................................................................... 24
Figure 12: MOOG 4-poster suspension tester [17] ............................................................. 25
Figure 13: MOOG 16-DOF suspension test rig [18] ........................................................... 26
Figure 14: Uniaxial suspension test [7] .............................................................................. 27
Figure 15: Diagram of Forces Acting on a Wheel [7] ......................................................... 27
Figure 16: 12-Axis Suspension Testing [5] ........................................................................ 28
Figure 17: Strain gauge diagram [20] ................................................................................ 29
Figure 18: FSAE skip pan event ........................................................................................ 31
Figure 19: Test Apparatus Prototype 1............................................................................... 35
Figure 20: Test Apparatus Prototype 2............................................................................... 36
Figure 21: Test Apparatus Prototype 3............................................................................... 36
Figure 22: Final Apparatus Design with Suspension Geometry .......................................... 38
Figure 23: Suspension Test Apparatus Diagram................................................................. 38
Figure 24: ANSYS Apparatus Meshing ............................................................................. 40
Figure 25: Force Loading on Apparatus ............................................................................. 41
Figure 26: Apparatus Safety Factor ................................................................................... 41
Figure 27: Apparatus High Stress Areas ............................................................................ 42
Figure 28: Deflection of Apparatus.................................................................................... 42
Figure 29: Weight Arm Stress Distribution ........................................................................ 43
Figure 30: Weight Arm Total Deformation ........................................................................ 43
Figure 31: Weight Arm Safety Factor ................................................................................ 44
Figure 32: Axis Positioning ............................................................................................... 44
Figure 33: Hub Shaft and Upright Geometry Exploded View [1] ....................................... 48
Figure 34: Exploded View of Suspension Assembly .......................................................... 49
Figure 35: Metal Finish before Strain Gauges Attached ..................................................... 51

Doyle, T. Design & Experimentation of Un-sprung Suspension Components
10 | P a g e
Figure 36: Completed Strain Gauge ................................................................................... 51
Figure 37: Strain Gauge Positioning .................................................................................. 52
Figure 38: Positioning of Strain Gauge Locations on Push Rod ......................................... 52
Figure 39: Strain Gauge Positions on the Push Rod ........................................................... 52
Figure 40: Completed and Assembled Test Apparatus ....................................................... 53
Figure 41: Strain Result Graph .......................................................................................... 54
Figure 42: Spring Length vs. Load .................................................................................... 55
Figure 43: Spring Force on Push Rod ................................................................................ 56
Figure 44: Model A Setup ................................................................................................. 58
Figure 45: Model A Mesh ................................................................................................. 59
Figure 46: Model A Strain Results .................................................................................... 59
Figure 47: Model B Setup and Mesh ................................................................................. 60
Figure 48: Model B Strain Results ..................................................................................... 61
Figure 49: Model B Exaggerated Deformation .................................................................. 62
Figure 50: Model C Setup ................................................................................................. 62
Figure 51: Model C Strain Results ..................................................................................... 63
Figure 52: Model D Setup and Strain Results .................................................................... 63
Figure 53: Strain Gauge 1, Model B and D Strain vs. Experimental Strain ......................... 64
Figure 54: Strain Gauge 2, Model B and D Strain vs. Experimental Strain ......................... 65
Figure 55: Strain Gauge 6, Model B and D Strain vs. Experimental Strain ......................... 66
Figure 56: Model B Push Rod Result................................................................................. 67
Figure 57: Simple Push Rod Analysis using Realistic Constraints ...................................... 68
Figure 58: 2011 Upright Design ........................................................................................ 71
Figure 59: Upright Machining Configuration ..................................................................... 72
Figure 60: 2012 Upright Design ........................................................................................ 73
Figure 61: Load Case 1 Geometry ..................................................................................... 74
Figure 62: Load Case 1 Mesh ............................................................................................ 75
Figure 63: Load Case 1 Stress ........................................................................................... 76
Figure 64: Load Case 1 Fatigue Safety Factor.................................................................... 76
Figure 65: Forces Analysed for Load Case 2 ..................................................................... 76
Figure 66: Load Case 2 Mesh ............................................................................................ 77
Figure 67: Load Case 2 Stress ........................................................................................... 78
Figure 68: Load Case 2 Fatigue Safety Factor.................................................................... 78
Figure 69: 2012 Current Progress of Upright ..................................................................... 78
Figure 70: Hub Shaft General Assembly ............................................................................ 79
Figure 71: Exploded Conceptual View of Hub Shaft 3.0 .................................................... 80
Figure 72: Basic Hub Shaft Solid ...................................................................................... 81

Doyle, T. Design & Experimentation of Un-sprung Suspension Components
11 | P a g e
Figure 73: Force Application Verification Mesh ................................................................ 82
Figure 74: Forces on Wheel using a General Body to Ground ............................................ 82
Figure 75: Force Application for Wheel Contact Patch Model ........................................... 83
Figure 76: Fatigue Safety Factor for, ................................................................................. 83
Figure 77: Remote Force Location .................................................................................... 84
Figure 78: Fatigue Safety Factor for Remote Force Loading .............................................. 84
Figure 79: Load Case A Mesh and Model .......................................................................... 86
Figure 80: Load Case A Setup ........................................................................................... 86
Figure 81: Load Case A Stress Plot (Cross-Sectional View) .............................................. 87
Figure 82: Load Case A Fatigue Safety Factor ................................................................... 87
Figure 83: Load Case B Moment Setup ............................................................................. 88
Figure 84: Load Case B Torque Only Stress (Cross-Sectional View) ................................. 89
Figure 85: Load Case B Moment Fatigue Safety Factor ..................................................... 89
Figure 86: Load Case B Remote Force Setup ..................................................................... 90
Figure 87: Load Case B Remote Force Stress (Cross-Sectional View) ............................... 90
Figure 88: Load Case B Remote Force Stress .................................................................... 91
Figure 89: CV Verification Setup ...................................................................................... 92
Figure 90: CV Verification Stress ...................................................................................... 92
Figure 91: Keyway Verification Setup ............................................................................... 93
Figure 92: Keyway Verification Stress .............................................................................. 93
Figure 93: Keyway Verification Fatigue Safety Factor ...................................................... 94
Figure 94: Hub Shaft Weld Locations ................................................................................ 94
Figure 95: Final Hub Shaft Design .................................................................................... 95
Figure 96: Final Front Hub Shaft ....................................................................................... 96
Figure 97: Final Hub Shaft Exploded View ....................................................................... 96
Figure 98: Final Thesis Assembly ..................................................................................... 98
Figure 99: Project timeline .............................................................................................. 118
List of Tables
Table 1: Deceleration (1.5G), Cornering (1.4) and Bump Force (1G) Load Case [1] .......... 19
Table 2: Additional Rear Hub Shaft Forces [2] .................................................................. 21
Table 3: Acceleration (1G), Cornering (1.4) Load Case [1] ................................................ 21
Table 4: Connection Reaction Forces (Hunter et al. [1]) Load Case 2 ................................ 21
Table 5: Upright Forces (McMune et al. (2009) [11]) Based on Figure 9 ........................... 22
Table 6: Apparatus Design Criteria.................................................................................... 34

Doyle, T. Design & Experimentation of Un-sprung Suspension Components
12 | P a g e
Table 7: Suspension Apparatus Design Matrix .................................................................. 37
Table 8: Bolt Joint Probe Results ....................................................................................... 45
Table 9: Hub Shaft and Upright Geometry BOM [1] ......................................................... 47
Table 10: Suspension Assembly BOM .............................................................................. 49
Table 11: Experimental Results ......................................................................................... 54
Table 12: Model A, Computational and Experimental Strain Comparison .......................... 60
Table 13: Model B, Computational and Experimental Strain Comparison .......................... 61
Table 14: Model C, Computational and Experimental Comparison .................................... 63
Table 15: Model D, Computational and Experimental Comparison .................................... 64
Table 16: Strain Gauge 1, Model B and D vs. Experimental Strain .................................... 65
Table 17: Strain Gauge 2, Model B and D vs. Experimental Strain .................................... 66
Table 18: Strain Gauge 6, Model B and D vs. Experimental Strain .................................... 67
Table 19: Push Rod Modelling Comparison ...................................................................... 68
Table 20: ANSYS Fatigue Data for Alumec ...................................................................... 74
Table 21: 4140 Steel Fatigue Properties ............................................................................. 85
List of Symbols
Stress [
Modulus of Elasticity [
Strain
kilograms
metre
millimetre
Newton
pound
foot

Doyle, T. Design & Experimentation of Un-sprung Suspension Components
13 | P a g e
1 Introduction
1.1 Problem Definition
The Formula Society of Automobile Engineers (FSAE) competition is an international
competition requiring students to design, build and market a custom racer. The design and
reliability of the car is tested through a number of different events aimed to highlight
weaknesses in the car’s design and construction. To be competitive, the car must be fast,
light and handle well. The James Cook University (JCU) motorsport team is currently
building a first generation FSAE car that is referred to as Omega.
1.2 Project Aims
This project will incorporate the re-design of Omega’s un-sprung suspension components
(i.e. the hub shaft and uprights) that are critical, complimentary items in the suspension
geometry. The un-sprung suspension components have had previous design work done [1-4],
however the size of the hub shaft was deemed inadequate for the competition stresses and
required further development [2]. For this aspect, computational methods will be further
employed in analysis using past design work, with new considerations.
An experimental test apparatus will be designed for testing the JCU Motorsport vehicle
suspension to represent FSAE competition loads. The apparatus will allow experimental
testing of the suspension geometry and spring rate without driving the vehicle. This allows
for verification of suspension components theoretical and numerical analyses and
optimisation for suspension performance. Having the ability to physically test and optimise
the suspension before driving will reduce the time required to get the car to a competitive
state and increase the safety of the driver.
The apparatus design must allow for experimentation to gather data related to the stresses
exerted on the suspension components under realistic load cases and measuring of key
performance indicators for optimisation of geometry such as spring stiffness.

Doyle, T. Design & Experimentation of Un-sprung Suspension Components
14 | P a g e
1.3 Motivation
At JCU there are presently no methods of experimentally testing car components before the
car is finished and can be driven. This poses many safety concerns, as at high speed a
catastrophic suspension component failure may result in serious consequences for the driver.
Additionally, the final product will be designed based on theoretical analysis alone, which is
never optimal. Laboratory testing has many advantages as it can confirm theoretical
measurements, leads to accelerated vehicle development, and reduces testing and tuning
required. This will result in a more competitive vehicle that is safer with increased
reliability, both important characteristics in any competition.
1.4 Suspension Components
The suspension geometry is a critical component on any vehicle as it determines the way the
vehicle will handle and also behave from external inputs such as bumps and inputs from the
driver. The current suspension geometry is attached to the car as shown in Figure 1 using
brackets. The suspension geometry shown in Figure 2 represents a double wishbone push
rod suspension, which is currently designed for Omega.
Figure 1: Solidworks Drawing of Omega with Basic Suspension Components [3]

Doyle, T. Design & Experimentation of Un-sprung Suspension Components
15 | P a g e
Figure 2: Front Suspension Geometry Diagram without Wheel*
*Wheel is attached to hub shaft
The suspension geometry is made up of several components that are typically referred to as
the un-sprung mass. The un-sprung mass incorporates the wheel rim, braking components,
tyre, hub shafts, upright and bearings. It is ideal to design the un-sprung mass as light as
possible to improve handling and limit forces exerted through the suspension system to the
car chassis (sprung mass). There are several major load cases that are important when
analysing the suspension components; acceleration, cornering and bump loads. Design load
cases and testing methods of the suspension will be discussed further in the literature review
and methodology that is to follow.

Doyle, T. Design & Experimentation of Un-sprung Suspension Components
16 | P a g e
2 Literature Review
There are many examples in Motorsport and in industry of how theoretical analysis and
experimental testing are used to develop vehicle component designs. These techniques and
other information critical to the design and testing of FSAE un-sprung components will be
reviewed in what follows.
Formula 1 represents a competition with state-of-the-art motorsport design, with continuous
development and improvement of cars during the racing season; so much so that the car at
the end of a season can be as much as 75% different to the car at the start [5]. This rapid
development of cars is only made possible by numerous methods of laboratory testing and
data acquisition, from on and off the track. Approximately 80% of the testing on Formula 1
cars takes place in the laboratory either on test rigs or virtually via computer simulation [5].
Laboratory testing allows multiple components to be tested individually and together as a
system to provide information on safety, strength, performance and life before track testing.
A component may complete thousands of kilometres of testing before it even leaves the
factory [6]. Many of the design approaches used by Formula 1 teams can be simplified to the
FSAE competition.
During the design phase many assumptions must be made and these assumptions need to be
verified using laboratory testing and then track testing. Through each of the verification
phase’s, data collected such as forces and stresses, can be used to reduce assumptions during
the design phase or to use in the laboratory testing for load sequences [5-7]. Creating an
iterative design and verification loop is vital to optimise performance and allow
development, this iterative process is shown in Figure 3, a process that is used by the
Formula 1 Honda Racing Team [5].
Figure 3: Design Process
Design & Computational
Analysis Techniques Laboratory Testing Track Testing

Doyle, T. Design & Experimentation of Un-sprung Suspension Components
17 | P a g e
For a first generation car such as Omega that is yet to be track drivable, no initial data on
forces is available for the design. Forces for design therefore must be determined from hand
calculations and computational experimentation. In many cases, it is difficult to fully
envelope the car’s behaviour in different suspension specific load cases, as the suspension
behaviour is dynamic and subject to inertial effects. Suspension specific load cases will be
further discussed in Section 2.1 Analytical and Computational Methods for Suspension
Design.
2.1 Analytical and Computational Methods for Suspension Design
There are different methods of design that can be incorporated to design suspension
components. Through the use of analytical formulas, forces at each tyre can be determined
based purely on weight transfer from acceleration forces at the centre of gravity. However,
the suspension geometry is made up of multiple components that all interact with each other
and capturing this behaviour is difficult using purely analytical methods. Finite Element
Analysis (FEA) is a computational method that can be used to model complex geometries.
FEA modelling is a useful technique to simulate different load cases in order to analyse
stresses to be used in the development and verification of designs.
One FEA modelling package is ANSYS, which offers many different methods that can be
used for different applications. Methods that will be relevant to this project are,
Static Structural
Transient Structural
Explicit Dynamics
Rigid Dynamics
FEA modelling results are only as accurate as the input forces being simulated and the way
these forces are applied. Therefore, the results must be verified analytically or
experimentally for complex geometries. Errors in modelling, typically occur because of
incorrect contacts or joints, poor meshing or poor load sequencing.
Fatigue testing is another useful tool in ANSYS that allows the life of a component to be
determined based on a defined a load sequence. It is the aim of this project to gain a better
understanding of the effect a load will have on the different components when taking into
account the tyre and shock absorber. Using this knowledge, an ANSYS model can be used to
predict the fatigue life of a component, as currently the expected worst case scenario is being
loaded cyclically to determine fatigue life.

Doyle, T. Design & Experimentation of Un-sprung Suspension Components
18 | P a g e
2.1.1 Past JCU Motorsport Analysis
Work done by Crouch, [3] in Design and Simulation of Formula S.A.E Car Suspension in
2011 analysed the dynamics of the vehicle under different load cases. It was determined that
the forces at the contact patch on the tyre could be determined by applying the acceleration
force at the centre of gravity. Crouch simulated the full car under acceleration forces taking
into account the shock absorber effect on the system by using a spring between the bottom
A-Arm and the body (Figure 4).
Figure 4: Transient Structural Analysis using Spring, for Un-sprung Mass [3]
Crouch’s [3] method was also utilised in the upright analysis by Hunter et al.[1] to determine
the forces on the tyre contact patch using a point mass study shown in Figure 5 (without
shock absorber). This allowed unknown forces to be determined, that could then be
reapplied to the wheel, upright and hub shaft. Analysis showed that the most critical load
experienced by a FSAE vehicle’s un-sprung mass is the combination loading of braking,
cornering and bump [1]. The force components from this load case are shown in Table 1.
Figure 5: Point Mass Study [1]

Doyle, T. Design & Experimentation of Un-sprung Suspension Components
19 | P a g e
Table 1: Deceleration (1.5G), Cornering (1.4) and Bump Force (1G) Load Case [1]
Component Location [m] Force [N]
X-component 0 2695
Y- component -0.254 3653
Z-component 0.11 2531
The location components are based on the outer surface of the hub shaft (Hub Shaft and Wheel
Connection) being the origin.
Forces shown in Table 1 are at the contact patch between the tyre and the road surface with
0° camber. The force components shown in Table 1 were then applied in a separate analysis
on just the wheel, hub shaft and upright shown in Figure 6. Joint probes were used to
determine force on bolt holes and bearing housing, which could be used to simply refine the
upright design. The final upright design shown in Figure 7 was further verified in a transient
analysis with the wheel and hub shaft.
Figure 6: Remote Force Application to Wheel, Hub Shaft and Upright [1]
Doyle, T. Design & Experimentation of Un-sprung Suspension Components
20 | P a g e
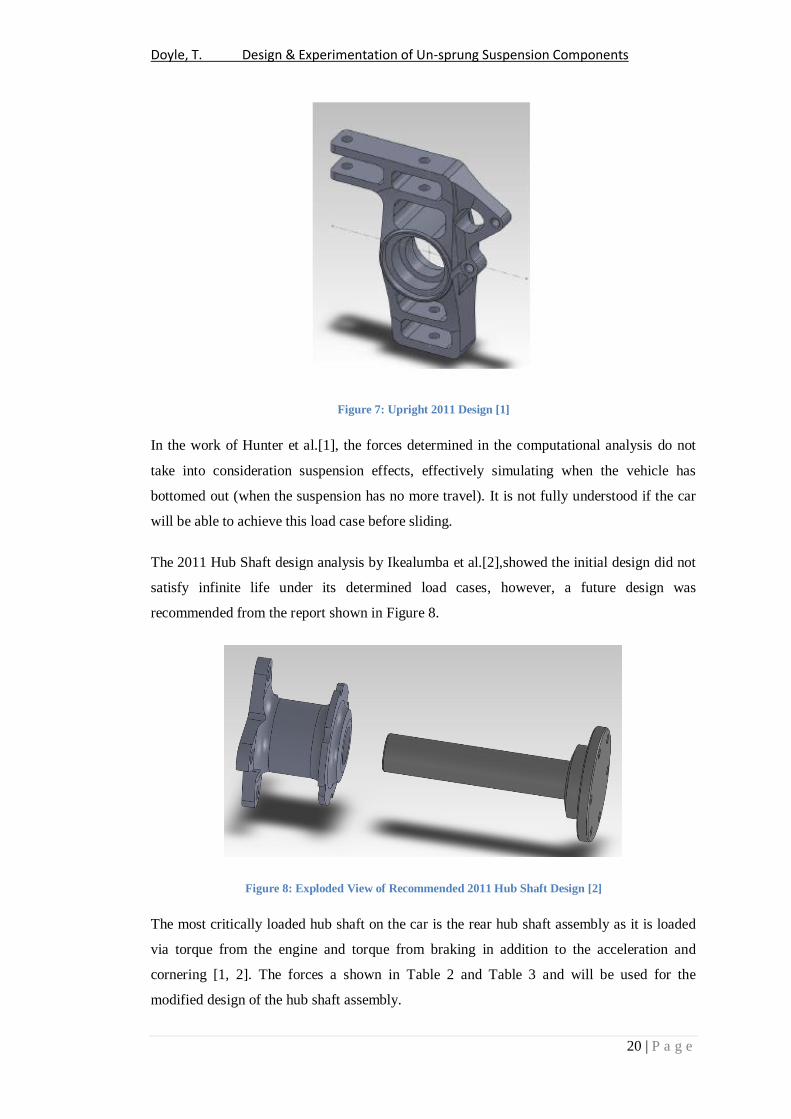
Figure 7: Upright 2011 Design [1]
In the work of Hunter et al.[1], the forces determined in the computational analysis do not
take into consideration suspension effects, effectively simulating when the vehicle has
bottomed out (when the suspension has no more travel). It is not fully understood if the car
will be able to achieve this load case before sliding.
The 2011 Hub Shaft design analysis by Ikealumba et al.[2],showed the initial design did not
satisfy infinite life under its determined load cases, however, a future design was
recommended from the report shown in Figure 8.
Figure 8: Exploded View of Recommended 2011 Hub Shaft Design [2]
The most critically loaded hub shaft on the car is the rear hub shaft assembly as it is loaded
via torque from the engine and torque from braking in addition to the acceleration and
cornering [1, 2]. The forces a shown in Table 2 and Table 3 and will be used for the
modified design of the hub shaft assembly.

Doyle, T. Design & Experimentation of Un-sprung Suspension Components
21 | P a g e
Table 2: Additional Rear Hub Shaft Forces [2]
Load Load
Maximum Engine Torque
Applied to One Output Shaft
of the Differential.
485.55 Nm [8] (Clockwise
Direction) (75% of 647.4 Nm)
242.78 Nm at a single wheel
maximum
Table 3: Acceleration (1G), Cornering (1.4) Load Case [1]
Component Location [m] Force [N]
X-component 0 -2439.9
Y- component -.254 1823.6
Z-component 0.11 1806.7
The location components are based on the outer surface of the hub shaft (Hub Shaft and Wheel
Connection) being the origin.
Another upright load case (load case 2) that was modelled by Hunter et al.[1], was the
reaction forces at the bolt connection points. These forces (Table 4) were determined using
joint probes at the connection points under the loads shown in Table 1 [1]. The modelling of
these two separate techniques, analyse the forces on the bearing housing via a remote force
at the contact patch, and at the upright connection points.
Table 4: Connection Reaction Forces (Hunter et al. [1]) Load Case 2
Force Components [N]
x y z
Lower A-Arm Bolt 7818 508.22 3378.4
Upper A-Arm Bolt 3543 0 3586.9
Steering Bolt 0 0 3643.5

Doyle, T. Design & Experimentation of Un-sprung Suspension Components
22 | P a g e
Upper Brake Bolt 2094 454.34 36.185
Lower Brake Bolt 262.51 1555.1 790.1
2.1.2 Other FSAE Designs
Other FSAE designs were reviewed to investigate the forces and methods used to design
suspension components such as the uprights and hub shafts. From this investigation it was
found that the majority of the forces used in the design of suspension components had been
developed from track data.
Jawad et al. [9] in the Design of Formula SAE Suspension, used FEA to verify upright
designs to a 1.3G cornering force. These forces were 895N at the upper A-Arm joint, -
2304.7N at the lower A-Arm joint.1121.1N force was also applied at the brake caliper
mounting holes. For the hub shaft, spindle designs were analysed under 1121N and 1445N
applied at the contact patch of the tyre.
Wong [10] in the Design and Optimisation of Upright Assemblies for Formula SAE Race
car also used FEA modelling to analyse stress on the upright design. The model forces were
applied to simulate a cornering scenario, however the forces were applied through the tyre
contact patch. A lateral force (y-axis) of 400lbf (1779.3N) along with a combined bump and
lateral 800lbf (3558.58N) (z-axis). The model was constrained at the upper and lower
upright bolt holes as they would by the A-Arms. The forces for this model were based on
data collected from previous vehicle testing.
McCune et al.[11] in the Formula SAE Interchangeable Independent Rear Suspension
Design report under a similar load case to Hunter et al.[1] in terms of acceleration loads.
McMune et al. simulated the vehicle under 1G of longitudinal, 1.5G lateral and 3G vertical
acceleration. From this simulation forces at the connection point on the upright were
determined using Matlab software from track data. These forces are shown in Table 5.
Table 5: Upright Forces (McMune et al. (2009) [11]) Based on Figure 9
Point X Component Y Component Z Component
A 220lbf (978.6N) 302lbf (1343.3N) -41lbf (182.4N)
B 162lbf (720.6N) -290lbf (-1289.92N) 13.3lbf (59.2N)
C 361lbf (1605.7N) -408lbf (-1814.8N) 700lbf (3113.6N)

Doyle, T. Design & Experimentation of Un-sprung Suspension Components
23 | P a g e
Figure 9: Final Upright FEA Model (McMune et al [11])
Overall the forces in Table 1 and Table 3 by Hunter et al. [1] are conservative in comparison
to the forces shown in Table 5 developed by McMune et al. [11], Wong [10] and Jawad et
al. (2002) [9]. This may be due to differences in geometry or the way these forces were
developed, ie. from computational experimentation or vehicle data.
The FEA modelling techniques used to verify the upright design varied between applying
the forces at the connection points of the upright or applying the loads through the tyre
contact patch. Hunter’s et al. methodology [1] involved the use of both of these techniques
in the design of the 2011 upright to a critical load case of deceleration (1.5G), cornering
(1.4) and bump force (1G). It is proposed that this is a more accurate technique as loads at
the bearing housing and the bolt connections are analysed.
2.2 Vehicle Behaviour Inputs
Vehicle behaviour is an important consideration for testing and computational analysis, as
the test apparatus should reflect realistic loads that are experienced by the vehicle. However,
there are many variables that depict the way a vehicle will behave.
There are three basic types of inertia that have an effect on the dynamic behaviour of a
vehicle. The pitch refers to the inertia effects of a vehicle under acceleration or deceleration,
forces occur about the horizontal axis. Roll refers to cornering inertia and act about the
lateral axis, and yaw refers to spinning effects that occur around the vertical axis (Figure 10).
There is also a polar moment of inertia, which is used to predict how a vehicle will corner
and refers to how the mass of the car is concentrated [12]. For example, a vehicle that has

Doyle, T. Design & Experimentation of Un-sprung Suspension Components
24 | P a g e
light mass concentration close to the centre of gravity will handle better than a vehicle that
has heavy mass concentration distanced from the centre of gravity [12].
Figure 10: Vehicle Pitch, Roll and Yaw [13]
Friction also plays a large roll in the vehicles behaviour during cornering, as without grip the
tyre will slide. If the forces created by the car in any combination exceed the friction limit,
the vehicle will lose traction and the driver will lose control of the vehicle [12, 14]. A rolling
tyre will provide more traction than a spinning or locked tyre.
Camber refers to the angle the tyre makes with the road surface (Figure 11). Negative
camber is when the top of the tyre is closer to the body of the vehicle than the bottom.
Negative camber is preferred for racing as when the vehicle corners, theoretically more of
the tyre will come in contact with the road. Zero camber provides the best amount of traction
and most efficient slip angles [14].
Figure 11: Wheel Camber [15]

Doyle, T. Design & Experimentation of Un-sprung Suspension Components
25 | P a g e
2.3 Suspension Test Methods
Through the advent of computational analysis techniques, the ability to design complex
structures has become more efficient. However, this form of design requires simplifications
and assumptions or estimations of loading forces. Therefore the design must be verified
using different testing techniques.
Handling is an important characteristic in relation to a car’s behaviour on the road. A
passenger or ‘road’ car’s suspension is mainly designed in terms of comfort, whereas for
motorsport vehicles such as Formula 1 or FSAE race cars, the suspension is tuned in terms
of performance (although performance ‘road’ cars are increasingly common place). In either
case, it is important that the suspension be reliable and correctly designed for its particular
field of operation. To verify life and strength of suspension parts, there is currently several
different forms of laboratory testing that are used.
There are many different forms of vehicle testing developed to test and measure different
criteria such as driver comfort through to suspension durability [16]. One form of testing is
4-poster test system from MOOG [16]( Figure 12) used to evaluate ride quality, Noise,
Vibration and Harshness (NVH) and Buzz, Squeak and Rattle (BSR), as well as durability of
chassis and suspension performance. Each tyre of the fully assembled vehicle is placed on a
hydraulic actuator and the actuators are moved up and down out of sync through different
amplitudes and frequencies. This method of testing allows natural frequencies of car
components to be evaluated and suspension system tuned to keep the tyre in contact with the
road surface for as long as possible. However, this form of testing requires an entire car set
up and does not have the capacity to test multi-axis loads or cornering load cases.
Figure 12: MOOG 4-poster suspension tester [17]
Another form of suspension testing is multi-DOF test rigs [16]. These systems are used to
simulate the dynamics of the system, durability and fatigue life. With the additional axes of
movement it is capable of testing vehicle behaviour during more advanced load cases such
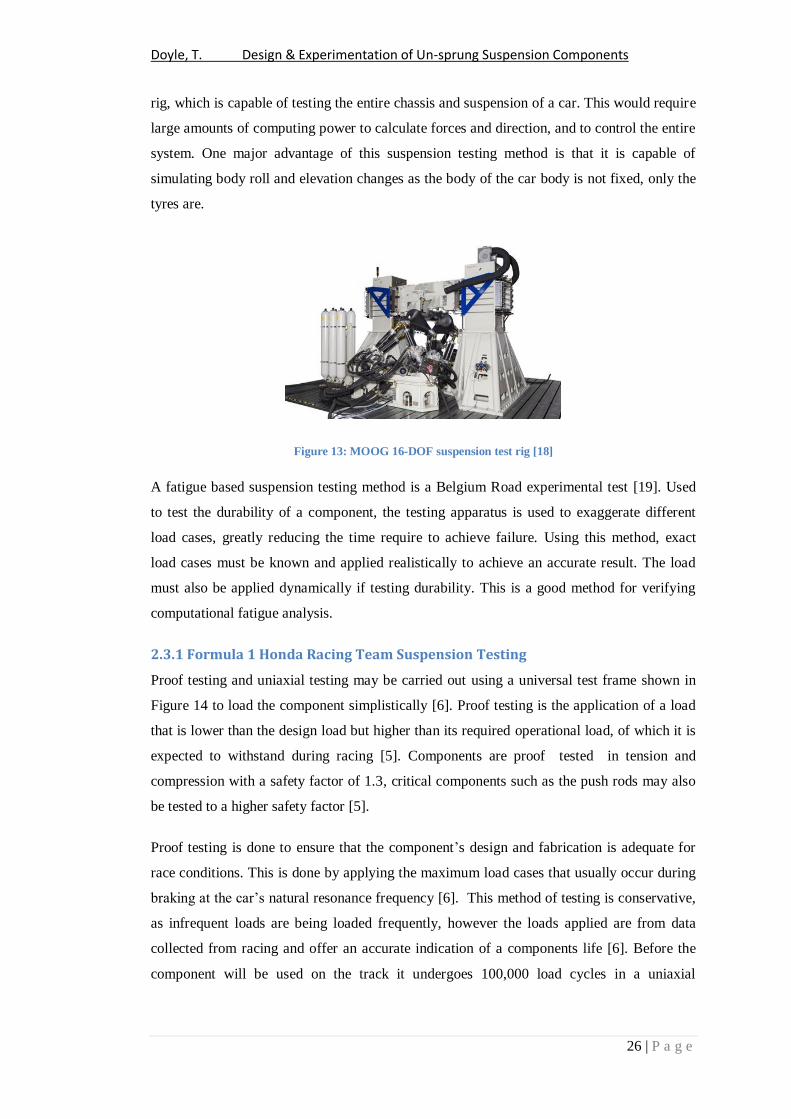
as drive torque, braking and steering [18]. Shown in Figure 13 is a 16-DOF suspension test
Doyle, T. Design & Experimentation of Un-sprung Suspension Components
26 | P a g e
rig, which is capable of testing the entire chassis and suspension of a car. This would require
large amounts of computing power to calculate forces and direction, and to control the entire
system. One major advantage of this suspension testing method is that it is capable of
simulating body roll and elevation changes as the body of the car body is not fixed, only the
tyres are.
Figure 13: MOOG 16-DOF suspension test rig [18]
A fatigue based suspension testing method is a Belgium Road experimental test [19]. Used
to test the durability of a component, the testing apparatus is used to exaggerate different
load cases, greatly reducing the time require to achieve failure. Using this method, exact
load cases must be known and applied realistically to achieve an accurate result. The load
must also be applied dynamically if testing durability. This is a good method for verifying
computational fatigue analysis.
2.3.1 Formula 1 Honda Racing Team Suspension Testing
Proof testing and uniaxial testing may be carried out using a universal test frame shown in
Figure 14 to load the component simplistically [6]. Proof testing is the application of a load
that is lower than the design load but higher than its required operational load, of which it is
expected to withstand during racing [5]. Components are proof tested in tension and
compression with a safety factor of 1.3, critical components such as the push rods may also
be tested to a higher safety factor [5].
Proof testing is done to ensure that the component’s design and fabrication is adequate for
race conditions. This is done by applying the maximum load cases that usually occur during
braking at the car’s natural resonance frequency [6]. This method of testing is conservative,
as infrequent loads are being loaded frequently, however the loads applied are from data
collected from racing and offer an accurate indication of a components life [6]. Before the
component will be used on the track it undergoes 100,000 load cycles in a uniaxial
Doyle, T. Design & Experimentation of Un-sprung Suspension Components
27 | P a g e
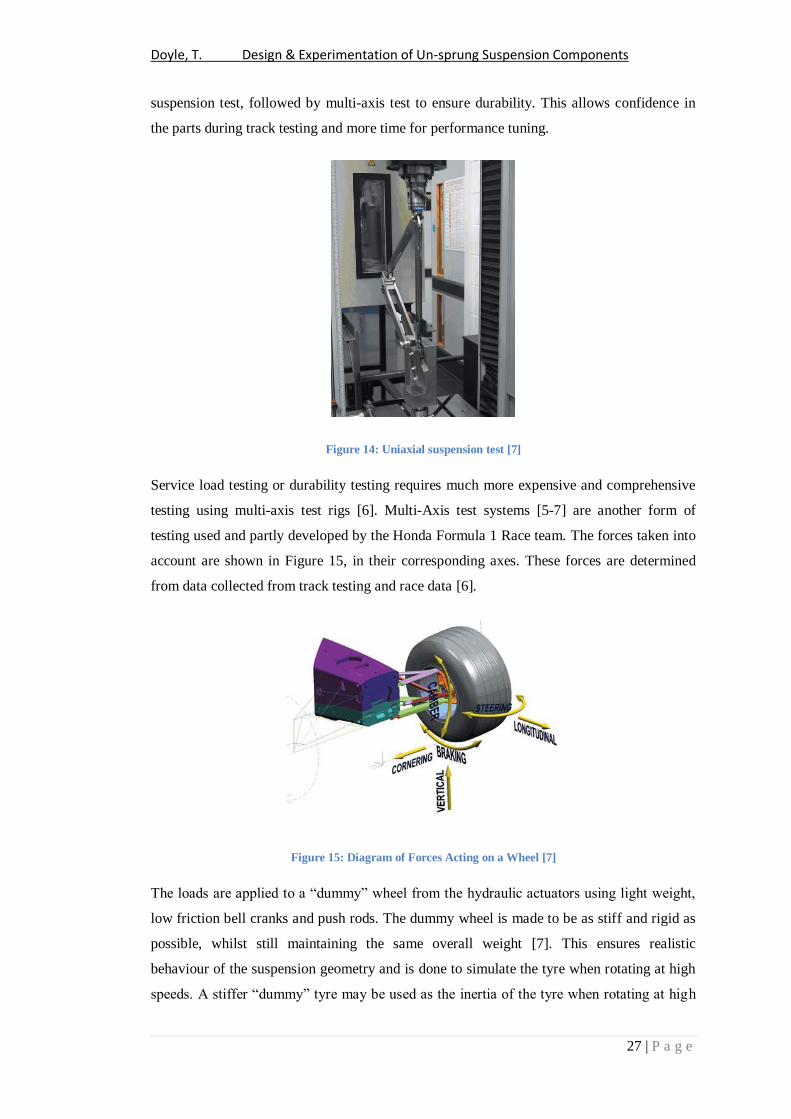
suspension test, followed by multi-axis test to ensure durability. This allows confidence in
the parts during track testing and more time for performance tuning.
Figure 14: Uniaxial suspension test [7]
Service load testing or durability testing requires much more expensive and comprehensive
testing using multi-axis test rigs [6]. Multi-Axis test systems [5-7] are another form of
testing used and partly developed by the Honda Formula 1 Race team. The forces taken into
account are shown in Figure 15, in their corresponding axes. These forces are determined
from data collected from track testing and race data [6].
Figure 15: Diagram of Forces Acting on a Wheel [7]
The loads are applied to a “dummy” wheel from the hydraulic actuators using light weight,
low friction bell cranks and push rods. The dummy wheel is made to be as stiff and rigid as
possible, whilst still maintaining the same overall weight [7]. This ensures realistic
behaviour of the suspension geometry and is done to simulate the tyre when rotating at high
speeds. A stiffer “dummy” tyre may be used as the inertia of the tyre when rotating at high
Doyle, T. Design & Experimentation of Un-sprung Suspension Components
28 | P a g e
speeds will cause the tyre to become stiffer in the sense that it would become less
deformable.
Data collected from track testing and races are recorded using transducers located on the car
and record different parameters such as acceleration, velocity and displacement [7]. These
loads are software manipulated and then replayed on test components on the 6 axis test
apparatus using servo hydraulic actuators [6, 7]. Maximum forces on the suspension
geometry occur during cornering and braking at high amplitude and low frequency and these
forces can be represented in a vertical and longitudinal components shown in Figure 15 [7].
These forces can be simulated using hydraulic actuators in the vertical and longitudinal
planes and are applied at the tyre contact patch.
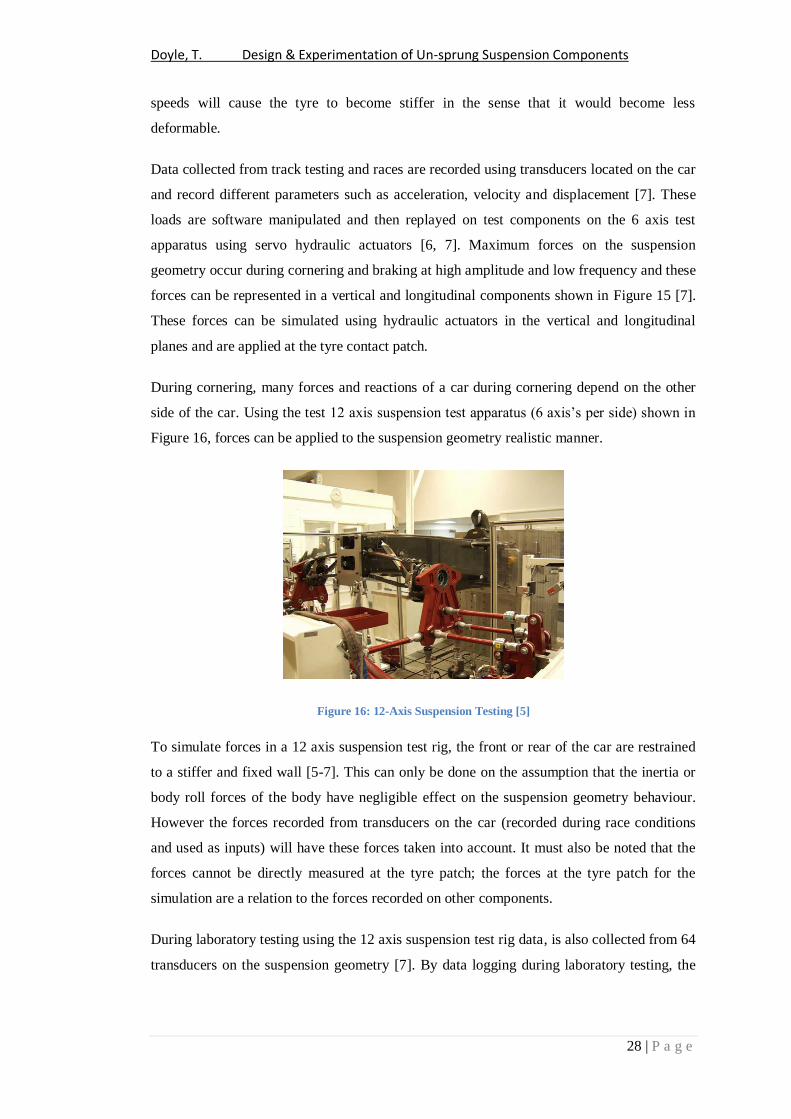
During cornering, many forces and reactions of a car during cornering depend on the other
side of the car. Using the test 12 axis suspension test apparatus (6 axis’s per side) shown in
Figure 16, forces can be applied to the suspension geometry realistic manner.
Figure 16: 12-Axis Suspension Testing [5]
To simulate forces in a 12 axis suspension test rig, the front or rear of the car are restrained
to a stiffer and fixed wall [5-7]. This can only be done on the assumption that the inertia or
body roll forces of the body have negligible effect on the suspension geometry behaviour.
However the forces recorded from transducers on the car (recorded during race conditions
and used as inputs) will have these forces taken into account. It must also be noted that the
forces cannot be directly measured at the tyre patch; the forces at the tyre patch for the
simulation are a relation to the forces recorded on other components.
During laboratory testing using the 12 axis suspension test rig data, is also collected from 64
transducers on the suspension geometry [7]. By data logging during laboratory testing, the

Doyle, T. Design & Experimentation of Un-sprung Suspension Components
29 | P a g e
testing technique can be continuously verified with track data. Allowing changes to be made
to the suspension setup and evaluated without running the car on the track.
A 12 axis suspension test rig is not an idealistic method of simulating car behaviour during
cornering because the test rig is only capable of applying forces to the tyre contact patch.
The current rig is not capable of simulating vertical and rotational movements of the
vehicles body caused from inertia or track elevation change. However these simplifications
in formula 1 racing is valid as the car’s suspension is much stiffer and body roll effects are
restrained from large aerodynamic down force effects acting on the car during a corner.
The aim of this research is to provide a simplified version of this type of stand-alone
suspension test apparatus for the use in the design of JCU FSAE car suspension.
2.4 Data Acquisition
Data acquisition is important to allow for efficient and accurate testing to find the most
optimum design and validate components. In formula 1, data is continuously collected and
monitored during the race, during track testing and during laboratory testing [6, 7]. There are
many different techniques and sensors that can be utilised to gather the data required for
experimental testing or fatigue prediction. The strain gauge is simple yet useful method of
determining minimum and maximum forces on a component and load frequency [20].
The strain gauge shown (Figure 17) as the name suggests is used to determine experimental
strain that can be used to calculate stress and force. A strain gauge is a resistive transducer
that is excited by a voltage, when there is a change of the overall length of the strain wire,
there is a change in resistance and therefore a change in voltage [20]. The strain determined
can be converted to stress using Hooke’s Law shown in Equation 1.
Figure 17: Strain gauge diagram [20]

Doyle, T. Design & Experimentation of Un-sprung Suspension Components
30 | P a g e
(1)
Strain results from experimentation can be compared to strain results in FEA models to
verify the computational model. This is done through a direct comparison between the
model and experimental strain results [21-23]. Strains at specific locations can be used to
develop a strain history that can be used to improve the accuracy of computational fatigue
life [24].
2.5 Fatigue Life Calculation
Fatigue is a major failure mode found in repetitive loading situations. Fatigue life of a
component can only be accurate if there is accurate data supporting it. Data acquisition
allows for load cases to be developed and an accurate fatigue life can be determined.
Without the input data, load forces can be inferred from theory & calculated using
computational analysis, however these forces must be verified using experimental testing to
allow confidence in the result.
There are several different methods of fatigue testing and prediction, such as durability
experimentation or through the use of FEA based software. One method that has been used
in failure analysis is to carry out experimental loading until fatigue cracks occur, thus
illustrating the areas of highest stress and using FEA analysis to verify the results [25, 26].
In this method, no direct data was used from the experiments to verify the FEA simulation.
Fatigue life was calculated using an S-N curve from stresses calculated in the FEA analysis
[25, 26]. This method does not provide a full verification of the FEA model, as forces from
the experimental analysis are not collected and compared to the model. However, fatigue life
cycles in the experiment and computational model can be compared.
A more accurate method of verification is to use experimental data to verify the FEA model
[21, 22], as computational modelling is typically a more cost effective method of testing
than many experiments and reduces time to develop a product. The experimental analysis is
conducted under realistic loading conditions and data on forces experienced by different
components is collected. This is then compared to FEA model results. This method verifies
the accuracy of the computational model and allows confidence in the computational results.
This is the approach missing in the JCU FSAE team design and is the main purpose for the
test apparatus.
2.6 FSAE Specific Load Cases
The tilt test and the skid pan are two events in the FSAE competition that are directly related
to suspension testing. The tilt test is used to test roll over stability as the car is tilted to 60°

Doyle, T. Design & Experimentation of Un-sprung Suspension Components
31 | P a g e
which represents 1.7 G’s lateral acceleration. The skid pad is used to test suspension
performance by completing the track shown in Figure 18. The suspension must also be
designed to have 50.8 mm suspension travel, which leads to a soft suspension setup with
small amounts of body roll. For specific FSAE rules relating to the suspension, refer to
Appendix A4[27]. The timed laps and endurance races of the event will also test the
durability and reliability of the suspension.
Figure 18: FSAE skip pan event
2.7 Conclusion
The 12-axis suspension test apparatus is an accurate method for simulation of forces on a
Formula 1 car. It enables forces acquired from track and race to be virtually replayed on the
front or rear portion of the car to verify components or tune performance parameters. The
main assumption of this method is that horizontal inertia effects such as roll, are
insignificant compared to normal forces. This may be an accurate assumption in Formula 1
due to the large amounts of grip that can be generated from larger tyre, stiffer suspension,
heavier vehicle and down force. However, in FSAE, this may not be the case as the
suspension set up is required to be softer, and normal forces down on the car are not as large.
There are other requirements of having a 12 axis testing method such as 12 hydraulic
actuators to be controlled via sophisticated computer systems. This is expensive and not
realistic for the FSAE competition. However, the verification method applied in Formula 1
is an accurate way of ensuring that the designs are safe and efficient. A simplified version
of this testing method will be investigated in the rest of this report.

Doyle, T. Design & Experimentation of Un-sprung Suspension Components
32 | P a g e
3 Design Methodology
The objective of this project was to develop a testing and verification method for future JCU
Motorsport design in relation to the suspension geometry. Currently, as the JCU Motorsports
team is building a first generation race car, there is no method for physically validating
designs. Components are being designed based on theoretical techniques or computational
simulation, or are being fabricated and assembled on the car without prior testing. This
method of design is not ideal as many assumptions are made (For example FEA modelling
constraints) that may lead to over conservative or unsafe designs.
The implementation of a laboratory testing technique will allow for experimentation to
verify assumptions made during the design process in computational models or loads. This
can be achieved by comparing computational results, against data collected from laboratory
experiments. By having data to compare computational results to, the accuracy of modelling
techniques is increased or validated, avoids designs from being overly conservative.
Computational models or simulations can typically be compared to theoretical calculations
to ensure the results that are obtained are realistic. However, due to the complexity of the
suspension system, it is hard to calculate values with theory alone. Using strain data from
experiments is another method that may be used to verify computational models. In this
project, computational strain was compared against experimental strain data to validate
contact, joint and load application assumptions.
With this new information on loads, other components in the suspension geometry such as
the uprights and hub shafts will be redesigned. The aim was to achieve a more complete and
accurate solution for these components.
3.1 Test Apparatus Design
The suspension apparatus is ultimately being designed to allow strain data on critical
suspension components to be recorded under different load cases for the verification of
suspension design methods and assumptions. From the designs investigated in Section 2 the
main limitation of the suspension test apparatus will be the application of force. Due to cost
limitations it is not viable to use hydraulics to apply forces. Therefore, a more simplistic
method was investigated to allow forces to be applied to the suspension geometry.
There are many forces that act on the suspension geometry and affect the dynamics of the
system. As discussed in Section 2, the Formula 1 Honda Racing Team have recognised six
main forces (Figure 15) that affect the suspension geometry. These forces are:

Doyle, T. Design & Experimentation of Un-sprung Suspension Components
33 | P a g e
Longitudinal forces created from friction force on the tyre,
Vertical forces created from bumps or elevation changes in the track,
Steering forces due to the rotation of the wheel,
Braking forces from de-acceleration creating inertial weight change about the pitch
axis,
Camber forces created from the varying contact patch when cornering. This changes
the magnitude of the forces and the direction they are applied,
Cornering forces due to the inertial weight change about the roll axis.
While a test apparatus that investigates all of these forces would be ideal, such a setup would
require a complex dynamic system similar to the 12 axis suspension test rig [5]. Instead, the
scope of the suspension test apparatus designed was limited to at testing cornering forces
directly, with other forces such as braking, camber and steering forces tested indirectly.
Design criteria were developed to ensure that the final design was adequate to achieve the
project goals. The final design of the suspension apparatus had to satisfy design criteria
shown in Table 6.

Doyle, T. Design & Experimentation of Un-sprung Suspension Components
34 | P a g e
Table 6: Apparatus Design Criteria
Criteria Reasoning
Allow for different suspension pick up
points
This allows future generation suspension
design to be tested on this apparatus. This
also for small changes in design to be tested
to tune different parameters such as camber.
Forces applied by weights or pulleys
Achievable in this project with time and
budget restraints. Reduces complexity of the
system without hydraulics and control
systems.
Allow full suspension system to be
attached
By incorporating as much of the suspension
system as possible the more realistic the
testing will be. The full suspension geometry
is shown in Figure 2.
Capable of testing forces on contact patch
of approximately 4000N
Maximum vertical force applied in previous
computational design 3653 N. The apparatus
must be able to achieve this force.
Encourages correct suspension behaviour
Moves in a way that will that simulates as
best as possible the way the entire car system
will.
Cost and Manufacturability The final design of the apparatus must be
cost efficient and capable of being
manufactured in the JCU Mechanical
Workshop.
Conceptual designs were developed with the main philosophy of the design being able to use
rotation effects to simulate body roll effects during cornering. Prototype 1 design (Figure

Doyle, T. Design & Experimentation of Un-sprung Suspension Components
35 | P a g e
19), utilised a plate hinged at the bottom to connect the suspension geometry to. However,
it’s design did not allow easy application of weights or connection of the shock absorber.
Figure 19: Test Apparatus Prototype 1
Test apparatus prototype 2 (Figure 20) changed the point of rotation to a more realistic
location, as on Omega. This design allowed for flexibility in suspension geometry
connection however, due to the box frame being made of Rectangular Hollow Sections
(RHS) the time required for fabrication was higher than prototype 1. Test apparatus
prototype 3 (Figure 21) shows a similar design as prototype 2, with the addition of rocker
and shock absorber mounts and weight application method. Prototype 3 was designed to be
made from metal plate which reduced manufacturing time as only 4 sheets were required to
be cut rather than the 12 RHS sections in prototype 2.

Doyle, T. Design & Experimentation of Un-sprung Suspension Components
36 | P a g e
Figure 20: Test Apparatus Prototype 2
Figure 21: Test Apparatus Prototype 3
The prototype designs were compared in a design matrix (Table 7) against the required
design criteria (Table 6) to determine the best apparatus design.
Doyle, T. Design & Experimentation of Un-sprung Suspension Components
37 | P a g e
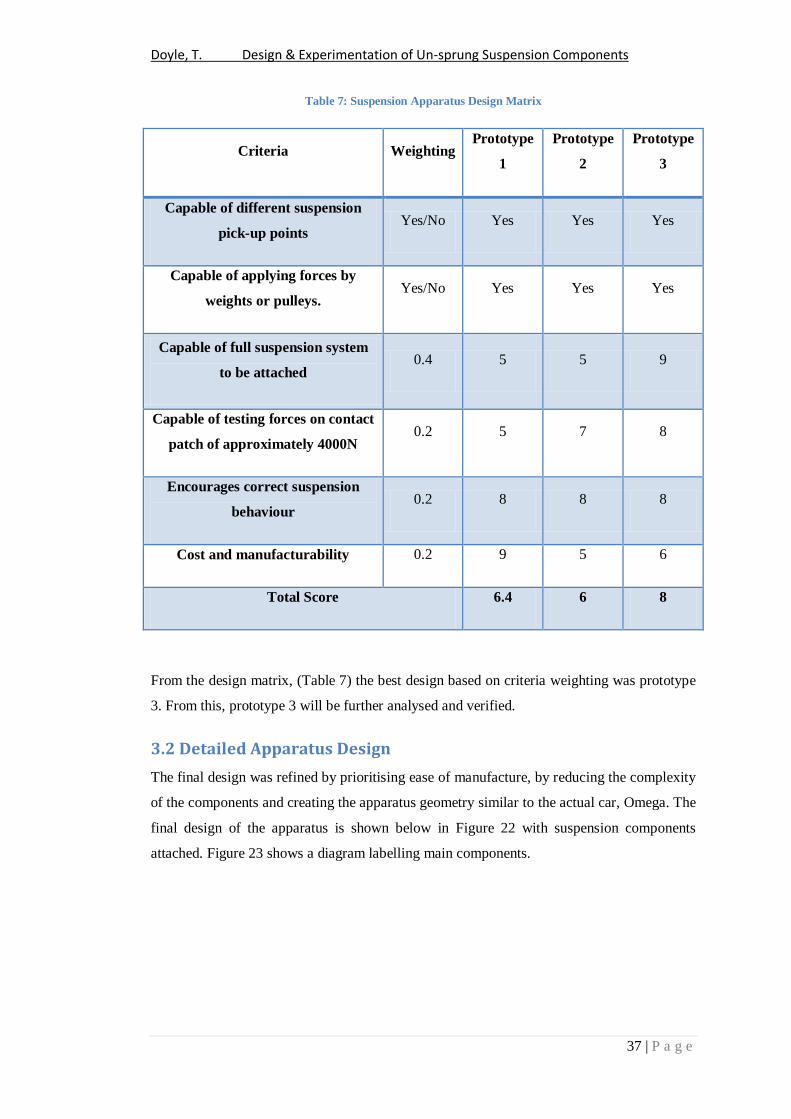
Table 7: Suspension Apparatus Design Matrix
Criteria Weighting Prototype
1
Prototype
2
Prototype
3
Capable of different suspension
pick-up points Yes/No Yes Yes Yes
Capable of applying forces by
weights or pulleys. Yes/No Yes Yes Yes
Capable of full suspension system
to be attached 0.4 5 5 9
Capable of testing forces on contact
patch of approximately 4000N 0.2 5 7 8
Encourages correct suspension
behaviour 0.2 8 8 8
Cost and manufacturability 0.2 9 5 6
Total Score 6.4 6 8
From the design matrix, (Table 7) the best design based on criteria weighting was prototype
3. From this, prototype 3 will be further analysed and verified.
3.2 Detailed Apparatus Design
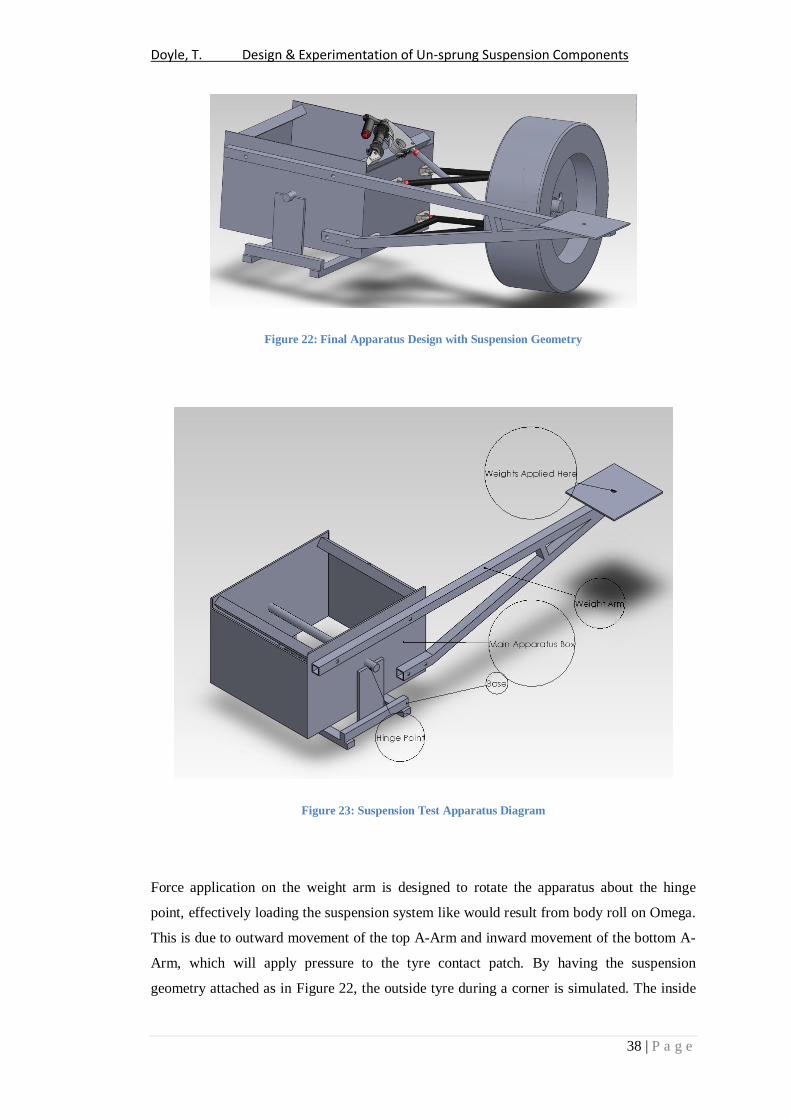
The final design was refined by prioritising ease of manufacture, by reducing the complexity
of the components and creating the apparatus geometry similar to the actual car, Omega. The
final design of the apparatus is shown below in Figure 22 with suspension components
attached. Figure 23 shows a diagram labelling main components.
Doyle, T. Design & Experimentation of Un-sprung Suspension Components
38 | P a g e
Figure 22: Final Apparatus Design with Suspension Geometry
Figure 23: Suspension Test Apparatus Diagram
Force application on the weight arm is designed to rotate the apparatus about the hinge
point, effectively loading the suspension system like would result from body roll on Omega.
This is due to outward movement of the top A-Arm and inward movement of the bottom A-
Arm, which will apply pressure to the tyre contact patch. By having the suspension
geometry attached as in Figure 22, the outside tyre during a corner is simulated. The inside

Doyle, T. Design & Experimentation of Un-sprung Suspension Components
39 | P a g e
tyre can be simulated by placing suspension components on the opposite side of the
apparatus.
With the use of the weight arm, mechanical advantage can be utilised to reduce the amount
of weight needed to be applied whilst still achieving the desired load at the tyre contact
patch. The weight application point is located one metre from the hinge point and the tyre
contact patch is 0.658m. Therefore, if the required force at the contact patch is 3653 N
(Table 1, Y force component) only 2404 N (245kg) of force is to be applied on the weight
arm. For detailed calculations on the force to be applied, refer to Appendix A6.1.
The width of the apparatus was chosen to replicate the distance between the front suspension
mounts (485mm). The hinge point height from the ground was chosen to be approximately
the same height as the roll centre of the car when completed (200mm). Both of these
measurements encourage the suspension to behave as it would on Omega, to allow for
accurate testing.
The apparatus design allows for flexibility in the attachment points of the suspension
assembly being tested, so future suspension assembly designs can be tested using this
apparatus. The suspension apparatus is capable of testing front or rear suspension, inside or
outside tyres.
The main limitation of the apparatus is that it is not loaded dynamically and the apparatus
cannot test fatigue. Another limitation of the apparatus is that 245kg of weight is required to
apply the maximum load. However, further modifications beyond the scope of this project
may allow pulleys or hydraulics to be added to the apparatus for easier application of force.
Force for initial verification experiments will be approximately 50kg as this is a small
weight that can easily be worked with.
The weight of the apparatus is not matched to the weight of the car that it is representing.
This is not expected to have an effect on the results as the weight being applied (roll force) is
much larger than this weight. Bearings were not used at the hinge point as this would add
cost and complexity to the design, which was not deemed warranted.
MS 250 steel was chosen for the fabrication of the apparatus due to its low cost and
workability, while still providing adequate strength characteristics for the application. MS
250 steel has similar properties to structural steel in ANSYS, therefore the structural steel
properties will be used for computational analysis.

Doyle, T. Design & Experimentation of Un-sprung Suspension Components
40 | P a g e
3.3 Analysis and Verification of Apparatus
The apparatus design was verified in ANSYS to ensure that the design was sufficient to
allow the correct forces to be loaded. The loads specified simulate a worst case situation that
will occur when the suspension has “bottomed out”. For this case, the bottom of the base and
the A-Arm brackets were connected to ground using a body to ground joint. All other
contacts were set up as bonded contacts. The generic mesh was used for the majority of the
apparatus, with smaller mesh sizing of 0.01m used for areas where high stress was likely to
occur, such as the weight lever arm.
Figure 24: ANSYS Apparatus Meshing
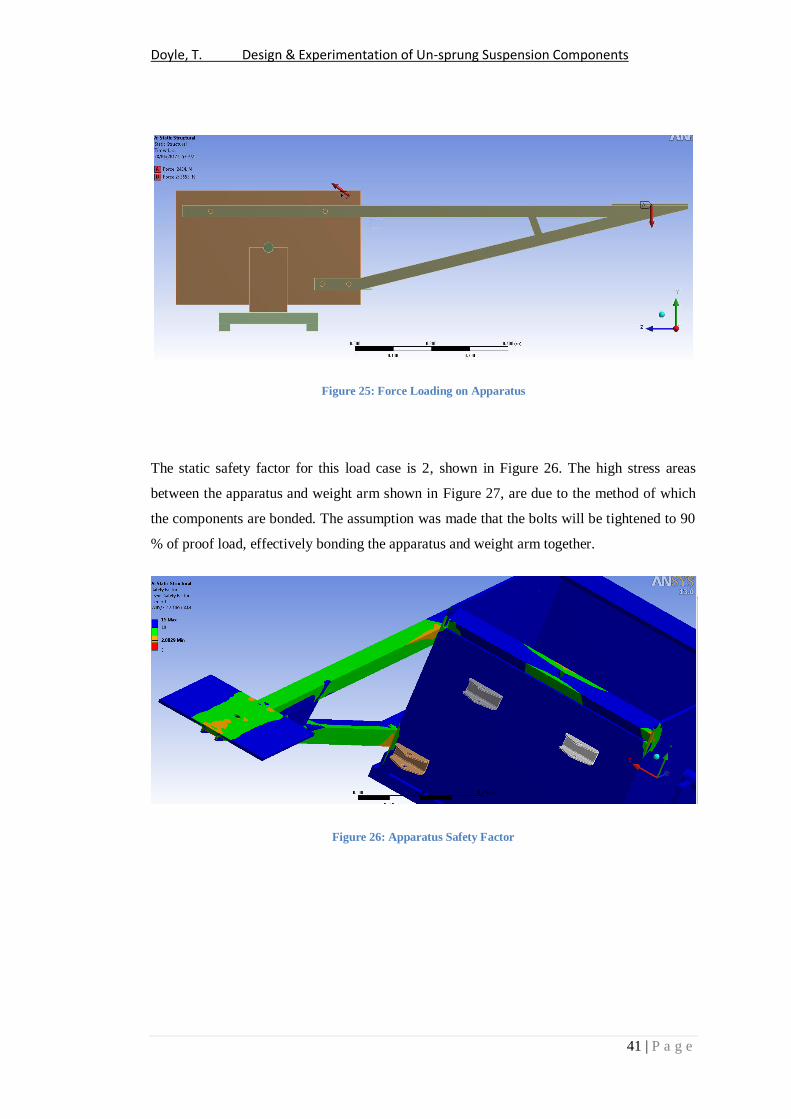
The forces applied on the apparatus are based on the Y-component force shown in Table 1.
The forces were loaded on the apparatus as shown in Figure 25, with force B being the
weight force required. Force A is the total Y-component force that may be loaded on to the
rocker connection point.
Doyle, T. Design & Experimentation of Un-sprung Suspension Components
41 | P a g e
Figure 25: Force Loading on Apparatus
The static safety factor for this load case is 2, shown in Figure 26. The high stress areas
between the apparatus and weight arm shown in Figure 27, are due to the method of which
the components are bonded. The assumption was made that the bolts will be tightened to 90
% of proof load, effectively bonding the apparatus and weight arm together.
Figure 26: Apparatus Safety Factor

Doyle, T. Design & Experimentation of Un-sprung Suspension Components
42 | P a g e
Figure 27: Apparatus High Stress Areas
It is important that the weight arm does not deflect a large amount as this may affect the
loading and accuracy of the results. The maximum deflection of the apparatus under this
load case was 0.002 m which is acceptable for this application (Figure 28). Fatigue life of
the apparatus was not tested as it will not be dynamically loaded and is not expected to fail
under fatigue.
Figure 28: Deflection of Apparatus
Further analysis was carried out on the weight arm, as it is a critical component of the test
apparatus and the bolt holes will create stress concentration. Due to the positioning of the
bolts and the loading of the weight arm, the bolt holes experience large variations in stress
demonstrated in Figure 29. The weight arm was loaded in the same way as shown in Figure
25 with 2404 N at the load point and the bolt holes fixed using a body to ground joint. This
simulates a worst case scenario where the suspension has “bottomed out”. A body mesh of
0.01 m elements was used.

Doyle, T. Design & Experimentation of Un-sprung Suspension Components
43 | P a g e
Figure 29: Weight Arm Stress Distribution
The deformation shown in Figure 30 was compared to Figure 28 to verify the weight arm
model results against the results of the apparatus analysis. A maximum deformation
comparison between Figure 28 and Figure 30 results in a 6.3% difference, which is
generated due to the difference in support methods. In both models the minimum static
safety factor is approximately 2 shown in Figure 26 and Figure 31, which is a suitable safety
factor for this application.
Figure 30: Weight Arm Total Deformation

Doyle, T. Design & Experimentation of Un-sprung Suspension Components
44 | P a g e
Figure 31: Weight Arm Safety Factor
In the weight arm model joint probes were used at the bolt holes to determine the resultant
forces on the bolts, these forces are shown in Table 8 The axis positioning for the force
components is shown in Figure 32 on the left hand side. The coordinate system on the right
hand side of the figure is the model coordinate system.
Figure 32: Axis Positioning

Doyle, T. Design & Experimentation of Un-sprung Suspension Components
45 | P a g e
Table 8: Bolt Joint Probe Results
(Bolt positioning as shown in Figure 29, Figure 30 and Figure 31)
From the forces shown in Table 8, bolt B has the largest resultant force and is therefore the
most critical. To ensure that an M12x1.75 grade 8.8 bolt is adequate for the application,
calculations were performed in Excel. The bolts in this application are loaded in shear and to
decrease shear loading the bolts will be tightened to 90 % load. This increases the area the
surfaces are in contact and frictional forces that must be overcome, effectively bonding them
together. This being the case, the static axial safety factor is 3.23 and the shear safety factor
is 4.53. For more details on calculations refer to Appendix A7.
From the analysis done, the apparatus design is deemed to be adequate for the application.
For full fabrication design drawings refer to Appendix A1. In order to verify that the
designed apparatus works, an experiment was carried out to record strain data at several
different weight applications. This was done to verify that the use of strain gauges would
indeed give results proportional to the forces being applied to the weight arm.
Force
Component
Bolt Force [N]
Bolt A (Top
Left)
Bolt B (Top
Right)
Bolt C (Bottom
Left)
Bolt D (Bottom
Right)
X – Component 282.95 9044.8 -988.3 -8339.5
Y-Component 38.664 -103.41 612.23 -2951.5
Z-Component 0 0 0 0
Total 285.58 9045.4 1162.6 8846.3

Doyle, T. Design & Experimentation of Un-sprung Suspension Components
46 | P a g e
4 Experimental Analysis
Apparatus experimental testing with the manufactured suspension test apparatus was
undertaken to record data on critical suspension components. Strain gauge measurements
were used to determine stress at critical locations on the components, with values used for
verification of simulation approaches.
4.1 Experimental Apparatus Setup Procedure
Below is the procedure for setup of the suspension test apparatus including the attachment of
the strain gauges to suspension components.
1. Attach strain gauges to critical components using to information below,
a. Clean surface thoroughly of contaminates using degreaser.
b. Using wet and dry sand paper of varying grade, sand the area where the
strain gauge is to be placed smooth. Ensuring that there is no paint left on
the surface and only smooth metal remains. The use of water during this
process will keep the sand paper from clogging up with debris.
c. Clean surface and dry thoroughly.
d. Mark on surface using a fine permanent marker the centre positioning of the
strain gauge.
e. Clean a Perspex surface thoroughly and lay a strain gauge down on the
clean surface (The side where the wires are soldered on facing up). Ensure
the strain gauge does not come into contact with skin.
f. Place a piece of clear sticky tape that is longer than the strain gauge over the
strain gauge so that the strain gauge sticks to it.
g. Position the strain gauge on the component using sticky tape to hold it in
place.
h. Slowly peel the sticky tape back so that the strain gauge is still attached to
the sticky tape, leaving one end of the tape steel attached to the component.
i. Apply super glue to the area where the strain gauge is to be attached.
j. Pull the sticky tape back down utilising the sticky tape to hold the strain
gauge in place.
k. Once the super glue is dry, peel the sticky tape off the strain gauge.
l. Repeat steps a. to k. for strain gauges on other components.
m. Mix a batch of araldite epoxy as per packet instructions.

Doyle, T. Design & Experimentation of Un-sprung Suspension Components
47 | P a g e
n. Place araldite epoxy over strain gauges so that the strain gauge is covered
for protection and allow to dry.
2. Attach suspension sub assembly using correct fasteners and tools as per the Bill of
Materials (BOM) shown Table 9, Figure 33 and Table 10, Figure 34.
Table 9: Hub Shaft and Upright Geometry BOM [1]
Item Number Component
1 Upright
2 Bearing
3 Brake Caliper*
4 M8x30 Bolt
5 M10x40 Bolt
6 M10-W-N Nut
7 Oil Seal
8 Hub shaft
9 Hub Washer
10 Stub Washer
11 Rotor Pin Cir clip*
12 Stub Shaft
13 Brake Rotor Button*
14 Brake Rotor*

Doyle, T. Design & Experimentation of Un-sprung Suspension Components
48 | P a g e
*The brake rotor and brake calliper do not have to be attached for experiments.
Figure 33: Hub Shaft and Upright Geometry Exploded View [1]
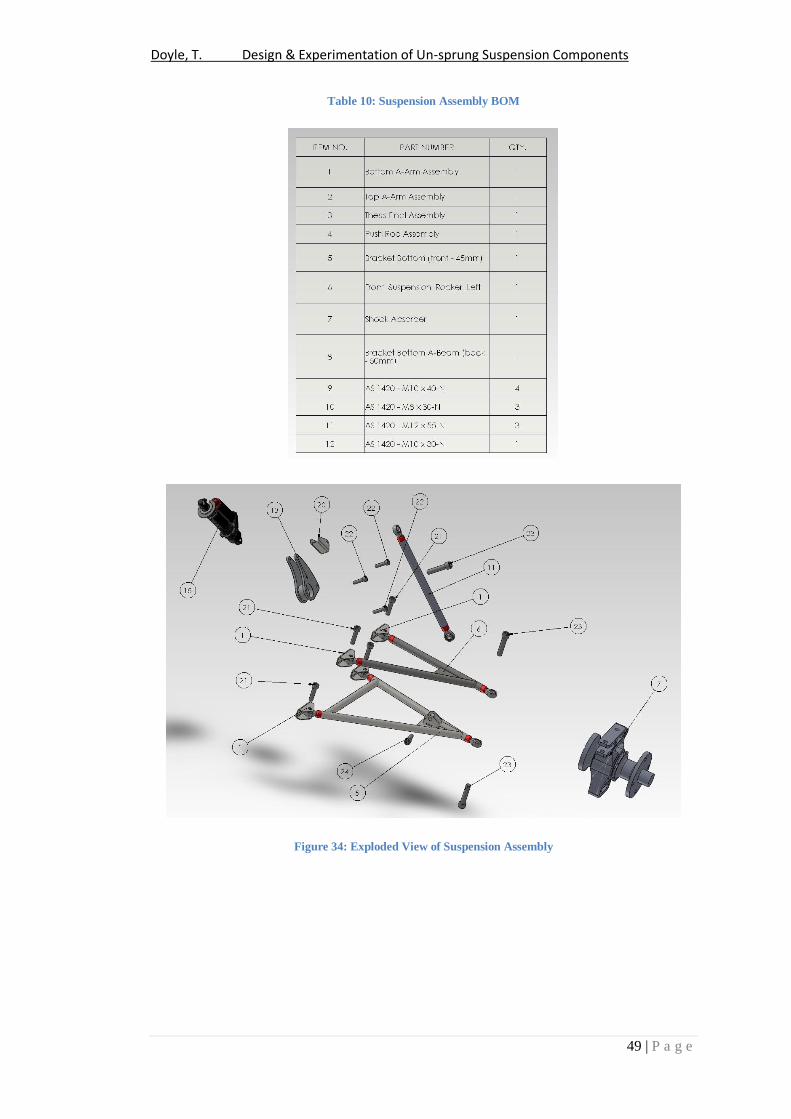
Doyle, T. Design & Experimentation of Un-sprung Suspension Components
49 | P a g e
Table 10: Suspension Assembly BOM
Figure 34: Exploded View of Suspension Assembly

Doyle, T. Design & Experimentation of Un-sprung Suspension Components
50 | P a g e
4.2 Apparatus Experimental Procedure
Before starting experimentation, the suspension settings were set as desired on the shock
absorber. The settings that were used for initial verification testing were:
Spring Length 113 mm on the 350 x 2.45 spring
Volume Adjust Knob set at 2
Compression Dampening
o Red Knob set to least
o Black Knob set to least
Experiment Procedure
1. Turn on Data Acquisition System.
2. Attach strain gauge wires to input channels on the Data Acquisition System.
3. Program data acquisition system with gauge factor coefficients.
4. Apply specified load case to the end of the apparatus weight arm. Apply weights in
stages until goal weight is reached ensuring body parts are away from moving
components and correct lifting procedures.
5. Record strain values.
6. Repeat Steps 4 and 5 for other loads.
Important Note: The weights must be loaded slowly in small increments to represent a
quasi-static nature of loading. This reduces the risk of catastrophic failure of a test
component that may cause injury.
4.2.1 Risk Assessment
A completed and signed risk assessment for this thesis has been under taken and is attached
(Appendix A8). The main risks involved are with the experimentation, however, using the
appropriate techniques and strategies, the risks can be greatly reduced. Appropriate PPE, and
safe working techniques must be employed to reduce the risks involved. A safety induction
for the test area has already been undertaken.
The major risk with this experiment is the failure of a component under the large loads
applied. The design of components has been done with safety in mind to minimise this risk,
however, caution must be used when loading the apparatus. Using correct loading technique
and visually checking components for over load should be employed to reduce the chance of
catastrophic failure.
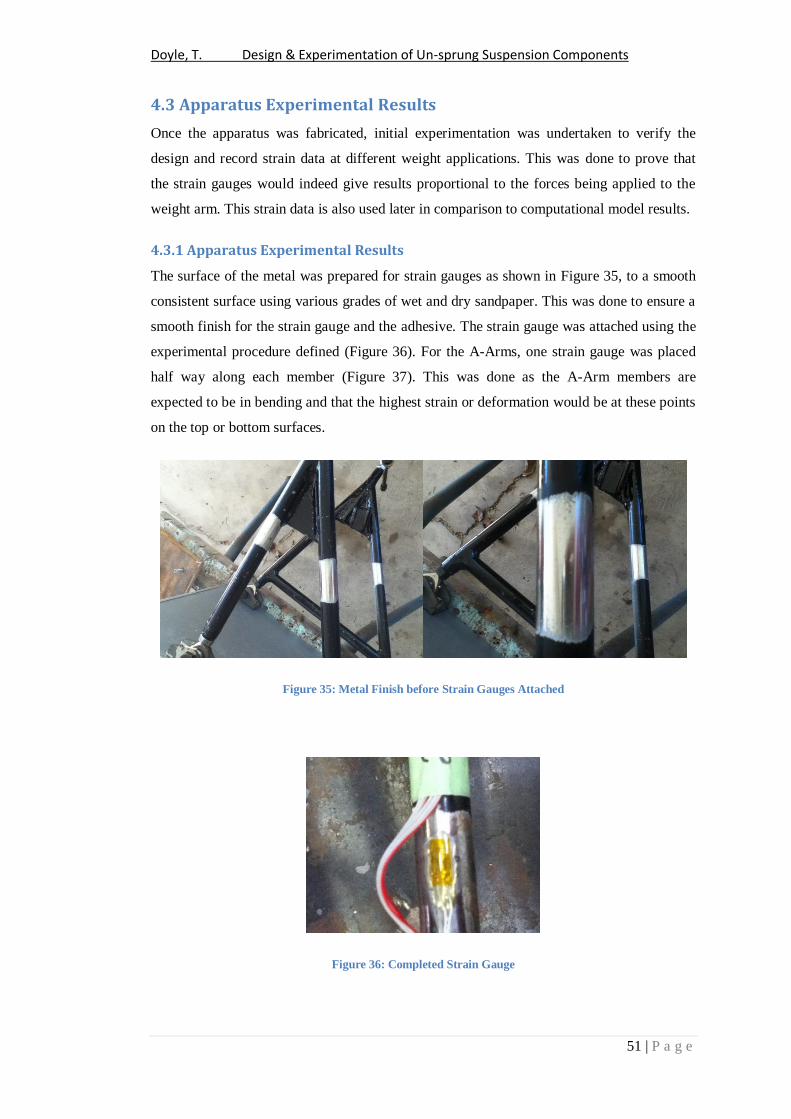
Doyle, T. Design & Experimentation of Un-sprung Suspension Components
51 | P a g e
4.3 Apparatus Experimental Results
Once the apparatus was fabricated, initial experimentation was undertaken to verify the
design and record strain data at different weight applications. This was done to prove that
the strain gauges would indeed give results proportional to the forces being applied to the
weight arm. This strain data is also used later in comparison to computational model results.
4.3.1 Apparatus Experimental Results
The surface of the metal was prepared for strain gauges as shown in Figure 35, to a smooth
consistent surface using various grades of wet and dry sandpaper. This was done to ensure a
smooth finish for the strain gauge and the adhesive. The strain gauge was attached using the
experimental procedure defined (Figure 36). For the A-Arms, one strain gauge was placed
half way along each member (Figure 37). This was done as the A-Arm members are
expected to be in bending and that the highest strain or deformation would be at these points
on the top or bottom surfaces.
Figure 35: Metal Finish before Strain Gauges Attached
Figure 36: Completed Strain Gauge

Doyle, T. Design & Experimentation of Un-sprung Suspension Components
52 | P a g e
Figure 37: Strain Gauge Positioning
For the push rod, four strain gauges were attached in pairs of two on opposite sides of the
push rod. Of the strain gauge pairs, one strain gauge was placed vertically along the shaft
and the other horizontally (Figure 37; Figure 38; Figure 39). This was done at this point half
way along the push rod, as bending, torsion and buckling are possible load cases. Using this
configuration, any form of bending, torsion or buckling, in any direction can be measured.
Figure 39: Strain Gauge Positions on the Push Rod
5
6
7
8
Figure 38: Positioning of Strain Gauge
Locations on Push Rod

Doyle, T. Design & Experimentation of Un-sprung Suspension Components
53 | P a g e
The completed and assembled apparatus is shown in Figure 40 with all necessary
components in place. However, in place of the upright, hub shaft and wheel is a fabricated
support that has been done to replicate a stiff wheel. This was done as the upright and hub
shaft had not yet been manufactured, so the support was made to replicate a similar
geometry to the upright and wheel assembly. This substitution is a valid as the pressure
inside the tyre and inertia of the wheel spinning would make the tyre rigid. This assumption
is conservative as it assumes that none of force is absorbed by the tyre.
Figure 40: Completed and Assembled Test Apparatus
The apparatus was tested over a range of weights from 20kg to 70kg. A Tokyo Sokki
Kenkyujo Co. Computing Data Logger (TDS-602) data acquisition system situated in the
JCU structural lab was used to read the strain from the gauges. The system needed initial
programing to set gage factor and resistance (Appendix A10). All measurements are
initialised meaning that the initial measurement at zero load is subtracted from all readings
such that values recorded are only the change in strain.
The results from the experimentation are shown in Table 11 over the range of weights
applied. For an unknown reason, strain gauge 8 did not give any reading, however, all other
gauges gave logical readings. Also shown in Table 11 is the change in spring length.

Doyle, T. Design & Experimentation of Un-sprung Suspension Components
54 | P a g e
Table 11: Experimental Results
Weight
[kg]
Force
[N]
Force
at
Contact
Patch
[N]
Strain Gauge με Spring
Length
Bottom A-
Arm
Top A-
Arm
Push Rod 350 x
2.45
1 2 3 4 5 6 7 8
0 0 0 0 0 0 0 0 0 0 0 113
20 196.2 300.5 -79 -89 -14 -3 5 -15 -17 0 109
40 392.4 600.9 -175 -188 -15 -6 12 -34 -27 0 104.5
60 588.6 901.4 -256 -279 -15 -9 19 -52 -40 0 99
70 686.7 1051.6 -327 -349 -15 -8 22 -65 -50 0 97
Note: Values shown in Table 11 were recorded after every increase in weight applied. This was done
as the apparatus was being load statically and there was minimum fluctuation in the values.
The results in Table 11 are shown graphically in Figure 41. Linear line of best fit is shown
for all of the strain gauge locations. For strain gauges 1,2 and 6, the equation for this line is
shown as it can be used to estimate strain at higher load weights.
Figure 41: Strain Result Graph
y = -4.46x
y = -4.8067x
y = -0.8886x
-400
-350
-300
-250
-200
-150
-100
-50
0
50
0 20 40 60 80
Stra
in μ
ε
Weight Applied [kg]
Strain Results
Strain Gauge 1
Strain Guage 2
Strain Guage 3
Strain Gauge 4
Strain Gauge 5
Strain Gauge 6
Strain Gauge 7
Linear (Strain Gauge 1)
Linear (Strain Guage 2)
Linear (Strain Guage 3)
Linear (Strain Gauge 4)

Doyle, T. Design & Experimentation of Un-sprung Suspension Components
55 | P a g e
From Figure 41 the following observations have been made:
As the weight applied increases, the strain on strain gauges 1, 2, 5, 6, and 7
increases.
As expected strain gauges 1 and 2 on the bottom A-Arm are negative as the bottom
A-Arm is loaded under bending, and the top surface of the A-Arm is in
compression.
The top A-Arm does not have a significant change in strain as the weights are
applied.
The experiment was carried out using a rocker ratio between the push rod and shock
absorber of 1.8, and a spring stiffness of 350 lb/ft. The rocker ratio refers to the 1mm
movement in the push rod is 1.8mm movement in the spring. In Figure 42, the spring length
is plotted against the load weight applied. From the trend line, it is determined that the
spring has a linear relationship and that the spring behaves as according to Hookes Law.
Figure 42: Spring Length vs. Load
Based on Hookes Law and the rocker ratio, the force on the push rod can be calculated and
is shown graphically in Figure 43. These forces take into account the 1.8 ratio of spring to
push rod.
y = -4.2x + 117.1
85
90
95
100
105
110
115
0 20 40 60 70
Len
gth
[mm
]
Weight Applied [kg]
Spring Length vs. Load
Spring Length
Linear (Spring Length)

Doyle, T. Design & Experimentation of Un-sprung Suspension Components
56 | P a g e
Figure 43: Spring Force on Push Rod
4.3.2 Experimental Discussion
The suspension test apparatus is capable of providing experimental data in relation to strain
at critical components, and force exerted by the spring. This data can be utilised in many
ways. The most beneficial result is the forces on components in relation to the force at the
tyre contact patch. This data can be further developed into loads or forces on different
components, which can be used in future designs and in verifying the simulation models in
relation to the strain data.
Temperature is not expected to have affected the values from the strain gauge as the
experiment was conducted over a period of 20 minutes and the change in temperature during
this time is expected to be minimal. The strain gauges are assumed to be connected correctly
and give accurate readings; however, this may not be the case and the results may be
affected if the strain gauges slip on the metal when loaded.
Further experimentation at higher load weights is required to further develop a strain vs. load
equations for the various strain gauge locations. From the strain results the data shows a
linear relationship, however, this is not expected to be the case for higher load weights. Also
for strain gauges 1, 2 and 6, the strain value recorded at a weight of 70kg shows a variation
to previous values. Further testing and results will allow more accurate assumptions from the
results to be made.
In the future, as further components are designed, more strain gauges can be added to the
system to gather more data to be used in further analysis. Once there is a drivable car, strain
gauges on suspension components can be used to validate the behaviour and loading method
0
20
40
60
80
100
120
140
160
0 20 40 60 70
Forc
e [
N]
Weight Applied [kg]
Force on Push Rod
Spring Force

Doyle, T. Design & Experimentation of Un-sprung Suspension Components
57 | P a g e
of the suspension test apparatus. In the section to follow, computational analysis will be
compared to results from the experiments to validate computational techniques and
assumptions.
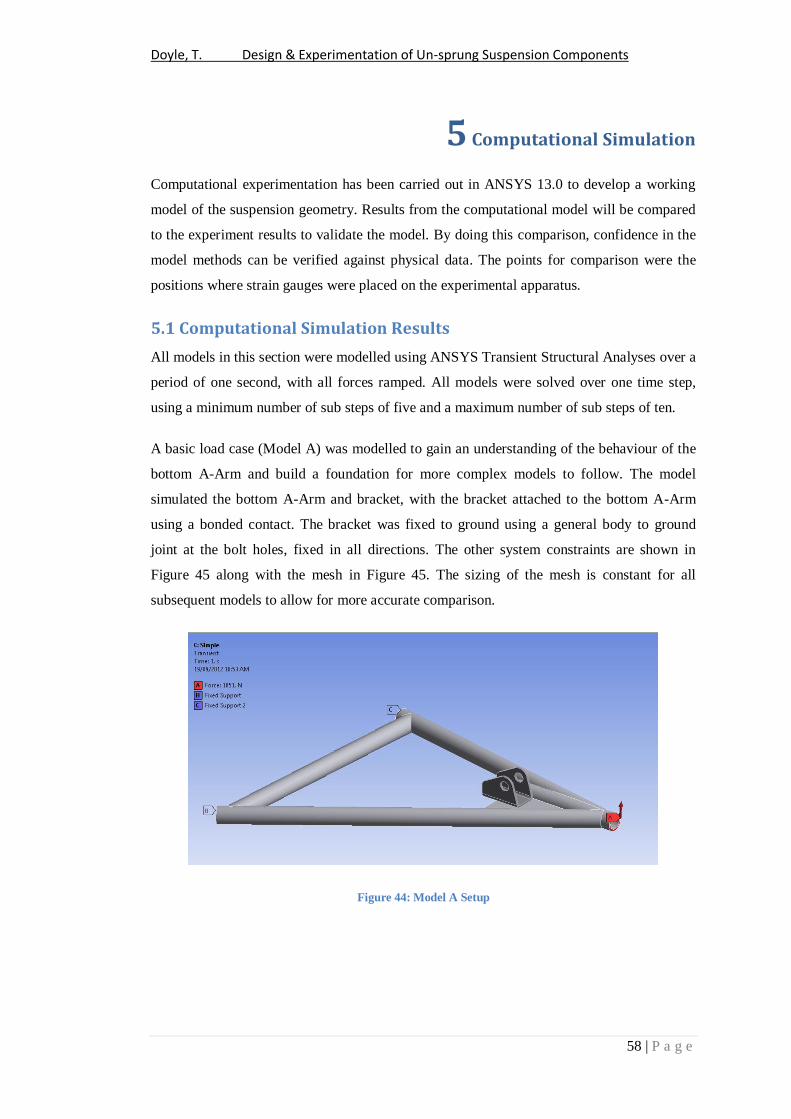
Doyle, T. Design & Experimentation of Un-sprung Suspension Components
58 | P a g e
5 Computational Simulation
Computational experimentation has been carried out in ANSYS 13.0 to develop a working
model of the suspension geometry. Results from the computational model will be compared
to the experiment results to validate the model. By doing this comparison, confidence in the
model methods can be verified against physical data. The points for comparison were the
positions where strain gauges were placed on the experimental apparatus.
5.1 Computational Simulation Results
All models in this section were modelled using ANSYS Transient Structural Analyses over a
period of one second, with all forces ramped. All models were solved over one time step,
using a minimum number of sub steps of five and a maximum number of sub steps of ten.
A basic load case (Model A) was modelled to gain an understanding of the behaviour of the
bottom A-Arm and build a foundation for more complex models to follow. The model
simulated the bottom A-Arm and bracket, with the bracket attached to the bottom A-Arm
using a bonded contact. The bracket was fixed to ground using a general body to ground
joint at the bolt holes, fixed in all directions. The other system constraints are shown in
Figure 45 along with the mesh in Figure 45. The sizing of the mesh is constant for all
subsequent models to allow for more accurate comparison.
Figure 44: Model A Setup

Doyle, T. Design & Experimentation of Un-sprung Suspension Components
59 | P a g e
Figure 45: Model A Mesh
The force applied to the end of the A-Arm equals the reaction force that would have
occurred during the experimental testing at a weight of 70kg (1051N at contact patch). This
allows all results to be compared to the 70kg strain results. The strain results from the
computational simulation are in agreement with those from the experimental testing, with
the top of the A-Arm being in negative bending. The strain results from this simulation are
shown in Figure 46, with the strain shown at nodes close to the location of the strain gauges
used in the experiment (blue probes). The green highlighted probes show the location where
the strain is approximately the same as the experimental data. In Table 12 the strain results
from the computational model are compared against the experimental strain data.
Figure 46: Model A Strain Results

Doyle, T. Design & Experimentation of Un-sprung Suspension Components
60 | P a g e
Table 12: Model A, Computational and Experimental Strain Comparison
Strain Gauge Strain με
Error %
Experimental Computational
1 327 272 16.82
2 349 303 13.18
From the error percentages shown in Table 12, the lowest error is 13.18% in comparison to
the 70kg experimental load case. This error is expected to be due to the bracket constraint,
having the bracket fixed at the bolt holes hinders the bending of the A-Arm.
The same model was simulated again including the push rod to see what effect the push rod
had on the strain results (Figure 47) (Model B). The push rod was constrained to the bracket
using a general body to body joint.
Figure 47: Model B Setup and Mesh
The strain results are shown in Figure 48 and the results are compared in Table 13. The error
percentage for this model is much less than Model A. However, the strain for the push rod is
over conservative with a 56.92% error. This may be due to the spring not being included in
the model or the push rod constraints.

Doyle, T. Design & Experimentation of Un-sprung Suspension Components
61 | P a g e
Figure 48: Model B Strain Results
Table 13: Model B, Computational and Experimental Strain Comparison
Strain Gauge Strain με
Error % Experimental Computational
1 327 304 7.03
2 349 343 1.72
6 65 102 -56.92
Below in Figure 49(a), the exaggerated deformation of the bottom A-Arm and push rod are
shown. The deformation of the bottom A-Arm is as expected with the largest bending
occurring around the stiffness change. However, the deformation for the push rod is not
correct; Figure 49(b). On the apparatus the push rod is connected via tie rods which only
restrain movement in one direction. Using general body to body joints in the model restrains
the push rod in three directions. This caused the push rod to bend in an S shape.
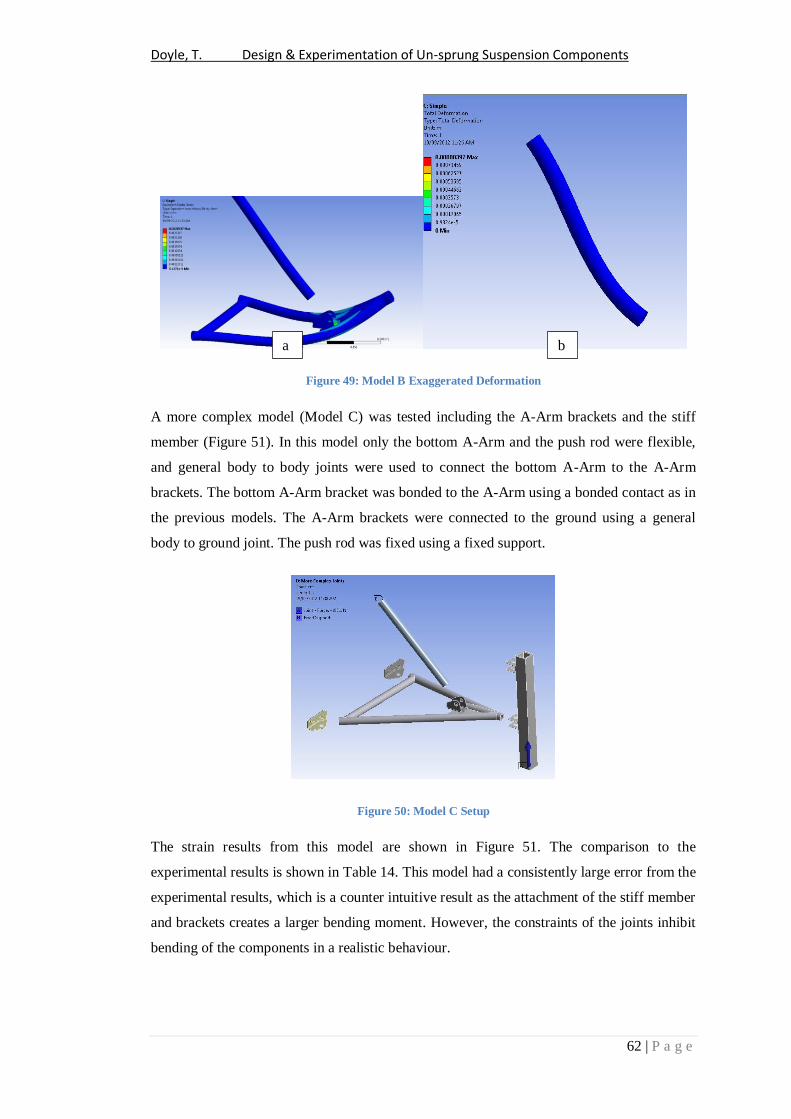
Doyle, T. Design & Experimentation of Un-sprung Suspension Components
62 | P a g e
Figure 49: Model B Exaggerated Deformation
A more complex model (Model C) was tested including the A-Arm brackets and the stiff
member (Figure 51). In this model only the bottom A-Arm and the push rod were flexible,
and general body to body joints were used to connect the bottom A-Arm to the A-Arm
brackets. The bottom A-Arm bracket was bonded to the A-Arm using a bonded contact as in
the previous models. The A-Arm brackets were connected to the ground using a general
body to ground joint. The push rod was fixed using a fixed support.
Figure 50: Model C Setup
The strain results from this model are shown in Figure 51. The comparison to the
experimental results is shown in Table 14. This model had a consistently large error from the
experimental results, which is a counter intuitive result as the attachment of the stiff member
and brackets creates a larger bending moment. However, the constraints of the joints inhibit
bending of the components in a realistic behaviour.
a b

Doyle, T. Design & Experimentation of Un-sprung Suspension Components
63 | P a g e
Figure 51: Model C Strain Results
Table 14: Model C, Computational and Experimental Comparison
Strain Gauge Strain με
Error %
Experimental Computational
1 327 114 65.14
2 349 112 67.91
6 65 7.5 88.46
A further model similar to Model C (Figure 52) was simulated instead with tie rods and
contacts used in place of joints as it is expected that the joints limit the movement of the
model (Model D). The tie rods were included in the model as rigid, and a force was applied
at the end of the bottom A-Arm to simulate loading form the stiff member. From the
comparison of the strain results in Table 15, this model had a reduced error at strain gauge
locations 1, 2 and 6 in comparison to Model C.
Figure 52: Model D Setup and Strain Results

Doyle, T. Design & Experimentation of Un-sprung Suspension Components
64 | P a g e
Table 15: Model D, Computational and Experimental Comparison
Strain Gauge Strain με
Error % Experimental Computational
1 327 245 25.08
2 349 261 25.21
6 65 108 -66.15
5.1.1 Further Model Investigation
Model B and Model D were the most accurate models simulated. Further modelling was
undertaken to investigate the accurracy of the model over all of the load weights tested. This
involved further testing at 20, 40 and 60kg load weights. These strain values were then
compared to the respective experimental values (Figure 53, Figure 54 and Figure 55).
The exact values and comparison is shown in
Table 16, Table 17 and Table 18.
Figure 53: Strain Gauge 1, Model B and D Strain vs. Experimental Strain
y = 4.46x
0
50
100
150
200
250
300
350
0 20 40 60 80
Stra
in [
με]
Weight Load [kg]
Strain Gauge 1
Model B
Strain Gauge 1
Model D
Poly. (Model B)
Linear (Strain Gauge 1)
Poly. (Model D)

Doyle, T. Design & Experimentation of Un-sprung Suspension Components
65 | P a g e
Table 16: Strain Gauge 1, Model B and D vs. Experimental Strain
Weight
Load [kg]
Experimental
Data [με]
Model B
Strain [με]
Model B
Error %
Model D
Strain [με]
Model D
Error %
20 79 57.7 26.96 68.3 13.54
40 175 118 32.57 139 20.57
60 256 178 30.47 209 18.36
70 327 304 7.03 245 25.08
Figure 54: Strain Gauge 2, Model B and D Strain vs. Experimental Strain
y = 4.8067x
0
50
100
150
200
250
300
350
400
0 20 40 60 80
Stra
in [
με]
Weight Load [kg]
Strain Gauge 2
Model B
Strain Gauge 2
Model D
Poly. (Model B)
Linear (Strain Gauge 2)
Poly. (Model D)

Doyle, T. Design & Experimentation of Un-sprung Suspension Components
66 | P a g e
Table 17: Strain Gauge 2, Model B and D vs. Experimental Strain
Weight
Load [kg]
Experimental
Data [με]
Model B
Strain [με]
Model B
Error %
Model D
Strain [με]
Model D
Error %
20 89 58.9 33.82 68.50 23.03
40 188 121 35.64 135.00 28.19
60 279 178 36.2 214.00 23.30
70 349 343 1.72 261.00 25.21
Figure 55: Strain Gauge 6, Model B and D Strain vs. Experimental Strain
y = 0.8886x
0
20
40
60
80
100
120
0 20 40 60 80
Stra
in [
με]
Weight Load [kg]
Strain Gauge 6
Model B
Strain Gauge 6
Model D
Poly. (Model B)
Linear (Strain Gauge 6)
Poly. (Model D)

Doyle, T. Design & Experimentation of Un-sprung Suspension Components
67 | P a g e
Table 18: Strain Gauge 6, Model B and D vs. Experimental Strain
Weight
Load [kg]
Experimental
Data [με]
Model B
Strain [με]
Model B
Error %
Model D
Strain [με]
Model D
Error %
20 15 21.3 -42 36.00 -140.00
40 34 39 -14.71 70.00 -105.88
60 52 62.4 -20 102.00 -96.15
70 65 102 -56.92 108.00 -66.15
5.1.2 Further Push Rod Simulation
The push rod deformation in Figure 49 was not as expected. Further investigations were
made into this result (Figure 56). It was found that strain located more on the side of the
push rod. The value was closer to that found from experimental strain gauge 6. This
discrepancy in the results may be due to the positioning of the strain gauges on the push rod
in the experiment. Their positioning may not have been in the same plane as the bending.
Figure 56: Model B Push Rod Result

Doyle, T. Design & Experimentation of Un-sprung Suspension Components
68 | P a g e
A simple push rod was analysed in a separate model using forces determined from a joint
probe between the push rod and bottom A-Arm from Model B. The tensile force from the
joint probe and the maximum spring force (147N Figure 43) were applied to the push rod
using a simple joint constraint at one end. The strain results (Figure 57) correlate with the
results from Model B.
Figure 57: Simple Push Rod Analysis using Realistic Constraints
Basic hand calculations on the push rod using the same tensile force (Appendix A6.2)
determined the strain to be 1.89E-4. All three strain results are compared in Table 19. The
most accurate technique from this comparison was the simple push rod model.
Table 19: Push Rod Modelling Comparison
Technique Strain [με] % Variation to Experimental Strain Value (65με)
Model B 118 81.5
Simple Push Rod 87 33.8
Hand Calculation 123 89

Doyle, T. Design & Experimentation of Un-sprung Suspension Components
69 | P a g e
5.2 Computational Simulation Discussion
From the graphical results for strain gauge 1, 2 and 6 in Figure 53, Figure 54 and Figure 55,
the results of the experimental strain can be approximated by a linear equation. The
computational data for load cases 20, 40 and 60 kg can also be approximated by a linear
equation. This is evident from the relatively consistent error between the computational and
experimental strain for these weight loads (
Table 16, Table 17 and Table 18). The linear properties of the material used in the analysis
are the reason for this linear strain relationship if the same nodes are chosen. Further
computational testing using non-linear material properties may be required if the
experimental strain values cannot be approximated using a linear relationship.
The computational strain results for Model B at weight load 70kg vary to the other load
weights, by either greatly increasing the accuracy or decreasing the accuracy. This may be
due to the wrong strain node being chosen or there being a large change in force between
load weight 60 kg and 70kg. Further investigation is required to determine the reasoning for
this error and a more accurate method for determining the strain at particular nodes found.
Model D is the most consistent in comparison to Model B (Table 16, Table 17 and Table
18). The error for Model D for strain gauges 1 and 2 is approximately 20%, whereas Model
B is approximately 30% with only the 70kg test having much more accurate results. Both
models fail to accurately predict the strain of the push rod. Model D, with the contacts, is
consistently a better modelling method for the bottom A-Arm.
From the comparison in Table 19 the most accurate method of modelling for the push rod is
the use of the simple model. However, this method will not take into account buckling.
Further investigation is required to fully understand the modelling of the push rod. For future
calibration of push rod modelling, tensile testing of the push rod should be undertaken to
develop a force strain relationship.
Errors in the modelling or experimental technique may have caused errors in the results. One
main error that may have caused discrepancies in the computational modelling is the method
by which the strain values were found at specific locations. A probe was used to find the
strain at the desired location; however, this location may have deviated between models or
tests. This is not ideal, as accuracy in this area is required to develop accurate relationships
between experimental and computational models.

Doyle, T. Design & Experimentation of Un-sprung Suspension Components
70 | P a g e
From the modelling in this section it was found, that in terms of connections, joints are
easier to get solutions. However, the solution may not be accurate. Care must be taken in the
constraints used in the joint, to not over constrain the model. Contacts require more effort to
solve but in general, offer a more accurate solution. This was shown in the results by
comparing Model C against Model D.

Doyle, T. Design & Experimentation of Un-sprung Suspension Components
71 | P a g e
6 Upright Verification
As a part of this report the, 2011 Upright design (Figure 58) was modified and verified for a
larger hub shaft. The original upright was designed to house a bearing for a 30mm outside
diameter hub shaft, however, this was found by the 2011 Hub Shaft design team to be
inadequate. Modifications to the design were verified in ANSYS using the load components
shown in Table 1 on the upright, hub shaft and wheel assembly.
Figure 58: 2011 Upright Design
Due to the upright material block of Alumec already being purchased, the upright was
redesigned to fit a bigger bearing, whilst still being able to be machined from the same
Alumec block of 500mm x 250mm x 72mm using the configuration in Figure 59. From the
2011 Upright report, the bearing recommended was a SKF Tapered bearing of ID 40mm and
OD 68mm (32008x). This was the maximum allowable bearing bore as a larger bearing
would require the brake caliper mounts to be moved.

Doyle, T. Design & Experimentation of Un-sprung Suspension Components
72 | P a g e
Figure 59: Upright Machining Configuration
The other main reason for the upright redesign was to make the upright easier to
manufacture. The original design assumed that the CNC milling machine in the JCU
workshop could be used, however this was not the case. Therefore the upright design and
shape was altered to make use of other techniques such as water jet cutting and conventional
milling techniques.
The 2012 upright design (Figure 60) was chosen as it is a more cost effective design and
utilises cheaper forms of manufacturing due to its less complex shape in comparison to the
2011 upright (Figure 58). The 2012 upright is also 3.3mm wider to reduce bending moment
reaction forces from the hub shaft. The new upright also satisfies the same constraints as the
2011 upright and new constraints as previous outlined. For full drawings refer to Appendix
A2. The constraints as outlined by the 2011 Upright Report (Hunter et al.[1]) that have been
satisfied by the 2012 upright design are:
Distance between the top and bottom A-Arm mounting points is 155 mm.
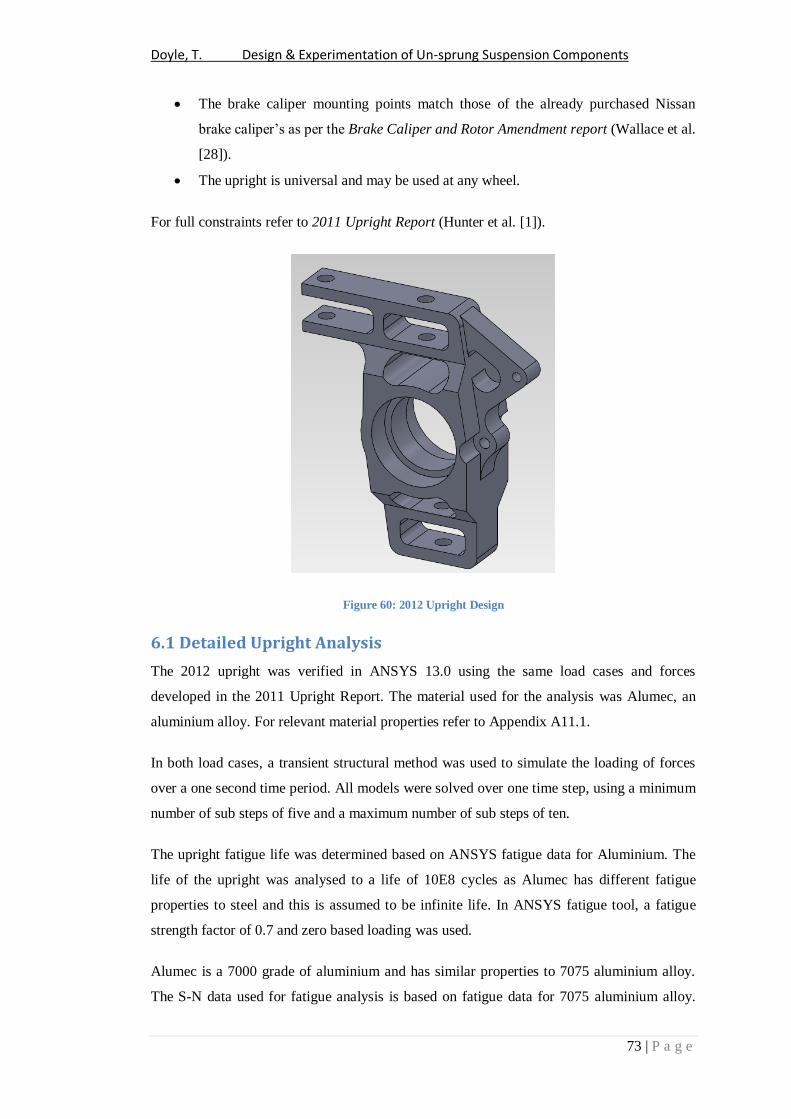
Doyle, T. Design & Experimentation of Un-sprung Suspension Components
73 | P a g e
The brake caliper mounting points match those of the already purchased Nissan
brake caliper’s as per the Brake Caliper and Rotor Amendment report (Wallace et al.
[28]).
The upright is universal and may be used at any wheel.
For full constraints refer to 2011 Upright Report (Hunter et al. [1]).
Figure 60: 2012 Upright Design
6.1 Detailed Upright Analysis
The 2012 upright was verified in ANSYS 13.0 using the same load cases and forces
developed in the 2011 Upright Report. The material used for the analysis was Alumec, an
aluminium alloy. For relevant material properties refer to Appendix A11.1.
In both load cases, a transient structural method was used to simulate the loading of forces
over a one second time period. All models were solved over one time step, using a minimum
number of sub steps of five and a maximum number of sub steps of ten.
The upright fatigue life was determined based on ANSYS fatigue data for Aluminium. The
life of the upright was analysed to a life of 10E8 cycles as Alumec has different fatigue
properties to steel and this is assumed to be infinite life. In ANSYS fatigue tool, a fatigue
strength factor of 0.7 and zero based loading was used.
Alumec is a 7000 grade of aluminium and has similar properties to 7075 aluminium alloy.
The S-N data used for fatigue analysis is based on fatigue data for 7075 aluminium alloy.
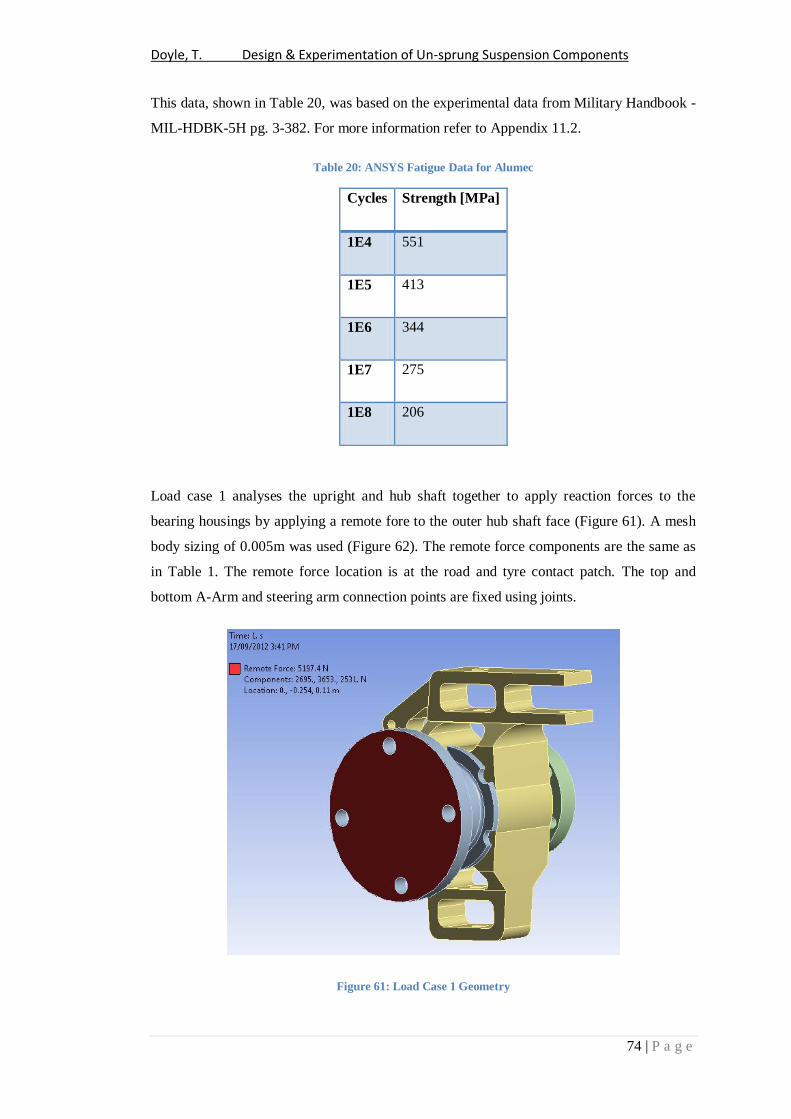
Doyle, T. Design & Experimentation of Un-sprung Suspension Components
74 | P a g e
This data, shown in Table 20, was based on the experimental data from Military Handbook -
MIL-HDBK-5H pg. 3-382. For more information refer to Appendix 11.2.
Table 20: ANSYS Fatigue Data for Alumec
Cycles Strength [MPa]
1E4 551
1E5 413
1E6 344
1E7 275
1E8 206
Load case 1 analyses the upright and hub shaft together to apply reaction forces to the
bearing housings by applying a remote fore to the outer hub shaft face (Figure 61). A mesh
body sizing of 0.005m was used (Figure 62). The remote force components are the same as
in Table 1. The remote force location is at the road and tyre contact patch. The top and
bottom A-Arm and steering arm connection points are fixed using joints.
Figure 61: Load Case 1 Geometry

Doyle, T. Design & Experimentation of Un-sprung Suspension Components
75 | P a g e
Figure 62: Load Case 1 Mesh
With the upright filleted, the highest stress areas are around the top and bottom A-Arm
connection bolt holes (Figure 63). There is a stress concentration around the bottom of the
upright as shown, however, the critical stress is only 95 MPa resulting in a fatigue safety
factor of 2.4 (Figure 64).

Doyle, T. Design & Experimentation of Un-sprung Suspension Components
76 | P a g e
Figure 63: Load Case 1 Stress
Figure 64: Load Case 1 Fatigue Safety Factor
Load case 2 analyses the upright under loads applied at the bolt holes. The loads for the bolt
holes are taken from Table 4. The model setup is shown in Figure 65. The loads are applied
to the whole bolt hole using a force and the upright is supported using two cylindrical
supports in place of the bearings. A mesh of increased relevance was used at the bolt holes
to increase the accuracy of the results (Figure 66).
Figure 65: Forces Analysed for Load Case 2

Doyle, T. Design & Experimentation of Un-sprung Suspension Components
77 | P a g e
Figure 66: Load Case 2 Mesh
This load case is more critical than load case 1 as it has a higher maximum stress of 117
MPa located at the top of the upright (Figure 67). It is also evident that much more of the
upright is stressed. This results in a fatigue safety factor of 1.9 as shown in Figure 68.

Doyle, T. Design & Experimentation of Un-sprung Suspension Components
78 | P a g e
Figure 67: Load Case 2 Stress
Figure 68: Load Case 2 Fatigue Safety Factor
6.3 Upright Recommendations
From the ANSYS analysis, the 2012 Upright design is suitable for application on Omega in
FSAE competition as the critical fatigue safety factor from load case 1 and 2 is 1.9.
The uprights are currently being manufactured. The Alumec block has been water jet cut to
the 2D shape of the upright (Figure 69) with milling to follow to machine the bearing
housing, brake caliper mount and top and bottom to the correct thickness. The bolt holes for
the steering arm, A-Arm’s and brake caliper also need to drilled. For the full upright
manufacturing drawing refer to Appendix A2.
Figure 69: 2012 Current Progress of Upright

Doyle, T. Design & Experimentation of Un-sprung Suspension Components
79 | P a g e
7 Hub Shaft Redesign
The hub shaft requires further design before fabrication, as the 2011 design analysis found
that a hub shaft diameter of 30 mm was not sufficient to withstand the required load cases.
This project aimed at redesigning the hub shafts with new load cases based on the load
components shown in Table 1 and Table 2. The aim of the design was to create a hub shaft
design that is cost effective by utilising machining techniques available in the JCU
mechanical workshop. The main material considered for this application is 4140 steel as it
has high strength properties and is widely used for rotating shafts.
The hub shaft is responsible for the transmission of torque from the engine and provides
support for the rotating wheel. A general assembly with other components associated with
the hub shaft are shown in Figure 70.
Figure 70: Hub Shaft General Assembly
The hub shaft design must meet several constraints in order to be used on the Omega car.
These constraints are either outlined in the FSAE Rules or are constraints based on the
components that have already been purchased to fit to the hub shaft. These constraints are:
The hub shaft must bolt on to the wheel by 4 x M12 bolts, equally spaced at a radius
of 50mm.
The constant velocity joint tripod must bolt on to the inner side of the hub shaft
using 6 x M10 bolts equally spaced at a radius of 37mm.
The outer bore of the hub shaft where the bearings are placed may be no greater than
40mm.

Doyle, T. Design & Experimentation of Un-sprung Suspension Components
80 | P a g e
The distance between the outer bearing and the inner surface of the hub shaft wheel
flange must be minimised but no less than 52.5mm. This is due to the positioning of
the brake caliper and its size and will stipulate the positioning of the brake rotor.
The brake rotor must be attachable to the hub shaft via 6 half hole notches at an
outer radius of 45mm. The radius of the holes is 6 mm.
The outer distance between the bearings is 60mm.
The rear hub shaft must be capable of transferring torque to the wheel.
An initial hub shaft design that satisfied these constraints is shown in Figure 71. This design
(Hub Shaft 3.0) was chosen as it a suitable solution to the design constraints, whilst
achieving a reduced complexity in shape to allow for easier fabrication. The hub shaft was
designed to reduce waste of material and will be made up of several parts that will be welded
or fitted together to achieve the overall shape. The method chosen for torque transmission is
a keyway as it is easier to manufacture and is capable of being done at the JCU Mechanical
Workshop. The keyway width and height dimensions conform to AS 2037 – 1977 however
the length of the keyway does not. The key and keyway was analysed to ensure that this is
an appropriate method for this application.
Figure 71: Exploded Conceptual View of Hub Shaft 3.0
Loads on the hub shaft vary between the front and rear of the car. The most critical load case
for the hub shaft on the front of the car is under braking, bump and cornering when the car
Bending Diameter
(Spindle)
CV Section
Hub Shaft Outer
Flange
Brake Rotor
Attachment
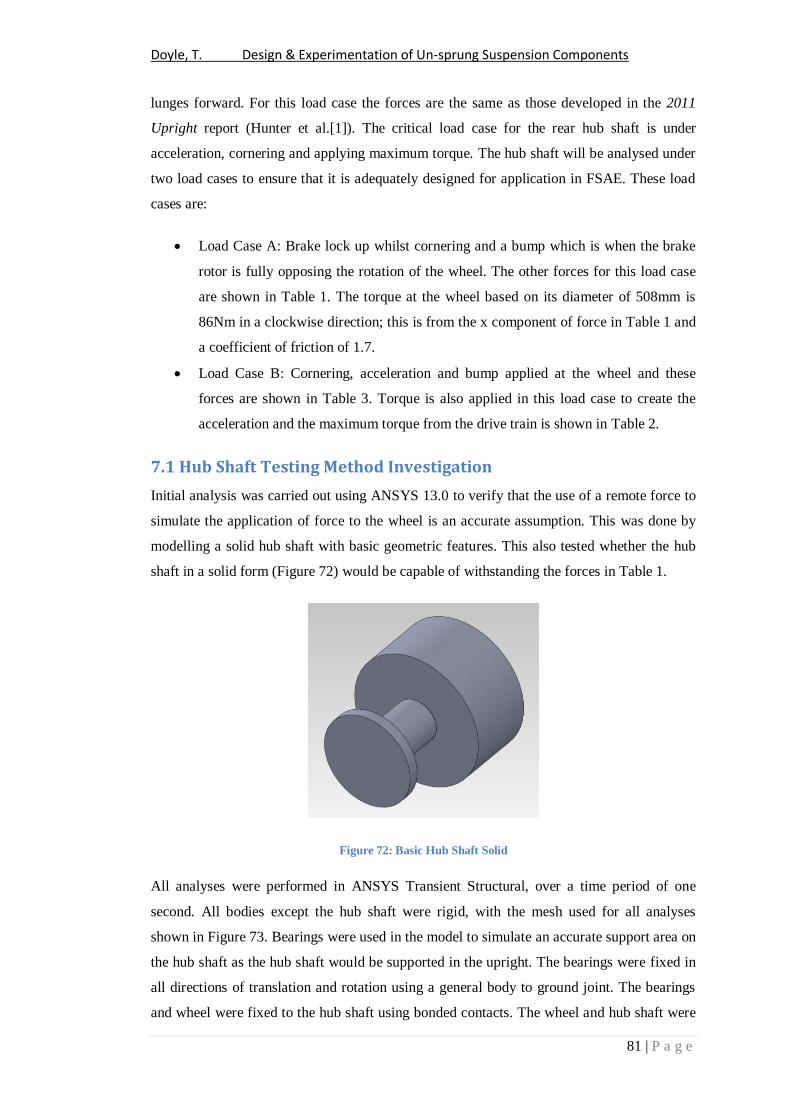
Doyle, T. Design & Experimentation of Un-sprung Suspension Components
81 | P a g e
lunges forward. For this load case the forces are the same as those developed in the 2011
Upright report (Hunter et al.[1]). The critical load case for the rear hub shaft is under
acceleration, cornering and applying maximum torque. The hub shaft will be analysed under
two load cases to ensure that it is adequately designed for application in FSAE. These load
cases are:
Load Case A: Brake lock up whilst cornering and a bump which is when the brake
rotor is fully opposing the rotation of the wheel. The other forces for this load case
are shown in Table 1. The torque at the wheel based on its diameter of 508mm is
86Nm in a clockwise direction; this is from the x component of force in Table 1 and
a coefficient of friction of 1.7.
Load Case B: Cornering, acceleration and bump applied at the wheel and these
forces are shown in Table 3. Torque is also applied in this load case to create the
acceleration and the maximum torque from the drive train is shown in Table 2.
7.1 Hub Shaft Testing Method Investigation
Initial analysis was carried out using ANSYS 13.0 to verify that the use of a remote force to
simulate the application of force to the wheel is an accurate assumption. This was done by
modelling a solid hub shaft with basic geometric features. This also tested whether the hub
shaft in a solid form (Figure 72) would be capable of withstanding the forces in Table 1.
Figure 72: Basic Hub Shaft Solid
All analyses were performed in ANSYS Transient Structural, over a time period of one
second. All bodies except the hub shaft were rigid, with the mesh used for all analyses
shown in Figure 73. Bearings were used in the model to simulate an accurate support area on
the hub shaft as the hub shaft would be supported in the upright. The bearings were fixed in
all directions of translation and rotation using a general body to ground joint. The bearings
and wheel were fixed to the hub shaft using bonded contacts. The wheel and hub shaft were

Doyle, T. Design & Experimentation of Un-sprung Suspension Components
82 | P a g e
bonded as it is assumed that the bolts will be tightened to a sufficient torque such that the
friction between the hub shaft and wheel effectively bonds them together.
Figure 73: Force Application Verification Mesh
The wheel was attached to ground using a general body to ground joint with all translation
directions and rotations set to free. This allows the wheel to apply force in all directions,
including forces due to moments at the tyre contact patch. The force components are the
same as those in Table 1 (Figure 74).
Figure 74: Forces on Wheel using a General Body to Ground
Another force application model applied the forces to the tyre by using a flat contact patch
instead of applying the force to the tyre circumference (Figure 75). The flat contact patch
was attached to ground using the same method as the previous model.

Doyle, T. Design & Experimentation of Un-sprung Suspension Components
83 | P a g e
Figure 75: Force Application for Wheel Contact Patch Model
Figure 76: Fatigue Safety Factor for,
LEFT: Wheel Circumference Force Loading RIGHT: Wheel Contact Patch Force Loading
The final model tested was applying the force to the hub shaft through a remote force
situation at the contact patch between the tyre and the ground. The same force components
were applied as in Table 1 with the same contact patch location used for the upright
verification (Figure 77).

Doyle, T. Design & Experimentation of Un-sprung Suspension Components
84 | P a g e
Figure 77: Remote Force Location
The fatigue safety factor result for the remote force (Figure 78) shows that there is a reduced
safety factor around the area where the bearing is in contact with the hub shaft. This is
because the remote force is loading the edge of the hub shaft axially, radially and by a
moment from the contact patch. This is a more realistic application of the force as there is a
moment on the tyre due to the lateral forces on it. This force is not apparent when the force
is simply applied to the wheel as in the previous two models.
Figure 78: Fatigue Safety Factor for Remote Force Loading

Doyle, T. Design & Experimentation of Un-sprung Suspension Components
85 | P a g e
For all future analyses of the hub shaft, a remote force will be used to apply loads that would
occur due to loading from the wheel. By using a remote force to replicate the loading of the
hub shaft, the wheel does not need to be included in the model. This is expected to reduce
computational time of the model.
7.2 Hub Shaft Detailed Design
Analyses were carried out on the Hub Shaft 3.0 to ensure that its design was adequate for the
application. In this section, the hub shaft will be verified and optimised against load cases A
and B. The final hub shaft design shown in the following results were developed from
iteration and continuous optimization of the hub shaft shape. This was done by reducing the
diameter between the brake rotor and the hub shaft face (bending diameter). The results
shown in this section will be of the final hub shaft design only.
The material properties used for ANSYS are based on the material properties in Appendix
A11.3. The fatigue data used is shown in Table 21; these strength values were based on a
theoretical S-N curve for ferrous materials.
Table 21: 4140 Steel Fatigue Properties
Cycles Strength Equation
10 930MPa Sut
1000 837Mpa 0.9Sut
1,000,000 465Mpa 0.5Sut
The hub shaft fatigue life was determined based on imported fatigue data for 4140 steel
(Table 21). The life of the hub shaft was analysed to a life of 10E6 cycles as this is assumed
as infinite life. In ANSYS fatigue tool, a fatigue strength factor of 0.7 and fully reversed
loading were used.
The hub shaft was modelled in Transient Structural over a period of one second; all forces
were ramped. All models were solved over one time step, using a minimum number of sub
steps of five and a maximum number of sub steps of ten.
The load case A mesh (Figure 79), was used for all of the models involving the hub shaft.
The mesh sizing used was 0.003m. The load case A model (Figure 80) constraints used in

Doyle, T. Design & Experimentation of Un-sprung Suspension Components
86 | P a g e
the model are a remote force at the outer hub shaft face, located at the wheel contact patch.
The remote force was applied to the whole surface as it is assumed that the bolt tightness is
sufficient to efficiently bond the hub shaft to the wheel. Compression only supports were
used at the connection points between the hub shaft and the brake rotor. The bearings were
set as rigid and fixed to ground using a general body to ground joint. A moment force was
also applied to the outer hub shaft face to simulate the torque of the tyre before slip.
Figure 79: Load Case A Mesh and Model
Figure 80: Load Case A Setup
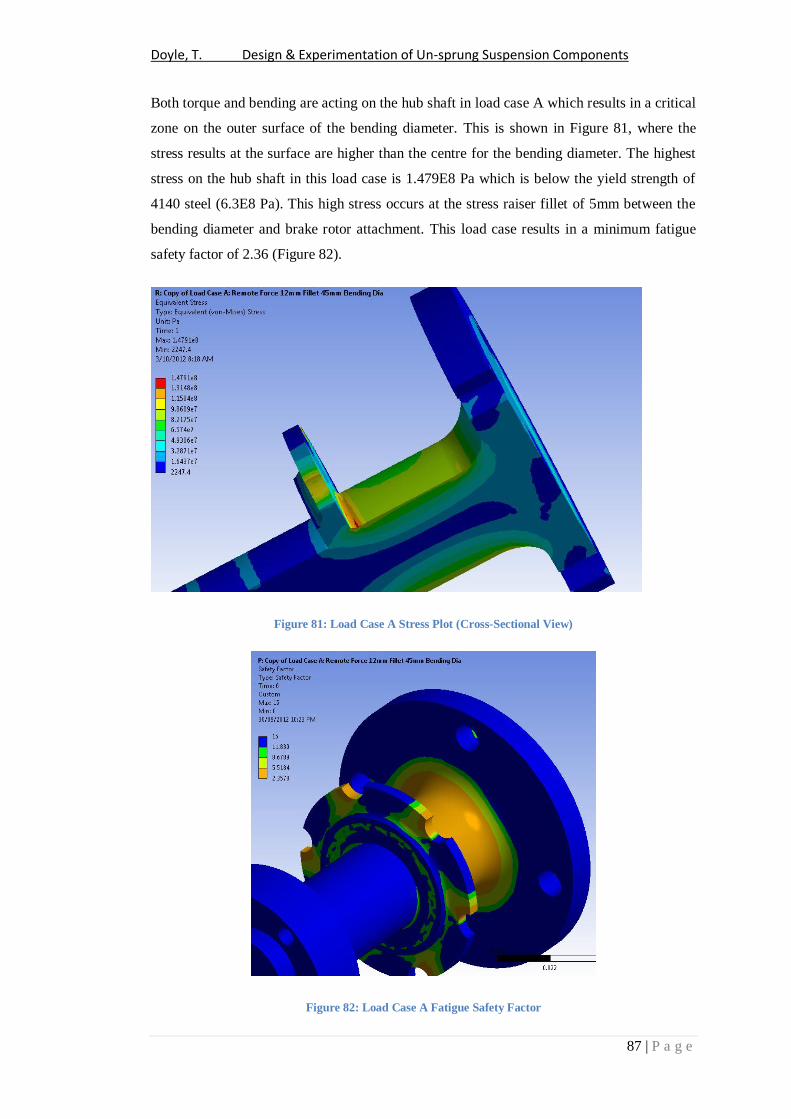
Doyle, T. Design & Experimentation of Un-sprung Suspension Components
87 | P a g e
Both torque and bending are acting on the hub shaft in load case A which results in a critical
zone on the outer surface of the bending diameter. This is shown in Figure 81, where the
stress results at the surface are higher than the centre for the bending diameter. The highest
stress on the hub shaft in this load case is 1.479E8 Pa which is below the yield strength of
4140 steel (6.3E8 Pa). This high stress occurs at the stress raiser fillet of 5mm between the
bending diameter and brake rotor attachment. This load case results in a minimum fatigue
safety factor of 2.36 (Figure 82).
Figure 81: Load Case A Stress Plot (Cross-Sectional View)
Figure 82: Load Case A Fatigue Safety Factor
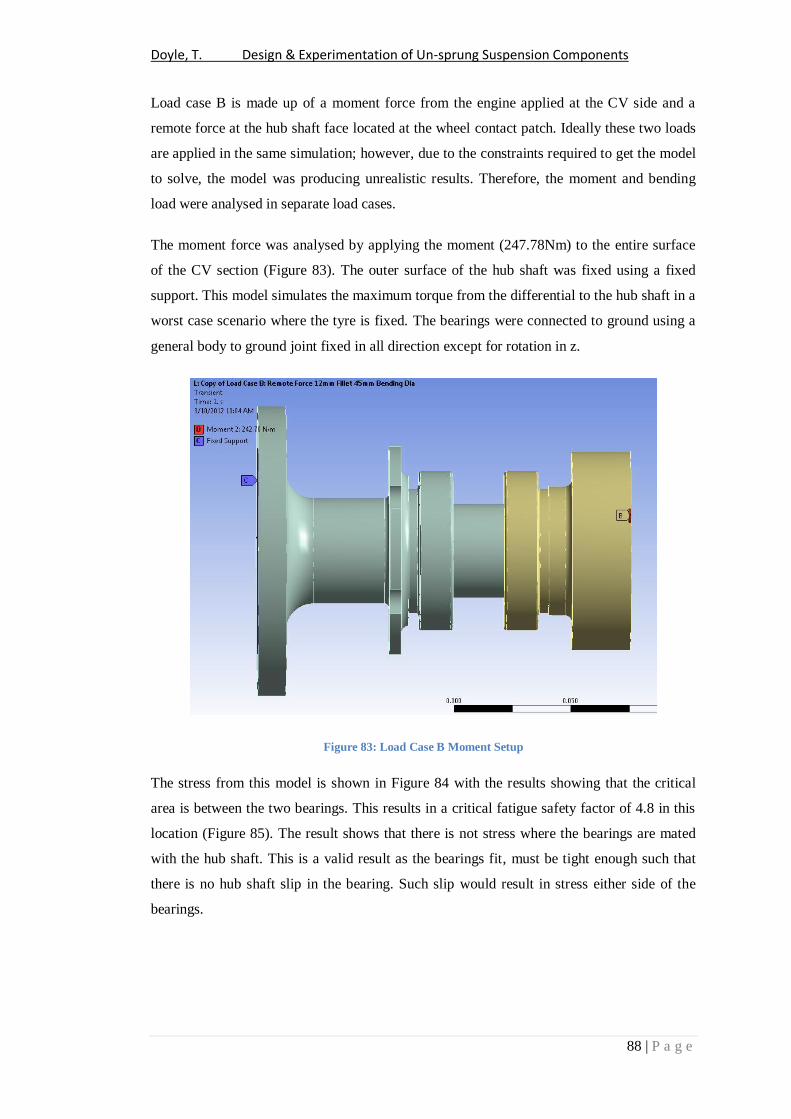
Doyle, T. Design & Experimentation of Un-sprung Suspension Components
88 | P a g e
Load case B is made up of a moment force from the engine applied at the CV side and a
remote force at the hub shaft face located at the wheel contact patch. Ideally these two loads
are applied in the same simulation; however, due to the constraints required to get the model
to solve, the model was producing unrealistic results. Therefore, the moment and bending
load were analysed in separate load cases.
The moment force was analysed by applying the moment (247.78Nm) to the entire surface
of the CV section (Figure 83). The outer surface of the hub shaft was fixed using a fixed
support. This model simulates the maximum torque from the differential to the hub shaft in a
worst case scenario where the tyre is fixed. The bearings were connected to ground using a
general body to ground joint fixed in all direction except for rotation in z.
Figure 83: Load Case B Moment Setup
The stress from this model is shown in Figure 84 with the results showing that the critical
area is between the two bearings. This results in a critical fatigue safety factor of 4.8 in this
location (Figure 85). The result shows that there is not stress where the bearings are mated
with the hub shaft. This is a valid result as the bearings fit, must be tight enough such that
there is no hub shaft slip in the bearing. Such slip would result in stress either side of the
bearings.

Doyle, T. Design & Experimentation of Un-sprung Suspension Components
89 | P a g e
Figure 84: Load Case B Torque Only Stress (Cross-Sectional View)
Figure 85: Load Case B Moment Fatigue Safety Factor
The second model used to simulate load case B is the application of the remote force to the
outer surface of the hub shaft located at the tyre contact patch (Figure 86). The bearings
were connected to ground using a general body to ground joint fixed in all directions.

Doyle, T. Design & Experimentation of Un-sprung Suspension Components
90 | P a g e
Figure 86: Load Case B Remote Force Setup
Like load case A the critical area of the model is the outer surface of the bending diameter
(Figure 87). The highest stress is located between the brake rotor attachment and the bending
diameter (1.23E8 Pa). This results in a critical fatigue safety factor of 2.8 in this location.
Figure 87: Load Case B Remote Force Stress (Cross-Sectional View)

Doyle, T. Design & Experimentation of Un-sprung Suspension Components
91 | P a g e
Figure 88: Load Case B Remote Force Stress
The critical safety factor for the rear hub shaft is 2.8 under the remote force load. It is
assumed that a combined load case would not significantly reduce the safety factor. This
assumption is made based on the locations of critical stress being in different locations
between the two models, evident from the locations of the critical safety factors. There
would be little stress combination in the critical areas of the two models. For example, from
basic stress addition, the maximum stress at the bending diameter would be approximately
1.95E8 Pa. Still well below the yield criteria of 4140 steel.
7.3 Keyway Detailed Analysis
The CV section was analysed under the maximum torque load to verify that its design is
capable of this application. The moment load was applied to the bolt holes as shown in
Figure 89, with a cylindrical support at the centre of the CV section. One edge of the keyway
was fixed to simulate a worst case scenario where the hub shaft is fixed, and the key is
preventing movement.

Doyle, T. Design & Experimentation of Un-sprung Suspension Components
92 | P a g e
Figure 89: CV Verification Setup
High stress around the keyway was expected as it creates a large stress concentration point,
however, under fatigue the CV section has a safety factor of 15.
Figure 90: CV Verification Stress
The hub shaft keyway was verified by applying the moment resultant force (12000N) to one
edge of the keyway where the key would be impacting (Figure 91). The hub shaft was
supported by the bearings and fixed at the hub shaft wheel bolt holes. The bearings were set
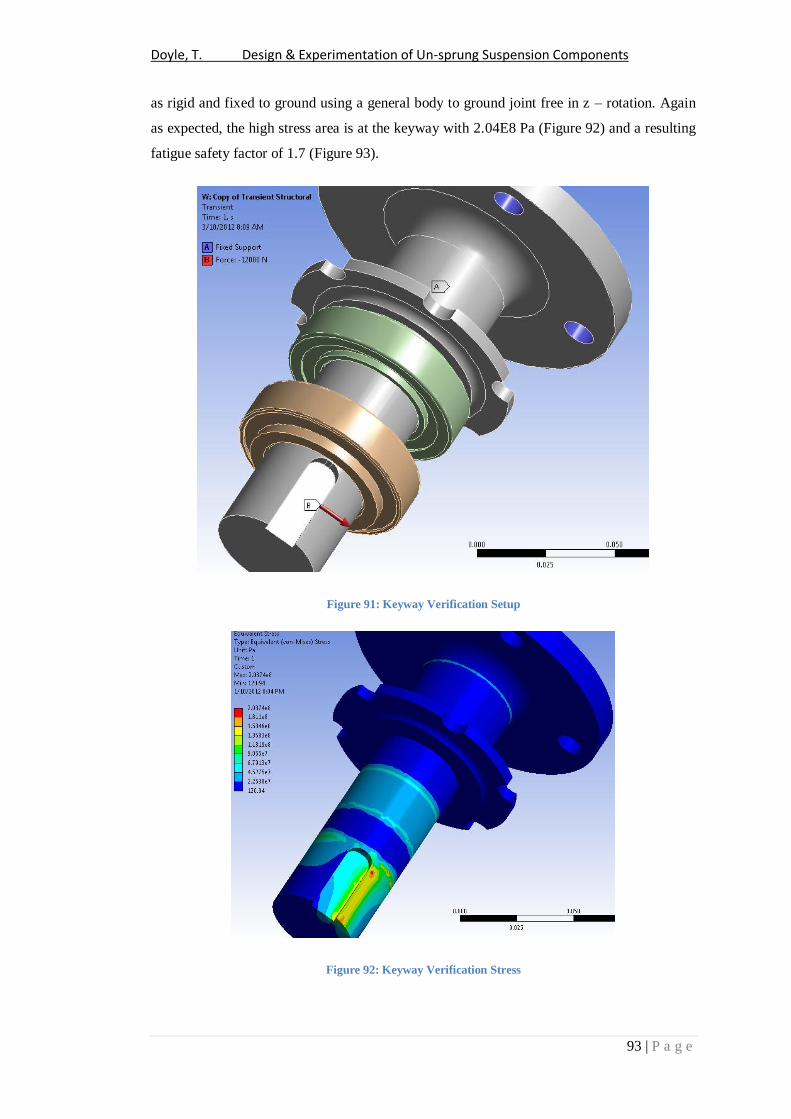
Doyle, T. Design & Experimentation of Un-sprung Suspension Components
93 | P a g e
as rigid and fixed to ground using a general body to ground joint free in z – rotation. Again
as expected, the high stress area is at the keyway with 2.04E8 Pa (Figure 92) and a resulting
fatigue safety factor of 1.7 (Figure 93).
Figure 91: Keyway Verification Setup
Figure 92: Keyway Verification Stress

Doyle, T. Design & Experimentation of Un-sprung Suspension Components
94 | P a g e
Figure 93: Keyway Verification Fatigue Safety Factor
7.3.1 Weld Analysis
As the hub shaft will be made from several sections welded together (Figure 94) it is
important to verify that the stress at these weld points does not exceed the strength of the
weld electrode. For welding of 4140 steel, a Bohler Fox CM 2 Kb welding electrode can be
used as filler material. This electrode has a quenched yield strength of 480Mpa (Section
A.11.4 Welding Properties).
Figure 94: Hub Shaft Weld Locations
Basic hand calculations were done to determine the safety factor for the two critical fillets
(welds) on the hub shaft, the 5mm fillet between the spindle and the brake rotor attachment
and the 12mm fillet between the spindle and hub shaft outer flange. The 5mm weld had a
safety factor of 3.24 and the 12mm a safety factor of 4.89. These calculations were based on
12 mm Weld
5 mm Weld

Doyle, T. Design & Experimentation of Un-sprung Suspension Components
95 | P a g e
the highest stress from the ANSYS analysis at the respective locations. For full calculations
refer to Appendix A6.3
7.4 Hub Shaft Recommendations
From the ANSYS analysis undertaken on the hub shaft shown in Figure 95. This hub shaft
design has been optimised to minimise material and reduce machining costs. It is
recommended that these hub shafts be manufactured using 4140 steel. The torque
transmission method to be used is a key way on the CV side hub shaft section. A key way
was chosen because it is less complex than a spline, reducing manufacturing costs.
Figure 95: Final Hub Shaft Design
For the front hub shafts (Figure 96) the tripod connection flange does not need to be
connected as there is no torque transfer required on the front wheels. Therefore the CV
section is not needed. However, a washer and lock nut are still required to provide a preload
on the bearings.

Doyle, T. Design & Experimentation of Un-sprung Suspension Components
96 | P a g e
Figure 96: Final Front Hub Shaft
To reduce the amount of material wasted during the manufacturing process it is
recommended the hub shaft be made out of multiple sections and welded together as
necessary. An exploded view of all the different components of the hub shaft are shown in
Figure 97. For full hub shaft drawings refer to Appendix A3.
Figure 97: Final Hub Shaft Exploded View

Doyle, T. Design & Experimentation of Un-sprung Suspension Components
97 | P a g e
From the work done throughout this report on the hub shafts it is recommended that the
unsprung mass on the front and rear of the car be designed in the future to accept inboard
brakes. This is recommended as it has multiple advantages for performance and reduce
manufacturing costs of the hub shaft. These advantages are:
Reduce bending moment on the hub shaft as the distance between the upright
bearings and the wheel can be greatly reduced. This will reduce the amount of
material, time, and specialised manufacturing techniques required to make the hub
shaft and reduce weight.
By reducing the weight of the unsprung mass suspension components this is a
benefit to the overall performance and handling of the car.
By moving to inboard brakes, torque transmission and brake mounting geometry will be
required on the front and rear of the car. These modifications can be easily designed into
future frame designs. However, it is expected that the benefits of inboard brakes out-way
those of outboard brakes.

Doyle, T. Design & Experimentation of Un-sprung Suspension Components
98 | P a g e
8 Conclusion
As a part of this project, a suspension test apparatus has been designed, built and tested to
gain experimental data on strain at critical locations of various suspension components. This
apparatus is flexible in its design to allow future suspension assemblies to be tested on this
apparatus. The implementation of this suspension test apparatus will increase safety in
design and allow components to be tested before track testing.
Several computational models have been tested and compared against experimental data to
determine the accuracy of various assumptions made within each model. In future, this will
allow for more accurate design of suspension components.
The upright and hub shaft designs have been verified using computational techniques using
new considerations and modelling simulations from previous years. Both the designs of the
upright and huh shaft (shown assembled in Figure 98) satisfy the requirements for
application in the FSAE competition. It is recommended once fabricated that both designs
are tested using the suspension test apparatus.
Figure 98: Final Thesis Assembly
As a part of this thesis, several areas of future work have been identified. Future research
beyond this thesis may address the following, but not limited to;

Doyle, T. Design & Experimentation of Un-sprung Suspension Components
99 | P a g e
Further experimental testing using the experimental test apparatus with larger load
weights to develop a more accurate strain vs. load equation. More data in this area
will also allow for greater comparison to computational simulations.
Experimental testing involving the hub shaft and upright once fabricated to validate
assumptions made during analysis and verify the designs. This can be achieved by
the use of strain gauges on the hub shaft on the spindle to determine bending
reaction forces.
Further development of computational models in comparison to experimental data to
develop a working model capable of designing A-Arms. Current models in this
thesis have only moderate accuracy to experimental data.
This future work is believed to be beneficial to the development of the Motorsports Team
and to the safety and reliability of future design work involving the suspension.

Doyle, T. Design & Experimentation of Un-sprung Suspension Components
100 | P a g e
9 References
1. Hunter, R., S. Baker, and T. Doyle, Upright Report, 2011. 2. Ikealumba, W., D. Authors, and D. Brendan, JCU Formula SAE
Motorsports Project, 2011. 3. Crouch, J., Design and Simulation of Formula S.A.E Car
Suspension. 2011. 4. Crisp, B. and J. Meehan, JCU Motorsport Suspension Report,
2011. 5. Savage, G., Dealing with crisis – Solving engineering failures in
Formula 1 motor racing. Engineering Failure Analysis, 2010. 17(4): p. 760-770.
6. Savage, G., Sub-critical crack growth in highly stressed Formula 1 race car composite suspension components. Engineering Failure Analysis, 2009. 16(2): p. 608-617.
7. Gary, S., Multi-Axis Suspension Testing. Advanced Materials & Processes, 2007.
8. Pedersen, D., C. Dove, and D. Vellanikaran, FSAE Motor Sports Vehicle JCU Differential Design. 2011.
9. A., J.B. and B. J., Design of Formula SAE Suspension. SAE Technical Series, 2002.
10. Wong, A.J., Design and Optimization of Upright Assemblies for Formula SAE Racecar, in Department of Mechanical and Industrial Engineering2007, University of Toronto: Toronto.
11. McCune, M., et al., Formula SAE Interchangable Independent Rear Suspension Design, 2009.
12. Vehicle Dynamics. 2009 [cited 2012 22/4/2012]; Available from: http://ritzel.siu.edu/courses/302s/vehicle/vehicledynamics.htm.
13. RetroRims. VW Suspension Tuning. 2012; Available from: http://www.retrorims.co.uk/vw-blog/vw-suspension-tuning.
14. Smith, C., Tune to Win, West Aviation Road, Fallbrook, CA: Aero Publiashers, Inc.
15. Centre., B.T.a.E. Camber. 2012; Available from: http://www.barrystyre.co.uk/80100/info.php?p=5.
16. MOOG, Automotive Testing Overview, 2010. 17. MOOG 4-Poster suspension tester. 2012; Available from:
http://www.moog.com/markets/automotive/automotive-
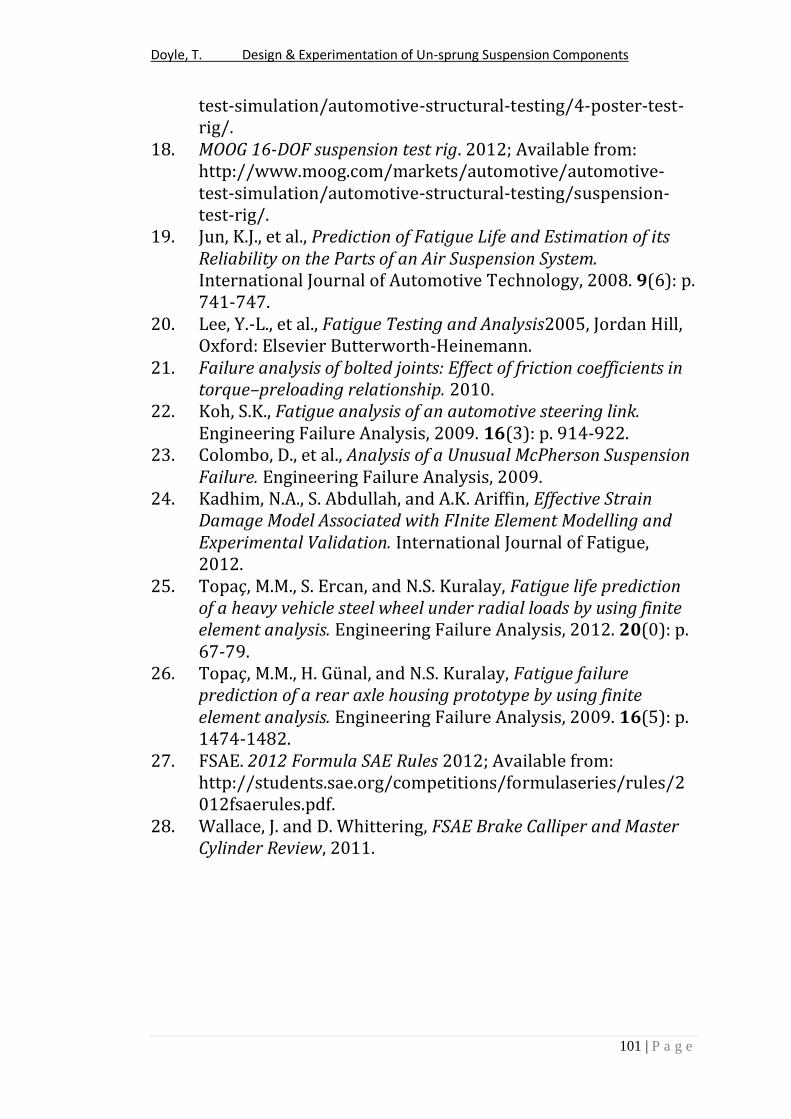
Doyle, T. Design & Experimentation of Un-sprung Suspension Components
101 | P a g e
test-simulation/automotive-structural-testing/4-poster-test-rig/.
18. MOOG 16-DOF suspension test rig. 2012; Available from: http://www.moog.com/markets/automotive/automotive-test-simulation/automotive-structural-testing/suspension-test-rig/.
19. Jun, K.J., et al., Prediction of Fatigue Life and Estimation of its Reliability on the Parts of an Air Suspension System. International Journal of Automotive Technology, 2008. 9(6): p. 741-747.
20. Lee, Y.-L., et al., Fatigue Testing and Analysis2005, Jordan Hill, Oxford: Elsevier Butterworth-Heinemann.
21. Failure analysis of bolted joints: Effect of friction coefficients in torque–preloading relationship. 2010.
22. Koh, S.K., Fatigue analysis of an automotive steering link. Engineering Failure Analysis, 2009. 16(3): p. 914-922.
23. Colombo, D., et al., Analysis of a Unusual McPherson Suspension Failure. Engineering Failure Analysis, 2009.
24. Kadhim, N.A., S. Abdullah, and A.K. Ariffin, Effective Strain Damage Model Associated with FInite Element Modelling and Experimental Validation. International Journal of Fatigue, 2012.
25. Topaç, M.M., S. Ercan, and N.S. Kuralay, Fatigue life prediction of a heavy vehicle steel wheel under radial loads by using finite element analysis. Engineering Failure Analysis, 2012. 20(0): p. 67-79.
26. Topaç, M.M., H. Günal, and N.S. Kuralay, Fatigue failure prediction of a rear axle housing prototype by using finite element analysis. Engineering Failure Analysis, 2009. 16(5): p. 1474-1482.
27. FSAE. 2012 Formula SAE Rules 2012; Available from: http://students.sae.org/competitions/formulaseries/rules/2012fsaerules.pdf.
28. Wallace, J. and D. Whittering, FSAE Brake Calliper and Master Cylinder Review, 2011.

Doyle, T. Design & Experimentation of Un-sprung Suspension Components
102 | P a g e
Appendix
A.1 Apparatus Drawings

Doyle, T. Design & Experimentation of Un-sprung Suspension Components
103 | P a g e

Doyle, T. Design & Experimentation of Un-sprung Suspension Components
104 | P a g e

Doyle, T. Design & Experimentation of Un-sprung Suspension Components
105 | P a g e
A.2 Upright Manufacturing Drawing

Doyle, T. Design & Experimentation of Un-sprung Suspension Components
106 | P a g e

Doyle, T. Design & Experimentation of Un-sprung Suspension Components
107 | P a g e
A.3 Hub Shaft Drawings

Doyle, T. Design & Experimentation of Un-sprung Suspension Components
108 | P a g e

Doyle, T. Design & Experimentation of Un-sprung Suspension Components
109 | P a g e

Doyle, T. Design & Experimentation of Un-sprung Suspension Components
110 | P a g e

Doyle, T. Design & Experimentation of Un-sprung Suspension Components
111 | P a g e

Doyle, T. Design & Experimentation of Un-sprung Suspension Components
112 | P a g e

Doyle, T. Design & Experimentation of Un-sprung Suspension Components
113 | P a g e

Doyle, T. Design & Experimentation of Un-sprung Suspension Components
114 | P a g e

Doyle, T. Design & Experimentation of Un-sprung Suspension Components
115 | P a g e

Doyle, T. Design & Experimentation of Un-sprung Suspension Components
116 | P a g e

Doyle, T. Design & Experimentation of Un-sprung Suspension Components
117 | P a g e
A.4 Relevant FSAE Suspension Rules
Below are relevant suspension related rules that impact on the design methodology of this
project. For full detailed rules refer to Formula SAE Rules 2012 which is available from,
http://students.sae.org/competitions/formulaseries/rules/2012fsaerules.pdf
Tilt Test
The car is tilted in either direction to 60°, to test the car’s roll over stability. At this angle it
represents 1.7 G’s laterally. At this angle the car must not roll over and must be performed
with the tallest driver in the car.
Skid Pad
The aim of the skid-pad event is to measure the car’s cornering ability on a flat surface while
making a constant-radius turn. The skid pad track will be a figure eight configuration; the
centres of the two loops will be 18.25 m apart.
Suspension Travel Requirements
The car must be equipped with a fully operational suspension system with shock absorbers,
front and rear, with usable wheel travel of at least 50.8 mm (2 inches), 25.4 mm (1 inch)
jounce and 25.4 mm (1 inch) rebound, with driver seated.

Doyle, T. Design & Experimentation of Un-sprung Suspension Components
118 | P a g e
A.5 Project Timeline
Figure 99: Project timeline

Doyle, T. Design & Experimentation of Un-sprung Suspension Components
119 | P a g e
A.6 Hand Calculations
A.6.1 Weight Arm Calculations
The purpose of these calculations is to determine the force required on the weight arm to
achieve 3653 N at the contact patch of the tyre.
Assume hinge point is point of rotation.
∑
( ) ( )( )
Rearranging for Ry
( )( )
( )
A.6.2 Push Rod Strain Calculations
Total Tensile Force = 2260.7N
E = 210E9
Outside Diameter, OD=0.02m
Inside Diameter, ID=0.017m

Doyle, T. Design & Experimentation of Un-sprung Suspension Components
120 | P a g e
A.6.3 Hub Shaft Weld Calculations
All stress values have been taken from ANSYS analysis. Yield strength is taken from
electrode properties.
( )
( )
12mm Fillet Safety Factor
5mm Fillet Safety Factor

Doyle, T. Design & Experimentation of Un-sprung Suspension Components
121 | P a g e
A.7 Bolt Calculations
Suspension Test Apparatus
Given/Sourced Information
Force Components
x 9044.8 N
y -103.41 N
z 0 N
Coefficient of
friction μ 0.45
Elasticity of Mild Steel (Weight Arm)
EA 207 Gpa
Elasticity of Mild Steel (Apparatus)
ES 207 Gpa
Length of Bolt
Lb = 35 mm 0.035 m
Thickness of Apparatus Wall
LA = 5 mm 0.005 m
Thickness of Weight Arm
Ls = 30 mm 0.03 m
(Top Area of Weight Arm in Contact with Apparatus)/2 (As
there is 2 bolts on Top)
Ab = 7005 mm2 0.700 m2

Doyle, T. Design & Experimentation of Un-sprung Suspension Components
122 | P a g e
5
Capscrew grade 8.8
Bolt Dimensions [Metric] (Sourced from Fundamentals of Machine Component Design 4th
edition) Table 10.2 and 10.5
M8x1.25 Coarse Thread
Nominal Diameter
12 mm
d=
Pitch Radius
1.75 mm
p=
Stress Area
84.3 mm2 8.43E-05 m2
At =
Proof Load
600 Mpa
Sp =
Yield Strength [Sy]
660 Mpa
Sy =
Tensile Strength [Su]
830 Mpa
Su=
Stress Factor
3.0
Kf_inner (rolled)=
This is the stress factor sourced from
Fundamentals
of Machine Component Design 4th edition table

Doyle, T. Design & Experimentation of Un-sprung Suspension Components
123 | P a g e
10.6
Analysis
Calculations for Static Lower bolt
Axial Force
P=F/At
-1.23 Mpa
Shear Force
107.29 Mpa
Equivalent Von mises’ stress
185.84 Mpa
Safety Factor
N= Sp/Axial
Force
3.23
Calculations for Fatigue
Se’ [Mpa] 415
Se’ = 0.5Su
Load Factor (Ca) 0.9 Axial Loading
Size Factor (Cb) 1 Axial Loading
Surface Factor (Cc) 1 Already factored into stress factor
Temperature Factor (Cd) 1 as T< 350°C
Reliability Factor (Ce) 0.814 99% Reliability
Stress Concentration (Cf)
Notch
Sensitivity (q)
Notch Radius 0.875
Notch Radius =
p/2
q = 0.825
Sourced using 1.0
Gpa Steel
Cf = 0.377358
Cf =
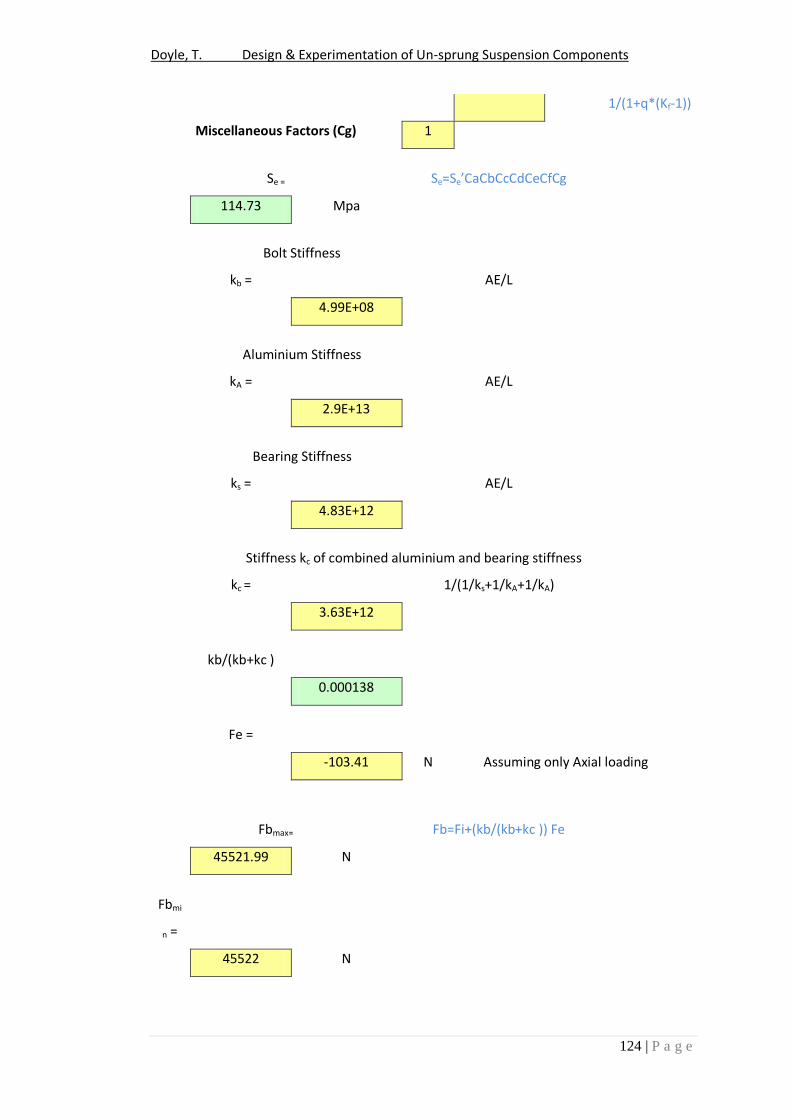
Doyle, T. Design & Experimentation of Un-sprung Suspension Components
124 | P a g e
1/(1+q*(Kf-1))
Miscellaneous Factors (Cg) 1
Se = Se=Se’CaCbCcCdCeCfCg
114.73 Mpa
Bolt Stiffness
kb =
AE/L
4.99E+08
Aluminium Stiffness
kA =
AE/L
2.9E+13
Bearing Stiffness
ks =
AE/L
4.83E+12
Stiffness kc of combined aluminium and bearing stiffness
kc =
1/(1/ks+1/kA+1/kA)
3.63E+12
kb/(kb+kc )
0.000138
Fe =
-103.41 N Assuming only Axial loading
Fbmax= Fb=Fi+(kb/(kb+kc )) Fe
45521.99 N
Fbmi
n =
45522 N

Doyle, T. Design & Experimentation of Un-sprung Suspension Components
125 | P a g e
σbm
ax= σb= Fb/At
540.00 Mpa
σbmi
n=
540.00 Mpa
σa=
σa = (σbmax-σbmin)/2
0.00 Mpa
σm =
σm = (σbmax+σbmin)/2
540.00 Mpa
Goodman Criteria σa/Se + σm/Su= 1/N
1.54
Yield Criteria σa/Sy + σm/Sy = 1/N
1.22
Maximum Tensioning Force (ki =0.9)
Fi =
Fi = kiAtSp
45522 N
Maximum Tightening Torque on Bolt
T =
T = 0.2Fid
109.2528 Nm
Friction Load Carrying Capacity
Ff =
Ff = Fiμ
20484.9 N
486 Mpa Ff = Fiμ / At

Doyle, T. Design & Experimentation of Un-sprung Suspension Components
126 | P a g e
A-Arm is in
double shear
Shear Safety
Factor
4.53
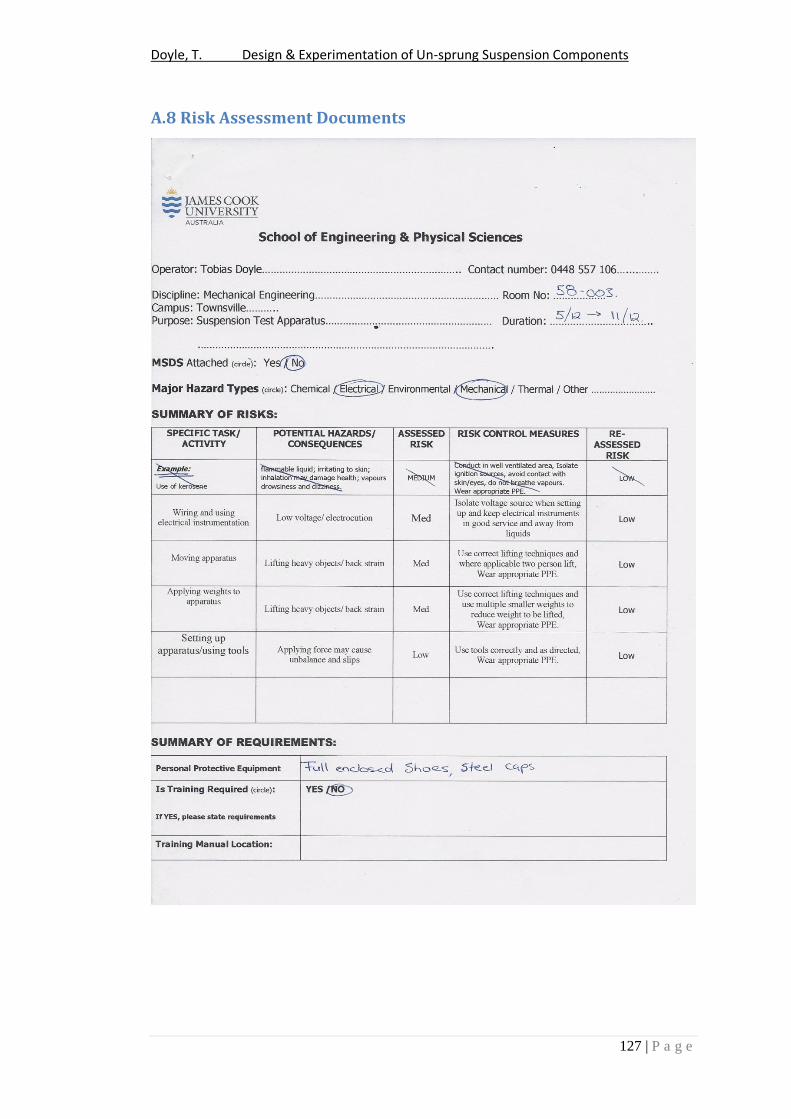
Doyle, T. Design & Experimentation of Un-sprung Suspension Components
127 | P a g e
A.8 Risk Assessment Documents

Doyle, T. Design & Experimentation of Un-sprung Suspension Components
128 | P a g e
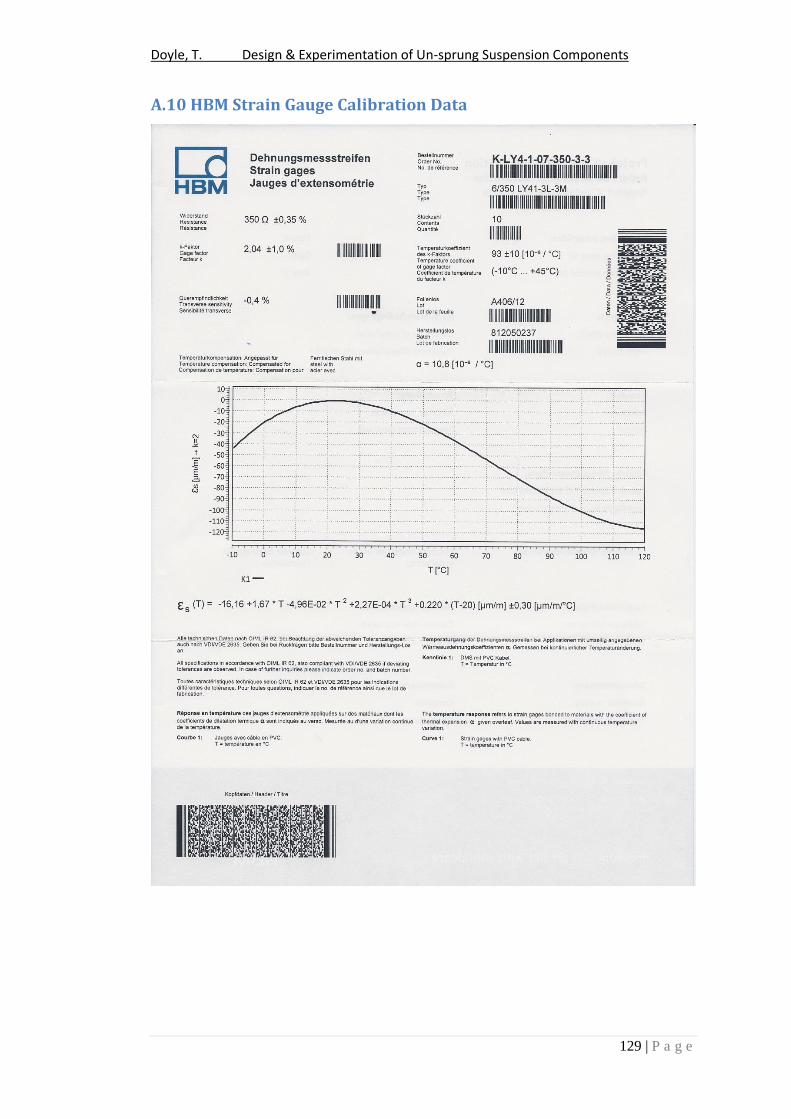
Doyle, T. Design & Experimentation of Un-sprung Suspension Components
129 | P a g e
A.10 HBM Strain Gauge Calibration Data

Doyle, T. Design & Experimentation of Un-sprung Suspension Components
130 | P a g e
A.11 Material Properties and Data Sheets
A.11.1 Alumec Material Properties
General material data is shown below, for full material details refer to Bohler Uddeholm
product details.

Doyle, T. Design & Experimentation of Un-sprung Suspension Components
131 | P a g e
A.11.2 7075 Aluminium Alloy Fatigue Data
Fatigue data found from
http://www.knovel.com/web/portal/basic_search/display?_EXT_KNOVEL_DISPLAY_boo
kid=754 (Page 3-382)
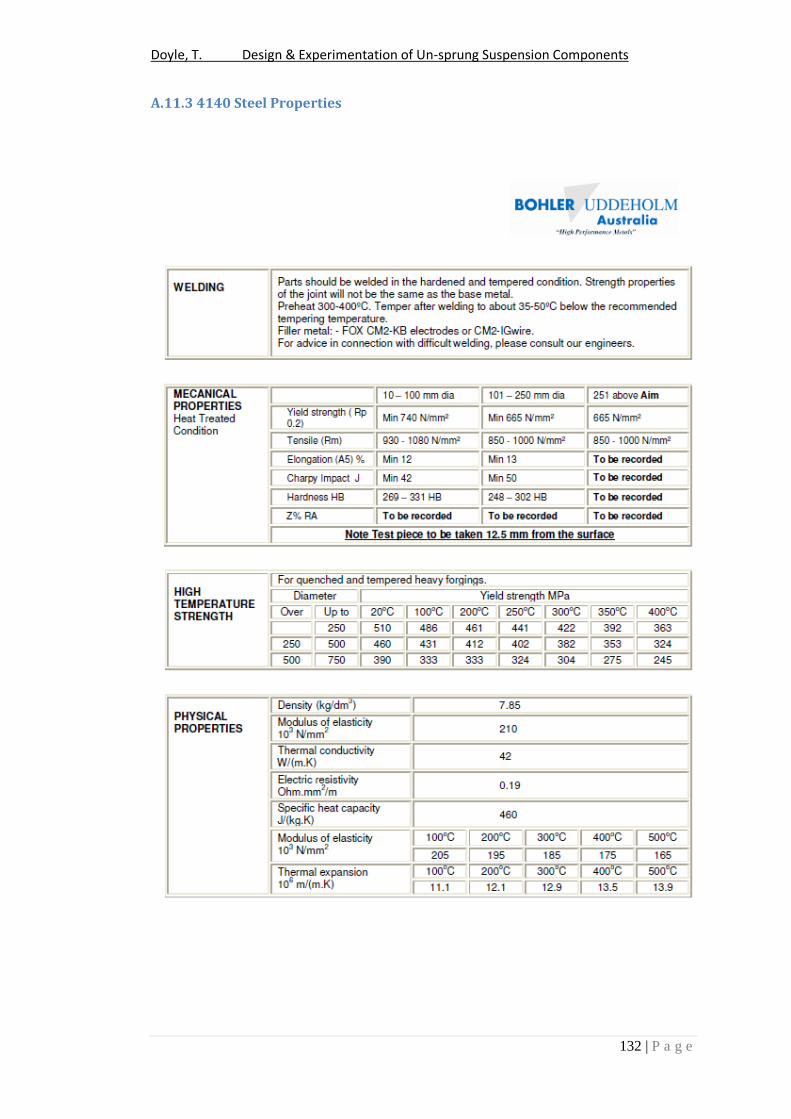
Doyle, T. Design & Experimentation of Un-sprung Suspension Components
132 | P a g e
A.11.3 4140 Steel Properties

Doyle, T. Design & Experimentation of Un-sprung Suspension Components
133 | P a g e
A.11.4 Welding Properties

Doyle, T. Design & Experimentation of Un-sprung Suspension Components
134 | P a g e