to the board of the pension protection fund the ... · 2 ... group’s work that could form the...
TRANSCRIPT

To the Board of the Pension Protection Fund
The introduction of investment risk as a risk factor in
the formula of the Risk-Based Levy

Strictly Private & Confidential 10 September 2010
www.redington.co.uk 2
Contents
1 Introduction ............................................................................................................................. 3
2 Scope ....................................................................................................................................... 5
3 Review of other regimes ......................................................................................................... 6
4 Analysis of section 179 funding ratio volatility ..................................................................... 11
5 The proposed stress tests ...................................................................................................... 15
6 Impact analysis ...................................................................................................................... 24
7 Implementation considerations ............................................................................................ 28
8 Recommendation .................................................................................................................. 32
Appendix A .................................................................................................................................... 34
Appendix B .................................................................................................................................... 38
Appendix C .................................................................................................................................... 42
Appendix D .................................................................................................................................... 44
Appendix E..................................................................................................................................... 46
Appendix F ..................................................................................................................................... 48
This report has been prepared solely for the use of the Pension Protection Fund to assist in its consultation on the
future of the Risk-Based Levy. Redington accepts no responsibility for any consequences arising from any third party
relying on this report or the opinions we have expressed. This report is not intended by Redington to form a basis of
any decision by a third party to do or omit to do anything.
In preparing this report Redington has placed reasonable reliance on data supplied to us by third parties. In particular,
we have relied upon information, both quantitative and qualitative, supplied by the Pension Protection Fund. Whilst
reasonable care has been taken to gauge the reliability of this data, this report carries no guarantee of accuracy or
completeness and Redington cannot be held accountable for the misrepresentation of data by third parties involved.
All analysis (whether in respect of tax, accounting, law or of any other nature), should be treated as illustrative only
and not relied upon as accurate. This report is based on information available to Redington at the date of the report
and takes no account of subsequent developments after that date.
Redington Limited is authorised and regulated by the Financial Services Authority.
©Redington Limited 2010. All rights reserved.
Strictly Private & Confidential 10 September 2010
www.redington.co.uk 3
1 Introduction
1.1 In November 2008, the Pension Protection Fund (“PPF”) published The Consultation on the
Future Development of the Pension Protection Levy. Chapter 5 of that consultation presented
five possible options for collecting the data required to calculate an investment risk factor. As a
result of the industry’s response to that consultation, an update was published in July 2009.
Some key considerations arising from the five options presented and can broadly be categorised
into:
the ability of the investment risk factor to recognise the range of investment strategies
used by all schemes.
the fairness of an option or threshold approach that could result in more than one
reporting process.
the appropriateness of using stress tests as a method for measuring investment risk.
1.2 A Steering Group and supporting Technical Reference Group were formed to take a fresh look at
the issues that were raised.
1.3 In March 2010, the PPF published a summary of the issues and ideas arising from the Steering
Group’s work that could form the basis of the next round of consultation. Some of the key
principles set out in that document were:
To take a “longer”-term view – i.e. it should be possible to estimate a scheme’s levy for a
number of years.
A “bottom-up” approach to setting the levy, but looking through the economic cycle to
ensure stability, in particular the use of smoothed asset and s179 liabilities and fewer
insolvency probabilities
Preference for a single stress test on all schemes, although consideration also for a
supplemental option for more sophisticated stress tests where this better reflects the
true scheme risks.
1.4 That publication also stated that the PPF had retained consultants to work with it on the options
for developing the levy, including in particular calculating the levy parameters that might be
used.
1.5 This report contains Redington Limited’s advice to the Board of the Pension Protection Fund on
the introduction of investment risk as a risk factor in the formula of the Risk-Based Levy. The
two other areas in which consultancy was commissioned were:
assessing the “fairness” of any new Risk-Based Levy formula. This is being carried out by
David McCarthy and Anthony Neuberger; and
assessing how a pension plan’s governance structure could be reflected in its levy. This
work is being led by Rachel Brougham of Mercer.

Strictly Private & Confidential 10 September 2010
www.redington.co.uk 4
1.6 In Section 2, we state the scope of Redington’s advice contained in this report.
1.7 Section 3 is a review of existing research and practice from other regulatory regimes in the
pension and insurance sectors across a number of countries.
1.8 In Section 4, we analyse the volatility of a pension scheme’s section 179 (“s179”) funding ratio –
a key parameter used in the model built by David McCarthy and Anthony Neuberger.
1.9 Section 5 sets out Redington’s view on how the overall volatility of a pension scheme’s section
179 funding ratio can be decomposed into individual risk factor stresses that can then be applied
to a scheme’s liabilities and assets. We further construct and compare a number of alternative
ways of applying these stress tests, varying mainly in complexity. We also set out how the
stresses would be defined and the instructions needed for calculation.
1.10 Section 6 details the estimated impact of allowing for investment risk in the Risk-Based Levy.
1.11 Section 7 considers the implementation of the stress test and in particular the additional data
capture and costs that might be borne by the PPF and pension schemes.
1.12 In Section 8, we present a recommendation on how investment risk might be reflected as a risk
factor in the risk-based levy and comment on how this links to the considerations from the
previous consultation and Steering Committee feedback.

Strictly Private & Confidential 10 September 2010
www.redington.co.uk 5
2 Scope
2.1 Redington has been asked to:
Review other regulatory regimes and the extent to which stress tests are used.
Design and calibrate a single stress test to be applied to all pension plans, as well as a
more sophisticated supplemental option for stress tests. The per plan cost of carrying
out these stress tests should also be estimated.
Carry out an analysis of the impact of the proposed stress tests, including how it affects
the distribution of the risk-based levy.
Review with the PPF the implementation issues that may be raised by the proposed
stress tests.
Support the PPF in drafting guidance and the consultation documents, as well as
reviewing the related responses.
2.2 Whilst the nature of the work carried out by the three consulting workstreams is distinct, the
interdependency has become apparent through the course of our work, particularly with the
“fairness” work. Although that work is reported on separately, one of its input parameters is the
volatility of pension scheme’s s179 funding ratios. Redington were asked to provide s179
funding ratio volatilities for 500 sample schemes and this element of work is included in this
report.
2.3 Initial results from our work were presented to the Technical Reference Group in early April
which resulted in some follow-up analysis.
2.4 We would like to thank the PPF, David McCarthy, Anthony Neuberger, the Technical Reference
Group for their help and input into our work. We would also like to thank RiskMetrics Group,
whose risk model supports part of our work.
2.5 Our analysis has been carried out using an anonymised data set from the PPF’s own database at
31 March 2009, reflecting 5,728 schemes’ returns. All analysis was carried out prior to the 12
August 2010 Department for Work and Pensions consultation on changing compensation
indexation from RPI to CPI in the Pension Protection Fund from 31 March 2011.

Strictly Private & Confidential 10 September 2010
www.redington.co.uk 6
3 Review of other regimes
3.1 In this section, we compare and contrast various common approaches to risk analysis that are
applied in financial institutions and how they have been applied in example regulatory regimes.
Approaches to risk management
3.2 There are a wide range of approaches to risk management. Common approaches include:
Value at Risk (VaR)1 – typically used for assessment of risk in trading books within banks
and also for various risk-based capital regimes
“PV01” or “Delta ladders”2 – used to assess exposure in bank trading books to various
risks including interest rates and inflation
Stress and scenario tests – currently often used either where more sophisticated
techniques are not suitable or to supplement other techniques
3.3 In recent years, VaR has come to be the primary measure of risk for a wide variety of purposes
including. For example:
In the reporting of risk management of bank trading books in the Notes to Financial
Statements (e.g. using RiskMetrics developed by JP Morgan)
Insurance risk-based capital (UK, Switzerland, Sweden and Solvency II in the EU)
The Dutch FTK3 regime for pension funds, and
Pension fund risk-budgeting
3.4 However VaR has been the subject of considerable criticism, particularly the reliance on it
leading up to the credit crisis. These criticisms can be broadly summarised as:
VaR does not adequately allow extreme tail events (so-called “black swans” by Nassim
Nicholas Taleb4) that appear to occur more frequently, or with more extreme impact
than suggested by the models
1 Value at Risk is defined as a threshold value such that the probability that the loss on a portfolio of
financial assets over a given time horizon exceeds this value is a given probability. Typical time periods include 1-day or 1-year. Typical probabilities include 5% or 0.5%. 2 PV01 is the impact that a 1 basis point move in rates has on the present value of a portfolio. Delta
ladders are typically used to represent this impact in different portions of the portfolio. 3 The Financieel Toetsingskader (FTK) financial framework requires funds to meet minimum solvency
tests and to put in place recovery plans if they fail these tests. It is covered in more detail later in this section. 4 As presented in his book, The Black Swan: The Impact of the Highly Improbable
Strictly Private & Confidential 10 September 2010
www.redington.co.uk 7
A more general version of the above argument is that the statistical distributions
underlying the models do not adequately reflect reality.
The calculations and assumptions are often viewed as coming from a calculation “black
box” and lack sufficient transparency or rigour, particularly the assumption of stable
volatilities and correlations as well as decisions of type of VaR and time series
Use of VaR for longer-term projections is problematic, for example in long-term risk
budgeting, as it requires either significant computational complexity or some extremely
simplifying assumptions (e.g. for assessing credit default risk)
There are difficulties in simplifying the calculations so they can be applied simply to a
wide range of users, particularly the less sophisticated.
3.5 These problems have been recognised and reflected by many users in their assessment of risk.
Often VaR is supplemented by stress and scenario tests e.g. the Swiss Solvency Test (SST) and
recent Bank capital assessments in both the UK and US.
3.6 Even when VaR is used it is frequently calculated as a set of stress tests that are combined via a
correlation matrix that is often not derived from market data
Regulatory regimes – Insurance
3.7 Risk-based capital regimes have been in place for a number of years in various jurisdictions
including US, Canada, Australia and Finland (which is believed to have the earliest example
dating from 1953). All of these regimes are based on various forms of stress and scenario testing
as the more sophisticated risk measurement techniques, particularly Value at Risk were either
not available or required too much processing power at the time.
The UK
3.8 Since 2004, the regulation by the FSA of the UK insurance industry has been based on an
Individual Capital Assessment (ICA) (as part of regulations generally referred to as PS04/165)
which is a risk-based capital regime based on VaR measures calibrated to a 99.5%6 confidence
interval.
3.9 However, prior to 2004 the assessment of risk and the corresponding prudence in reserves (as
opposed to capital), was in part assessed using combinations of stresses under the Resilience
Test regime. These Resilience Tests were not generally market consistent as they were used in
conjunction with discount rates for reserving purposes set based on the ‘reliable’ yields
expected to be earned on assets.
5 PS04/16 refers to Policy Statement 04/16 published by the FSA in 2004 and titled Integrated
Prudential sourcebook for insurers 6 Equivalent to a 0.5% probability under the earlier definition of Value at Risk.

Strictly Private & Confidential 10 September 2010
www.redington.co.uk 8
3.10 In the later years of their use, the Resilience Tests were also modified to allow for some level of
smoothing of assets by adjusting the equity stresses for falls that had occurred between
previous peaks in the market and the valuation date.
3.11 Even under PS04/16 for some smaller offices the calculation of an ICA is undertaken by applying
stress tests to the key variables and then combining them via a correlation matrix into a
diversified VaR.
3.12 Furthermore, financial reporting under various Embedded Value methodologies has involved
disclosure of sensitivities to key risks via the results of stress tests.
Outside the UK
3.13 Various other European countries have considered forms of risk-based capital approaches with
VaR-based approaches in Switzerland and the Netherlands. Whilst Switzerland has adopted this
approach in the SST, it was ultimately not adopted for insurers in the Netherlands, although it
has been adopted for pension funds.
3.14 Also the EU is developing the Solvency II regime for implementation in 2012 which has
similarities to both the UK and Swiss regimes. In particular it allows for the use of a simplified
Standard Model based on stress tests and combining them via a correlation matrix with preset
calibration for the parameters. The alternative of using a company’s own Internal Model to
assess capital requirements is subject to a detailed and quite onerous review and approval
process by the relevant local regulator
Regulatory regimes – Pensions
3.15 Perhaps the most comparable entity to the PPF is the Pension Benefit Guaranty Corporation (the
PBGC) in the United States, where sponsors are charged premiums to fund the pension benefits
due from insolvent businesses. As in the UK, the US government has stated that it is not a
guarantor of the PBGC. The PBGC charges a flat premium (comparable to the PPF’s scheme-
based levy) and variable premium; however whilst the PBGC’s variable premium does reflect the
level of underfunding in a plan, it does not reflect the creditworthiness of the sponsoring
employer and does not take into account the level of risk within a plan’s investment strategy.
3.16 Generally pension schemes and their regulators have been slower to use more sophisticated risk
measurement than insurers although the development of Liability Driven Investment (LDI)
approaches has seen VaR and other tools such as delta ladders introduced as means of
highlighting the risks and demonstrating the effectiveness of various strategies. To the extent
that the provision of pensions is through insurance contracts in some jurisdictions, notably
Scandinavia, it could be argued that some pension schemes are subject to quite extensive risk
measurement requirements.
Strictly Private & Confidential 10 September 2010
www.redington.co.uk 9
3.17 However, the one major exception to this is the FTK regime in the Netherlands (described below)
where a more sophisticated approach is taken. It is also worth notingthat recent developments
in financial reporting have also seen additional disclosures of the results of stress tests on some
of the assumptions used in the reported value of obligations on sponsors to their pension
schemes.
The Netherlands
3.18 The FTK regime is supervised by De Nederlandsche Bank (DNB). In concept it is similar to
Solvency II, incorporating both quantitative and qualitative elements in assessing pension
scheme funding. On the quantitative side, the two key elements are a short-term solvency test
and a long-term continuity analysis. The former is much like a stress test on the solvency
position, although it is derived from the concept of a capital buffer.
3.19 The solvency test requires that funds must have sufficient capital to ensure there is a 97.5%
probability that the funding ratio does not fall below 100% over a one-year time horizon. This
test can be applied by one of three methods:
a standardised model, where stresses to key risk factors are prescribed by DNB. The risk
factors used are interest, equity (with distinction made between developed markets,
emerging markets and private equity), real estate, currency, commodities, credit and
underwriting risks.
an internal model. This requires approval by DNB, but allows funds to incorporate the
possibility of management actions to limit risk, e.g. stop-loss coverage. A complete
model is expected to utilise stochastic processes and is expected to cover control and
governance procedures.
a simplified test, applying to a small number of schemes with high funding levels and low
investment risk, requires the funding ratio to remain in excess of 130%.
Conclusion
3.20 Overall for the more sophisticated financial institutions it is clear that VaR plays an important
role in both risk and capital requirements. Very often this is supplemented by additional stress
and scenario tests to overcome some of VaR’s shortcomings.
3.21 Whilst VaR might therefore be an approach to be considered by the PPF, it is complex and costly
to implement. The requirement for extensive additional data capture and calculation by either
the PPF or individual pension schemes (which would require certification) may render this
approach inappropriate for the mass PPF audience and preference would therefore be focussed
on stress tests.
3.22 Stress tests might also help the PPF meet its aim for “fairness” as it can be demonstrably applied
consistently across schemes. In addition, feedback on the use of the PPF’s Long Term Risk
Model has already provided the industry’s views on such parameter/model-based approaches.

Strictly Private & Confidential 10 September 2010
www.redington.co.uk 10
3.23 Some pension schemes may already have the required level of governance in place to carry out
more sophisticated analysis of their pension risks. The PPF may wish to consider giving schemes
the option of more detailed stress tests, along the lines of the “standard vs internal” model
approaches of the SST, FTK and Solvency II.
3.24 Having said this, it is also important to distinguish between a risk-based supervisory regime (e.g.
the FSA requirements or the FTK in the Netherlands) and risk assessment for the purposes of a
levy (e.g. the PPF), particularly where the latter is outside of any risk-based regulatory
framework. This is particularly important because a lot of the motivation behind the supervisory
boards’ use of standardised models is to encourage firms/schemes to develop more bespoke risk
management tools in-house. For the PPF, it may be overly onerous to expect schemes to
develop sophisticated risk frameworks for only one part of the current regulatory regime.
Should the UK pensions regulatory regime move to a risk-based supervisory regime, then this
should be reconsidered.
Strictly Private & Confidential 10 September 2010
www.redington.co.uk 11
4 Analysis of section 179 funding ratio volatility
4.1 The McCarthy-Neuberger report on arriving at a “fair” levy is being published alongside this
report as part of the PPF’s consultation. A key input parameter into the McCarthy-Neuberger
model is the volatility of a pension scheme’s funding ratio on a s179 valuation basis. We were
therefore asked to calculate and provide the volatilities for 500 sample schemes – these are set
out in Appendix A.
4.2 To ensure that this was a valid metric to use, we analysed:
whether the s179 funding ratio is normally distributed
the sensitivity of the s179 funding ratio volatility
4.3 This section sets out how the volatilities were calculated and the analysis carried out.
Methodology for calculating volatilities
4.4 The risk of each pension scheme is modelled using a Monte Carlo simulation approach.
4.5 We first define the portfolio of pension scheme assets and s179 liabilities as a function of the
underlying risk factors. Whilst the risk factors to which a pension scheme is exposed will vary
from scheme to scheme, there is a lot of commonality, for example equity price, equity index
level, interest rates at different tenor points, inflation at different tenor points or credit spreads.
4.6 The limited number of asset classes recorded by Exchange and the fact that s179 liabilities are
calculated on spot yields rather than a term structure means that the risk factors that can be
used for this particular project are a simplified version of a full model.
4.7 Each risk factor is then simulated according to a statistical distribution, with defined volatilities
and correlations between each of the risk factors. These parameters are derived from historical
market data. For our base case, we have taken daily historical market data for the period 1
January 2006 to 31 March 2009.
4.8 For assets, there is insufficient data collected via Exchange to identify each scheme’s underlying
asset benchmarks. Therefore, we have assigned benchmarks based on our experience of UK
pension schemes as set out in Table 1.
4.9 For s179 liabilities, Exchange captures the breakdown by member type, pre/post April 1997 and
also average ages from which it is possible to estimate the liability duration7. In aggregate, half
of the s179 liabilities were in respect of accrual on or after 6 April 1997. We have carried out our
base case volatility analysis assuming all schemes have this aggregate split.
7 The PPF has previously indicated how this estimation can be done in its Transformation Appendix to
its determination under Section 175(5) of the Pensions Act 2004.

Strictly Private & Confidential 10 September 2010
www.redington.co.uk 12
Table 1: Asset benchmarks
Asset type8 Benchmark
UK equity FTSE 100 Total Return Index
Overseas equity MSCI World Index
Property FTSE All Property Index Total Return
Hedge funds9 HFRX Global Hedge Fund Index
Corporate bonds Merrill Lynch Sterling Non-Gilts Index
Nominal Gilts FTSE Actuaries UK Gilts Index over 15 years
Index-linked gilts FTSE Actuaries UK Index-Linked Gilts Index over 5 years
4.10 The risk factors used in our model for this work, together with the assumed statistical
distributions and volatilities are summarised in the following table. Although our model does
use the full term structure of nominal and real yields, we have shown the 30-year rates as a
sample.
Table 2: Risk factor statistical distributions and volatilities
Risk factor Statistical distribution Volatility10
Credit spread Lognormal 1.42%
Property Lognormal 8.38%
Hedge funds Lognormal 10.75%
UK equity Lognormal 25.68%
Overseas equity Lognormal 21.87%
30-year gilt rate Normal 0.78%
30-year gilt break-even11
inflation Normal 0.71%
4.11 The simulations are run 10,000 times, with each simulation providing an asset value, a s179
liability valuation and hence funding ratio. We calculate the absolute difference between each
simulated funding ratio and the current funding ratio, with volatility being the standard
deviation of these differences.
4.12 We have assessed the potential inclusion of longevity risk as part of this project in Appendix B.
Our conclusion is that due to the significant proportion of pension scheme investments that are
currently held in return-seeking assets, together with the current lack of data on which to
calibrate a market-consistent model, on balance we do not believe that longevity risk should be
included. We recommend that the PPF keep this under regular review to monitor any trend of
investment away from return-seeking assets and also any emergence of a traded market in
longevity risk.
8 As recorded on Exchange. Cash is assumed to be risk-free. Where indicated, contingent assets have
been assigned to the appropriate asset class, otherwise they are treated as cash. Insurance policies have been treated as cash due to the wide-ranging types of insurance policies. 9 For modelling purposes, we have combined “commodities” and “hedge funds” under the same risk
factor due to the very wide range of possible strategies these descriptions can cover. 10
Based on data from 1 January 2006 to 31 March 2009. 11
Gilt break-even inflation is the difference between nominal and real gilt yields.

Strictly Private & Confidential 10 September 2010
www.redington.co.uk 13
S179 funding ratio volatilities
4.13 The table below shows how the s179 funding ratio volatility varies with liability duration and the
proportion of the scheme’s investment in matching assets. It assumes all schemes are 80%
funded (this is the aggregate funding level across all schemes at 31 March 2009). A full
distribution of the volatility across the 5,728 sample schemes is in the second half of Appendix A.
Table 3: Sample output s179 funding ratio volatilities
S179 Funding Ratio Volatility
Liability duration (years)
Bond Allocation 10 15 20 25 30
10% 17% 18% 20% 22% 24%
20% 14% 16% 18% 20% 22%
30% 12% 14% 16% 18% 20%
40% 10% 12% 14% 16% 18%
50% 8% 10% 12% 14% 17%
60% 6% 8% 10% 12% 15%
70% 4% 6% 8% 11% 13%
4.14 The table shows that the schemes with the high volatilities are those with a high duration and/or
a low bond allocation. Schemes with low volatilities are those with high bond holdings. Chart
A4 (in Appendix A) shows that there is a trend for schemes with greater matching assets to have
lower volatilities, although where the allocation is entirely to matching assets, the lowest
volatilities are still around the high single digits.
Testing for normality
4.15 Although the model assumes that each risk factor follows either a normal or a lognormal
distribution, the aggregated distribution of the funding ratio is not necessarily normal or
lognormal. It is important to test how close the funding ratio is to being normally distributed to
ensure it is a suitable measure for down-side risk.
4.16 To do this, we tested six sample schemes for “goodness of fit” to a normal distribution using the
Kolmogorov-Smirnov Test. The six schemes were selected to represent a range of asset
allocations, particularly in terms of equity exposure and duration, with a selection being
assessed with and without duration hedging.
4.17 Full results are included in Appendix C. We found that only schemes with a high equity
allocation and little/no hedging of duration risk passed the normality test. Whilst there is
insufficient data held by the PPF to indicate the level of hedging in individual schemes, the data
does show that a significant proportion of the assets in the universe of schemes is held in equity
and so would be more likely to pass the normality test.
4.18 For schemes with significant matching asset portfolios or a significant amount of interest rate or
inflation hedging, the funding ratio volatility is less likely to follow a normal distribution and
Strictly Private & Confidential 10 September 2010
www.redington.co.uk 14
hence this measure would tend to overstate the risk, although the level of risk is still significantly
lower than unhedged/unmatched portfolios. This impact is shown in Appendix C, but it is a bias
of the fairness model that the PPF should consider.
4.19 We recommend that the PPF keeps under review the use of s179 funding ratio volatility as a
driver of its fairness assessment, particularly should the trend of pension scheme investment be
towards higher bond allocations and should increasing maturity of pension schemes begin to
reduce the duration of their liabilities.
The sensitivity of the s179 funding ratio volatility
4.20 We have tested the base case volatilities for changes in two key parameters:
funding ratio
underlying time series
4.21 The results of these tests can be found in Appendix D.
4.22 In summary, the volatility of the s179 funding ratio for a pension scheme is sensitive to both the
funding ratio itself and the period of time over which the Monte Carlo model is calibrated. This
may be mitigated to some extent by smoothing assets, s179 liabilities and stress tests over a
number of years for Risk-Based Levy purposes; however we would recommend that the output
from the fairness workstream is tested on a range of different input funding ratio volatilities.

Strictly Private & Confidential 10 September 2010
www.redington.co.uk 15
5 The proposed stress tests
5.1 This section considers how to break down an aggregate funding ratio stress of 1 volatility into
individual risk factor stress tests and how they can then be applied to each scheme’s asset and
liability portfolio.
5.2 We understand that output from the work carried out by Anthony Neuberger and David
McCarthy, in addition to confirming that an aggregate stress test varies in proportion to the
volatility for a given funding level and sponsor creditworthiness, also suggests that the
calculation of a fair levy should apply different levels of stress dependent on a scheme’s funding
ratio and the credit worthiness of its sponsor. Appropriate allowance for this could be made by
scaling the stresses derived in this section to the relevant multiple of volatility, although this
could have consequences on predictability and stability of levies for individual schemes.
Method for determining the individual factor stresses
Assessment Process
5.3 We first take the undiversified components of the volatility for each risk factor and scale them to
an array of stress tests by the ratio of the diversified and undiversified volatilities. For each of
the 5,728 pension schemes, we build a model that applies a constant multiple of this array of
individual risk factor stresses to the assets and liabilities. In the absence of additional
information, the PPF asked us to carry out the analysis on two alternative bases:
a. assuming all assets classified as “other” are assigned to the risk factor with the highest
stress
b. assuming all hedge funds are also classified as other, on the basis that this category
covers an extremely wide range of risks
5.4 The constant multiple is then optimised to minimise the standard deviation of the absolute
difference between:
the ratio of the stressed assets to the stressed s179 liability valuation, and
the volatility of the funding ratio (this being the approximation to the “fair” levy
described above)
subject to the average absolute difference being zero.
5.5 This was initially carried out using base scenario described in the previous section, i.e. time
series from 1 January 2006 to 31 March 2009 and the PPF data at 31 March 2009. The resulting
risk factor stresses are as follows:
Table 4a: Base case risk factor stresses
Credit Interest
rates
Inflation UK Equity Overseas
Equity
Property Cash Hedge
Funds
Other
+123bps -67bps +61bps -22.2% -18.9% -7.2% 0% -9.3% -22.2%

Strictly Private & Confidential 10 September 2010
www.redington.co.uk 16
Table 4b: Base case risk factor stresses assuming hedge funds are classified as “other”
Credit Interest
rates
Inflation UK Equity Overseas
Equity
Property Cash Other
+120bps -66bps +60bps -21.7% -18.5% -7.1% 0% -21.7%
5.6 The standard deviation of the optimisation with hedge funds separately identified is 5.64%. The
standard deviation of the optimisation with hedge funds included under “other” assets is 5.74%.
5.7 We can see that the impact of classifying all hedge funds as “other” does not have a material
impact on the risk factor stresses as the amount of assets identified to be in this category is
relatively small. For the remainder of the report, we use only the second approach, i.e.
classifying all hedge funds investment as “other”.
5.8 It is possible that the standard deviation might be reduced by allowing the average absolute
difference between the stress on the funding ratio and the volatility of the funding ratio to be
non-zero. The table below shows that by allowing this average absolute difference (labelled as
“average difference”) to increase from zero to 1% or 2%.
Table 5: Alternative risk factor stresses
Average
difference
Credit Interest
rates
Inflation UK
Equity
Overseas
Equity
Property Cash Other Standard
deviation
0% +120bps -66bps +60bps -21.7% -18.5% -7.1% 0% -21.7% 5.74%
1% +111bps -61bps +56bps -20.1% -17.1% -6.6% 0% -20.1% 5.48%
2% +102bps -56bps +51bps -18.5% -15.8% -6.0% 0% -18.5% 5.24%
5.9 Whilst the standard deviation of the differences reduces when the constraint on the absolute
size of the error is relaxed, it is not a large reduction. We have further analysed how this error
varies across pension schemes by funding level.

Strictly Private & Confidential 10 September 2010
www.redington.co.uk 17
Chart 6: How the standard deviation of the error varies by funding ratio
5.10 Chart 6 shows that the majority of the standard deviation (left hand scale) comes from schemes
that are very well funded; however we can also see that the majority of schemes in the PPF’s
universe have funding ratios to the middle and left hand side of the chart.
5.11 For example, for schemes where the funding ratio is at or below 90%, the standard deviation of
the error would be less than the 5.74% standard deviation for all schemes together. Considering
only the more representative schemes, the standard deviation would be more in the region of
4%.
5.12 We believe that most of the difficulty in reducing the error comes from trying to fit one single
set of stress tests to all pension schemes. The PPF may wish to consider further the balance
between the requirements of the Steering Group and how well the one single set of stress tests
can replicate the underlying risks.
Factors that will constrain the accuracy of applying the stress tests
5.13 Before presenting the proposed stress tests, we consider some of the factors that will determine
the level of detail within the stress tests.
0%
5%
10%
15%
20%
25%
30%
0%
2%
4%
6%
8%
10%
12%
14%
<40% 50% 60% 70% 80% 90% 100% 110% 120% 130% >130%
% o
f sc
hem
es b
y as
sets
Stan
dar
d D
evia
tio
n
Initial s179 funding ratio
Standard deviation of the error by funding ratio
Standard deviation (LHS) Overall standard deviation (LHS) Proportion of schemes (by assets) (RHS)

Strictly Private & Confidential 10 September 2010
www.redington.co.uk 18
Table 7: Issues to consider for setting the level of detail within the stress tests
Issue Description
Large number of schemes Whatever the solution, it should be easily applied across a large
number of schemes with differing characteristics.
Data availability Exchange currently captures a certain amount of data. If any further
data is required, this will add additional costs for collection, processing
and verifying this data
Range of scheme sizes A large proportion of the schemes will be small, so simplicity and cost
will be key issues
s179 assumptions As the s179 liability value is based on spot gilt yields, any analysis based
on yield curves and/or swap rates is likely to be difficult to utilise
Fairness With the difficulty of achieving a ‘fully fair’ levy assessment there does
not seem to be much merit in too detailed or ‘accurate’ assessment of
investment risk, particularly given the issues highlighted above
Investment governance The PPF would like to encourage good governance of investment
decisions. Consideration needs to be given as to whether this can be
achieved by any investment risk stress tests, or if a separate
assessment of a scheme’s governance can be used. This latter
approach is the subject of a separate consultancy project
Options for consideration
5.14 Taking into account the analysis and constraints above, we initially arrived at four options for
incorporating investment risk into the Risk-Based Levy
A. Make no allowance in the risk-based levy formula for investment risk.
B. Use a set of pre-defined asset and liability stress tests to be applied by the PPF to all schemes.
C. Allow more flexibility in the stress tests by allowing schemes to more accurately reflect their investment strategies.
D. Fully bespoke stress tests on assets and liabilities, including allowance for full yield curve
stresses on liabilities.
5.15 Option A is essentially the existing approach to setting the Risk-Based Levy, i.e. it makes no
allowance for investment risk. We recognise that this is still an option for the PPF to consult on
and whilst we do not explicitly consider this option further within this report, it is implicitly
compared against the other options in the impact analysis showing the potential redistribution
of the levy.
5.16 Option D moves the process beyond many of the stated objectives of Steering Group. It is akin
to the “internal model” approach adopted by the FSA. Although this option can reflect each
scheme’s individual circumstances there are a number of issues against it:
It cannot be applied to all UK pension schemes, both due to costs/complexity or the
immense amount of oversight and review needed by the PPF or independent sign-off.

Strictly Private & Confidential 10 September 2010
www.redington.co.uk 19
This is particularly the case as the PPF’s approach to regulation, by necessity, is less
involved compared to the FSA (e.g. the FSA carries out site visits).
It is not necessarily appropriate under the current definition of s179 as this does not use a
full yield curve, so may be spuriously accurate.
Our experience suggests that few, if any, schemes will be using the s179 level of liabilities
as a hedging target.
It will be open to challenge for lack of transparency, as was the case for the PPF’s proposal
in 2008 to use its own Long Term Risk Model.
Finally, and perhaps most importantly, it is difficult to justify the requirement for pension
schemes to construct internal risk models for the purposes of an annual levy. As
discussed in section 3, in other regimes where a more bespoke approach is taken (e.g. the
FSA, or the Netherlands), this is because the whole regulatory regime is based on that
model and the supervisory bodies are encouraging the development of more
sophisticated risk assessment capabilities within the entities they regulate. If the UK
occupational pensions regime were to move to a broader risk-based regime, it would be
appropriate to revisit this option.
5.17 Whilst some schemes may have the capacity to run a full internal risk model, the overriding
constraint that reduces the viability of this option is the methodology for valuing the s179
liabilities. The use of a single discount yield across the full duration of liabilities essentially
means that the PPF’s calculation of the stressed s179 liabilities (described for options B and C in
paragraph 5.22 below) will be broadly the same as the scheme’s own calculation, in which case
the additional information provided by a full internal risk model would be only the asset-side
stress tests, which collapses option D into option C.
5.18 The rest of this section focuses on options B and C.
Option B
How would it be applied?
5.19 Under this option, all asset and liability stress tests would be calculated by the PPF. Asset stress
tests would be based on annual scheme data submitted on Exchange. There is sufficient data
captured via Exchange to exclude insured s179 liabilities and their associated insurance asset
values; however the precise relationship between these two figures is not clear as schemes are
likely to insure the full scheme benefit rather than the PPF compensation level (on which the
s179 liabilities are assessed). It might be reasonable for the PPF to ask schemes to confirm that
the benefits that have been insured are at or above the level of PPF compensation.
5.20 To translate risk factor stresses to asset value stresses, the relevant risk factors stresses are
applied to the benchmark for each asset class as defined earlier in Table 1. In the absence of
additional information, the PPF has indicated that it would attribute the highest stress test to
the “other” asset category. For the period to 31 March 2009, the resultant asset value stresses
would be:

Strictly Private & Confidential 10 September 2010
www.redington.co.uk 20
Table 8: Translating risk factor stresses to asset value stresses
Corporate
bonds
Nominal
Gilts
Index-
linked gilts
UK
Equity
Overseas
Equity
Property Cash Other
-4.6% +9.8% +19.1% -21.7% -18.5% -7.1% 0% -21.7%
5.21 For asset classes exposed to only one risk factor (e.g. equity or property), the stress test on the
asset value is the same as the stress on the risk factor. For asset classes that combine more than
one risk factor (e.g. corporate bonds or index-linked gilts), the asset value stress test will be a
combination of the relevant risk factor stresses.
5.22 s179 liability stress tests would also be calculated by the PPF. The PPF will have already
calculated, where necessary, the s179 valuation at the appropriate date using the methodology
stated in the Transformation Appendix12. This value can be further adjusted to the following
“stressed” yields using an identical methodology to the Transformation Appendix.
Table 9: Defining the yields for calculating the stressed s179 liability valuation
Yield13
Current definition Stressed definition
A Half of the sum of the FTSE Actuaries’ Government
Securities Index-Linked annualised Real Yields over 15
years assuming: a) 5% inflation; and b) 0% inflation.
Current less 126bps
B The annualised yield on the FTSE Actuaries’
Government 20 year Fixed Interest Index
Current less 66bps
C The annualised yield on the FTSE Actuaries’
Government 15 year Fixed Interest Index.
Current less 66bps
D Half of the sum of the FTSE Actuaries’ Government
Securities Index-Linked annualised Real Yields over five
years assuming: a) 5% inflation; and b) 0% inflation.
Current less 126bps
5.23 The advantages of this approach are that:
it is simple and can be applied consistently across all schemes
it does not require any additional asset-related information to be captured.
5.24 The disadvantages of this approach are that:
it does not have the flexibility to reflect specifics of scheme investment strategies, in
particular translated the risk factor stresses to asset value stresses may discourage
schemes from efficient hedging techniques that use derivatives as the benefit may not
be reflected.
the simplification of risk factor stresses to asset value stresses opens up the possibility
for pension schemes to influence the outcome of the calculation in their favour.
12
The Transformation Appendix is appended to the PPF’s determination under Section 175(5) of the Pensions Act 2004. 13
As defined in the PPF’s guidance on assumptions to use when undertaking a Section 179 valuation (version A5, October 2009)

Strictly Private & Confidential 10 September 2010
www.redington.co.uk 21
A possible variation
5.25 We have further considered whether it would be possible to group the stress tests into a smaller
number without losing the accuracy. We have tested carrying out a single liability stress
together with one stress test on “matching assets” (in which we have combined government and
corporate bonds) and one on “non-matching assets” (all other assets). This resulted in the
following (optimised) stress factors:
Table 10: Grouping the risk factors into a smaller number of stress tests
Average
difference
Liability stress Matching asset
stress
Return seeking
stress
Standard
deviation
0% 24% 20% -16% 5.63%
1% 23% 20% -15% 5.37%
2% 21% 19% -14% 5.11%
5.26 It can be seen that the grouped approach does not reduce accuracy by any significant amount.
Whilst simpler to calculate, the added complexity of deciding on the appropriate matching
together with the fact that all eight data items are collected anyway makes it more of an
academic alternative. This is particularly the case for more complex investment and/or hedging
strategies. In addition if the liability stress is assessed at an aggregate level, it will be less
representative of any individual pension scheme.
Option C
How would it be applied?
5.27 Under this option, the liability stress test would still be carried out by the PPF in line with the
description in paragraph 5.22 above. The asset stress test would be submitted by the schemes
via Exchange, potentially along with an external verification.
5.28 This would include, reflecting the actual duration of fixed income portfolios, including duration
hedging assets. In addition, treatment of various other types of investment could be reflected
by reflecting the changes in the underlying risk factors, including equity options, interest rate
swaps, inflation swaps and other derivatives. We believe this is an area where the level of
sophistication in a scheme’s governance structure may need to be considered to avoid “anti-
selection”, for instance schemes could put an equity collar in place around 31 March each year
purely to reduce their pension protection levy. Schemes could be given a list of investment
types that would automatically trigger the need to use this option; schemes may be allowed to
opt for this approach themselves.
5.29 The advantage of this approach is that it can more accurately reflect a scheme’s specific
investment strategy.
5.30 The disadvantages of this approach are that:
it introduces anti-selection risk, i.e. that a scheme could choose whichever of options B
and C gives the smaller levy. To counter this, the PPF could require that some schemes

Strictly Private & Confidential 10 September 2010
www.redington.co.uk 22
must use option C, for example schemes over a certain size or with significant amounts
of hedging.
there will be an additional cost for schemes in calculating the stressed asset values. For
schemes with strong investment governance, it may be quite straightforward. For
pooled funds, it is possible that asset managers could provide “stressed” valuations to all
pension fund investors. We have approached a small number of pooled LDI asset
managers and in principle, it might be possible to provide either stressed valuations or
additional sensitivity data to enable schemes to assess the stressed valuations more
easily. We recommend that the PPF considers approaching them more formally.
it would require the PPF to collect an additional set of “stressed assets” with
accompanying verification procedures.
it is likely that for the vast majority of schemes, hedging/insurance objectives will not be
based on the s179 liability valuation.
5.31 Our preferred approach would be for stress tests on derivative-type assets to be applied
accurately (i.e. re-pricing based on the risk factor stresses) which would in our experience
necessitate significant input from the asset manager and/or investment consultant. However
we recognise that this might be a costly route and discuss alternative lower cost routes (with
potentially lower accuracy) in section 7.
A possible variation
5.32 An alternative approach would be for all schemes to submit much more detail on their
investment strategy to the PPF (for example, similar to the FSA’s Form 4814 for insurance
business). This would give the PPF enough information to reflect a scheme’s individual
investment strategy when calculating the stresses. This would be very onerous for the PPF due
to the large number of schemes. It would also lead to increased expense for pension schemes.
This would need to be compared with the potential additional cost to schemes for calculating
the asset stresses.
Smoothing
5.33 All of this analysis so far is based on data at 31 March 2009. As discussed in the previous
section, the volatility of the s179 funding ratio is sensitive both to the period of time and hence
historic asset and liability experience that is included in the model, as well as the initial funding
ratio of a scheme.
5.34 Whilst the use of smoothing techniques is not immediately congruous with a market-consistent
model, the use of smoothed asset, s179 liability and stress tests is likely to reduce the volatility
of the Risk-Based Levy, which would help it meet the longer-term predictability objective set by
the Steering Group.
14
This can be found at http://www.fsa.gov.uk/pubs/forms/Appendix9_3_Form48.pdf

Strictly Private & Confidential 10 September 2010
www.redington.co.uk 23
5.35 We are therefore relatively indifferent between the period of smoothing to be used, although it
needs to be sufficiently long such that the predictability objective set by the Steering Group can
be assessed and demonstrated. If smoothing is to be adopted over, say, a three-year period and
the new formula is effective from 2012, then we would suggest that 3-year periods of data are
taken for each year-end, i.e:
Table 11: One possible way of defining the smoothing process
Date of asset valuation Date of s179 liabilities Data underlying stress tests
31 March 2009 31 March 2009 1 April 2006 to 31 March 2009
31 March 2010 31 March 2010 1 April 2007 to 31 March 2010
31 March 2011 31 March 2011 1 April 2008 to 31 March 2011
5.36 This way, the impact of each additional year of information will have a smaller effect than
without any smoothing.
5.37 If, under option B, the asset stress tests are also rounded, this could further add to the stability.
One way would be to round the asset stress tests to the nearest 0.5%, as follows:
Table 12: Translating risk factor stresses to asset value stresses
Corporate
bonds
Nominal
Gilts
Index-
linked gilts
UK
Equity
Overseas
Equity
Property Cash Other
-4.5% +9.5% +19.0% -21.5% -18.5% -7.0% 0% -21.5%
Strictly Private & Confidential 10 September 2010
www.redington.co.uk 24
6 Impact analysis
Levy distribution
6.1 The PPF has proposed that the underfunding should be calculated as the stressed value of the
s179 liabilities less the stressed value of the assets (with a minimum of zero). This is then
multiplied by the probability of insolvency over the year to arrive at the Risk-Based Levy.
6.2 In this section, we analyse how the introduction of investment risk into the Risk-Based Levy
would alter the distribution of the levy by comparing the levy under Option B in the previous
section, with an alternative where all scheme asset values are stressed by a fixed percentage.
For the purposes of illustrating purely the redistribution, we have chosen this fixed percentage
such that the aggregate levy is equal.
6.3 It should be noted that we are unable to compare Option B and Option C as there is insufficient
data to do this.
6.4 At this point it is worth mentioning one aspect of the analysis that often can be ‘optically’
confusing. We have measured the volatility in terms of the funding ratio i.e. assets divided by
liability value, but the individual stress tests get applied via a levy formula that effectively looks
at the absolute deficit (i.e. the difference between assets and liability value). The result can be
that the change in deficit looks a lot larger than the volatility.
6.5 This arises because when looking at the variability of absolute deficit, it is customary to divide it
by the “pre-stressed” value of the liabilities. Whereas when measuring the volatility of the
funding ratio, this will include stressed asset and stressed liability values – as a significant part of
the volatility arises from the liabilities the size of the denominator will be larger in this scenario
and hence lead to a lower value for the volatility measure. We are comfortable that this is just
an ‘optical’ issue and does not affect the rationale for converting the volatility to individual
stresses.
6.6 The following charts compare the impact of introducing stress tests across schemes with
different s179 funding ratios.

Strictly Private & Confidential 10 September 2010
www.redington.co.uk 25
Chart 13: Distribution of the levy by s179 funding ratio
6.7 Chart 13 shows that for schemes with funding ratio lower than 80%, the introduction of risk
factor stress tests would in increase their proportion of the risk-based levy.
Chart 14: Ratio of the levy using individual risk factor stresses to the levy using a fixed asset stress by initial s179 funding ratio
0
50
100
150
200
250
300
350
400
40% 45% 50% 55% 60% 65% 70% 75% 80% 85% 90% 95% 100% 105% 110% >110%
Tota
l Lev
y (G
BP
Mill
ion
s)
Initial s179 funding ratio
Distribution of the levy by s179 funding ratio
Risk factor stresses Fixed asset stress
0%
20%
40%
60%
80%
100%
120%
140%
40% 45% 50% 55% 60% 65% 70% 75% 80% 85% 90% 95% 100% 105% 110% >110%
Rat
io
Initial s179 funding ratio
Ratio of the levy using individual risk factor stresses to the levy using a fixed asset stress by initial s179 funding ratio
Levy under risk factor
approach is lower.
Levy under risk factor
approach is higher.

Strictly Private & Confidential 10 September 2010
www.redington.co.uk 26
6.8 The following charts compare the impact of introducing stress tests across schemes with
different proportions of assets in return-seeking assets.
Chart 15: Distribution of the levy by proportion of return-seeking assets
0
100
200
300
400
500
600
700
10% 20% 30% 40% 50% 60% 70% 80% 90% 100%
Tota
l Lev
y (G
BP
Mill
ion
s)
Proportion of return-seeking assets
Distribution of the levy by proportion of return-seeking assets
Risk factor stresses Fixed asset stress
Levy under risk factor
approach is higher.
Levy under risk factor
approach is lower.

Strictly Private & Confidential 10 September 2010
www.redington.co.uk 27
Chart 16: Ratio of the levy using individual risk factor stresses to the levy using a fixed asset stress by proportion in return-seeking assets
6.9 The charts show that the proposed individual risk factor stresses will redistribute the levy away
from schemes with higher funding ratios and lower proportions of return-seeking assets to those
with lower funding ratios and higher proportions of return-seeking assets.
Comparison with other regimes where stress tests are used
6.10 We would caution against direct comparison of the proposed stress tests for pension protection
levy purposes with other regimes (e.g. the FTK regime in the Netherlands). Firstly, the overall
objectives of the stresses tests are different. Also, the aggregate level of stresses are different,
for example the one standard deviation used in Section 5 equates to a confidence level of c84%,
whereas insurance solvency regimes are typically set at higher levels, e.g. 97.5% or 99.5%.
0%
20%
40%
60%
80%
100%
120%
140%
10% 20% 30% 40% 50% 60% 70% 80% 90% 100%
Rat
io
Proportion of return-seeking assets
Ratio of the levy using individual risk factor stresses to the levy using a fixed asset stress by proportion in return-seeking assets

Strictly Private & Confidential 10 September 2010
www.redington.co.uk 28
7 Implementation considerations
7.1 Changing the formula for the Risk-Based Levy will necessitate some changes to the data
provided by pension schemes via Exchange, and also changes to the PPF’s own internal
processes.
Who will use option C
7.2 Option B requires no additional data provision on pension scheme assets, although schemes will
be required to indicate if they have specific investments which will automatically require them
to use option C. Such strategies commonly include:
Equity derivatives (e.g. futures, total return swaps, or options)
Interest rate swaps or swaptions, including pooled “LDI” funds
Inflation swaps, including pooled “LDI” funds
Credit default swaps
7.3 In Appendix E, we have set out examples of some of the questions and explanations that might
be added to Exchange to assist schemes in determining whether using option C is required or
not. The intention is only to identify such strategies where they explicitly form part of a
scheme’s asset allocation as recorded in its Statement of Investment Principles. Derivatives used
by asset managers for the purposes of efficient allocation/day-to-day management are not
covered.
7.4 Some schemes may want to choose option C even without any of the above derivative
exposures should they feel that the benchmarks being used to derive the asset value stresses are
materially different to their actual asset holding or investment strategy – this will be particularly
the case for fixed income assets, where the asset value stress is a combination of up to three risk
factor stresses (interest rate, inflation and credit), or for particular mandates with active
management, where benchmark may not provide a fair representation of the underlying risks.
7.5 One of the considerations raised by the previous consultation was whether allowing schemes to
choose between options B and C is likely to be unfair, particularly given larger schemes with
more resources may benefit from looking at both options and choosing the one that gives the
lower levy. Any system that allows options is going to offer arbitrage opportunities; however
the PPF will have the ability to compare the option C stressed asset values with the option B
stressed asset value and will therefore be able to investigate any significant difference. In
addition, we believe there is benefit from exploring the possibility that pooled funds, including
life office investment funds, could provide stressed asset values to pension schemes which could
be more cost effective on an aggregate basis.
Implementing option C
7.6 Those pension schemes that either choose to or are required to opt for Option C will need to
calculate the stressed value of the asset portfolio.

Strictly Private & Confidential 10 September 2010
www.redington.co.uk 29
7.7 The pricing of these derivative instruments is complex. Our preference would be for the stress
tests on these assets to be applied accurately, by which we mean re-pricing at the relevant date
allowing for the risk factor stresses. In most cases, this approach would likely require significant
input from the asset manager and/or investment consultant.
7.8 Whilst this re-pricing would be relatively straightforward for asset managers and/or investment
consultants to do, it will undoubtedly increase the associated cost of applying the stress tests.
As an alternative, simpler approaches could be taken and calculated by the schemes themselves.
For example, for equity options, rather than re-pricing market value, schemes could calculate
the change in the intrinsic value15 of the option instead, and use this to assess the impact of the
stress. We assume that the underlying market value of the option would be in the original asset
value.
7.9 Similarly, for interest rate and inflation swaps, the asset manager/investment consultant could
be asked to provide the scheme with the impact of a 1 basis point change in risk factor (which is
either typically provided on a regular basis or is readily available) and the scheme can scale this
up to reflect the size of the actual stress test. This would be a broad brush estimate of the actual
impact as the accuracy of this scaling approach diminishes with higher durations and larger
stresses (i.e. the multiple of the scaling). In general, the approximate method will understate
the true impact of the stress. Again, the market value of the swaps is assumed to be in the
original asset value.
7.10 We illustrate this difference for an example portfolio of interest rates swaps. This example
portfolio commenced on 1 January 2010, with a notional exposure of £5m across five different
duration buckets. We have assessed the subsequent value of the portfolio at 31 July 2010 and
calculated the stressed value using both approaches. We have used the stresses at 31 March
2009 (in line with Table 4b) for illustrative purposes.
Table 17: Illustration of the different approaches to calculating stress tests for interest rate swaps
Maturity (years)
Notional exposure
Present value at
31 July 2010
PV01 Accurate stress test of 66 bps
Approx stress test of 66 bps
Total accurate stressed
value
Total approx
stressed value
Difference
(A) (B) (C)=(B)×66 (A)+(B) (A)+(C) 10 1,000,000 97,356 979 66,886 64,639 164,242 161,995 1.4% 20 1,000,000 101,062 2,063 145,660 136,157 246,722 237,220 3.9% 30 1,000,000 52,769 3,006 219,545 198,402 272,314 251,170 7.8% 40 1,000,000 12,75 3,887 293,727 256,520 306,432 269,225 12.1% 50 1,000,000 1,311 4,826 377,496 318,507 378,807 319,818 15.6% Total 5,000,000 265,204 14,761 1,103,314 974,225 1,368,517 1,239,429 9.4%
All figures are £ unless otherwise indicated. PV01 is the sensitivity of the portfolio to a one basis point
change in interest rates
15
The intrinsic value of an option is the value that would be realised if the option expired immediately. The market value also takes into account the time value of the option arising from potential changes in intrinsic value between the valuation date and actual future expiry date, which is primarily driven by the volatility of the underlying instrument. For the holder of an option, the intrinsic value is theoretically lower than the market value.
Strictly Private & Confidential 10 September 2010
www.redington.co.uk 30
7.11 In Appendix F, we provide examples of what guidance might be offered to pension schemes if
this simpler approach is adopted.
7.12 To limit the impact on schemes that are required to use option C, the PPF may want to consider
only requiring those schemes to provide the additional asset stresses on the specific asset
classes that triggered the requirement rather than all assets. With the anticipated growth of
schemes investing in derivative-type contracts to manage their interest rate and inflation risks,
this might be an acceptable compromise.
Considerations for the PPF
7.13 Under Options B and C, the PPF would need to be able to extend its methodology for rolling
forward s179 liabilities to also include the calculation of the stressed liabilities under the
adjusted yields in table 9.
7.14 Under Option C, the PPF will need to be able to store the additional stressed asset values it
receives from pension schemes and is likely to want a high level verification process. At the
moment, the PPF carries out basic validity tests on data inputs to ensure the values make sense
(e.g. flagging negative numbers, or percentages that add up to something different to 100);
however we are not aware of any test that are carried out on the data itself.
7.15 Similar validity checks can be carried out on stressed asset values, but by definition it will be
difficult to provide general guidance on how a stressed asset value might compare to the
unstressed value. Extreme results could be flagged for further investigation – for fixed income
portfolios, this could be done by using the stressed asset values to derive an implied duration,
which might be easier to compare.
7.16 The PPF may want to consider external verification of stressed asset values; however there are a
number of issues to consider if this is to be pursued:
Current asset values on Exchange are provided at the latest s179 valuation date and are
therefore audited. Even if an asset manager were to provide the value of a stress test, it
would not necessarily be to the same level of comfort as an auditor and may be at
different date to the latest s179 valuation date.
Should the simpler approaches be taken (in line with those discussed in 7.9 and 7.10
above and as illustrated in Appendix F), the PPF could consider asking for documentary
evidence of all underlying inputs.
Not uniquely applying to stress test data, but the PPF is reliant on schemes disclosing all
relevant positions as it would not be possible to identify any gaps in data.
7.17 In all cases, should a change in levy formula be implemented, the PPF will need to update its
process for taking data from Exchange and turning it into levies for each pension scheme.
7.18 This is summarised in the table below, together with estimated additional consultancy costs that
might be incurred by pension schemes:

Strictly Private & Confidential 10 September 2010
www.redington.co.uk 31
Table 18: Estimated additional costs that would be incurred by pension schemes
Option Additional data needed Additional PPF cost Estimated additional
Scheme cost
B Stressed s179 liabilities
Stressed asset figures
Extra liability calculation
Cost of calculating the stresses
None
None
C Stressed s179 liabilities
Stress asset figures
Extra liability calculation
Data capture/verification
None
£2,000 to £5,000
7.19 The additional scheme cost is difficult to estimate as it depends on a large number of factors and
in practice could be much greater than £5,000 as it will depend on:
the complexity of the pension scheme’s investment strategy
whether stress tests are calculated by the scheme itself or an external asset
manager/investment consultant
whether the scheme is reflecting its own benchmark or each individual asset position
(for example benchmarks may not reflect the underlying risk for some actively managed
portfolios)
the presence of an investment sub-committee that might have a detailed knowledge of
the asset sensitivities and (perhaps with the support of a consultant) may have the
information readily available or easily obtainable
whether the scheme’s assets are held in segregated or pooled funds – typically for
pooled funds, a pension scheme might receive a lower level of detail on the underlying
asset positions. As mentioned before, there may be benefit in exploring more formally
whether fund managers (e.g. pooled fund managers, or life office product providers)
might be asked to provide stressed asset valuations or additional information to assist
schemes to carry out the stress tests more easily so that these costs can be minimised.
For example, with LDI funds, the fund manager may be able to provide a “PV01”
calculation (which represents the sensitivity of the portfolio to a 0.01% change in yields),
which can then be scaled up to provide an approximate stress test.

Strictly Private & Confidential 10 September 2010
www.redington.co.uk 32
8 Recommendation
8.1 As explained in Chapter 3, we believe that stress tests are an appropriate way for the PPF to
incorporate investment risk into the formula for the risk-based levy, particularly by reference to
the approaches taken in other regimes. We believe that it is preferable for these stress tests to
be defined by risk factor rather than by asset type. This is because using risk factors can more
accurately reflect a pension scheme’s investment strategy both in terms of the asset categories
recorded on Exchange, but also additional hedging/derivative strategies that are increasingly
being adopted by pension schemes. This was discussed in section 5. In more accurately
reflecting the breadth of investment strategies utilised by pension schemes, risk factor stresses
also would meet a further consideration from the previous consultation. On this basis, we
would recommend Option C for all schemes. This is similar to the Option 4 (out of five)
presented in Chapter 5 of the previous consultation, albeit on a mandatory, rather than
voluntary basis.
8.2 However, we recognise that Option C will increase the amount of work needed by each pension
scheme, and hence the amount of data collection and verification required by the PPF. This was
discussed in section 7. This may suggest a preference for option B for practical purposes,
although ultimately the chosen option will need to balance the advantages and disadvantages of
each option.
8.3 An alternative is for the PPF to calculate the stressed asset and liability values for all schemes
(option B) with schemes required to submit more refined asset stresses under option C if either
i) they had a certain type of investment strategy, or
ii) they choose to.
8.4 Due to their complexity, our preference would be for these refined asset stresses to be
calculated by an external asset manager/investment consultant, but we have also presented an
option where simpler, but less accurate, methodologies could be adopted by pension schemes.
This is similar to Option 3 presented in the previous consultation, but with Option 4 applied on a
mandatory basis for those schemes with a certain type of investment strategy. Examples of
guidance that might be used to support schemes carrying out their own stress tests is included in
Appendices E and F.
8.5 One further consideration raised as part of the previous consultation – and also highlighted by
feedback from the Steering Group – was a concern that providing schemes with more than one
option might unfairly disadvantage smaller schemes with fewer resources. Whilst providing an
option will inevitably lead to a certain level of arbitrage, the PPF will be able to monitor the
difference in the asset stresses under the two options and we believe there is merit in more
formally approaching pooled fund managers and life office product providers to discuss the
possibility of providing stressed asset valuations.

Strictly Private & Confidential 10 September 2010
www.redington.co.uk 33
8.6 In its previous consultation, the Board of the PPF saw a potential long-term solution to be
bespoke modelling carried out by at least the larger schemes. We do not necessarily see this as
a viable option, particularly if the UK pensions regulatory regime does not itself move to a risk-
based framework.

Strictly Private & Confidential 10 September 2010
www.redington.co.uk 34
Appendix A
Funding ratio volatilities
500 sample schemes
Set out below are the 500 sample scheme volatilities we provided to David McCarthy with some
of the basic scheme data at 31 March 2009. Details of how the volatilities have been calculated
are in section 4. We also show a scatter chart of the 500 volatilities against the proportion of
each scheme’s assets held in non-matching assets.
Chart A1: The distribution of s179 funding level volatilities across the 500 sample schemes
0 0
18
34
20 18
38
81
205
61
24
1 00
50
100
150
200
250
0.0% 2.5% 5.0% 7.5% 10.0% 12.5% 15.0% 17.5% 20.0% 22.5% 25.0% 27.5% 30.0%
Nu
mb
er o
f sc
hem
es
Distribution of section 179 funding ratio volatility

Strictly Private & Confidential 10 September 2010
www.redington.co.uk 35
Chart A2: Plot of s179 funding level volatility against proportion invested in non-matching assets for the 500 sample schemes
0%
10%
20%
30%
40%
50%
60%
70%
80%
90%
100%
0% 5% 10% 15% 20% 25% 30%
% In
vest
ed
in N
on-
mat
chin
g as
sets
Volatility of s179 funding level
Distribution of the 500 sample schemes
Strictly Private & Confidential 10 September 2010
www.redington.co.uk 36
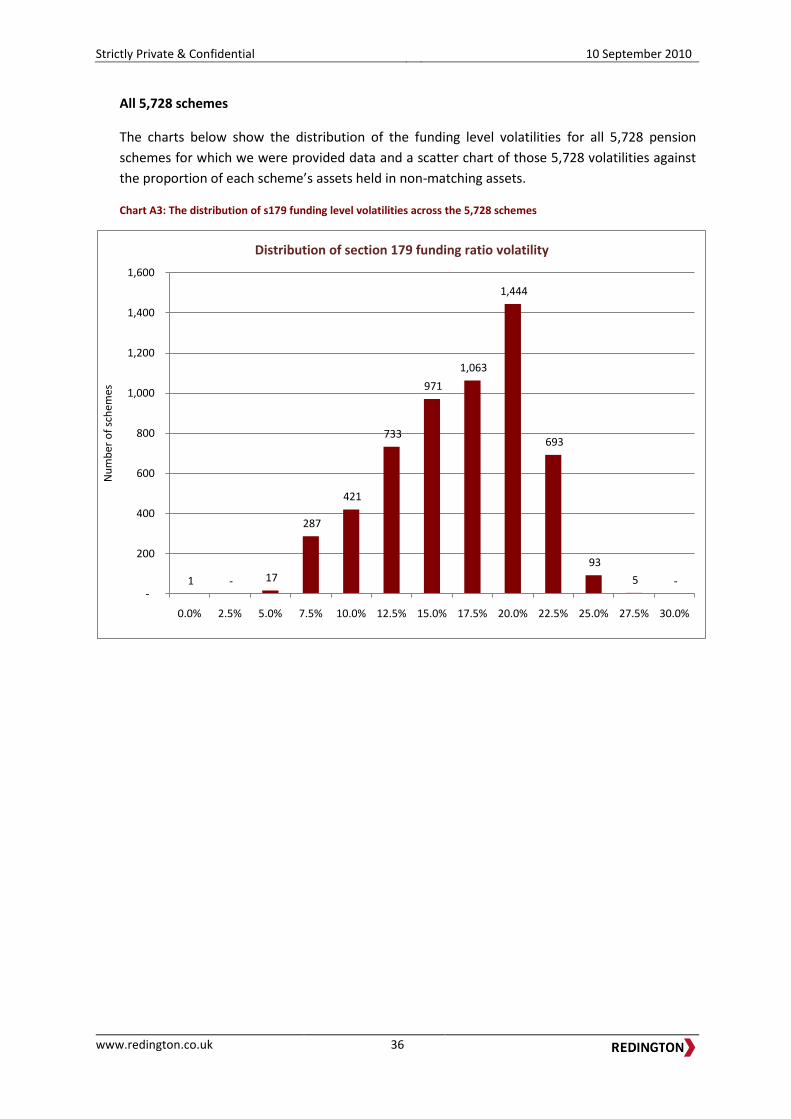
All 5,728 schemes
The charts below show the distribution of the funding level volatilities for all 5,728 pension
schemes for which we were provided data and a scatter chart of those 5,728 volatilities against
the proportion of each scheme’s assets held in non-matching assets.
Chart A3: The distribution of s179 funding level volatilities across the 5,728 schemes
1 - 17
287
421
733
971
1,063
1,444
693
93
5 --
200
400
600
800
1,000
1,200
1,400
1,600
0.0% 2.5% 5.0% 7.5% 10.0% 12.5% 15.0% 17.5% 20.0% 22.5% 25.0% 27.5% 30.0%
Nu
mb
er o
f sc
hem
es
Distribution of section 179 funding ratio volatility

Strictly Private & Confidential 10 September 2010
www.redington.co.uk 37
Chart A4: Plot of s179 funding level volatility against proportion invested in non-matching assets for the 5,728 schemes
0%
10%
20%
30%
40%
50%
60%
70%
80%
90%
100%
0% 5% 10% 15% 20% 25% 30%
% In
vest
ed
in N
on
-mat
chin
g as
sets
Volatility of s179 funding level
Distribution of the 5,728 schemes

Strictly Private & Confidential 10 September 2010
www.redington.co.uk 38
Appendix B
Longevity risk
There are two areas of consideration when assessing the appropriateness of including longevity
as a risk factor in the stress tests
What is an appropriate longevity stress?
Simple deterministic stresses that are often used in practice (for example, assuming the life
expectancy of all members increases by one year) are intuitive to understand, but arguably fail
to adequately reflect the underlying risk.
More complex stress tests that are more representative of the underlying risks of individual
schemes are likely to be too onerous for all but the most sophisticated of pension funds,
particularly in the format of the current assumptions being used for s179 valuations.
In addition, in a market-consistent model, such as the one built for this analysis, the lack of
market data on longevity risk means it is difficult to calibrate consistently.
What is the impact?
We have assessed the impact of incorporating longevity risk into our Monte Carlo model.
The table below shows the attribution of risk (in this case measured by a 1-year Value-at-Risk at
the 1-in-20 confidence level) within a typical pension portfolio before and after incorporating
longevity risk. It shows that although longevity risk on its own is not insubstantial (in this case
5.17% of liabilities), the overall contribution to risk is not significant (0.53%) due to its
diversification against other risk factors, although this increases as the other risks are hedged
and/or reduced (see Table B5 below)
Chart B1: The attribution of Value at Risk of a sample pension scheme without allowing for longevity risk
3.40%1.40%
34.66%
0.05%8.00%
14.83%
37.33%
-10%
0%
10%
20%
30%
40%
50%
60%
Attribution of risk without longevity risk

Strictly Private & Confidential 10 September 2010
www.redington.co.uk 39
Chart B2: The attribution of Value at Risk of a sample pension scheme with allowance for longevity risk
The following table shows how the same Value at Risk measure, before and after the inclusion of
longevity risk, varies by the proportion of assets held in equity and also the amount of hedging in
place in a scheme. It can be seen that the schemes where longevity risk does have a significant
impact are those schemes where they have managed away most of their equity, inflation and
interest rate risk.
Table B3: Table showing risk without allowance for longevity risk
Table B4: Table showing risk with allowance for longevity risk
37.33%
3.40%1.40%
34.66%
0.05%8.00%
5.17%14.83%
0.53%
0%
10%
20%
30%
40%
50%
60%Attribution of risk with longevity risk
Liability
hedge100% 90% 80% 70% 60% 50% 40% 30% 20% 10% 0%
0% 39.1% 36.9% 34.7% 32.7% 30.8% 28.9% 27.3% 25.7% 24.6% 23.7% 23.0%
20% 35.6% 33.4% 31.2% 29.0% 26.9% 25.0% 23.0% 21.3% 20.0% 19.0% 18.3%
40% 32.6% 30.2% 27.9% 25.5% 23.4% 21.2% 19.1% 17.2% 15.5% 14.2% 13.6%
60% 30.2% 27.6% 25.1% 22.6% 20.2% 17.8% 15.5% 13.3% 11.4% 9.7% 8.9%
80% 27.8% 25.3% 22.7% 20.2% 17.6% 15.1% 12.5% 10.1% 7.8% 5.7% 4.4%
100% 26.4% 23.8% 21.2% 18.6% 16.0% 13.4% 10.7% 8.2% 5.7% 3.5% 2.0%
Proportion of equity
Liability
hedge100% 90% 80% 70% 60% 50% 40% 30% 20% 10% 0%
0% 39.4% 37.2% 35.1% 33.1% 31.3% 29.4% 27.8% 26.2% 25.1% 24.2% 23.6%
20% 36.0% 33.8% 31.6% 29.4% 27.4% 25.6% 23.6% 21.9% 20.7% 19.7% 19.0%
40% 33.0% 30.7% 28.4% 26.0% 23.9% 21.8% 19.8% 18.0% 16.3% 15.1% 14.5%
60% 30.6% 28.1% 25.6% 23.2% 20.8% 18.6% 16.4% 14.3% 12.6% 11.0% 10.3%
80% 28.3% 25.8% 23.3% 20.8% 18.4% 16.0% 13.6% 11.3% 9.3% 7.7% 6.8%
100% 26.9% 24.3% 21.8% 19.3% 16.8% 14.3% 11.9% 9.7% 7.7% 6.2% 5.5%
Proportion of equity

Strictly Private & Confidential 10 September 2010
www.redington.co.uk 40
Table B5: Table showing the increase in risk by including longevity risk (from Table A3 to Table A4)
The tables above show that whilst for the majority of positions, the addition of longevity risk does not significantly increase the overall risk, the risk for those schemes that fall into the lower right hand corner, i.e. with low proportion of equity and significant amounts of liability hedging, is significantly impacted.
Currently, there is insufficient data being held by the PPF to accurately assess the level of hedging of each scheme; however the tables below shows the proportion of schemes (both by number and by asset value at 31 March 2009) by the proportion of assets in equity and Redington’s estimate of the level of hedging based on the benchmarks chosen for the asset classes.
Table B6: Distribution of the 5,728 pension schemes by number of schemes
Table B7: Distribution of the 5,728 pension schemes by size of assets
Conclusion
Whilst there are a significant number of schemes in the PPF’s universe that have little/no return-
seeking assets, the distribution by asset size is more evenly distributed, peaking around 50% and
with little hedging. In these categories, the incorporation of longevity risk would likely have a
relatively small impact.
Liability
hedge100% 90% 80% 70% 60% 50% 40% 30% 20% 10% 0%
0% 0.3% 0.4% 0.4% 0.4% 0.4% 0.5% 0.5% 0.5% 0.5% 0.6% 0.6%
20% 0.4% 0.4% 0.4% 0.5% 0.5% 0.5% 0.6% 0.6% 0.7% 0.7% 0.7%
40% 0.4% 0.4% 0.5% 0.5% 0.6% 0.6% 0.7% 0.8% 0.8% 0.9% 1.0%
60% 0.4% 0.5% 0.5% 0.6% 0.7% 0.7% 0.8% 1.0% 1.1% 1.3% 1.4%
80% 0.5% 0.5% 0.6% 0.7% 0.7% 0.9% 1.0% 1.2% 1.6% 2.0% 2.4%
100% 0.5% 0.6% 0.6% 0.7% 0.8% 1.0% 1.2% 1.5% 2.0% 2.8% 3.6%
Proportion of equity
Liability hedge
ratio
90% to
100%
80% to
90%
70% to
80%
60% to
70%
50% to
60%
40% to
50%
30% to
40%
20% to
30%
10% to
20%
0% to
10%
0% 1.8% 8.0% 12.0% 15.7% 10.9% 6.8% 2.8% 1.6% 0.9% 14.2%
20% 0.0% 0.0% 0.1% 1.1% 3.8% 5.8% 2.9% 1.6% 0.7% 1.0%
40% 0.0% 0.0% 0.0% 0.0% 0.3% 0.7% 1.1% 0.9% 0.6% 1.0%
60% 0.0% 0.0% 0.0% 0.0% 0.0% 0.1% 0.3% 0.4% 0.3% 0.8%
80% 0.0% 0.0% 0.0% 0.0% 0.0% 0.0% 0.1% 0.1% 0.2% 0.4%
100% 0.0% 0.0% 0.0% 0.0% 0.0% 0.0% 0.0% 0.1% 0.2% 0.6%
Total 1.8% 8.0% 12.1% 16.8% 15.0% 13.5% 7.2% 4.7% 2.8% 18.0%
Proportion of equity
Liability hedge
ratio
90% to
100%
80% to
90%
70% to
80%
60% to
70%
50% to
60%
40% to
50%
30% to
40%
20% to
30%
10% to
20%
0% to
10%
0% 0.4% 4.3% 5.3% 13.3% 15.2% 9.7% 2.4% 4.2% 0.7% 1.2%
20% 0.0% 0.0% 0.0% 1.0% 7.1% 11.4% 4.4% 2.5% 0.9% 1.5%
40% 0.0% 0.0% 0.0% 0.0% 0.3% 1.8% 2.7% 2.1% 2.9% 1.0%
60% 0.0% 0.0% 0.0% 0.0% 0.0% 0.0% 0.0% 0.5% 1.3% 0.5%
80% 0.0% 0.0% 0.0% 0.0% 0.0% 0.0% 0.0% 0.1% 0.1% 0.1%
100% 0.0% 0.0% 0.0% 0.0% 0.0% 0.0% 0.0% 0.0% 0.5% 0.4%
Total 0.4% 4.3% 5.3% 14.3% 22.6% 22.8% 9.6% 9.4% 6.5% 4.7%
Proportion of equity

Strictly Private & Confidential 10 September 2010
www.redington.co.uk 41
We recognise that there is likely to be an increasing trend away from return-seeking assets into
matching assets over time, but together with the fact that there is no data on which to calibrate
the inclusion of longevity risk into a market-consistent model, on balance, we would not
recommend the inclusion of longevity risk in the Risk-Based Levy calculation at the current time.
This should be kept under regular review to monitor any trend of investment away from return-
seeking assets and also any emergence of a traded market in longevity risk and improved data
collection allows it to be incorporated in an effective and cost-efficient manner.

Strictly Private & Confidential 10 September 2010
www.redington.co.uk 42
Appendix C
Testing the distribution of the s179 funding ratio for normality
The Kolmogorov-Smirnov test can be used to test the goodness-of-fit of a sample with a
reference probability distribution. In this case, for each of the six sample schemes (some with
swaps overlays), we are comparing the 10,000 simulated funding ratios and testing it against a
normal distribution. The null hypothesis that the sample is distributed normally is rejected at
the 95% confidence level if the parameter is less than 5%.
The results were as follows:
Table C1: The output of the Kolmogorov-Smirnov test on the six sample schemes
Scheme 1 2 3a 3b 4a 4b 5a 5b 6a 6b
Funding level 90% 85% 80% 80% 75% 75% 70% 70% 60% 60%
Asset allocation
Equity 70% 60% 50% 50% 40% 40% 30% 30% 20% 20%
Bonds 30% 30% 30% 30% 40% 40% 50% 50% 60% 60%
Property - 10% 10% 10% 10% 10% 10% 10% 10% 10%
Hedge Funds - - 5% 5% 5% 5% 5% 5% 5% 5%
Cash - - 5% 5% 5% 5% 5% 5% 5% 5%
Swaps
(notional)
- - - 20% - 40% - 60% - 80%
Liability duration 25 23 23 23 21 21 19 19 17 17
15% 3% 0.06% 0.8% 0.01% 1.5% <0.01% <0.01% <0.01% <0.01%
Distance between 16th
and 84th
percentiles in funding level
Sample 45.2% 39.3% 36.4% 34.4% 30.5% 24.8% 25.2% 16.8% 20.6% 9.5%
Normal
distribution
46.9% 40.7% 37.8% 35.6% 31.9% 26.2% 30.0% 18.8% 22.4% 12.8%
The top half of the table shows that the funding ratio volatility is more likely to follow a normal
distribution for schemes that have a high proportion of assets allocated to equity and other
return-seeking assets. As previously shown in Tables B6 and B7 in Appendix B, the schemes in
the PPF’s universe have a relatively broad spread of equity exposure (peaking around 50%) and
low levels of hedging.
There will therefore be a significant number of schemes where the “fairness” model assumption
that the funding ratio follows a normal distribution does not hold.
The bottom half of the table shows the width of the funding level distribution between the 16th
and 84th percentiles of both the sample simulation and a normal distribution that is fitted to
have the same mean and variance as the sample simulation. We have chosen these percentiles
as they represent the points that are one standard deviation away from the mean in both
directions.

Strictly Private & Confidential 10 September 2010
www.redington.co.uk 43
We can see that the sample simulations in all cases have a narrower distribution around the
mean than the normal distribution, highlighting the fact that a normal distribution tends to
overstate the risk. However, as we move towards portfolios with more matching assets and/or
hedging, although the normality test fails, the absolute level of the funding level volatility can be
seen to fall and hence using a normal distribution still captures the majority of the benefit of the
risk management actions.

Strictly Private & Confidential 10 September 2010
www.redington.co.uk 44
Appendix D
Testing the volatility of the s179 funding ratio for different parameters
Table D1: Volatility of s179 funding ratio assuming 80% funding ratio, with model parameters based on daily market data between 1 January 2006 and 31 March 2009
S179 Funding Ratio Volatility
Liability duration (years)
Bond Allocation 10 15 20 25 30
10% 17% 18% 20% 22% 24%
20% 14% 16% 18% 20% 22%
30% 12% 14% 16% 18% 20%
40% 10% 12% 14% 16% 18%
50% 8% 10% 12% 14% 17%
60% 6% 8% 10% 12% 15%
70% 4% 6% 8% 11% 13%
Table D2: Volatility of s179 funding ratio assuming 106% funding ratio, with model parameters based on daily market data between 1 January 2006 and 31 March 2009
S179 Funding Ratio Volatility
Liability duration (years)
Bond Allocation 10 15 20 25 30
10% 22% 24% 26% 29% 32%
20% 19% 21% 23% 26% 29%
30% 16% 19% 21% 24% 27%
40% 14% 16% 18% 21% 24%
50% 11% 13% 15% 19% 22%
60% 8% 11% 13% 16% 20%
70% 6% 8% 11% 14% 18%
106% is the aggregate funding level of the PPF7800 index at 31 March 2008 and was therefore
chosen to show how the volatilities might move year-to-year. As can be seen, the funding ratio
volatility is very sensitive to the initial funding level assumed.

Strictly Private & Confidential 10 September 2010
www.redington.co.uk 45
Table D3: Volatility of s179 funding ratio assuming 80% funding ratio, with model parameters based on daily market data between 1 January 2006 and 31 December 2007
S179 Funding Ratio Volatility
Liability duration (years)
Bond Allocation 10 15 20 25 30
10% 8% 9% 11% 12% 14%
20% 7% 8% 10% 11% 13%
30% 6% 7% 9% 11% 12%
40% 5% 6% 8% 10% 12%
50% 4% 6% 7% 9% 11%
60% 3% 5% 6% 8% 10%
70% 3% 4% 6% 8% 10%
Table D4: Volatility of s179 funding ratio assuming 80% funding ratio, with model parameters based on daily market data between 1 January 2007 and 31 March 2009
S179 Funding Ratio Volatility
Liability duration (years)
Bond Allocation 10 15 20 25 30
10% 20% 22% 24% 27% 29%
20% 18% 20% 21% 24% 27%
30% 15% 17% 19% 22% 24%
40% 12% 14% 16% 19% 22%
50% 10% 12% 14% 17% 20%
60% 7% 10% 12% 15% 18%
70% 5% 7% 10% 13% 16%
The last three years have seen extremely volatile markets. As a result, the period over which the
model is calibrated has a significant effect on the resulting volatilities. This can be mitigated
somewhat by smoothing the outcomes over a number of years, but it suggests that the
“fairness” workstream should be tested for a range of input volatilities.
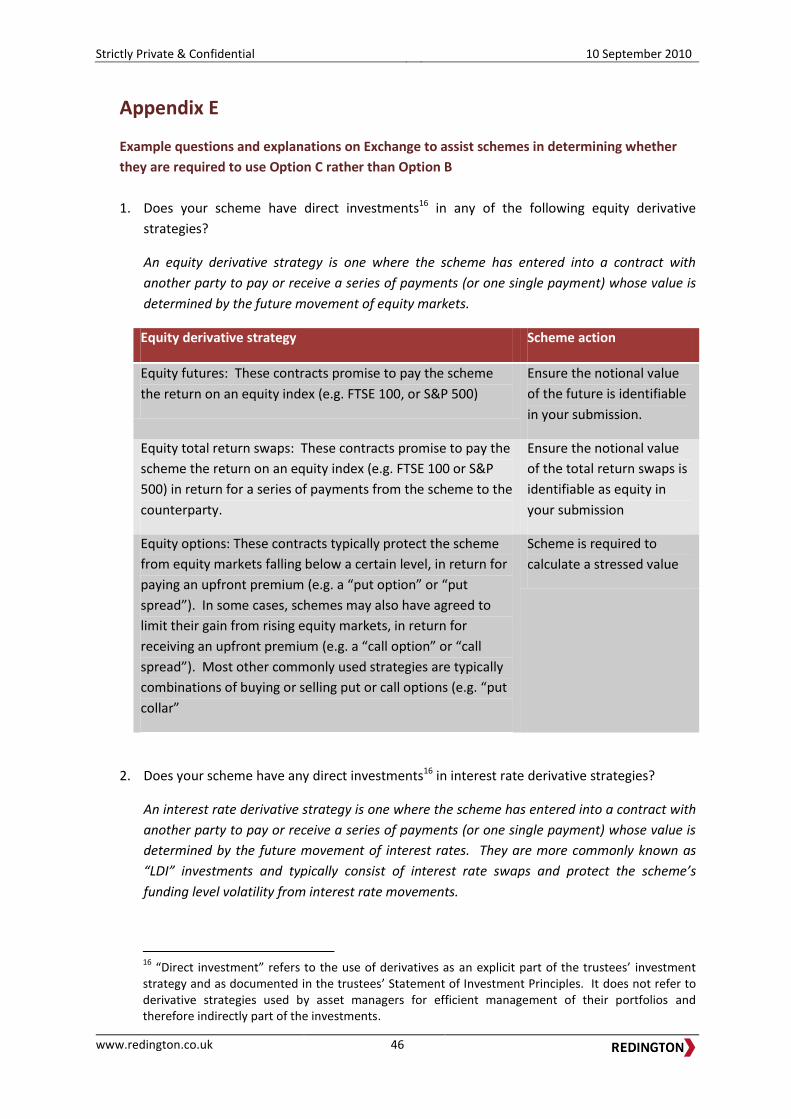
Strictly Private & Confidential 10 September 2010
www.redington.co.uk 46
Appendix E
Example questions and explanations on Exchange to assist schemes in determining whether
they are required to use Option C rather than Option B
1. Does your scheme have direct investments16 in any of the following equity derivative
strategies?
An equity derivative strategy is one where the scheme has entered into a contract with
another party to pay or receive a series of payments (or one single payment) whose value is
determined by the future movement of equity markets.
Equity derivative strategy Scheme action
Equity futures: These contracts promise to pay the scheme
the return on an equity index (e.g. FTSE 100, or S&P 500)
Ensure the notional value
of the future is identifiable
in your submission.
Equity total return swaps: These contracts promise to pay the
scheme the return on an equity index (e.g. FTSE 100 or S&P
500) in return for a series of payments from the scheme to the
counterparty.
Ensure the notional value
of the total return swaps is
identifiable as equity in
your submission
Equity options: These contracts typically protect the scheme
from equity markets falling below a certain level, in return for
paying an upfront premium (e.g. a “put option” or “put
spread”). In some cases, schemes may also have agreed to
limit their gain from rising equity markets, in return for
receiving an upfront premium (e.g. a “call option” or “call
spread”). Most other commonly used strategies are typically
combinations of buying or selling put or call options (e.g. “put
collar”
Scheme is required to
calculate a stressed value
2. Does your scheme have any direct investments16 in interest rate derivative strategies?
An interest rate derivative strategy is one where the scheme has entered into a contract with
another party to pay or receive a series of payments (or one single payment) whose value is
determined by the future movement of interest rates. They are more commonly known as
“LDI” investments and typically consist of interest rate swaps and protect the scheme’s
funding level volatility from interest rate movements.
16
“Direct investment” refers to the use of derivatives as an explicit part of the trustees’ investment strategy and as documented in the trustees’ Statement of Investment Principles. It does not refer to derivative strategies used by asset managers for efficient management of their portfolios and therefore indirectly part of the investments.

Strictly Private & Confidential 10 September 2010
www.redington.co.uk 47
If you have these strategies, you will need either need to request the stressed valuation
from the asset manager/investment consultant or carry out the calculation yourself with
some information from the asset manager. In the latter case you should ask your asset
manager for the “PV01” of the portfolio, i.e. the sensitivity of the portfolio value to a 0.01%
change in interest rates.
3. Does your scheme have any direct investments16 in inflation derivative strategies?
An inflation derivative strategy is one where the scheme has entered into a contract with
another party to pay or receive a series of payments (or one single payment) whose value is
determined by the future movement of inflation rates. They are more commonly known as
“LDI” investments and typically include inflation swaps and protect the scheme’s funding
level volatility from changes in inflation.
If you have these strategies, you will need either need to request the stressed valuation
from the asset manager/investment consultant or carry out the calculation yourself with
some information from the asset manager. In the latter case you should ask your asset
manager for the “PV01” and “IE01” of the portfolio, i.e. the sensitivity of the portfolio value
to a 0.01% change in interest rates and inflation respectively17.
4. Does your scheme have any direct investments16 in credit default swaps?
A credit default swap is where the scheme has agreed to make a series of payments to buy or
sell protection against the default of a corporate bond or corporate loan. They are
commonly used by pension schemes to manage sizeable exposures to corporate bond/loan
issuers.
If you have these strategies, you will need either need to request the stressed valuation
from the asset manager/investment consultant or carry out the calculation yourself with
some information from the asset manager. In the latter case you should ask your asset
manager for the “CDD01” of the portfolio, i.e. the sensitivity of the portfolio value to a
0.01% change in credit spreads.
17
Although the primary risk factor within inflation swaps will be inflation risk, the market value of the swaps contract will also have sensitivity to interest rates. On day 1, this sensitivity will be zero (for an unfunded swap).

Strictly Private & Confidential 10 September 2010
www.redington.co.uk 48
Appendix F
Example guidance on applying risk factor stress tests to asset strategies
Equity derivatives
The stress on the equity option is simply the change in the intrinsic value of the option. The
calculation is set out below and should be carried out separately for each option that the
scheme has.
Input parameters
Strike price of option: S
Level of the underlying index at 31 March [2009] P
Notional option exposure E
Equity stress test at 31 March [2009]
(note this may be different for UK and non-UK equity)
d
Intrinsic value calculations
A. Equity put option
1. Calculate current intrinsic value option Value_0 = max [0, E x (S – P) ÷ S]
2. Calculate stressed level of index P_stress = P × (1 + d)
3. Calculate stressed intrinsic value of option Value_1 = max [0, E x (S – P_stress) ÷ S]
4. Calculate stress test to apply Equity_stress = Value_1 – Value_0
B. Equity call option
1. Calculate current intrinsic value option Value_0 = max [0, E x (P – S) ÷ S]
2. Calculate stressed level of index P_stress = P × (1 + d)
3. Calculate stressed intrinsic value of option Value_1 = max [0, E x (P_stress – S) ÷ S]
4. Calculate stress test to apply Equity_stress = Value_1 – Value_0
Adjustment to total asset value
If the scheme has bought the option, the Equity_stress should added to the overall asset value,
i.e. the option increases the overall asset value.
If the scheme has sold the option, the Equity_stress should be subtracted from the overall asset
value, i.e. the option decreases the overall asset value.
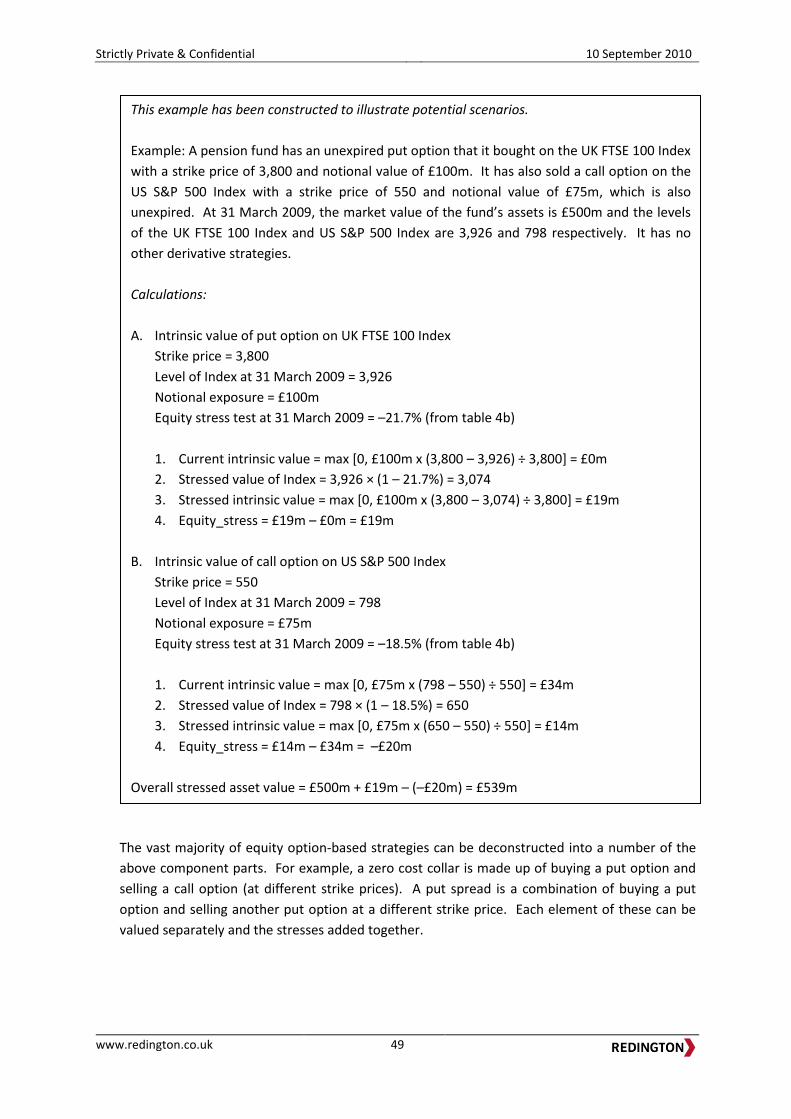
Strictly Private & Confidential 10 September 2010
www.redington.co.uk 49
The vast majority of equity option-based strategies can be deconstructed into a number of the
above component parts. For example, a zero cost collar is made up of buying a put option and
selling a call option (at different strike prices). A put spread is a combination of buying a put
option and selling another put option at a different strike price. Each element of these can be
valued separately and the stresses added together.
This example has been constructed to illustrate potential scenarios.
Example: A pension fund has an unexpired put option that it bought on the UK FTSE 100 Index
with a strike price of 3,800 and notional value of £100m. It has also sold a call option on the
US S&P 500 Index with a strike price of 550 and notional value of £75m, which is also
unexpired. At 31 March 2009, the market value of the fund’s assets is £500m and the levels
of the UK FTSE 100 Index and US S&P 500 Index are 3,926 and 798 respectively. It has no
other derivative strategies.
Calculations:
A. Intrinsic value of put option on UK FTSE 100 Index
Strike price = 3,800
Level of Index at 31 March 2009 = 3,926
Notional exposure = £100m
Equity stress test at 31 March 2009 = –21.7% (from table 4b)
1. Current intrinsic value = max [0, £100m x (3,800 – 3,926) ÷ 3,800] = £0m
2. Stressed value of Index = 3,926 × (1 – 21.7%) = 3,074
3. Stressed intrinsic value = max [0, £100m x (3,800 – 3,074) ÷ 3,800] = £19m
4. Equity_stress = £19m – £0m = £19m
B. Intrinsic value of call option on US S&P 500 Index
Strike price = 550
Level of Index at 31 March 2009 = 798
Notional exposure = £75m
Equity stress test at 31 March 2009 = –18.5% (from table 4b)
1. Current intrinsic value = max [0, £75m x (798 – 550) ÷ 550] = £34m
2. Stressed value of Index = 798 × (1 – 18.5%) = 650
3. Stressed intrinsic value = max [0, £75m x (650 – 550) ÷ 550] = £14m
4. Equity_stress = £14m – £34m = –£20m
C. Overall stressed asset value = £500m + £19m – (–£20m) = £539m

Strictly Private & Confidential 10 September 2010
www.redington.co.uk 50
Interest rate derivatives
The stress calculation calculates the increase in the value of the derivative associated with the
interest rate risk factor stress test.
Input parameters
PV01 of the portfolio at 31 March [2009]
(from the asset manager – this is the sensitivity of the
portfolio value to 1 basis point, or 0.01% change in rates)
PV01
Interest rate risk factor stress test at 31 March [2009] d (basis points)
Calculations
Calculate impact of stress test on portfolio PV01 × d
Typically, pension funds will be receiving the fixed leg of an interest rate swap, in which case the
absolute value of the stress test should be added to the overall asset value.
If the fund is paying the fixed leg of an interest rate swap, the absolute value of the stress test
should be deducted from the overall asset value.
This example has been constructed to illustrate potential scenarios.
Example: A pension fund has £5m notional of interest rate swaps, for which it is paying
floating rate and receiving fixed rate. At 31 March 2009, the asset manager has advised that
the present value of this swaps contract is £265,204 and the PV01 of this swaps portfolio is
–£14,761.
The total value of the pension fund’s assets at 31 March 2009 is £25m. The fund has no other
derivative contracts.
Calculations:
Interest rate stress test at 31 March 2009 = –66bps (see table 4b)
Stress test on interest rate swaps portfolio = –£14,761 × –66 = £974,226
The absolute value of the stress test should be added to the total asset value as the fund is
receiving fixed rate payments.
Overall stressed asset value = £25m + £974,226 = £25,974,226
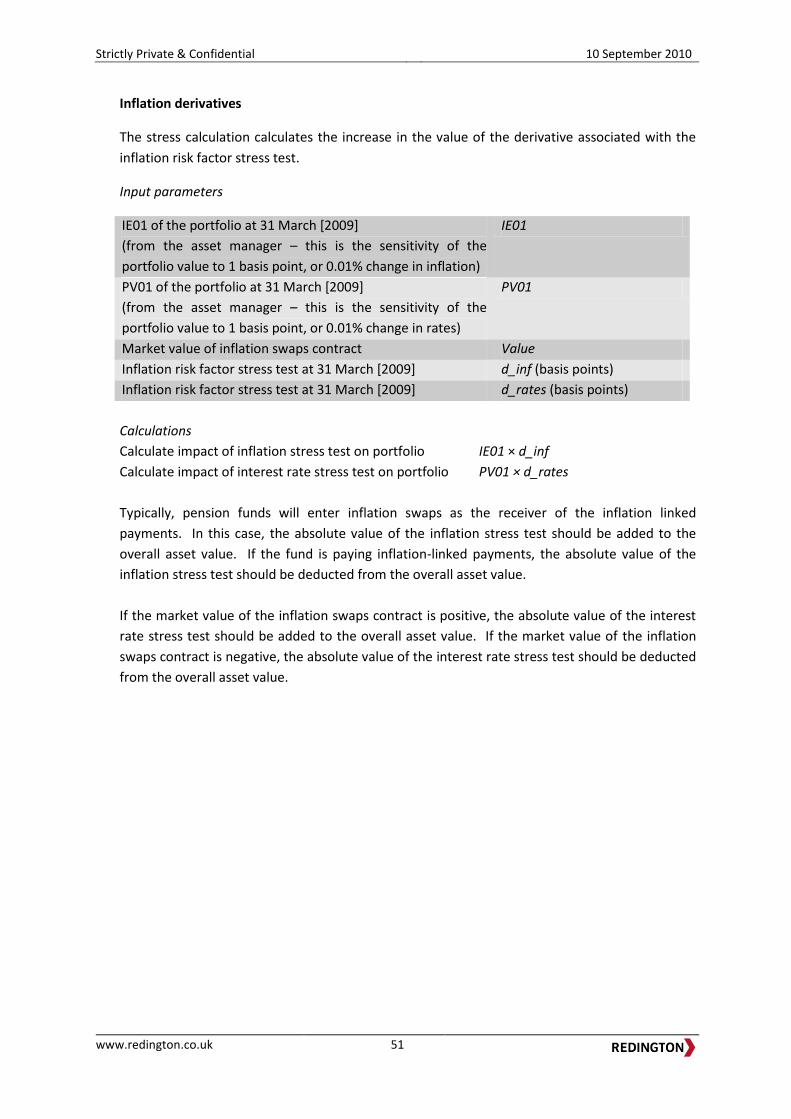
Strictly Private & Confidential 10 September 2010
www.redington.co.uk 51
Inflation derivatives
The stress calculation calculates the increase in the value of the derivative associated with the
inflation risk factor stress test.
Input parameters
IE01 of the portfolio at 31 March [2009]
(from the asset manager – this is the sensitivity of the
portfolio value to 1 basis point, or 0.01% change in inflation)
IE01
PV01 of the portfolio at 31 March [2009]
(from the asset manager – this is the sensitivity of the
portfolio value to 1 basis point, or 0.01% change in rates)
PV01
Market value of inflation swaps contract Value
Inflation risk factor stress test at 31 March [2009] d_inf (basis points)
Inflation risk factor stress test at 31 March [2009] d_rates (basis points)
Calculations
Calculate impact of inflation stress test on portfolio IE01 × d_inf
Calculate impact of interest rate stress test on portfolio PV01 × d_rates
Typically, pension funds will enter inflation swaps as the receiver of the inflation linked
payments. In this case, the absolute value of the inflation stress test should be added to the
overall asset value. If the fund is paying inflation-linked payments, the absolute value of the
inflation stress test should be deducted from the overall asset value.
If the market value of the inflation swaps contract is positive, the absolute value of the interest
rate stress test should be added to the overall asset value. If the market value of the inflation
swaps contract is negative, the absolute value of the interest rate stress test should be deducted
from the overall asset value.

Strictly Private & Confidential 10 September 2010
www.redington.co.uk 52
This example has been constructed to illustrate potential scenarios.
Example: A pension fund has £5m notional of inflation swaps, for which it is paying fixed rate
and receiving inflation. At 31 March 2009, the asset manager has advised that the market
value of this swaps contract is –£250,908, the PV01 of the contract is £908 and the IE01 of the
contract is £12,643.
The total value of the pension fund’s assets at 31 March 2009 is £13m. The fund has no other
derivative contracts.
Calculation:
Inflation stress test at 31 March 2009 = 60bps (see table 4b)
Interest rate stress test at 31 March 2009 = –66bps (see table 4b)
Inflation stress = –£12,643 × 60 = £758,580
Interest rate stress = £908 × –66 = –£64,680
The absolute value of the inflation stress should be added to the overall asset value as the
fund is receiving inflation-linked payments. The absolute value of the interest rate stress
should be deducted from the overall asset value as the market value of the swaps contract is
negative.
Overall stressed asset value = £13m + £758,580 – £64,680 = £13,693,900

Strictly Private & Confidential 10 September 2010
www.redington.co.uk 53
Credit default swaps
The stress calculation calculates the increase in the value of the derivative associated with the
credit risk factor stress test.
Input parameters
CDD01 of the portfolio at 31 March [2009]
(from the asset manager – this is the sensitivity of the
portfolio value to 1 basis point, or 0.01% change in credit
spreads)
CDD01
Credit risk factor stress test at 31 March [2009] d (basis points)
e.g. +120 at 31 March 2009
(see table 4b)
Calculations
Calculate impact of stress test on portfolio CDD01 × d
If the scheme has bought credit protection, the absolute value of this stress test should be
added to the asset value. If the scheme has sold credit protection, the absolute value of this
stress test should be subtracted from the asset value.

Strictly Private & Confidential 10 September 2010
www.redington.co.uk
This report has been prepared solely for the use of the Pension Protection Fund to assist in its consultation on the
future of the Risk-Based Levy. Redington accepts no responsibility for any consequences arising from any third party
relying on this report or the opinions we have expressed. This report is not intended by Redington to form a basis of
any decision by a third party to do or omit to do anything.
In preparing this report Redington has placed reasonable reliance on data supplied to us by third parties. In particular,
we have relied upon information, both quantitative and qualitative, supplied by the Pension Protection Fund. Whilst
reasonable care has been taken to gauge the reliability of this data, this report carries no guarantee of accuracy or
completeness and Redington cannot be held accountable for the misrepresentation of data by third parties involved.
All analysis (whether in respect of tax, accounting, law or of any other nature), should be treated as illustrative only
and not relied upon as accurate. This report is based on information available to Redington at the date of the report
and takes no account of subsequent developments after that date.
Redington Limited is authorised and regulated by the Financial Services Authority.
©Redington Limited 2010. All rights reserved.