to test the hypothesis that the social nature of the pupil ... · elementary and secondary schools...
TRANSCRIPT

DOCUMENT RESUME
ED 029 370By-O'Reilly. Robert P.: And OthersRelationship of Classroom Grouping Practices to Diffusion of Students' Sociometric Choices and Dif fusion ofStudents' Perception of Sociometric Choices.
Pub Date Feb 69Note-15p.: Paper presented at the Annual Meeting of the5-8, 1969)
EDRS Price MF-$0.25 HC-$0.85Descriptors-Ability Grouping. 'Educational Research. Elementary School Students. Hypothesis Testing.Interpersonal Relationship. *Learning Activities. Secondary School Students. Social Structure. SociometricTechniques. Student Grouping
To test the hypothesis that the social nature of the pupil team-learning situationdiffers in a number of respects from nongraded and conventionally graded classroomsituations, sociometric response data were analyzed from 581 stuidents. comprising20 classrooms in grades 7 through 12 in four western New York rural schools. Thesociometric device provided for sublective and perceptive selections on thedimensions of 'liking: 'school competence:. and 'social power." The study found thatgreater diffusion of sociometric choices arid perception of choices made by otherswere associated with membership in nongraded and.conventionally graded classroomsthan in pupil team-learning graded and pupil team-learning nongraded classrooms.This result was attributed mainly to instruction occurring at the team level with theteacher providing instruction to individual pairs. Based on an analysis of data fromthe classes in social studies. English. and mathematics, it was concluded that sublectstudied as well as class size had no appreciable effect on the sociometric choices ofstudents. (JK)
EA 002 153
Amer. Educ. Res. Assn. (Los Angeles. Calif.. Feb.
Relationship of Classroom Grouping Practices to
Diffusion of Students' Sociometric Choices and Diffusion of Students'
Perception of Socionetric Choices'
Robert P. O'Reilly Gregory J. Illenberg
New 'fork State Education Department
Division of Research
Alfred P. MacDonald
University of West Virginia
A number of classroom groupingfrocedures currently practiced in
elementary and secondary schools conceivably affect the social structure
of the classroom group. Among these may be listed large group instruction;
team teaching; the nongraded school; homogeneous and heterogeneous grouping;
and more recently, the practice of pupil-team learning (Durrell, 1964).
Pupilteas learning is a new educational technique which consists
of combining students into diads, triads, and so on, for the purpose of
gaining the possible advantages of mutual aid in learning. The learning
task with attendant materials is "pre-programmed" and the students as Durrell
(1964, p.1) describe them..."Work together, sharing, thinking and planning,
exchanging methods of approach, sharing tentative soultions, correcting
and evaluating each other's answers, producing either individual products
or a single group product."
From this brif descriptione it would seem reasonable to suppose
that the social nature of the pupilteam learning situation nay differ in
Paper read at the Annual Meeting of the American Educational Research
Association, 1.04 Angeles, California, February 54, 1969.
U.S. DEPARTMENTOFHEALTH, EDUCATION& WELFARE
OffICEOFEDUCATION
THIS DOCUMENT HAS BEEN REPRODUCED EXACTLY AS RECEIVED FROM THE
PERSON OR ORGANIZATION ORIGINATING IT. POINTS Of VIEW OR OPINIONS
STATED DO KOT NECESSARILY REPRESENT OFFICIAL OFFICE OF EDUCATION
POSITION OR POLICY.

2 -
a number of respects from the nongraded and conventional-graded class
reem situations. Similarly,itomight be expected that the nongraded
classroom would differ in important respects from the conventional-
graded classroom. To mention an obvious difference, the typical non-
graded class is often less homogeneous along the dimension of age than
the graded class. Age and correlated developmental maturity factors
are among the determinants of the social structure of the group, which
in turn say affect academic achievement and satisfaction with the school
(Siidewell, Sauter, Smith & Stringer, 1966).
The relatiomship of classroom organisation to classroom social
structure has been the subject of several earlier research studies. Dietrich
(1964) compared the social structure of sixth grade c1assrooms in a school
which practiced heterogemeous ability grouping with sixth grade classrooms
in a school which practiced homogeneous ability grouping. Do sigaificant
differences in olassroom social structure were found between the two school
systems, but a tendency vas famed for students in heteregemeously grouped
classrooms to associate on the basis of ability.
An extensive study of ability grouping in the public schools was
recently conducted by Borg (1965). One phase of the study consisted of an
evaluation of the effects of homogeneous versus heterogeneous grouping
practices on the social structure of elementary school classrooms. The follow-
ing conclusions were reported:
(1) Ability grouping did not create a permanent leadership vacuum
in the lower ability groups. A new social structure rapidly emerged in these
groups after grouping.
(2) Ugh ability students generally lost some social status as a
result of ability grouping.
(3) Average and low ability students generally gained in social
status as a result of ability grouping.
. 3
(4) In heterogeneously grouped classes social status and academic
ability were highly correlated, but no significant relationships existed
between these two factors in homogeneously grouped classes.
Forlano (1964) found a more diffuse social structure in classrooms
where "core" subjects were being taught as opposed to "non-core" subjects.
Interestingly, the differences increased with duration of the program of
grouping students around the basic core subject areas.
Lambert, Wiersma, Goodwin, & Roberts (1964) observed changes in
social structure in fourth, fifth, and sixth grade classed oyer a five
month period. The classes were classified as either "team taught" or "self
contained." No significant differences were found between these two classroom
organisations in relation to changes in classroom social structure.
Generally, the studies cited have supported the hypothesis that
classroom social structure is related to the grouping procedure employed.
Additional researdh, hOwever, is needed to determine the extent and.direction
of this relationship in terms of recent innovations in grouping practices.
The present report is a prelimipary analysis of ociometric data
from a larger study of the psychological, social and achievement correlates
of the classroom grouping procedures: (a) pupil team learning-nongraded;
(b) pupil team learning-graded; (c) conventional*nongraded; and (d) con-
ventional-graded. Classrooms within those four grouping procedures were
examined in relation to diffusion of sociometric choice and diffusion of
perception of sociometric choice along the three dimensions of liking, school
competence, and social power.
Method
The research sample consisted of 581 students in grades 7 through
12, in four rural schools of western Mew York.' A total of 20 intact class-

- 4 -
rooms were used in the analyses. The classes Selected were roughly comparable
on IQ and subject studied within grade levels for each treatment group, aed
wore also fairly comparable in geographic location and socioeconomic status
of their'respoctive communities. The distribution of subjects by school,
classroom organisation, grade level, and subject studied is presented in table 1.
. Table 1
Subjects were administered a six item socioeietric device which
allowed unlimited dhoice of fellow class members with respect to the
dimensions of "liking," "school competence," and "social power." The
instrument was administered individually to each class Of the sample. The
first three items required selection of others (i.e., classmates) along the
three dimensions. The remainirg three items asked the student to indicate
those whom he throught had seleited him. An index of diffusion of socio-
metric choice was obtained for eadh studost on each of the first three items
by dividing the number of times the student was selected by the number *of
students in his class minus ome, and multiplying the resulting score by 100.
Scores for the last three items were derived by dividing the number of select-
iions a student made by the number of students in his class minus one, and
sultiplying by 100. Student scores on each item were*then uswl to derive
arithmetic mean scores for individual classes, schoolii subject areas, treat-
ment groups, and gradelevels. Higher class means on the first three items
were interpreted as indicating a greater degree of selection by isdividual
students and, hence, a more diffuse classroom social structure; lower scares
were interpreted as indicating a more limited number of selections relative
to the total number possible and, hence, a less diffuse structure.
- 5 -
The validity of the diffusion index was examined by comparing the distribution
of selections in the two classes having the highest indexes with the two classes having
the lowest indexes on the "liking" dimension. The results of this analysis, shown in
Table 2, indicate that classes with high indexes of diffuiion were dharacterized by
general social acceptance of all students in the class.. Classes with low indexes of
diffusion for this item were charadterized by getieral social acceptance of only a few
students with the remainder of the class being accepted by a relatively small percentage
of their classmates or being socially neglected. Therefore, the interpretation of the
derived indexes as an indication of classroom social diffusion seemed to be supported.
Table 2
The data for the four treatment groups of the study were than analyzed
using a one-way analysis of variance of the treatment group scores lor each item in
the sociometric device. Significant differences among the Means of the treatment
groups wore further analyzed:using Ducan's Multiple Range Test (Edwards, 1960).
Results
The treatment group means, standard deviations, and between-group 7-ratios
for each item of the sociometric device, and the results of the application of Ducan's
Miltiple Range Test to the group means are summarized in Table 3. The betwees-groups
F-ratio was significant at beyond the .005 level on the item relating to student
perception of "social power." The between-group 7-ratios for the other five dependent
variables exceeded the .001 level. Inspection of the means for the four treatment
groups indicated that greater diffusion of sociametric'choices and perception of
choices made by others were associated with membership in nongraded and conventional
classrooms. For the tow'items relating to "liking" and for the two items relating
- 6 -
to "school competence" the treatment groups in order of most to least diffuse
were: (1) conventional-graded; (2) conventional-nongraded; (3) pupil team
learning-graded; and (4) pupil team learning-nongraded. For the two items
relating to "social power" the order from most to least diffuse was: (1)
conventional-graded; (2) conventional-nongraded; (3) 'pupil team learning-
neograded; (4) pupil taro learning-graded.
Table 3
The results of Duncan's Multiple Range Test indicated that, for
every item of the sociometric device, the means for the two pupil team
learning groups, both nongraded and graded, were significantly lower than
the means for the conventional-graded group. For the .two items relating.to
the dimension "liking," the pupil team learning groups means, both graded
and nongraded, were significantly lower than the means for both the con-
ventionalmnongraded and the conventional-graded groups. For the item
relating to perception of "iciflool competence" and for the item relating to
perception of "social power,'" the two pupil team learning groups were
significantly different from:the conventional-graded group, but not from
the conventional-nongraded group. For the items relating to selection of
others on the basis of "school competence" and "social power," the. conven-
tionalograded group was significantly different from the other three.groups..
On none of the items were the two pupil team learning groups, graded and
nongraded, significantly different from each other, and on only two items;
vis., selection of others on the basis of "school competence" and "social
power," was the conventional-nongraded group significantly different from
the conventional-graded group. The pupil team learning groups consistently
showed the leait dispersion of sociometric choice, and the conventional-

. 7 .
graded group was consistently the most diffuse.
In order to confirm that these differences reflected actual treat-.
sent differences rather than differences between schools, a seperate analysis
of variance was performed for school C. Schoole, as can be seen from table 1,
was the only school of the study having at least one class in each treatment
group, and was the only school having classes in the pupt: team learning
treatment groups. The treatment group means, standard deviations, between
groups F-ratios and results of the application of Ducan's Multiple Range Test
for each item of the soicometric test for school C are presented in Table 4..
As can be seen iu table 4, signifieant differences were found to exist be-
tween the pupil team learning-nongraded group and the conventional*nongraded
and graded groups on the two items relating to social acceptance. Paralleling
the findings of the larger analysis the pupil team learning-nongraded group
contributed significantly lower mean scores than either of the conventional
groups on these two items.
Table 4
WO
Since the classes for which sociometric data Were collected represented
classes in social studies, Inglish, and mathematics, a one-way analysis of
variance of mean indexes on each of the six sociometric items for these three
subject areas was performed. The resultant F-ratio was mot satistically
significant. It was concluded, therefore, that subject studied had no effect
on the sociometric choices of students.
Another factor that may have affected the observed results of the
study was class size. However, an examination of the correlations of class
sise with the items of the sociometric device shown in Table 5, indicate
that the correlations were not significant (1405) for three of the items

. 8 .
and were very low but significant (P4;05) for the three remaining items.
It seems safe to conclude that class size may be eliminated as an alternative
to the treatment factor examined in this research.
Table 5
41
Another interesting observation can be made from table 5. The'
items on Part / of the device correlate fairly highly with each other as do
the items on Part II, but the correlations between'items on Part I and items
on Part II are relatively low, althouh significant (P4405). This finding
indicates that the extent of the relationship between the number of other
students selecting an individual and the number of other students who were
perceived by that individual as selecting him tended.to be low, thus sups.
porting previous findings reported by Ciidewell, et al.. (1966),
Discussion
Research on Classroom social structure has generally indicated
that a diffuse classroom structure is associated with a decrease in the
accuracy of students' perceptions of min social status and greater spread
of acceptance among the students. These factors in turn are associated with
a more positive attitude toward school and greater academic acheivement
(Glidewell et al., 1966). A hierarchical structure has generallybeen
identified with the reverse of these characteristics.
lhe device used in the present study can be described only as a
measure of dispersion or diffusion of students sociometric choices. The
higher the mean score for any classroom group, the more diffuse the structure
of that group can be assumed to be. The lower the dean score is the less
diffuse is the structure. No assumptions can be made,'however, relative to
the existence of a hierarachical structure.
. 9 .
Some conjecture can be made relative to the reasons for-the lower
mean index scores within the pupil team learning classes. These classes
were organised so that each pupil was paired with another pupil for the
purposes of working together, studying togeiher, and in some cases taking
examinations together. Once these pairs were established at the beginning
of the school year, they generally remained unchanged throughout the year.
Thus, while some necessary discussion and instructional activities took
place at an "all class" level, most instruction and discussion occurred at
the pupil team level with the teadher, or teachers, ci:culating throughout
the room proViding instruction and advice to individual pairs. This instruc-
tional approach may be expected to prevent extensive social interaction.among
the students and, hence, the pupil team learning classes had the lowest mean
scores of diffusion. However, this lack of social diffusion cannot be in-
terpreted as the result of a hierarchical structure, and therefore the nega-
tive attributes of such a structure do not necessarily apply to the pupil
team learning situation.
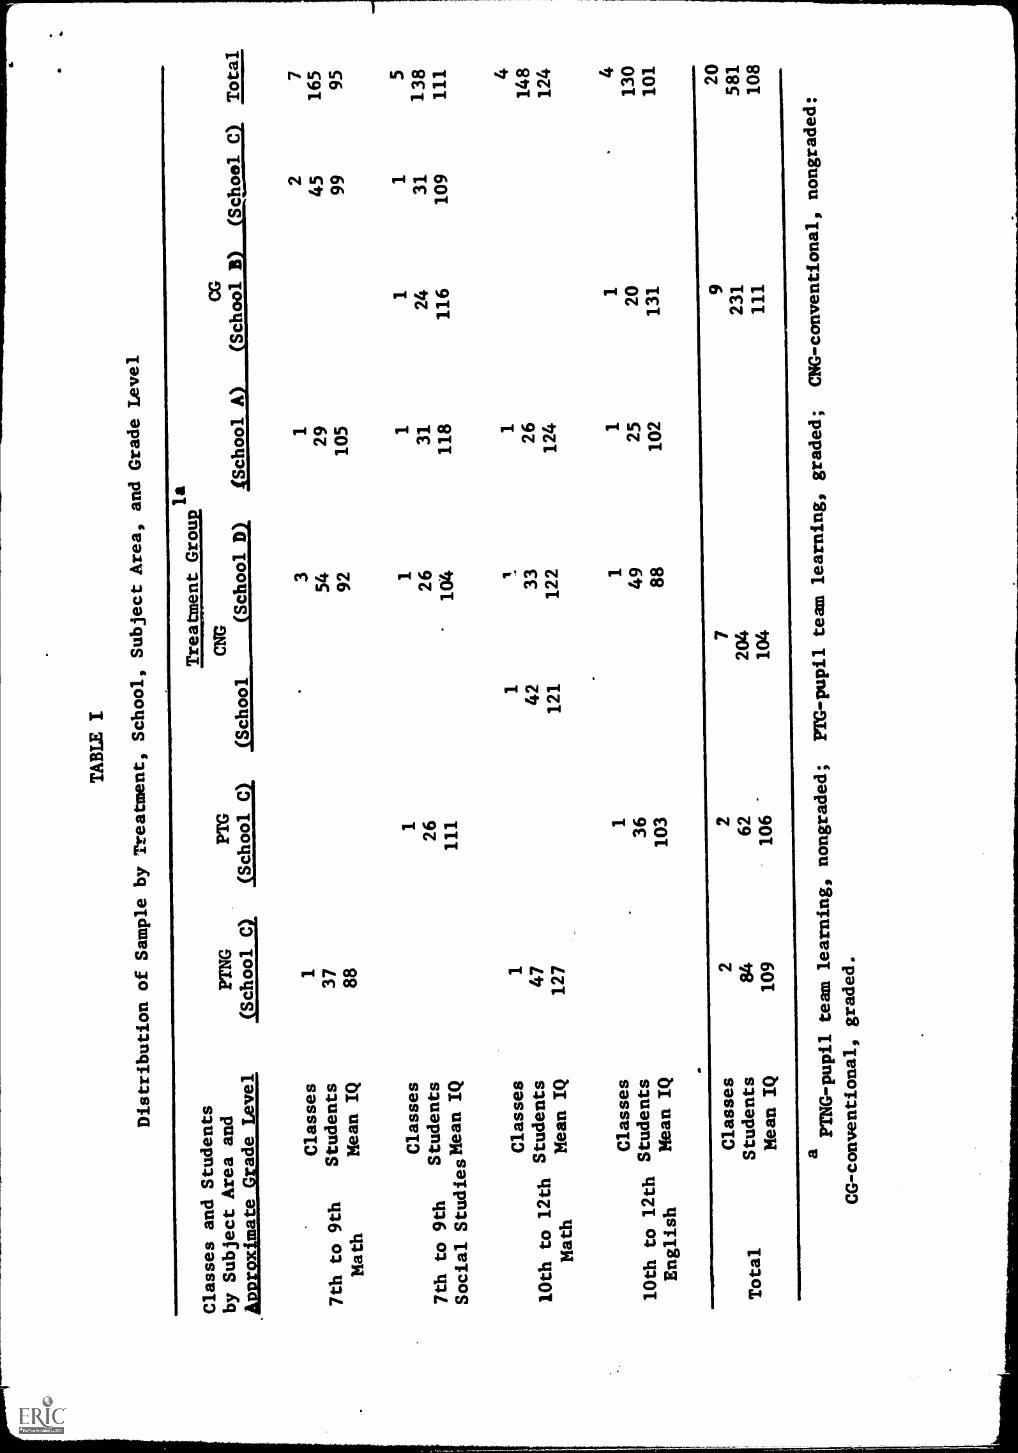
TABLE I
Distribution of Sample by Treatment,
School, Subject Area, and Grade
Level
Classes and Students
Treatment Groupla
by Subject Area and
PTNG
PTG
CNG
CG
.Approximate Grade Level
Ochool 0
(School C)
(School
(School D)
fSchool A)
(School 1)
(School CI Total
Classes
13
12
7
7th to 9th
Students
37
54
29
45
165
Math
Mean IQ
88
92
105
99
95
Classes
11
11
15
7th to 9th
Students
26
26
31
24
31
138
Social StudiesMeanIQ
111
104
118
116
109
111
Classes
11
1.
14
10th to 12th
Students
47
42
33
26
148
Math
Mean IQ
127
121
122
124
124
Classes
11
11
4
10th to 12th
Students
36
49
25
20
130
English
l*an IQ
103
88
102
131
101
Classes
22
79
20
Total
Students
84
62
204
231
581
Mean IQ
109
106
104
111
108
aPTNG-pupil team learning,
nongraded;
PTG-pupil team learning,
graded;
CMG-conventional, nongraded:
CG-conventional, graded.
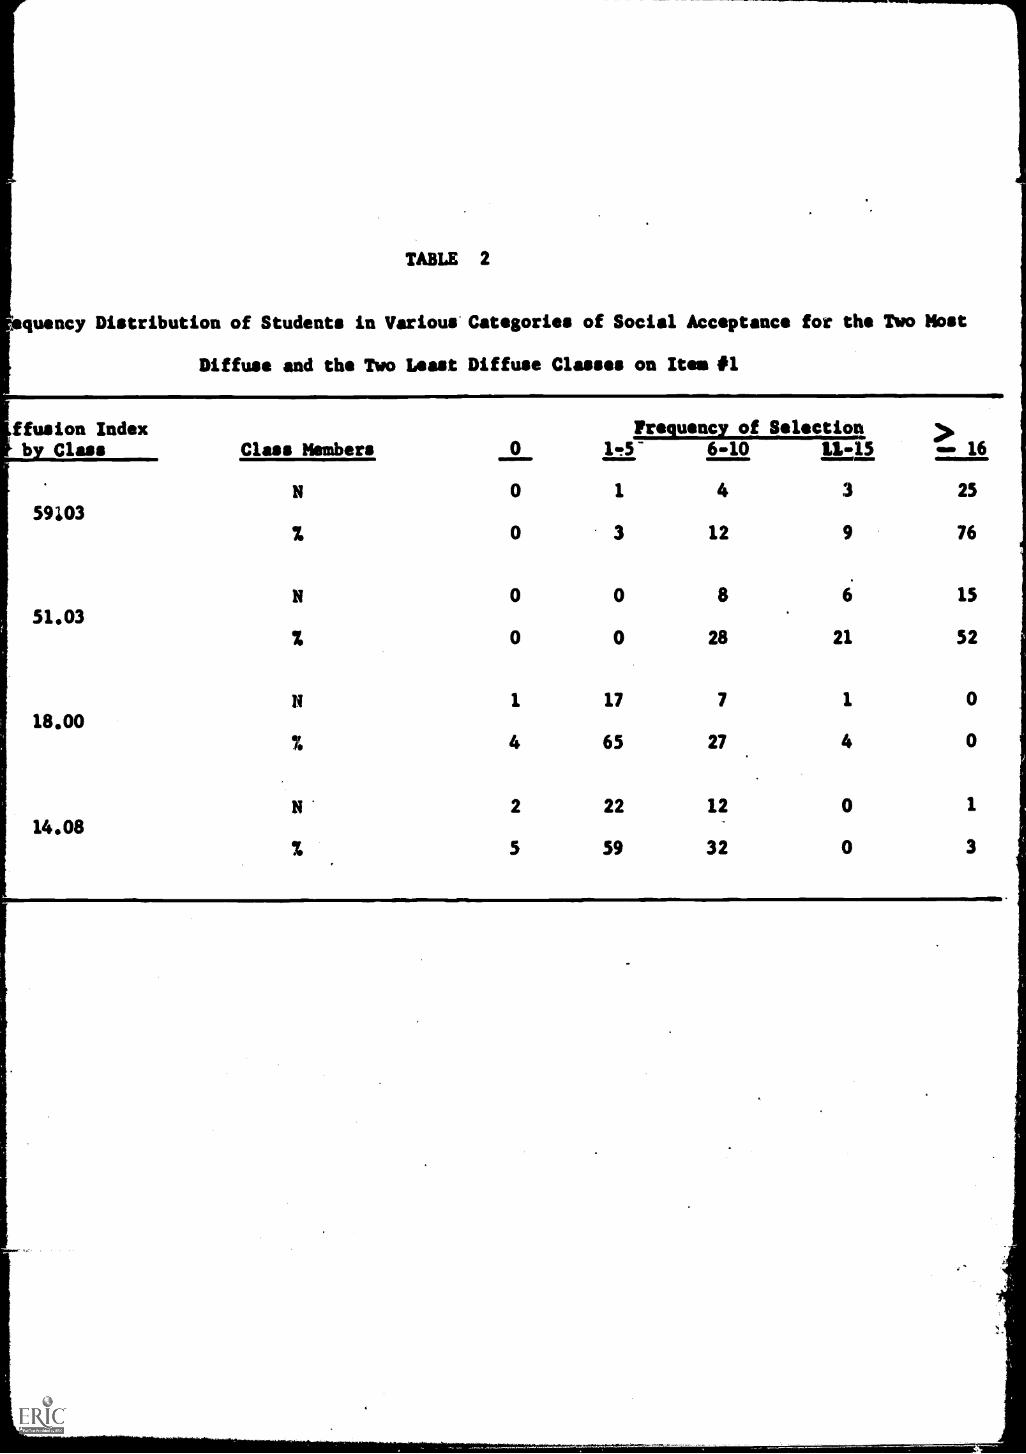
TABLE 2
quancy Distribution of Students in Various* Categories of Social Acceptance for the Two Mbst
Diffuse and the Two Least Diffuse Classes on Item *1
ffusion Index !reouency of Selection i>by Class Class Members 0 1.!5- 6-10 11-15 ...., 16
N 0 1 4 3 25
59103% 0 3 12 9 76
0 0 8 6 15
51.030 0 28 21 52
1 17 7 1 0
18.004 65 27 4 0
2 22 12 0 1
14.085 59 32 0 3
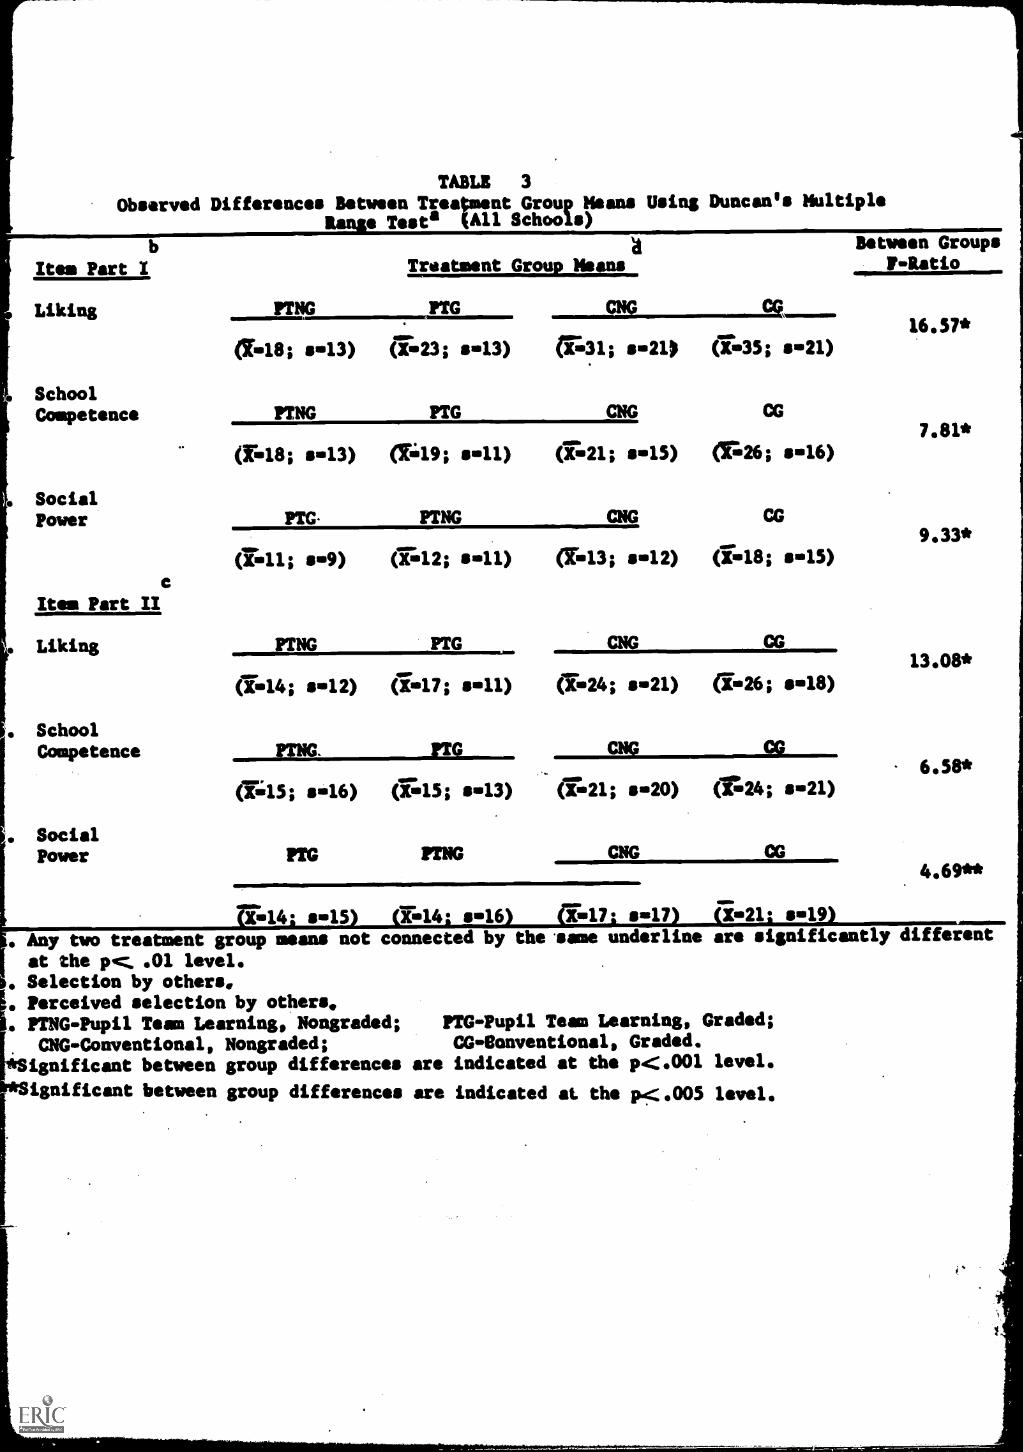
TABLE 3
Observd Diffrences Betwen Treatment Group Means Using Duncan's MultipleRang Testa (All Schools)
Item Part I
Liking
aTreatment Group Mans
PTtiG PTG MW(6018; 4-13) (E23; 4=13) (i;31; 4=21) (1=35; s=21)
SchoolCompetence PTNG PTG CNG CG
(11118; 4=13) 0119; (621; s=15) (EL26; 8=16)
SocialPower PTC. PTNG CMG CG
66111; s=9) CEL12; s=11) (K613; s=12) 66118; s=15)
Item Part II
Liking PTNG PTG CNG CG
(114; 4=12) (1=17; s=11) (7624; s=21) (1=26; sole)
SchoolCompetence PTNG. PTG CNG CG
(1;15; s=16) (1ll5; s=13) (1L21; s=20) (1524; 6=21)
SocialPower PTG PTNG CNG OG
Betwen GroupsP-Ratio
16.57*
7.81*
9.33*
13.08*
6.58*
.4.69**
U61,14: s=15) (1=14: sm16) (7;47: 8=17) (i-21: 41-19)
Any two treatment group means not connected by the .same underline are significantly different
at the pc .01 level.Selection by others.Perceived selection by others,PTNG-Pupil Team Learning, Nongraded; PTG-Pupil Team Learning, Graded;
CNG-Conventional, Nongraded; CG-8onventional, Graded.*Significant between group differences are indicated at the 1)4:401 level.
ignificant between group differences are indicated at the p4:405 level.
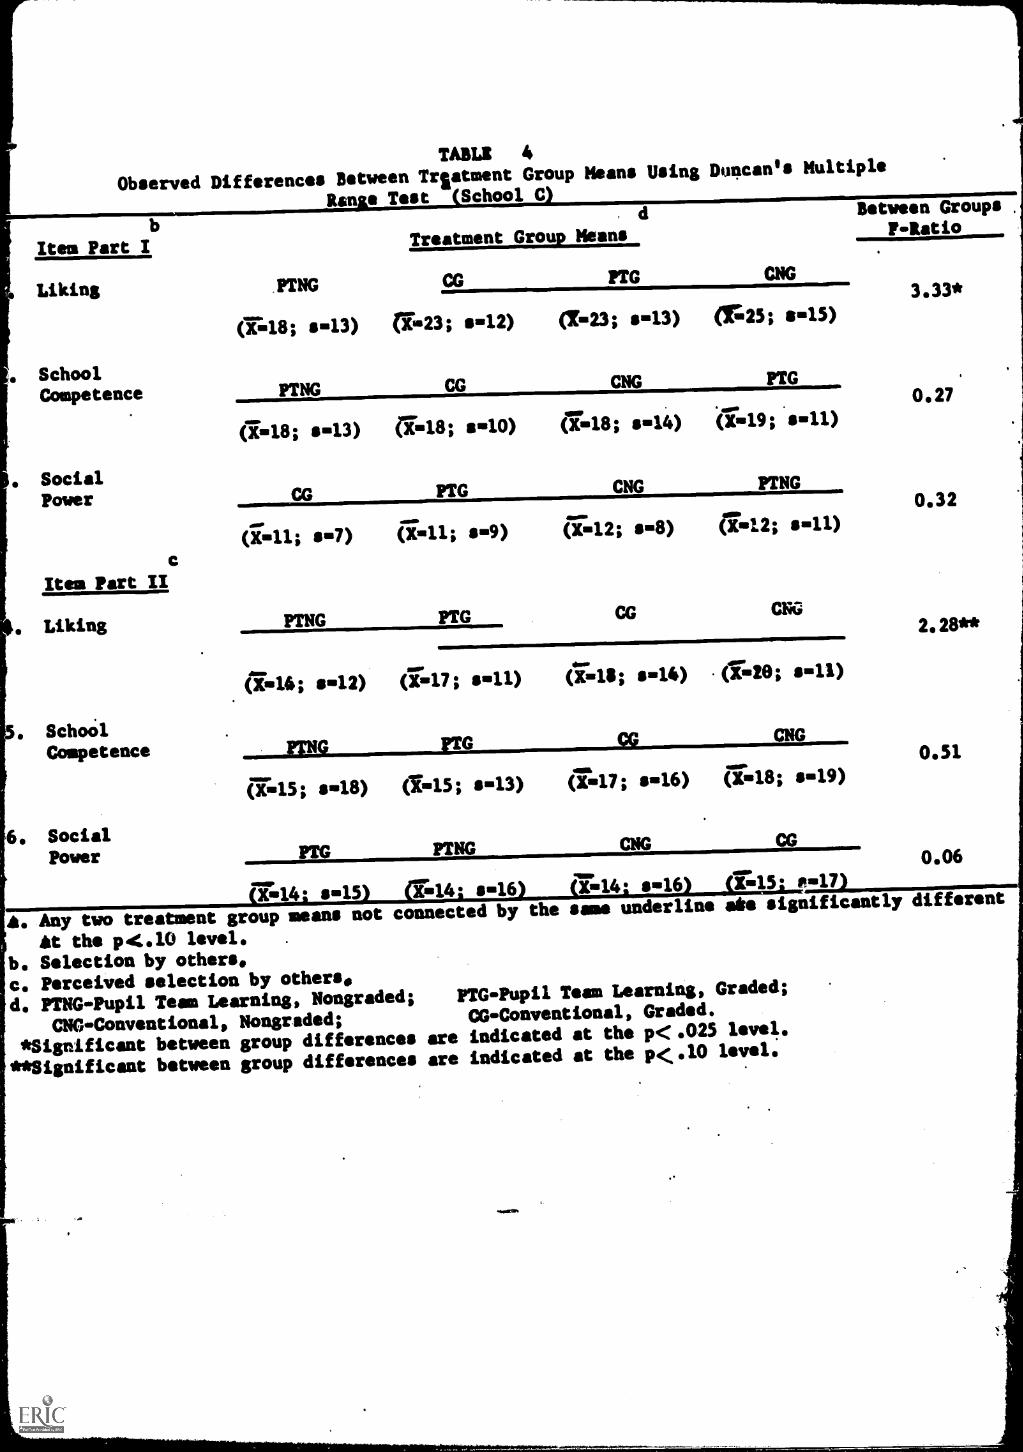
TABLE 4
Observed Differences Between Trlatment Group Means Using Duncan's Multiple
Ran Test School C
Item Part I
Liking
Treatment Group Means
PTNG CG PTG CNG
(648; se13) (i423; 6=12) (Tm23; sm113) (1'25; em115)
SchoolCompetence PTNG CG CNG PTG
(1m18; sma13) arem18; sem10) ereme18; 2-14) 6649;sm11)
SocialPower CG PTG CNG PTNG
Item Part II
Liking
sms7) sms9) (X-12; s-8) (1wn; smell)
PTNG PTG CG CNG
(1.&16; sim12) (X=17; smell) (7=18; sm114) .(X48; s 11)
SchonlCompetence PTNG PTG CG CNG
SocialPower
(km15; sem18) (1m15; sm13) (r017; sme16) (1em18; sim19)
PTG PTNG CNG CG
X=14. sm15 sa16 1E44. smi16 X.15. egm17)
Between GroupsP-Ratio
3.33*
0.27
0.32
2.28**
0.51
0.06
Any two treatment group means not connected by the same underline eke significantly different
At the p4.10 level. .
b. Selection by others,
ce Perceived selection by others.
de PTNG -Pupil Team Learning, Nongraded; PTG-Pupil Team Learning, Graded;
CNC..Conventional, Nongrsded;CG-Conventional, Graded.
*Significant between group differences are indicated at the p<:.025 level.
**Significant between group differences are indicated at the p<:.10 level.
mauran.
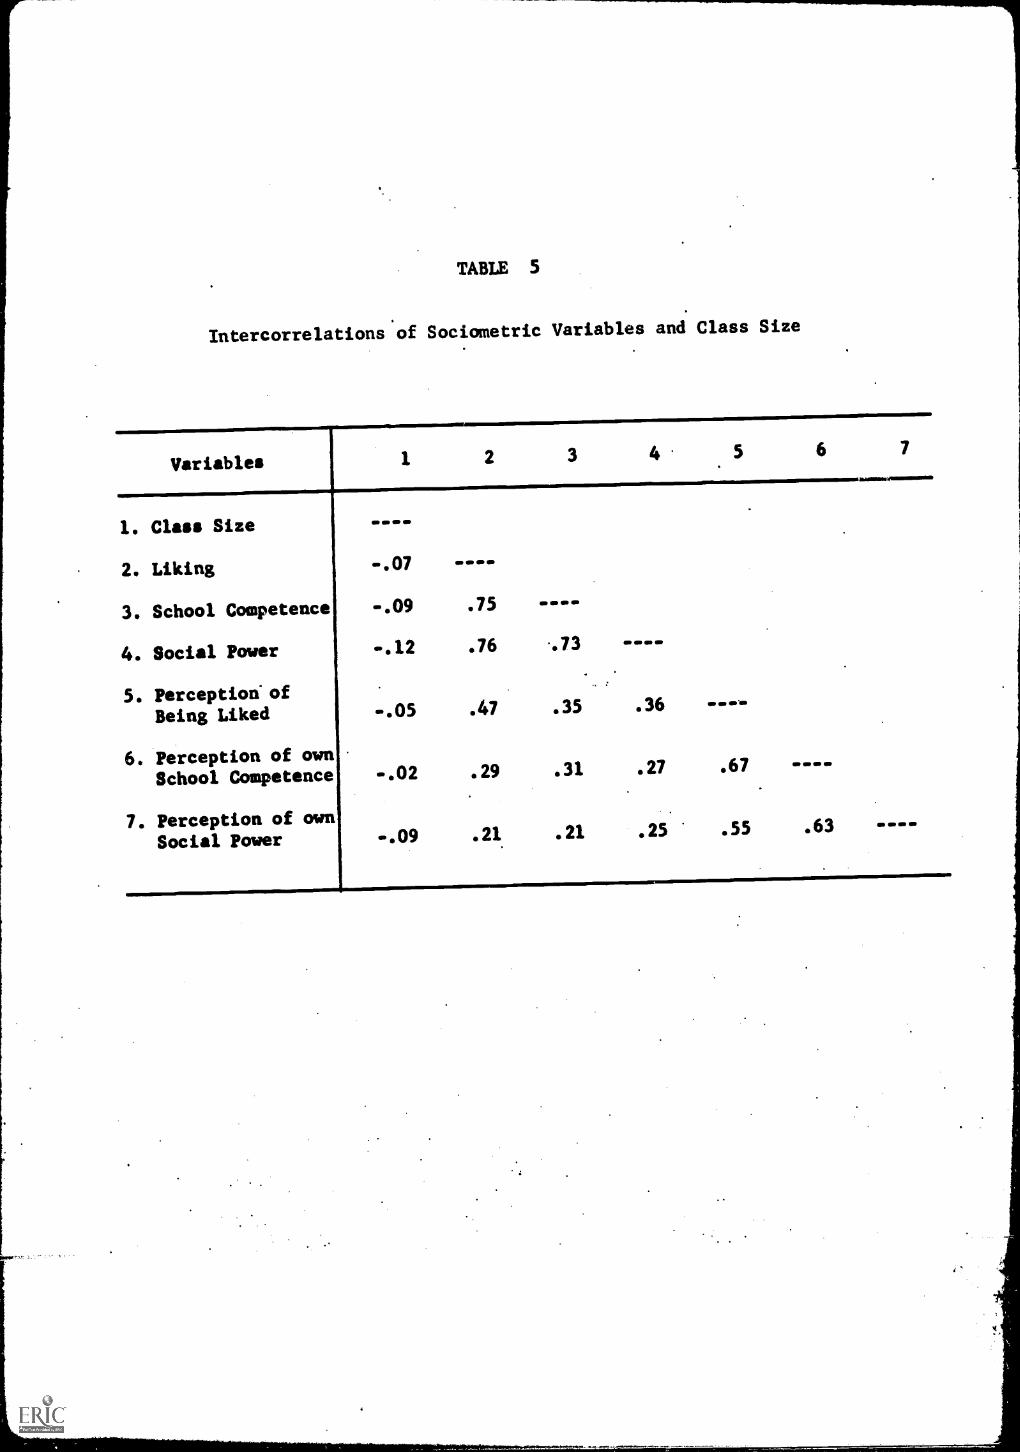
TABLE 5
Intercorrelations of Sociometric Variables and Class Size
Variables 1 2 3 4 5 6 7
1. Class Size
2. Liking
3. School Competence
4. Social Power
5. Perception ofBeing Liked
6. Perception of ownSchool Competence
7. Perception of ownSocial Power
MI ID ID ID
-.07
-.09 .75
-.12 .76
-.05 .47
-.02 .29
-.09 .21.
akiwropeawswomea
..73
.35 .36
.31 .27 .67 MI M
.21 .25 .55 .63 ID ID IN ID
MAR 2 n'C9
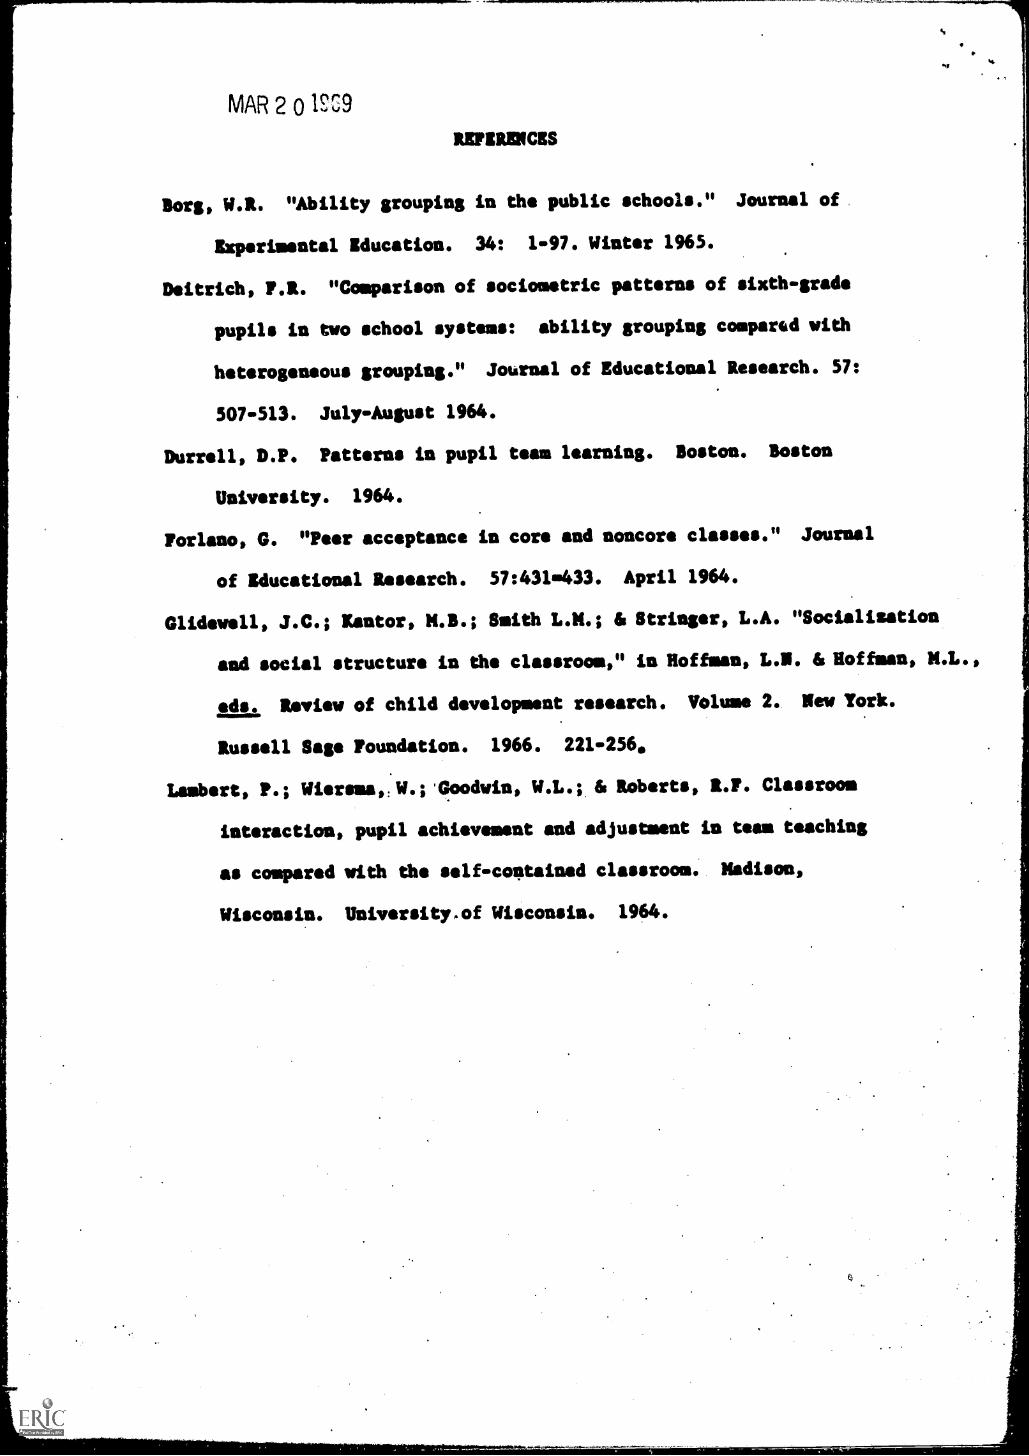
REFERENCES
Borg, W.R. "Ability grouping in the public schools." Journal of
Experimental Education. 34: 1-97. Winter 1965.
Deitrich, F.R. "Comparison of soclometric patterns of sixth-grade
pupils in two school systems: ability grouping compared with
heterogeneous grouping." Journal of Educational Research. 57:
507-513. July-August 1964.
1
Durrell, D.P. Patterns in pupil team learning. Boston. Boston1
University. 1964.
Forlano, G. "Peer acceptance in core and noncore classes." Journal
of Educational Research. 57:431433. April 1964.
Glidewell, J.C.; Kantor, M.D.; Smith L.M.; & Stringer, L.A. "Socialisation
and social structure in the classroom," in Koffman, L.N. &Roffman, M.L.,
eds. Review of dhild development research. Volume 2. New York.
Russell Sago Foundation. 1966. 221-256.
Lambert, P.; Wiersaa, W.; 'Goodwin, W.L.; & Roberts, R.F. Classroom
interaction, pupil achievement and adjustment in team teaching
as compared with the selfcomtained classroom. Madison,
Wisconsin. Univorsity.of Wisconsin. 1964.
_