to my mom and my little jimmy - university of...
TRANSCRIPT
1
EVALUATING THE IMPACT OF A HEARING CONSERVATION PROGRAM ON NOISE-INDUCED HEARING LOSS (NIHL) AMONG RACIALLY DIVERSE CHILDREN
By
SHAWNA MARLANA DELL
A DISSERTATION PRESENTED TO THE GRADUATE SCHOOL OF THE UNIVERSITY OF FLORIDA IN PARTIAL FULFILLMENT
OF THE REQUIREMENTS FOR THE DEGREE OF DOCTOR OF PHILOSOPHY
UNIVERSITY OF FLORIDA
2012

2
© 2012 Shawna M. Dell

3
To My Mom and My Little Jimmy
4
ACKNOWLEDGMENTS
I would like to thank my heavenly Father for blessing, guiding, protecting, and
giving me the strength to fulfill my dreams and in return to be a blessing to others. I
have been fortunate and blessed to be taught by extraordinary professors and I
sincerely appreciate my illustrious committee members. I have learned so much from
each and every one.
I would like to thank my Ph.D. mom and Chair, Dr. Alice E. Holmes, for all her
endless support, repeated efforts to make my dissertation awesome, and her advice
and guidance throughout my journey as a graduate student. I greatly appreciate Dr.
Patricia Kricos who has taught me to be an advocate for those living with hearing loss
and to be fearless in my pursuits to prevent the ill-effects of hearing loss. I would also
like to thank Dr. Colleen LePrell for all her guidance and advice, especially when it
came to methodology and hearing conservation. I would like to thank my external
members, Dr. Lawrence Winner and Dr. Barbara Curbow. Dr. Winner had great
patience as he guided me through the trials and tribulations that I like to call statistics,
so that I could accurately analyze all of my data. Dr. Barbara Curbow introduced me to
my new passion, the world of public health. I thank her for her endless positive regard
and encouragement. Last and not least, I want to express my gratitude to Dean
Kenneth Gerhardt for introducing me to the audiologic area of hearing conservation and
occupational health. I still remember the words that he spoke to me and my fellow
classmates during my first class in my Doctor of Audiology program in 2004; he said
that as students we should see him and the faculty as a golden net that is there to catch
us if we stumble or fall. Thus, I would like to thank him, my committee, and all my
professors (clinical and academic) for being my golden net.

5
I have been part of the gator nation for 12 years and I have meet wonderful people
as I navigated my way from a fresh-faced freshman to a glorious graduate. This was
made possible through the McKnight Fellowship provided by the Florida Education
Fund. I would like to thank Dr. Lawrence Morehouse, Mr. Charles Jackson, the Florida
Education Fund, and the extended McKnight Family. I would also like to acknowledge
Ms. Idella King, the graduate secretary, who was there to assist me with everything from
registering for classes to navigating the process of graduation. In addition, she lent an
ear so I could partake in one of my favorite pastimes, chatting. I would also like to thank
Sarah Traylor and the Office of Graduate Minority Programs for all their help with the
allocation of my funding. I would like to acknowledge Ms. Carol Mills, Ms. Sharla
Alexander, and the endless staff members that worked in the past and currently within
the Department of Speech, Language, and Hearing Sciences for their support and
encouragement.
To my mother and father, Mr. and Mrs. James and Cecelia Dell, that always told
me to work hard, do my best, and leave the rest in God’s hands; I thank you for
providing every opportunity for me to excel in life when you both did not have the same
opportunity. I love you both dearly. I would like to thank my big sister, Mrs. Sheree
McGee, for all her generosity, love, and understanding. You are one of my biggest
cheerleaders, a loyal supporter, and I love and thank you so much. Many more thanks
to my brother, James, my brother in law, Kenny, and all my other family members that
support and care for me. I especially want to recognize my little girls, Laurynn and
Layla, for providing Auntie with laughs, love, and fun. My second family, Drs. Kenneth

6
Podlenski, Ronald Kelley, Kathleen Read, Shari Kwon, Amy Selvaraj, and Devon Weist,
thank you so much for your support.
To Freda Coleman-Jackson and all my closest friends from the Coleman-Jacksons to
the Selvarajs, I want to thank you for the endless friendship, laughs, and free food.
I would also like to extend my thanks to all the participants, students, teachers,
and staff at Neptune and Reedy Creek elementary schools. I would also like to thank
Ms. Diane Nichols, Ms. Linda Harwood, Ms. Julie Wilson, and Ms. Dianne Dinkins of
Osceola County School District. In addition, I would like to thank the Boys and Girls
Clubs of Alachua County and O2Bkids of Gainesville. I would like to thank Dr. Brittany
Hensley for her assistance with my study. Lastly, I was fortunate to have two wonderful
Doctor of Audiology students, Jennie Allen and Laura Davidson, to assist me with data
collection, data entry, and transcription. I greatly appreciate all the work that these
ladies offered me with pleasant smiles and positive attitudes.
7
TABLE OF CONTENTS page
ACKNOWLEDGMENTS .................................................................................................. 4
LIST OF TABLES ............................................................................................................ 9
LIST OF FIGURES ........................................................................................................ 11
ABSTRACT ................................................................................................................... 12
CHAPTER
1 INTRODUCTION AND LITERATURE REVIEW ..................................................... 14
Effects of Noise on the Auditory System ................................................................. 15 Associated Health Consequences of NIHL ............................................................. 18
Gender Differences Among NIHL ........................................................................... 21 Occupational HCP versus Educational HCP ........................................................... 22 Educational HCPs and Resources for Children ...................................................... 25
Racial/Ethnic Group Disparities and NIHL .............................................................. 34 Purpose .................................................................................................................. 37
2 METHODS .............................................................................................................. 40
Participants ............................................................................................................. 40
Ethics of working with Special Populations ............................................................. 40 Sampling and Recruitment ...................................................................................... 41 Measures and Materials .......................................................................................... 42
Procedures ............................................................................................................. 43
3 RESULTS ............................................................................................................... 49
Prevalence Data ..................................................................................................... 49 Prevalence of Hearing Loss in Audiometric Data ............................................. 49
Attitudes and Knowledge towards Noise................................................................. 52
Participants’ Attitudes toward Noise ................................................................. 52 Participants’ Knowledge toward Noise ............................................................. 55
Effects of Hearing Conservation Program ............................................................... 57
Hearing Conservation Training Effects on Attitudes ......................................... 57
Hearing Conservation Training Effects on Knowledge ..................................... 60 Main Themes of Focus Groups ............................................................................... 63
4 DISCUSSION ......................................................................................................... 81
Prevalence of the Study Population ........................................................................ 81 Effects of the Hearing Conservation Program ......................................................... 90
8
Influence of Gender and Race ................................................................................ 92
Consensus of Focus Group’s Responses ............................................................... 93 Limitations of the Study........................................................................................... 94
Future Aims ............................................................................................................ 96 Conclusion .............................................................................................................. 97
APPENDIX
A PRE-TEST QUESTIONNAIRE ............................................................................... 99
B POST-TEST QUESTIONNAIRE ........................................................................... 103
LIST OF REFERENCES ............................................................................................. 107
BIOGRAPHICAL SKETCH .......................................................................................... 114
9
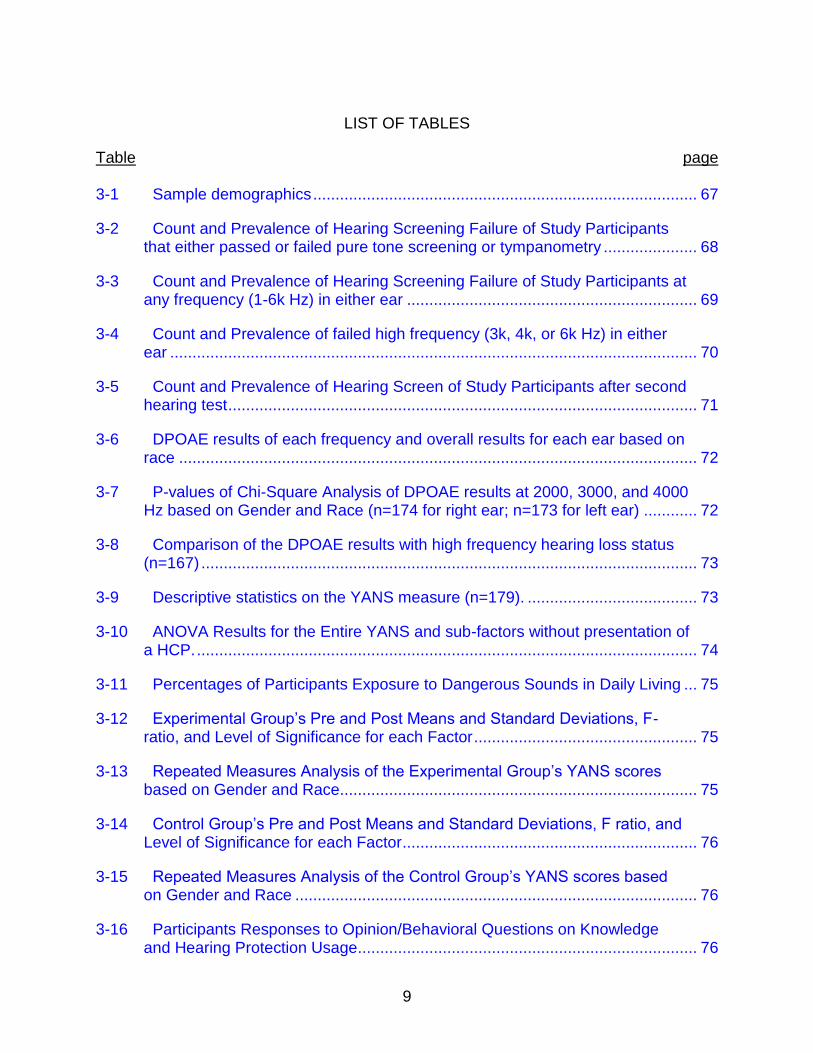
LIST OF TABLES
Table page 3-1 Sample demographics ...................................................................................... 67
3-2 Count and Prevalence of Hearing Screening Failure of Study Participants that either passed or failed pure tone screening or tympanometry ..................... 68
3-3 Count and Prevalence of Hearing Screening Failure of Study Participants at any frequency (1-6k Hz) in either ear ................................................................. 69
3-4 Count and Prevalence of failed high frequency (3k, 4k, or 6k Hz) in either ear ...................................................................................................................... 70
3-5 Count and Prevalence of Hearing Screen of Study Participants after second hearing test ......................................................................................................... 71
3-6 DPOAE results of each frequency and overall results for each ear based on race .................................................................................................................... 72
3-7 P-values of Chi-Square Analysis of DPOAE results at 2000, 3000, and 4000 Hz based on Gender and Race (n=174 for right ear; n=173 for left ear) ............ 72
3-8 Comparison of the DPOAE results with high frequency hearing loss status (n=167) ............................................................................................................... 73
3-9 Descriptive statistics on the YANS measure (n=179). ...................................... 73
3-10 ANOVA Results for the Entire YANS and sub-factors without presentation of a HCP. ................................................................................................................ 74
3-11 Percentages of Participants Exposure to Dangerous Sounds in Daily Living ... 75
3-12 Experimental Group’s Pre and Post Means and Standard Deviations, F-ratio, and Level of Significance for each Factor .................................................. 75
3-13 Repeated Measures Analysis of the Experimental Group’s YANS scores based on Gender and Race................................................................................ 75
3-14 Control Group’s Pre and Post Means and Standard Deviations, F ratio, and Level of Significance for each Factor .................................................................. 76
3-15 Repeated Measures Analysis of the Control Group’s YANS scores based on Gender and Race .......................................................................................... 76
3-16 Participants Responses to Opinion/Behavioral Questions on Knowledge and Hearing Protection Usage............................................................................ 76

10
3-17 Correlation Table of Knowledge and YANS responses .................................... 77
11
LIST OF FIGURES
Figure page 3-1 Participants Reported Experience of Tinnitus ................................................... 78
3-2 Mean scores from the Knowledge Questions based on Race and Gender (N=179) .............................................................................................................. 79
3-3 Participants Anticipated Use of Hearing Protection within the next month ....... 80

12
Abstract of Dissertation Presented to the Graduate School of the University of Florida in Partial Fulfillment of the Requirements for the Degree of Doctor of Philosophy
EVALUATING THE IMPACT OF A HEARING CONSERVATION PROGRAM ON
NOISE-INDUCED HEARING LOSS (NIHL) AMONG RACIALLY DIVERSE CHILDREN
By
Shawna Marlana Dell
December 2012
Chair: Alice E. Holmes Major: Communication Sciences and Disorders
The prevalence of noise-induced hearing loss (NIHL) among children has been
reported to have increased from 12% to 16%. The prevalence of NIHL among
Caucasians, African Americans, and Hispanics showed no significant differences
between groups, although the African American children showed the lowest prevalence
of NIHL. When examining the prevalence of NIHL among the adult population, there are
significant differences across groups, and the African American group had the lowest
prevalence of NIHL.
An evidence-based practice in combating NIHL includes the use of hearing
conservation programs (HCPs). HCPs provide information about the auditory system,
hazardous sound sources, and methods to protect one from acquiring NIHL. The
purpose of this research was to measure the prevalence of NIHL and to examine the
efficacy of a HCP on increasing the knowledge and changing pro-noise attitudes among
children.
One hundred and seventy nine racially diverse children participated in this study.
These children were recruited from two elementary schools located in Osceola County,
FL and from O2Bkids and the Boys and Girls Clubs of Alachua County, FL. Participants
13
received an audiometric screening battery. Two surveys presented at two different times
were used to measure their knowledge and attitudes towards loud sounds. The
participants were separated into a control group that received the audiometric screening
and completed the survey measures; and an experimental group that received the
additional HCP between the surveys. Focus groups were performed after the test
measures were completed.
In this current study the prevalence of children with NIHL, defined as a loss from
3k to 6k Hz was 16.8% on the initial hearing screening with no significant difference
among the racial groups. However, the prevalence rate dropped to 4.6% after the
children were retested. The experimental group showed a significant reduction of the
pro-noise attitudes and an increase in knowledge regarding the effects of loud sounds.
There was a significant relationship between the increase in knowledge and the
reduction in positive attitudes towards noise.
This current study found a lower prevalence rate compared to the literature, so
prior epidemiologic studies may have over-estimated the prevalence of NIHL among
children.
14
CHAPTER 1 INTRODUCTION AND LITERATURE REVIEW
The number of Americans living with hearing loss has soared to 30 million
individuals (Kochkin, 2009) and approximately 11 million of these individuals’ hearing
losses can be ascribed to exposure to high intensity sounds from occupational and/or
recreational settings (Crandell, Mills, & Gauthier, 2004). Hearing loss (especially in the
higher frequencies of 2k-8k Hz that a “noise notch” is present in this frequency range)
attributed to high intensity sounds is classified as noise-induced hearing loss (NIHL).
Hearing loss, including NIHL, is known to cause detrimental health effects, such as
depression, anxiety, reduced cognition, and poor psycho-social function (Bess, Dodd-
Murphy, & Parker, 1998; Bloom, 2006; Coll, Cutler, Thobro, Haas, & Powell, 2009;
Davis, Shepard, Stelmachowicz, & Gorga, 1981).
Since the mid-1930s, the dangers of noise on the auditory system within
occupational settings have been recognized among professionals. This recognition has
lead to regulations and laws, such as the Walsh Healey Act and the Hearing
Conservation Amendment to reduce the number of American workers that would suffer
from NIHL (Berger, Royster, Royster, Driscoll, & Layne, 2003; Lusk, 1997; Suter, 2009).
These laws require the implementation of hearing conservation programs (HCPs).
However, there are no regulations against NIHL caused by recreational noise within the
U.S. unlike other countries (i.e. Sweden) (Ryberg, 2009). Thus, many Americans,
including children and adolescents, are being exposed to noise that has the potential to
cause NIHL among various diverse groups without any protective regulation.
One group that seems to have less vulnerability NIHL is African Americans.
African American adults, compared to Caucasians and Hispanics, have the lowest

15
prevalence of high frequency hearing loss (Agrawal, Platz, & Niparko, 2008). On the
other hand, African American children compared to other groups show no significant
differences in the occurrence of NIHL (Niskar et al., 2001). This generational difference
between African Americans may be due to the change in hearing related behaviors,
especially pro-noise behaviors like listening to extremely loud music for extended
periods of time. NIHL is preventable, and prevention would be accomplished by
avoiding the initiation of risky hearing behaviors (Caitlin, 1986; Dobie, 1995; Rogers et
al., 2009). Ultimately, positive hearing health behaviors are dependent upon knowledge
and attitudes toward noise. HCPs educate individuals about the risks associated with
noise and are effective in prevention of NIHL among all age groups (Crandell et al.,
2004).
Therefore, the purpose of this study is to examine the differences in the
prevalence of NIHL, and the attitudes and behaviors towards noise among African
American, Hispanic, and Caucasian children. This study also seeks to examine the
correlation between measured NIHL and individual’s attitudes/behavior towards noise
among the study population. In addition, this study will examine the effectiveness of
HCPs in changing knowledge, beliefs, and pro-noise behaviors.
Effects of Noise on the Auditory System
NIHL, a term used to describe hearing loss after noise, includes temporary
threshold shifts (TTS) and permanent threshold shifts (PTS) that are caused by a
variety of high intensity sounds (Gunderson, Molinem, & Catalano, 1997). TTS and PTS
are the products of the changes that high intensity sounds (which will be referred to as
noise within this manuscript) produce within the auditory system, including mechanical
damage, excitotoxicity or overstimulation of the hair cells, and oxidative stress and

16
production of free radicals. Mechanical damage to the auditory system from noise is
generally caused by loud impulse noise or transient sound stimuli (i.e. gunshots) that
cause physical damage to the sensitive anatomical structures. This damage includes,
but is not limited to, tympanic membrane rupture, ossicular disarticulation, and the death
of hair cells, especially the outer hair cells due to the intense vibrations of the noise
(Berger et al., 2003; D. Henderson, Bielefield, Harris, & Hu, 2006; LePrell, Yamashita,
Minami, Yamasoba, & Miller, 2007). For instance, when loud transient noise enters the
external auditory canal, the sound vibrates the tympanic membrane. The vibrations of
the tympanic membrane set the ossicles in motion that disturbs the inner ear fluids,
which causes a traveling wave along the basilar membrane that causes damage to the
hair cells that reside in the Organ of Corti. Further, the force of this wave has the
potential to create a large shearing motion of the stereocilia of the outer hair cells due to
the extreme movement of the tectorial membrane that results in the stereocilia bending
and breaking away from the outer hair cells which results in the subsequent demise of
the outer hair cells (D. Henderson et al., 2006; Jahn & Santos-Sacchi, 2001; LePrell et
al., 2007; Tanaka, 2009). Once the outer hair cells (also referred to as auditory system
amplifiers) die, they do not regenerate. With repeated exposure to intense noise the
resulting hair cell death produces an irreversible and measurable permanent hearing
loss (Hu, Henderson, & Yang, 2008; Jahn & Santos-Sacchi, 2001; Kopke et al., 1999).
In addition, constant exposure to continuous noise has detrimental effects on the
cochlea. This process through which noise induced pathology develops within the
cochlea incorporates a series of complex and intricate mechanisms that ultimately
cause irreversible damage within the cochlea.

17
One of the mechanisms of cell trauma is neural excitotoxicity due to the release of
the excitatory neurotransmitter glutamate. With excessive noise exposure, the hair cells’
dendritic terminals of the auditory nerve afferent fibers can swell; this swelling is due to
the release of large amounts of glutamate into the synapse of type I fibers of the
auditory nerve by highly active inner hair cells responding to loud noise exposure (D.
Henderson et al., 2006; Kopke et al., 1999). Glutamate also causes large sodium and
potassium ion fluctuations that cross to post-synaptic structures creating osmotic
imbalance, which results in the entry of fluid within the cells producing swelling and
rupturing of cell membranes and cell degeneration (LePrell et al., 2007).
Excitotoxicity is related to another mechanism that produces NIHL within the
cochlea which is oxidative stress and the formation of free radicals (Harrison, 2008).
Free radicals are molecules with one or more unpaired electrons that can cause
instability in the electron arrangements of stable molecules for reviews see D.
Henderson et al. (2006); LePrell et al. (2007). The cochlea has numerous tissue types
that are metabolically active; reactive oxygen species (ROS) are produced during cell
energy metabolism. These molecules act as free radicals and/or are capable of
creating free radicals, such as: superoxide, hydroxyl radical, and hydrogen peroxide (D.
Henderson et al., 2006; Jahn & Santos-Sacchi, 2001; Kopke et al., 1999). Sound
exposure increases metabolic activity within the cells in the Organ of Corti, especially in
the outer hair cells and the strial cells. The literature has shown that noise exposure
specifically increases the mitochondrial free radical formation (D. Henderson et al.,
2006; Kopke et al., 1999; LePrell et al., 2007). According to Henderson et al. (2006),
ROS (i.e. superoxide) are created as the byproducts of the mitochondria efforts to
18
provide energy to the hair cells in the presence of acoustic overstimulation due to
hazardous noise exposure. Hence, as sound intensity increases, cochlear blood flow,
endolymph oxygenation, and glucose uptake decreases- generating an optimal
environment for free radical production. Free radicals, such as hydroxyl radicals,
damage DNA, especially within the marginal cells of the stria vascularis and the outer
hair cells (LePrell et al., 2007). When DNA is damaged there is an inability for the cell’s
intrinsic DNA repair mechanisms to work properly and apoptosis or “cell suicide” is
initiated (Cheng, Cunningham, & Rubel, 2005).
Associated Health Consequences of NIHL
NIHL, like other hearing losses with varying etiologies (i.e. presbycusis or hearing
loss due to old age), causes negative health consequences, such as communication
breakdowns, depression, and other psychosocial problems (Tharpe, 2008; Tharpe &
Bess, 1999). Depression among individuals with hearing loss is also a prevalent
psychological dilemma that affects the quality of life and enjoyment (Daniel, 2007;
Fausti, Wilmington, Helt, Helt, & Konrad-Martin, 2005; Stansfeld & Matheson, 2003).
Children with minimal and mild unilateral or bilateral hearing loss often have difficulties
in communication, emotions, and psychosocial function (Tharpe & Sladen, 2008).
According to Tharpe and Bess (1999), hearing loss may result in of poor psychosocial
function including common break-downs in family communication that may lead to
family tension and social isolation. Loneliness is an effect that adolescents that self-
identify as having a hearing loss report more compared to normal hearing adolescents
(Kent, 2003). This trend is due to the numerous communication breakdowns caused by
poor speech perception caused by hearing loss. Hearing loss also increases
dysfunction in self-esteem, behavior, energy, stress management, performance, and
19
social competence among children (Stansfeld & Matheson, 2003; Tharpe & Bess, 1999;
Tharpe & Sladen, 2008).
Behavioral problems present in children and adolescents with hearing loss also
include social withdrawal, uncooperative behaviors (i.e. lack of participation in group
activities) and aggression. Coll, Cutler, Thobro, Haas, and Powell (2009) reported hard
of hearing/deaf adolescents demonstrate more risk to self (i.e. risk of suicide, self harm,
and victimization) and aggression toward people and animals compared to normal
hearing peers. The high rates of aggression can be attributed to frustration due to the
inability to communicate effectively between peers and family members.
In addition, noise can cause impaired cognitive function. excessive exposure to
noise affects central processing, language comprehension, and attention in the form of
being less able to multitask in the presence of noise (i.e. background noise caused by
multiple talkers) (Daniel, 2007; McFadden & Pittman, 2008; Stansfeld & Matheson,
2003). A study evaluating students with hearing loss in Iowa schools found that children
with minimal hearing loss had language measures that illustrated a gap between the
children’s language age and their chronological age that increased with grade level. For
instance, the vocabulary of 8 year old children with hearing loss was as much as 3
years behind their normal hearing peers at that age (Davis et al., 1981; McFadden &
Pittman, 2008). The typical classroom setting tends to be a noisy and reverberant place.
Children with minimal hearing loss will have a greater difficulty maintaining performance
on a secondary task (e.g. taking notes in class) while performing the primary task of
listening (e.g. listening to lecture). This, in turn will affect their academic performance,

20
due to poor speech perception and an inability to allocate cognitive resources needed
for learning (McFadden & Pittman, 2008).
With deficits in language comprehension and other cognitive function, children with
minimal hearing loss have an obstacle to overcome when it comes to learning and
attaining an education. Educationally significant hearing losses, including NIHL, can
affect children’s potential to succeed and excel in school and ultimately in life. Hearing
loss is often related to the diminished academic performance among this population
(Kawada, 2004; McFadden & Pittman, 2008; Tharpe, 2008). Hearing loss at high
frequencies can affect children’s speech comprehension of the fricative sounds (e.g. /f/
or /s/) which can lead to decreased speech discrimination for differentiation of words
and overall performance in school. Bess et al.(1998) reported that young children with
minimal sensorineural hearing loss (MSHL) scored significantly lower on the
Comprehensive Test of Basic Skill (4th edition), displayed more behavioral problems,
and had lower self esteem compared to normal hearing children. Also, 37% of the
children with MSHL were reported to have failed at least one grade level, a striking
difference compared to the school district’s average of 8% failing at least one grade.
Noise also affects children by creating psychological vulnerability in the form of
anxiety and annoyance. Children may perceive noise as menacing and may have a
greater inability to habituate to loud sounds within their environments (Erlandsson,
Holmes, Widen, & Bohlin, 2008; Lusk, 1997; Stansfeld & Matheson, 2003). Some of the
poor outcomes associated with NIHL or hearing loss mentioned previously (i.e. poor
academic performance, low self-esteem, poor social competence and family
21
dysfunction) may lead to other risky health behaviors, such as greater likelihood of
smoking or abuse of alcohol or drugs (Kent, 2003; Spear & Kulbok, 2001).
Noise can also cause various other (non-auditory) physiological ailments that
poorly affect quality of life for individuals of all ages. These non-auditory problems
include increased stress, inability to concentrate, lack of sleep, elevated blood pressure,
and increased heart rate (Daniel, 2007; Erlandsson et al., 2008; Kawada, 2004;
Stansfeld & Matheson, 2003). Noise has a great effect on blood pressure in which
workers in hazardous noise environments of continuous noise levels of 85 decibels A-
weighted (dBA) have higher blood pressure that those not exposed to noise, which can
increase the risk of mortality for these workers (Stansfeld & Matheson, 2003).
Gender Differences Among NIHL
There is a clear gender difference in the prevalence of NIHL. Niskar et al. (2001)
estimated the prevalence of noise induced hearing threshold shift (NITS) among
children 6 to 19 years of age in the United States. The overall prevalence of NITS in one
or both ears was 12.5% (approximately 5.2 million children based on population of the
US). A higher prevalence was observed in males than females and a higher prevalence
of NITS was observed in children aged 12 to 19 years compared to 6 to 11 year olds.
Shargorodsky, Curhan, Curhan, and Eavey (2010) showed that females had lower
prevalence of high frequency hearing loss (10.1%) compared to males (15.3%) when
they repeated the NHANES analysis and extended it to more recent sampling years.
Recently, E. Henderson, Testa, and Hartnick (2011) reported the odds of NITS and the
odds of HFHL were less for females compared to males; however, the odds or rate of
NITS among females increased faster compared to males.

22
Young males are more likely to engage in hearing related risk behaviors than
young females (Vogel, Brug, van der Ploeg, & Raat, 2007; Vogel, Verschuure, van der
Ploeg, Brug, & Raat, 2009). A study by Widen, et al. (2006) examined the differences
between American and Swedish young adults regarding attitude towards noise and the
use of hearing protection at concerts. U.S. men held the most positive attitudes towards
noise (pro-noise), and women from Sweden held the most negative attitudes towards
noise. In both cultural groups, females were more likely to express negative attitudes
toward noise than their male counterparts.
Occupational HCP versus Educational HCP
There are numerous laws and regulations that are enacted for the protection of
American adult workers from work-related noise hazards that include: the Walsh Healey
Noise standard and the Occupational Safety and Health Administration (OSHA) 1983
Hearing Conservation Amendment. The Hearing Conservation Amendment requires the
use of permissible exposure level (PEL) or the maximum noise exposure of 90 dBA
during an 8 hour workday (Walsh Healey standard) and/or an action level of 85 dBA
during an 8 hour workday and the implementation of hearing conservation programs
(HCPs) and the use of hearing protective devices in the workplace (Berger et al., 2003;
Lusk, 1997; Rogers et al., 2009). OSHA requires that Occupational HCPs include noise
measurement and monitoring, audiometric testing, use of hearing protection devices,
employee education and training, record keeping, and program evaluation for
effectiveness (Berger et al., 2003; National Institute of Occupational Safety and Health,
2009; Rogers et al., 2009).
Unlike Occupational HCPs, Educational HCPs are targeted to children and focus
on education and training rather than monitoring and record keeping. Education and
23
motivation of children regarding positive hearing health behaviors toward noise is the
key focus of Educational HCPs. When comparing the education component of
Occupational HCP versus an Educational HCP, multiple differences exists. There are
seven required topics that should be included during the implementation of the
education component of an Occupational HCP that include the following: (1)
requirements of and rationale for the occupational noise standard, (2) effects of noise
on the auditory system, (3) company’s noise policy, (4) worksite noise hazards, (5) use
of hearing protection devices, (6) audiometric testing, and (7) importance of individual
responsibilities for preventing hearing loss (National Institute of Occupational Safety and
Health, 1998). The main components of an Occupational HCP that are similar to HCPs
targeted to children and adolescents include: (1) characteristics of noise and the
sources of noise, (2) anatomy and physiology of the ear and noise damage, (3) effects
of noise, (4) warning signs of NIHL, and (5) hearing protection devices (Rogers et al.,
2009).
The awareness and precautions of NIHL are well known for adults compared to
children due to their exposure to hazardous noise within the work environment. The
World Health Organization (WHO) stated that NIHL “is the most prevalent irreversible
industrial disease”; within the United States, approximately 30 million American workers
work in hazardous noise environments that may eventually result in NIHL for some
individuals (Robertson, Kerr, Garcia, & Halterman, 2007; Smith, 1998). Important laws
and regulations were enacted to protect employees from hazardous noise exposure in
industries that have noise, such as agriculture, mining, manufacturing, and the military
(Berger et al., 2003; Rogers et al., 2009). However, there are no regulations that
24
specifically protect individuals from recreational noise, such as noise from hunting or
attending clubs or discotheques within the United States.
There is great uncertainty of how to assess the dangers of recreational noise
exposure among young populations because of the great difference in how one is
exposed to recreational noise and the variety of this type of noise versus occupational
noise. Occupational noise regulations set by OSHA or stricter measures recommended
by NIOSH have been used as proxies for establishing safe exposure levels for
recreational noise from toys, MP3 players, urban areas, and transportation sounds.
Specific assumptions must be made when predicting children’s risk from exposure to
noise. For instance, within the literature of MP3 players and NIHL, the risk for NIHL is
often treated as equivalent to exposure to occupational noise (Keppler et al., 2010;
Vogel, Brug, Hosli, van der Ploeg, & Raat, 2008). For example, it is assumed that a
MP3 player delivering sound at a particular exposure level (i.e. 90 dBA) has the same
potential for causing NIHL as if the exposure were an occupational exposure. Because
many exposures are shorter and less frequent, some authors think that NIHL is very
unlikely. However, there is no knowledge of the possible repercussions of listening to
MP3 players for 10 years of varied amounts of time throughout the day and how that will
affect this population’s potential hearing outcomes. Current noise standards and/or
regulations may not be the best measure of prevention, but it is the best available guide
for designing Educational HCP for children.. Thus, what is needed is for audiologists,
hearing scientists, and those in the profession of preserving hearing to be proactive
when it comes to NIHL. What is known is that the effects of NIHL are detrimental; even
25
though, the acquisition of NIHL can be presumptuous in some cases, yet there are
effective preventative measures, such as educational HCPs.
There are no regulations for the implementation of Educational HCPs within the
school setting. Even though over the past 30 years the recommendation of
implementing Educational HCPs within the school setting has been stressed numerous
times, little action has been taken to integrate Educational HCPs within school systems
nationwide (Chermak, Curtis, & Seikel, 1996; Folmer, 2008; Roeser, Coleman, &
Adams, 1983; Weichbold & Zorowka, 2007). NIHL is completely preventable with proper
instruction on the means to combat the effects of noise. Fortunately, there are now
several Educational HCPs with curriculum targeted to children and adolescents.
Educational HCPs and Resources for Children
There are various agencies and organizations that have created resources for the
prevention of NIHL among children of all ages. Some of the resources are complete
HCPs aimed at NIHL prevention. Others provide information regarding anatomy and
physiology of the auditory system, types and degrees of hearing loss, and the risks of
noise. One must be very careful when researching Educational HCPs targeted to
children. HCPs are often incorrectly considered to be synonymous with early
identification and intervention programs within the public school setting or public arena.
Various states, such as Montana (Montana Office of Public Instruction) and California
(California Department of Health Care Services and Children Medical Services) have
statewide HCPs that are simply hearing loss screening, testing, and monitoring
programs without the aspect of educating students about hearing loss, prevention
measures, and the poor hearing related health outcomes caused by noise exposure

26
(Anderson, 1992; California Department of Health Care Services, 2009; Montana Office
of Public Instruction, 2008).
One available Educational HCP targeted towards children is “Crank It Down”
created by the National Hearing Conservation Association (NHCA). The Crank It Down
program was the conception of the 1995 NHCA’s task force on hearing conservation
education for children and adolescents (HCECA) (Meinke, 2009). HCECA’s mission of
protection was to start young by instilling an appreciation for hearing so that use of
hearing protection would be akin to wearing seatbelts or bicycle helmets. By 1999, the
NHCA had provided more than 250 copies of Crank It Down training videos. The Crank
It Down HCP includes a training video, a curriculum packet, a copy of the “Know Noise”
video by the Sight and Hearing Association, and audio demonstrations of hearing loss
and hearing protection.
Dangerous Decibels is another Educational HCP that was created from the
collaboration between the Oregon Museum of Science and Industry (OMSI), Oregon
Health and Science University, and the Oregon Hearing Research Center. This
partnership created an Educational HCP that has curriculum that can be modified for
children grades K -12 with numerous videos, games, and hands-on activities
(Dangerous Decibels, 2009; Martin, 2008). These activities are also provided in
educator kits for purchase. Audiologists, teachers, and other health educators may also
attend workshops geared to the effective teaching of this program for a nominal fee. In
addition, the OMSI, a partner of Dangerous Decibels, houses a permanent exhibition of
this program with a life size ear. Dangerous Decibels has been tested for efficacy in
changing attitudes/behaviors, but the latter has not been formally evaluated (Griest,
27
2008). Another Educational HCP created by House Ear Institute’s sound partners
project is “It’s How You Listen That Counts” (House Ear Institute, 2009). This program is
based on an online program which targets middle and high school students. The
program engages teens with audio-visual demonstrations on NIHL and NIHL prevention
measures. Also, student participants are provided flyers, earplugs, and opportunities to
win prizes on the House Ear Institute’s website created for teens and NIHL, earbud.org.
Know Noise is a HCP that is targeted to younger children in grades 3-6. This
comprehensive program provides a 140 page teacher’s manual that includes: 26 lesson
plans, transparencies, learning activities, technical information, supplemental articles
and resources, audio and video, and earplugs (Sight and Hearing Association, 2009).
Another comprehensive program by the Military Audiology Association targeted to
young children in grades 2 to 5 is titled Operation BANG (Be Aware of Noise
Generation). It was initially created to be hour long presentations covered over a period
of three days for 5th graders only. Fifth grade was chosen because most states require
hearing screenings at this grade level (Roeser, 1980; Roeser et al., 1983; Waldo, 2009).
This program can be modified into a 45 minute presentation for all elementary grade
levels. The three topical areas include: “And there was Sound” (covers the anatomy and
physiology of the ear and the physics of sound), “The Noise Experience” (experiences
of hazardous noise exposures), and lastly “Hearing Appreciation Day” (demonstrations
of effects of noise on hearing and the importance of protecting hearing). Supplemental
items like pencils, pens, and stickers are also available.
The Sound Sense HCP comes from our neighbors to the north, the Hearing
Foundation of Canada. This bilingual program comes in English and French versions

28
and is targeted for children in grades 4 to 7 (“tweens”) (Hearing Foundation of Canada,
2009). This Educational HCP focuses on teaching tweens or preteens about the
hazards of over-exposure to noise. The Educational HCP can be taught in 30 minute
increments or an hour long presentation. Sound Sense consists of a 10 minute video,
teacher’s lesson plan, decibel chart, stickers, earplugs, and evaluation forms. This
program is the only program that has a built in method of measuring the effectiveness of
the program by providing means of evaluating the HCP. Further, this program
suggested student projects for teachers to assign to students as preparation for the
topic of hearing and NIHL or post-program homework or class assignment. Wise Ears!
is another bilingual program that comes in English and Spanish versions. Wise Ears!
was created by the National Institute on Deafness and Other Communicative Disorders
(NIDCD) and targets children and adolescents in grades 3 to 8 (National Institute on
Deafness and Other Communicative Disorders, 2009b). This HCP provides resources
for kids, teachers, parents, and the public. There are age-appropriate information
materials, activities, and videos that teachers can modify for their students. The
objective of Wise Ears! is to increase awareness regarding NIHL among all audiences
and motivate these audiences to take action in preventing NIHL. Recently, the NIDCD
created a campaign named, “It’s A Noisy Planet: Protect their Hearing” that specifically
targets children between the ages of 8 to 12 years. This campaign also provides
resources for kids, parents, and the community.
There may be a limited amount of currently available Educational HCPs targeted
for children, yet a myriad of resources for NIHL awareness and prevention exists free of
charge or for a small nominal fee. The American Academy of Audiology (AAA) provides
29
excellent resources for everything related to the ear from information on vestibular
assessments, finding an audiologist, to NIHL. AAA has created the “Turn It To The Left”
campaign, an internet based resource (American Academy of Audiology, 2009). The
“Turn It ToThe Left” campaign includes the highly relatable rap song, “Turn It To The
Left” performed and written by Ben Jackson. The campaign also provides factsheets
about NIHL, hearing loss in children, and audiologists. In addition, this campaign
provides various worksheets on a number of topics such as the anatomy of the auditory
system and posters. The American Speech Language and Hearing Association (ASHA)
also has an internet based resource called “Listen to Your Buds” (American Speech
Language and Hearing Association, 2009). The campaign has two mascots, the buds,
which represent the earbuds that are commonly used to listen to MP3 players. This
campaign provides an interactive website that children, parents, and educators may
visit. This site has numerous factoids and games regarding NIHL, NIHL prevention, the
auditory system, and proper MP3 usage. ASHA has also partnered with NIDCD to
provide an internet resource to the “It’s A Noisy Planet: Protect Their Hearing”
Campaign website (National Institute on Deafness and Other Communicative Disorders,
2009a) Another excellent resource is provided by the National Aeronautics and Space
Administration (NASA) acoustical testing laboratory (National Aeronautics and Space
Administration, 2009). NASA’s acoustical testing laboratory provides a variety of
educational resources that promote NIHL prevention. Single copies of their media
(auditory demonstrations and animations), games, and activity sheets are provided free
of charge for the purpose of use in HCPs.
30
It may be easy for health care providers, especially audiologists, to advise
adolescents to avoid loud sounds and reduce time spent in those environments due to
the knowledge audiologists have already attained. But would children recognize a
sound as too loud or know how long of a listening period is dangerous to the auditory
system? Hearing education programs must provide truthful information so that children
may feel empowered with their knowledge that will increase their confidence and self-
efficacy to make changes to their behaviors. For instance, a common topic covered in
hearing conservation programs for adults and hearing education programs for children
is the noise exposure limit guidelines of NIOSH. NIOSH has created permissible noise
exposure levels using a limit of 85 dB for 8 hrs and an exchange rate of 3 dB, to predict
maximum time of exposure before permanent damage will take place if repeated(Berger
et al., 2003; Katbamna & Flamme, 2008; Lusk, 1997) . For instance, a sound
environment of 91 dB equals a maximum listening period of two hours. If children listen
to their MP3 players at 91 dB (many MP3 players produce sounds exceeding 90 dB)
and listen to their music for longer than two hours at a time daily over several years,
they may cause irreversible damage to their auditory systems (Roeser et al., 1983).
Thus, educating children is imperative because many children may simply be unaware
that their recreational listening habits may cause damage to their hearing.
Educational HCPs have certain components to be effective. According to Lass et
al. (1987), a hearing conservation education program must include the following: “1)
instruction regarding normal auditory mechanisms, 2) types of hearing loss and their
causes, 3) noise and its effect on hearing, 4) warning signs of NIHL, and lastly 5)
specific recommendations for preventing noise-induced hearing loss.” These same

31
components were reiterated by Anderson (1992), who suggests that NIHL curriculum
should provide information on how the ear works, how noise can damage hearing,
describe hearing loss and how hearing loss affects quality of life, illustrate the types of
noise and noisy activities that are risks to hearing, provide warning signs of NIHL and
finally, stress one’s responsibility and ability to protect one’s hearing. These
components are modeled from successful Occupational HCPs for employees. If all
these essential components are incorporated, then an Educational HCP for children has
the potential to be an effective health prevention program. For instance, Operation
BANG provides information on the physics of sound and the function of the auditory
system, the identification of warning signs of hearing loss, the effects of noise on
hearing, and prevention of NIHL. By having these components, Operation BANG fulfills
several goals of an effective Educational HCP; however, the method in which the HCP
is given is also as important as the information provided.
Weichbold and Zorowka (2007) implemented a variety of didactic approaches to
ensure that the topic of hearing conservation was as attractive as possible for the high
school students enrolled in their Educational HCP. The dynamic approaches included
multi-media presentations, role-play, demonstrations of protective devices and hearing
aids, group work, questionnaires, and discussions with persons with hearing loss and
tinnitus. These were all used to convey the importance of protecting one’s hearing from
loud sounds. Thus, the mentioned Educational HCP has a multimedia component
(either audio and/or visual demonstrations). Further, Folmer (2008) stated that
Educational HCPs for children/adolescents must be as interactive as possible, and the
use of a variety of media and activities are necessary for successful programs.

32
Chermak et al. (1996) recommend that instruction of Educational HCPs should not rely
only on information based on textbooks or class instruction in the traditional lecture
format. Instead, the use of peer teaching to promote peer leadership or the use of
supplemental activities (games, posters, and multimedia) should be steps to make a
program more interactive. These researchers found that students gained more
knowledge from an Educational HCP taught in a more interactive format compared to a
traditional lecture format (Chermak et al., 1996; Folmer, 2008). Also, an effective
program must have knowledgeable instructors of the course and the material. According
to Rogers et al. (2009), instructors of the Educational HCP must be qualified to teach
the material, confident, and able to present content appropriately; therefore, an ill-
trained instructor will not be able to convey the importance of the material or gain
respect from participants. Audiologists are more than qualified to instruct Educational
HCPs in the school setting with their extensive knowledge of hearing /hearing loss and
their constant skills in relaying information to parents, patients, teachers, and other
health care providers.
In a pilot study, Dell and Holmes (2012) found that a single presentation of an
educational HCP was effective in significantly reducing pro-noise attitudes among
adolescents. Thus, over the years the literature has revealed that Educational HCPs are
effective by changing knowledge, awareness, and motivation (Borchgrevink, 2003;
Chermak et al., 1996; Daniel, 2007; Roeser et al., 1983; Weichbold & Zorowka, 2007).
Effectiveness was generally measured by three methods: 1) by examining if the
Educational HCP contains all the essential components necessary for an effective
Educational HCP mentioned previously, 2) by examining the change in knowledge,
33
awareness, and intentions to change behavior through qualitative (i.e. focus groups)
and/or quantitative (i.e. surveys or questionnaires) methods, and 3) by measuring the
actual change in behavior (e.g. wearing earplugs at a concert) or a significant decrease
in hearing acuity from baseline audiometric measures. Weichbold and Zorowka (2007)
stress the third method of evaluation for effectiveness should be the true measure of
Educational HCP effectiveness. This is due to a general lack of studies using this
method as the criteria for effectiveness. These researchers assert this belief because
the ultimate goal of Educational HCP is the prevention of NIHL; subsequently, only a
reduction in NIHL will prove the effectiveness of an Educational HCP. Conversely, there
are studies that report changes in behavior, especially in the form of adolescents
increasing their use of hearing protective devices (Borchgrevink, 2003; Knobloch &
Broste, 1998). Weichbold and Zorowka’s assertion is a difference in epistemological or
theoretical viewpoint. Many health care experts follow and believe in a particular
theoretical framework to explain certain health behaviors. In contrast to Weichbold and
Zorowka (2007), other researchers that use a change in knowledge, awareness, or
motivation as the measure of effectiveness, following the constructs of the Health Belief
Model (Daniel, 2007; Rosenstock, Strecher, & Becker, 1988). Based on this model,
individuals must first acquire awareness and knowledge. This knowledge allows them to
perceive their susceptibility to acquiring hearing loss, understand that the effects of
NIHL can be severe, and understand the perceived benefits and barriers of taking
preventative actions before a change in behavior is made. Even though Weichbold and
Zorowka make a valid point, it is unfair to reduce the importance of changing knowledge

34
as a measure of effectiveness because researchers differ in their selection of a
theoretical framework that may guide their research.
Racial/Ethnic Group Disparities and NIHL
The beginning of the 21th century marked a substantial growth in the diversity of
people within the United States with approximately 25% of the population being part of a
minority group based on the 2000 Census (U.S. Census Bureau, 2000). It is projected
by the year 2050, that the United States will become a majority-minority nation in which
Caucasians will make up less than 50% of the population (LaVeist, 2005). Hence, it is
becoming more imperative that as a nation we examine and understand the health
status of racial minorities within this nation. These groups tend to present more health
disparities, such as having higher rates of health conditions such as diabetes, heart
disease, and respiratory diseases (LaVeist, 2005). Health Disparities are the
“differences in the incidence, prevalence, mortality, and burden of disease and other
adverse health conditions that exist among specific population groups in the United
States in which socioeconomic status is also encompassed in this definition” (NIH,
2004; LaVeist, 2005).
Hispanics represent 16.3% of the U.S. population making Hispanics the largest
minority group in the U.S. (U.S. Census Bureau 2010). This racial group has grown
rapidly from approximately 15 million in 1980 to over 50 million in 2010. This minority
group present with lower mortality rates than non-Hispanics, such as in males aged 55
or older, which is paradoxical due to lower socio-economic status (SES) and lower
access to health care services (LaVeist, 2005). A recent epidemiological study by
Shargorodsky et al. (2010) using NHANES data reported that Hispanic children

35
presented with the lowest prevalence of NIHL (14.8%) compared to Caucasians
(17.6%) and African Americans (17.2%).
African Americans make up approximately 13.6% of the U.S. population, which
makes them the third largest racial/ethnic group in the country, which more than half of
the African American population lives in the southern regions (U.S. Census Bureau,
2000). African Americans, compared to other racial groups, have higher mortality rates
and higher rates for serious health conditions. For instance, African Americans have the
highest infant mortality rate with approximately 13.4 deaths per 1,000 live births
compared to an infant mortality rate of 4.6 deaths per 1,000 live births among Asians
(LaVeist, 2005). Also, the prevalence of health conditions, such as HIV/AIDs,
hypertension, and diabetes, are higher among African Americans. This racial group also
has the highest poverty rates with those living at or below the federal poverty level with
25.8%, 25.3%, 12.5%, and 12.3%, for African Americans, Latinos, Asians, and
Caucasians, respectively (U.S. Census Bureau, 2009). Thus, high poverty rates and low
SES may facilitate higher rates of mortality and morbidity among African Americans and
other groups due to the lack of resources (i.e. education and economic) that limit the
access to healthcare when compared to other groups with more resources (LaVeist,
2005).
There is very little literature regarding racial/ethnic differences among African
Americans, Hispanics, and other groups regarding NIHL. However, from the limited
research, it can be gleamed that African Americans, both adults and children, have a
lower prevalence of NIHL. In the Third National Health and Nutrition Examination
Survey (NHANES III), African American children had the lowest prevalence (11.7%) of

36
high frequency hearing loss or NIHL compared to Caucasian children (12.3%) and
Latino children (15.1%) (Niskar et al., 2001), yet there is no statistical differences
between these groups. Additionally, data from the National Health and Nutrition
Examination Survey (1999-2004) revealed that African American adults had
significantly lower prevalence of high frequency hearing loss in one or both ears
compared to Caucasians and Latinos (Agrawal et al., 2008; Lee, Gomez-Marin, Lam, &
Zheng, 2004). The overall prevalence of high frequency hearing loss among African
Americans was 19% compared to 36% among Caucasians and 27% among Latinos.
Recent research showed that Hispanic children present with a lowest prevalence of
hearing loss compared to other racial groups, but Hispanic adults presented with higher
prevalence of hearing compared to African Americans.
Thus, one could assume that African Americans have specific knowledge and
behaviors, regarding the protection of the auditory system from noise. However, a study
by Crandell, Mills, and Gauthier (2004) examined differences in knowledge, behaviors,
and attitudes of African American students compared to Caucasian students at the
University of Florida. The data revealed that African American students were
consistently less likely to correctly identify symptoms of excessive noise and the risk of
hearing damage compared to their Caucasian counterparts, yet these students knew
that excessive noise could cause damage to the auditory system. Thus, how does this
paradox exists? African Americans generally tend to show disparities in health, which
can be seen in the high morbidity and mortality rates, but when it comes to NIHL, the
African American adult population has seemed to have escaped this health condition. .
On the other hand, NIHL also depends on an individual’s susceptibility; African

37
American children may have an auditory protection mechanism in the form of increased
melanin in their bodies. Melanin resides in the cochlear duct, stria vascularis, Reissner’s
membrane, modialus, and the vestibular organs (Barrenas & Lindgren, 1991).
Conversely, no significant differences in hearing have been reported between
Caucasian, Hispanic, and African American children. Could the lack of differences in
risk behaviors between these groups of children be causing the gap between groups to
decrease?
Purpose
The danger of NIHL is a great concern among adults; now NIHL is a great concern
among children and adolescents. NIHL among children and adolescents causes
negative consequences that affect their quality of life (Lusk, 1997). The risk of acquiring
NIHL among children that are exposed to noise is due to effects of recreational noise on
their vulnerable auditory systems, the effect of engaging in risky hearing health
behaviors, and the effect of their perceptions of noise. Thus, individuals from different
racial/ethnic groups with varying socio-economic status (SES) levels hold different
beliefs and life experiences. These beliefs and experiences may or may not include
information regarding hearing.
There is limited research regarding the racial/ethnic differences in attitudes and
behaviors towards noise among children that may lead to differences in the prevalence
of NIHL and hearing protective behaviors among racial/ethnic diverse children. Hence,
the purpose of this study is to investigate possible differences in attitudes, knowledge,
behaviors (protective and risky), and the presence of NIHL among African American,
Hispanic, and Caucasian children. In addition, the influence of several social
determinants (gender, age, etc.) on the attitudes towards noise and hearing related
38
behaviors that prevent or lead to NIHL was examined to possibly rectify the paradox of
African American children’s knowledge of NIHL and prevalence of NIHL. Thus, to what
extent does race/ethnicity play a role in the attainment of positive or negative attitudes
and beliefs towards noise, use of hearing protective behaviors, and the development of
NIHL among African American, Hispanic, and Caucasian children?
As a result, the following research hypotheses were created. First, attitudes and
knowledge of NIHL will vary with race in African American, Hispanic, and Caucasian
children. Within group differences based on gender (i.e. African American males versus
African American females) are also expected. Thus, African American children,
especially African American males will have more positive attitudes towards noise (pro-
noise) and a lower prevalence of NIHL compared to Caucasian and Hispanic
counterparts. This is due to the social and cultural situation (i.e. cultural identity of
“machismo”) the African American and Hispanic children who may promote more pro-
noise attitudes and risky behaviors. Further, Caucasian children, especially females will
display the most conservative attitudes toward noise compared to African American and
Hispanic children. This will be attributable to the higher likelihood that the Caucasian
parents are have attained higher education, and may understand the risk of noise and
may live in quieter, more affluent physical environments. In addition, Caucasian females
will also be more knowledgeable than the other racial groups. Caucasian children will be
the most knowledgeable compared to the other race/ethnic groups. Second, an
educational HCP will be found to be an effective method in changing knowledge,
attitudes, and behaviors among diverse groups of children. Within the literature,

39
Educational HCPs are very effective in changing knowledge and attitudes, yet change in
behavior is rarely accessed.

40
CHAPTER 2 METHODS
Participants
Racially diverse children in the fourth and/or fifth grades (aged eight to twelve
years) were selected to participate in this project. This age bracket was chosen due to
two reasons (1) the ability to complete the pre and post test measures and (2) the
children’s young age. Within the literature, exposure to pro-health or positive health
messages has greater influence on children if they are exposed to these messages
earlier in life (before adolescence) versus later in childhood. For example, the health
promotion of wearing sun protection (i.e. sunscreen) to prevent skin cancer among
children is more effective in younger children in which various research of sun
protection intervention programs show that the most effective intervention programs are
targeted to children at younger ages. According to Olsen et al. (2007), the creation of
the SunSafe Program for children aged 2 to 10 years old was highly effective in
promoting healthy sun protective beliefs and behaviors. When children are exposed at
a younger age to hearing protective education and behaviors, the more likely they will
NOT engage in risky hearing behaviors (Folmer, 2008; Howarth, 2008).
Ethics of working with Special Populations
When working with vulnerable populations, such as children, researchers must
ensure the safety and confidentiality of the participants. The University of Florida’s
Institutional Review Board (IRB) approved this protocol before study initiation (IRB
protocol #592-2010). This protocol involves no more than minimal risk ordinarily
encountered in daily life or during the performance of routine physical or psychological
examinations or tests. All the data collected was de-identified for the confidentiality of
41
each participant. Participants’ names were replaced with random identification numbers.
The information is stored in a locked secured room that will be only accessible to core
investigators and graduate students. All focus groups were audio-taped and transcribed
for content analysis. Further, during transcription of the focus groups no participant
identifiers were recorded with transcribed data. Only de-identified text files were shared
with investigators and graduate students.
Parental consent was obtained via participant. Written consent was obtained in the
letter format based on IRB 1 written informed concept form template on University of
Florida letterhead. Participant’s parents were given and instructed to keep one copy of
the informed consent for his/her records and to return one signed copy to the
investigators. The children signed assent consent for participation in the study. The
parental consent form and assent form specified the purpose of the research, the study
protocol, and the time length required for participation. All participants had the right to
withdraw from the study at any time.
Sampling and Recruitment
Study participants were recruited from two elementary schools within Osceola
County located near Kissimmee, FL and the Boys and Girls Club of Alachua County and
the O2Bkids within Alachua County in Gainesville, FL based on access to diverse
populations. The two elementary schools that were chosen for participant recruitment
included Neptune and Reedy Creek elementary schools. Participants from Neptune
elementary were recruited from the fourth and fifth grades compared to the participants
recruited from the fifth grade from Reedy Creek elementary. Neptune elementary is an
A-rated school that had 67.35% of the school’s population receives free/reduced lunch
in the 2011/2012 school year. The racial make-up of the students in the fourth grade
42
was as follows: Caucasian children 27%, African American children 11%, and Hispanic
children 59%. The racial make-up of the students in the fifth grade was as follows:
Caucasian children 19%, African American children 10%, and Hispanic children 69%
(Florida Department of Education, 2012). Reedy Creek elementary school is also an A-
rated school that had 70.16% of the student population receives free/reduced lunch
during the 2011/2012 school year. The racial make-up of Reedy Creek elementary fifth
grade students were 18% were Caucasian children, 20% were African American
children, and 57% were Hispanic children. The racial/ethnic group populations at both
schools were quite different from the State of Florida’s population percentages that have
the percentage of Caucasians equal to 43.2%, African Americans equal to 22.9%, and
Hispanics equal to 27.9%
Measures and Materials
Materials that were used in this study include the following equipment: Welch Allan
otoscope, Grason Stadler (GSI) 17 audiometer, GSI 37 Auto Tymp Tympanometer, GSI
AudioScreener+ distortion product otoacoustic emission machine, a hearing
conservation program, and case history and questionnaire forms (pre and post). The
hearing conservation program was a modification of the Dangerous Decibels program.
Dangerous Decibels is a highly interactive and evidence-based program targeted to
children in grades K -12 (Folmer, 2008; Martin, 2008). The pre- measure comprised of a
case history section and questionnaire that included questions pertaining to
demographics (5 questions), children habits and knowledge (14 questions modified from
Dangerous Decibels 4th grade questionnaire), and the Youth Attitudes to Noise Scale
(S. E. Widen et al., 2006)(YANS, 19 questions modified for age level). The post-
measure include the same case history and questionnaire questions as mentioned
43
previously with the exception of having 13 questions to measure children habits and
knowledge (modified also from the Dangerous Decibels 4th questionnaire). The case
history section asked participant’s for their age, gender, race/ethnicity, and parent’s
occupation. The questions from the Dangerous Decibels 4th grade questionnaire (Griest,
2008) include questions regarding children’s beliefs regarding noise and their hearing
related behaviors. The YANS have four main categories of questions that include:
attitudes towards noise associated with youth culture (8 items), attitudes towards daily
noises (3 items), intention to influence sound environment (4 items), and attitudes
towards the ability to concentrate in noisy environments (4 items). These four categories
had a four factors solution performed and the alpha values are alpha .78 for attitudes
towards noise associated with youth culture, alpha .72 for attitude towards daily noises,
alpha .53 for intention to influence sound environment, and alpha .66 for attitudes
towards the ability to concentrate in noisy environments (S. E. Widen & Erlandsson,
2004).
Procedures
All of the participants were randomly divided into two groups, control and
experimental. The two groups were cross-balanced by the order in which they received
the pre measure and the audiometric testing. Thus, the participants in the control group
either received the audiometric testing prior to receipt of the pre measure or they
received the pre measure prior to the audiometric testing. Cross-balance of the order
may identify any possible modification to pre measure answers due to the awareness of
NIHL that audiometric testing in itself may arise. The experimental group was also
cross-balanced for test order; and they received a 50 minute interactive presentation of
44
the hearing conservation program. The control and experimental groups both received
the post measure four to seven weeks after completing the pre measure.
All participants received an audiometric test in a quiet room in their elementary
schools or community center. The audiometric protocol included hearing tests with
otoscopy, tympanometry, otoacoustic emissions, and pure tone audiometric screening.
The audiologic test took approximately 15-20 minutes to complete. Universal health
precautions were executed for each and every hearing test. Otoscopy was performed
on each participant to examine the external ear canals for excessive cerumen, infection,
and irritation and inspection of the tympanic membrane. If a participant had excessive
cerumen, infection, irritation, or inflamed tympanic membrane, the participant was
provided a parental notification letter for further medical follow-up or was referred to the
school nurse. Once the external ear canal was deemed free of cerumen or the
tympanic membrane free of any abnormalities, tympanometry was performed to
evaluate the middle ear function. The tympanometric descriptive system was used to
classify the middle ear results; therefore, any participants with a Type B or Type C
tympanogram was also provided a parental notification letter for further medical follow-
up or was referred to the school nurse. Distortion Product Otoacoutic Emissions
(DPOAEs) tests were used to measure the integrity of the outer hair cells-cells that are
highly sensitive to high intensity sounds. The otoacoustic emissions device was set in a
screening mode for the high frequencies (2000, 3000, and4000Hz) at 65/55 dB levels.
The next testing measure for the participants was an audiometric screening that was
given at 1000, 2000, 3000, 4000, and 6000 Hertz (Hz) in the right and left ears. Each
participant was asked to indicate when he or she heard the tone by stating that he or

45
she heard a tone by saying yes or raising his or her hand. Hearing will be screened at
15 dB HL. In the event that a child does not respond at that intensity, a modified
Hughson-Westlake procedure will be used to obtain the child’s threshold. Children with
thresholds ≥ 20 dB HL at any frequency in any ear will be classified for this study as
having hearing loss. Thus, these participants were retested at least two weeks later to
access permanency of the elevated thresholds. In the advent, a participant with retested
results of greater than 20 dB at any frequency during the second hearing test was
provided a parental notification letter for further medical follow-up for a complete
audiologic evaluation and/or was referred to the educational audiologist of the Osceola
County school district for a full audiologic evaluation. Children in the after school
programs (i.e. Boys and Girls) were provided referral letters to notify parents of the
results and the recommendation of medical follow-up with the child’s primary care
physician. Participants enrolled in the Deaf and Hard of Hearing program were excluded
from the study..
The hearing conservation program included information about the anatomy and
physiology of the auditory system, the causes of noise induced hearing loss using
NIOSH exposure levels, and how to protect one’s hearing from NIHL. Each hearing
conservation program started with an introduction of the investigator and the purpose of
the HCP and an explanation of the importance of taking part in the HCP. Various
activities via the use of the Virtual exhibit of Dangerous Decibels program and hands-on
activities were performed during the 50 minute program that included several topics that
were given in the following order: “What is Sound”, “How Do We Hear”, “What’s that
Sound”, “How Loud is too Loud”, and “Save Your Ears”. During the topic of “What is
46
Sound”, the participants were informed about what is sound and was given a visual
representation of sound waves with the use of a tuning fork and a ping pong ball tied to
a string. “How Do We Hear” section discussed the anatomy and physiology of the
auditory system from the external ear canal to the cochlea. Participants were either
given the physical props of two marshmallows and angel hair pasta or the use of pipe
cleaners. These props represented the movement of the tectorial membrane and
stereocilia of the outer hair cells, and how the damage of the stereocilia is irreversible
due to loud sounds. The third topic covered was “What’s that Sound” in which this
activity is a virtual game that simulates a hearing loss. Therefore, the goal of the game
is for an individual to correctly identify a sound presented with hearing loss. After the
game was completed a short dialogue of the psychosocial effects of hearing loss was
discussed with the participants. The fourth topic discussed was “How Loud is too Loud”,
which covered the identification of dangerous sounds based on the NIOSH exposure
level recommendations.
The virtual game of “How Loud is too Loud”, had the individual choose a tile that
represented a sound (i.e. a rock concert) and determine if the sound is a safe sound or
a dangerous sound. After the participants were given information regarding dangerous
sound levels, the three methods of hearing protection were discussed. The first method
of hearing protection of NIHL was to “turn it down” (turn down the volume on the sound
source). The second method was to “walk away” from the sound source. An actual
activity of using a sound level meter, tape measure, and radio illustrated the
effectiveness of walking away from a source would decrease the volume emitted from
the sound source or the radio which was used in this activity. The third method is the
47
use of hearing protection and the corresponding activity included the use of a sound
level meter, bubble wrap, and a radio. Participants used the bubble wrap to block the
sound waves from the radio; therefore, demonstrating how an ear plug would limit
sounds from entering in the ear canal. The final topic covered was “Save Your Ears”,
which was a virtual game in which the participants had to correctly use the three
methods of hearing protection in a specified situation. If the correct hearing health
behavior was performed the participants won the game. Therefore, at the end of the
HCP, the three methods of hearing protection were re-iterated to the participants.
After all the post test measures, a randomly-selected group of participants from
experimental group participated in focus groups to investigate the knowledge, beliefs,
and behaviors related to noise and hearing health behaviors among these children. The
focus groups were used to investigate various themes related to noise exposure, such
as invulnerability to hearing loss among the young. Two focus groups were established
after the completion of all post-test measures. Participants for the focus groups were
solicited from the experimental group who were given permission by parents and/or
guardians and agreed to participate in the focus group. Each focus group had 3-5
participants with similar representation of male and female participants; therefore, 8
participants participated in the focus groups. Each focus group had one experienced
group leader and a research assistant and lasted for approximately 1 to 1 and1/2 hours
each. The same focus group guidelines and themes were discussed in each group.
Participants will be asked to further explore their hearing-related beliefs and behaviors,
change in hearing-health knowledge, and thoughts on the hearing conservation

48
program. All sessions were recorded and transcribed and evaluated for the important
themes.

49
CHAPTER 3 RESULTS
This investigation was completed in two public schools in Osceola County, FL and
in two afterschool programs in Gainesville, FL. The results discussed include the
overall population that received the surveys, initial and follow-up audiometric screenings
(prevalence data), and the results from participants that received a HCP.
Prevalence Data
Over 450 children were solicited to participate in this study; 201 students received
parental permission for participation. Of the 201 participants, 22 either failed to initiate
study participation due to moving away and/or multiple absences or they were dropped
from the study since they were enrolled in the Deaf and Hard of Hearing Program at
Neptune elementary. Of the remaining 179 participants, 73 were male and 106 were
female. There were 46 Caucasian children, 49 African American children, and 84
Hispanic children that participated and the gender makeup of each group is shown in
Table 3-1.
Prevalence of Hearing Loss in Audiometric Data
Table 3-2 shows the count and prevalence of the participants who failed
tympanometry and/or the audiometric/pure tone screening by race and gender. In the
total study population, 29.6% failed either the pure tone or tympanometry screenings in
at least one ear. Because a failure in tympanometry is indicative of middle ear
pathology, the 12 participants who failed this screening in at least one ear were
immediately referred to the school nurse for medical follow-up and are excluded from
further prevalence analyses. The prevalence of middle ear pathology among
Caucasians was 2% (n= 3/Males=0 and Females=3), among African Americans was 2%
50
(n=3/Males=2 and Females=1), and among Hispanics was 3% (n=6/Males=2 and
Females=4).
Table 3-3 shows the count and prevalence of those that passed the pure tone
screening or failed the pure tone screening at any frequency from 1000 to 6000 Hz in at
least one ear (excluding all participants that failed tympanometry). Twenty-four and a
half percent failed the pure tone screening. However, it should be noted that 1000 Hz
was highly susceptible to background noise (i.e. air conditioning fans in screening
rooms) in which participants found it hard to hear the presented tone at 15 dB HL;
therefore, the results at 1000 Hz was considered invalid and these children were
considered a pass for re-screening purposes . All of the remaining participants passed
at 2000 Hz with the exception of one participant that failed at 2000 Hz in the right ear
and he or she was lost to follow-up testing.
High frequency hearing loss was defined as having failed at any frequency in at
least one ear for the following frequencies: 3000, 4000, and 6000 Hz. Table 3-4 shows
the count and prevalence of those that passed the pure tone screenings and those that
presented with loss in the higher frequencies. Therefore, based on this classification, 30
participants were classified as having high frequency hearing loss. The remaining 137
participants that passed tympanometric and audiometric screening measures were
classified as having normal hearing acuity in both ears. The prevalence of high
frequency hearing loss at the first screening among Caucasians was 4.1%, among
African Americans was 3.6%, and among Hispanics was 10.1%. A chi-square analysis
was performed to measure any possible differences in the prevalence of hearing
disorders among the racial groups. There were no statistical differences between any of

51
the groups (p=0.796, Pearson Chi Square=1.671). A chi-square test was also used to
analyze if there were any gender differences in the prevalence of hearing disorders in
which none were found (p=0.817; Pearson Chi Square=0.405).
The total study population (n=179) had 137 (76.5%) participants with normal
hearing acuity, 12 (6.7%) participants had a middle ear pathology, and 30 (16.8%)
participants had a high frequency hearing loss. The study protocol included retesting
participants that did not pass the initial pure-tone screening, and were classified as
failing the pure tone screening. Out of the 30 participants only 18 children were able to
be retested due to time and availability of the participants (i.e. multiple absences on
scheduled retest days), so 12 participants were lost to follow-up. Of the 18 participants
(11.6% of the study population, n=155) classified as having high frequency loss, only 7
participants or 4.6% of the study population presented with high frequency hearing loss
after the retest evaluation. Therefore, 11 participants passed the audiometric screening
on the second pure tone screening. Table 3-5 shows the count and prevalence of the
remaining population (n=155) of those that passed the pure tone screenings and those
that presented with loss in the high frequencies after being retested.
DPOAEs were obtained at 2000, 3000, and 4000 Hz in both ears from most of
the study population depending on the integrity of their middle ear system, and
background noise. Only five participants did not complete DPOAE testing due to
excessive background noise; as a result, 174 participants completed DPOAE testing.
The GSI AudioScreener+ reported a Pass result if DPOAEs were present at two out of
the three frequencies or a Refer result if DPOAEs were present only at one frequency
(which the other frequencies were reported as having too much noise or absent/reduced
52
DPOAEs). DPOAEs results were reported for each frequency and the overall result for
each ear. The prevalence of the participants that passed overall in the right ear was 159
students (88.8%). Fifteen students (8.4%) failed DPOAE testing in the right ear.
Participants that passed overall in the left ear were 162 students (90.5%) and 11
students (6.1%) failed DPOAE testing in the left ear. It should be noted that one
participant did not have his left ear tested due to an inability to maintain proper probe fit
in the external ear canal.
A chi-square analysis showed no gender differences in the overall right ear
(p=0.608, Pearson Chi-square=0.262) and overall left ear (p=0.349, Pearson Chi-
square=0.878) results. In addition, chi-square analysis showed no racial differences for
overall right ear (p=0.480, Pearson Chi-square=1.468) and overall left ear (p=0.315,
Pearson Chi-square=2.310). In addition, Table 3-6 shows the DPOAE pass and refer
rates for each ear at each frequency by race. Chi-square analysis of each frequency
also showed no statistically significant gender or racial differences, and Table 3-7
displays the p-values of each frequency based on race and gender. Examination of
overall results in at least one ear of the DPOAEs in relation to pure tone screening
showed the DPOAEs with a sensitivity equal to 13.3% (proportion of true positives in
those classified with high frequency loss) and specificity equal to 91.9% (proportion of
true negatives in those classified with normal hearing acuity); Table 3-8 displays the
comparison of the DPOAE results with high frequency hearing loss status.
Attitudes and Knowledge towards Noise
Participants’ Attitudes toward Noise
In addition to the audiometric screening, each participant (n=179) was asked to
complete a survey on attitudes and knowledge. The Youth Attitudes to Noise (YANS)

53
portion of the measure provided the information regarding the attitudes towards noise
by the participants. The YANS provides an overall score and four sub-scores that
include the following: Entire YANS, Factor One or Youth Culture, Factor Two or
Concentration in Noisy Situations, Factor Three or Daily Noises, and Factor Four or
Intent to Influence the Sound Environment. The YANS measure is based on a Likert-
type scale (1-5), which the higher a person scores on this measure the more pro-noise
attitudes he or she hold; therefore, a person with a mean score of 4.5 has a more
positive attitude toward noise compared to a person that has a mean score of 3.
Examination of the total study population’s mean scores on the Entire YANS (Table 3-9)
revealed a mean of 3.23 (standard deviation [SD] = 0.639) for Caucasians, a mean of
3.23 (SD= 0.586) for African Americans, and a mean score of 3.18 (SD= 0.621) for
Hispanics. The mean scores for Factor One for Caucasians was 3.46 (SD= 0.767), for
African Americans was 3.42 (SD= 3.702), and for Hispanics was 3.32 (SD=0.780).
Factor Two mean scores for Caucasians was 2.85 (SD=1.001), African Americans was
2.80 (SD=1.09), and Hispanics was 2.80 (SD= 0.979). The mean scores for Factor
Three was 3.40 (SD= 0.926) for Caucasians, 3.55 (SD= 0.921) for African Americans,
and 3.26 (SD=0.895) for Hispanics. Lastly, mean scores for Factor Four was 2.89
(SD=0.760) for Caucasians, 2.84 (SD=0.778) for African Americans, and 2.82 (SD=
1.001).
Five two way analysis of variance (ANOVA) was used to evaluate gender and race
on the entire YANS and each factor using the model of 179 participants in three groups
(Caucasian, African American, and Hispanic) by two genders (male and female). Table
3-10 displays the ANOVA results for the Entire YANS and four sub-factors.
54
The ANOVA evaluation of the entire YANS revealed no gender and race
interactions with the following F ratio, F [2, 172] (between groups degrees of freedom,
within groups degrees of freedom) =0.909, p=0.405. The main effect of gender for the
Entire YANS was not significant between the males and females (F [1,172]=2.537,
p=0.113). There was no significant main effect of race/ethnicity for the Entire YANS
among Caucasians, African Americans, and Hispanics (F [2,172]=1.113, p=0.331).
Factor One or Youth Culture showed no significant interaction of gender and race (F
[2,172]=1.325, p=0.268). The main effect of gender on youth culture was not significant
between males and females (F [1,172]=1.898, p=0.170). There was no significant main
effect of race/ethnicity differences among Caucasians, African Americans, and
Hispanics (F [2,172]=0.999, p=0.370).
Evaluation of Factor Two or Concentration in Noise revealed no significant gender
and race interactions (F [2,172]=1.418, p=0.245). Also, there was no significant gender
main effect between the sexes (F [1,172]=1.066, p=0.303). The main effect of the
variable race/ethnicity was not significant present in the study population (F
[2,172]=0.332, p=0.713). Factor Three or Daily noises showed no significant gender and
race interactions (F [2,172]=0.472, p=0.625). There was a significant gender main effect
on Daily noises that showed that females scored significantly lower than males, so
males have more pro-noise attitudes regarding daily noises (F [1,172]=5.352, p=0.022)
There was no significant main effect of race/ethnicity among the racial groups (F
[2,172]=1.489, p=0.228).
Factor Four on Intent to Influence the Sound Environment showed no significant
gender and race interaction (F [2,172]=2.461, p=0.088). There was also no significant
55
gender main effect between the males and females (F [1,172]=0.070, p=0.792). Finally,
there was no significant main effect of race among Caucasians, African Americans, and
Hispanics (F [2,172] =0.332, p=0.725).
Participants’ Knowledge toward Noise
Participants also answered questions modified from the Dangerous Decibels 4th
grade questionnaire (Griest, 2008) that include questions regarding reported
prevalence, efficacy, and knowledge questions for a combined total of 14 questions on
the pre-test measure and 13 questions on the post-test measure. Seven questions from
these two measures specifically evaluated the participants’ hearing protective behaviors
and perceived knowledge and efficacy, which there were no correct or in-correct
answers. Table 3-11 illustrates the number of participants that reported exposure to
hazardous sound sources. A large proportion of participants (84.9%) reported use of
Mp3 players. Participants also reported that they had fired a gun (19%), used a gas
lawn mower (22.9%), gone to a concert (34.1%), played in a band (8.4%), rode on a
motorcycle (27.4%), or gone to car race (17.9%). Participants were questioned if the
used hearing protection around loud sounds; only 2.8% reported that they always use
hearing protection compared to 34.6% that reported they sometimes use hearing
protection and 62.6 % who reported they never use hearing protection. Thirty four
percent of the participants reported that they attended a concert, yet only 32.4%
reported using hearing protection when attending a concert. Figures 3-1 shows the
reported participants’ experience of tinnitus in which 37.43% reported experiencing
tinnitus, 27.37% reported that they were no sure they ever experienced tinnitus, and
35.20% reported that they did not experience tinnitus.
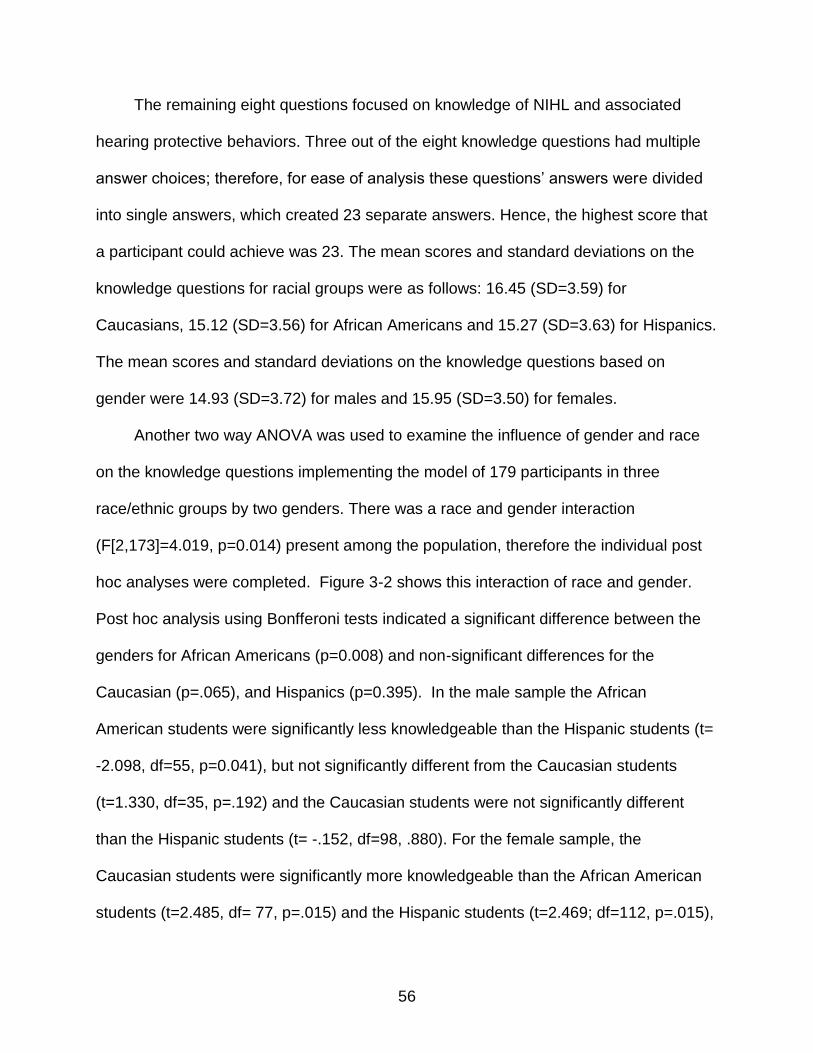
56
The remaining eight questions focused on knowledge of NIHL and associated
hearing protective behaviors. Three out of the eight knowledge questions had multiple
answer choices; therefore, for ease of analysis these questions’ answers were divided
into single answers, which created 23 separate answers. Hence, the highest score that
a participant could achieve was 23. The mean scores and standard deviations on the
knowledge questions for racial groups were as follows: 16.45 (SD=3.59) for
Caucasians, 15.12 (SD=3.56) for African Americans and 15.27 (SD=3.63) for Hispanics.
The mean scores and standard deviations on the knowledge questions based on
gender were 14.93 (SD=3.72) for males and 15.95 (SD=3.50) for females.
Another two way ANOVA was used to examine the influence of gender and race
on the knowledge questions implementing the model of 179 participants in three
race/ethnic groups by two genders. There was a race and gender interaction
(F[2,173]=4.019, p=0.014) present among the population, therefore the individual post
hoc analyses were completed. Figure 3-2 shows this interaction of race and gender.
Post hoc analysis using Bonfferoni tests indicated a significant difference between the
genders for African Americans (p=0.008) and non-significant differences for the
Caucasian (p=.065), and Hispanics (p=0.395). In the male sample the African
American students were significantly less knowledgeable than the Hispanic students (t=
-2.098, df=55, p=0.041), but not significantly different from the Caucasian students
(t=1.330, df=35, p=.192) and the Caucasian students were not significantly different
than the Hispanic students (t= -.152, df=98, .880). For the female sample, the
Caucasian students were significantly more knowledgeable than the African American
students (t=2.485, df= 77, p=.015) and the Hispanic students (t=2.469; df=112, p=.015),

57
but the African American females were not significantly more knowledgeable than the
Hispanic group. Therefore, the Caucasian females were the most knowledgeable
whereas the African American males were the least knowledgeable.
The order in which the participants received the hearing test or the pre-test
measure was cross-balanced. An independent t-test was also used to evaluate if an
order effect existed among the participants, which no order effect was seen for the
Entire YANS (p=0.750), Factor One (p=0.343), Factor Two (p=0.272), Factor Three
(p=0.517), and Factor Four (p=0.772).
In addition, Pearson correlation analysis was completed on the entire YANS score
and the knowledge measure for all participants (n=179). A significant negative
correlation (r=-0.256, p=0.001) indicating that with higher knowledge participants
reported lower pro-noise attitudes.
Effects of Hearing Conservation Program
Hearing Conservation Training Effects on Attitudes
The hearing conservation program was provided to 112 participants (experimental
group). Due to the small number of subjects per cell when looking at both gender and
Race/ethnicity, separate analyses were completed for each of these variables. Five
ANOVAs with repeated measures procedures (analysis of entire YANS and 4 Sub-
factors) were used to examine any possible differences in attitudes before and after the
HCP looking at gender differences. The statistical model was 112 participants in 2
genders (males and females) by two test administrations (Pre and Post HCP
Measures). Table 3-12 displays the pre and post HCP means, standard deviations, F
ratios, and significance levels for the Entire YANS, Factor One or Youth Culture, Factor
Two or Concentration in Noise, Factor Three or Daily Noise, and Factor Four or Intent to

58
Influence. There were no significant interactions of gender by pre and post measures
for the entire YANS or any of the sub-factors. There was a significant main effect of test
administration with attitudes for the entire YANS (p=0.004) and Factor One or Youth
Culture (p<0.01) being significantly less pro-noise after the HCP. The main effect of test
administration for the entire YANs and Factor One had an effect size of 0.07 and 0.13,
respectively. Therefore, the students overall attitudes towards noise and attitudes of
youth culture towards noise explained variances of 7% and 13%, respectively. These
effect sizes for eta squared exceed or are close to a moderate effect size of 0.09. The
magnitude of the effect size that is greater than a small effect size of 0.01 and is greater
than or equal to a moderate effect size (0.09); specifically on differences between pre
and post HCP surveys support a practical significance due to the program being easily
feasible, inexpensive, and can affect a large number of individuals (Osteen & Bright,
2010). There were no statistically significant main effects of test administration for the
remaining factors: Factor Two (Concentration in Noise; p=0.533, effect size=0), Factor
Three (Daily Noises; p=0.835, effect size=0), and Factor Four (Intent to Influence;
p=0.071, effect size=.0). All other main effects of gender for all ANOVAs were not
significant (P> 0.05). Effect sizes for the main effect of gender were the following: entire
YANS (0), Factor One (0), Factor Two (0), Factor Three (.03), and Factor Four (0).
Five ANOVA with repeated measures procedures (analysis of entire YANS and 4
Sub-factors) were also used to examine any possible differences in attitudes before and
after the HCP looking at race/ethnicity variable. The statistical model was also 112
participants in three race/ethnic groups (Caucasians, African Americans, and Hispanics)
by two test administrations (Pre and Post Measures). Table 3-13 displays the F-ratio

59
and level of significance for gender and race/ethnicity for all of factors of YANS. There
were no significant interactions of race by test administration for the entire YANS,
Factor One, Factor Two, Factor Three analysis. However, there was a significant
interaction (p=0.035, effect size= .06) of race and Factor Four or Intent to Influence the
Sound Environment with Hispanics being significantly less likely than African American
and Caucasians to aspire to influence their sound environment. The effect size of this
interaction is higher than the minimum effect size of 0.01.There was a significant main
effect of test administration with attitudes for the entire YANS (p=0.004, effect
size=0.07) and Factor One or Youth Culture (p<0.01, effect size= 0.13) being
participants being less pro-noise after the HCP. There were no other significant main
effects of test administration for the Factor 2, Factor 3, and Factor 4 with effect size less
than 0.03. All other main effects of race/ethnicity for all ANOVAs were not significant
(P> 0.05). Effect sizes for the main effect of race/ethnicity were the following: entire
YANS (0.01), Factor One (0.01), Factor Two (0.04), Factor Three (0), and Factor Four
(0.06).
Another group of participants were placed in a control group (N=37) to evaluate
the efficacy of the HCP. The control group received the second/post-test measure
commensurate with the time span of the experimental group. Table 3-14 displays the
pre and post test means, standard deviations, F ratio, and significance levels for the
Entire YANS, Factor One or Youth Culture, Factor Two or Concentration in Noise,
Factor Three or Daily Noise, and Factor Four or Intent to Influence for the control and
experimental groups. Five ANOVA with repeated measures were used to evaluate any
differences in pre and post measures among the sexes. The statistical model was 37

60
participants in 2 genders (males and females) by two test administrations (Pre and Post
test Measures). There were no statistically significant gender and test administration
interactions. Also, there were no significant main effects (p> 0.05) of test administration.
The effect size for the main effect of test administration for the control group was the
following: entire YANS=0.03, Factor One=0.01, Factor Two=0.07, Factor Three=0, and
Factor Four =0.03. There were no significant main effects of gender on any measures
for the YANS: Entire YANS (p=0.290, effect size=0), Factor One (p=0.623, effect
size=0), Factor Two (p=0.127, effect size=0), Factor Three (p=0.885, effect size=0.03),
and Factor Four (p=0.338, effect size=0.01). Five ANOVA with repeated measures
analyses were used to examine differences in pre and post test measures among three
race/ethnic groups. The statistical model was 37 participants in three race/ethnic groups
(Caucasians, African Americans, and Hispanics) by two test administrations (Pre and
Post Measures). Table 3-15 shows the F-score and level of significance for Gender
and Race for all of factors of YANS. There were no significant interactions or main
effects of test administration or race/ethnicity for the entire YANS and sub-factors (p>
0.05). The effect sizes for the main effect of race ethnicity were the following: entire
YANS (.03), Factor One (0.04), Factor Two (0), Factor Three (0.02), and Factor Four
(0.02).
Hearing Conservation Training Effects on Knowledge
Four questions surveyed participants’ opinions on behaviors regarding hearing
protection. The questions included the following: “I wear earplugs or earmuffs whenever
I am around loud sounds” or Question 1, “I know a lot about the types of sound that
cause hearing loss” or Question 2, “I know a lot about how to protect my hearing when
I’m around loud sounds” or Question 3, and “If I go to a loud concert, I will wear hearing

61
protection” or Question 4. Participants showed 1% to 15% improvements in the reported
hearing protective beliefs, knowledge, and efficacy among the participants after
receiving the HCP (Table 3-16).
An ANOVA with repeated measure was also used to evaluate the effectiveness of
the HCP effects on the participants’ knowledge regarding NIHL and hearing protective
behaviors among males and females. The statistical model was 112 participants in two
genders (males and females) by two test administrations (Pre and Post test Measures).
No significant interaction between gender and test administration (F[1,110]=0.294, p=
0.589, effect size=0). There was a significant main effect of test administration
(F[1,110]= 26.373, p<0.01, effect size=0.18) and a practical significance evident, so
there is an improvement in the knowledge regarding hearing protection among the
participants after HCP. There was no significant main effect of gender on the test
administrations (F[1,110]=3.46,p=0.065, effect size=0.03).
Another ANOVA with repeated measure was also used to evaluate the
effectiveness of the HCP effects on the participants’ knowledge regarding NIHL and
hearing protective behaviors among the race/ethic groups. The statistical model was
112 participants in three race/ethnic groups (Caucasians, African Americans, and
Hispanics) by two test administrations (Pre and Post test Measures). No significant
interaction between race and test administration (F[2,109]=0.118, p= 0.889, effect
size=0) was found. There was a significant main effect of test administration (F[2,109]=
26.373, p<0.01, effect size=0.20 ) and a significant main effect of race/ethnicity on the
test administrations (F[2,109]=4.404, p=0.014, effect size= 0.08). These effect sizes
represent a practical significance among these test results. Hence, the Caucasian
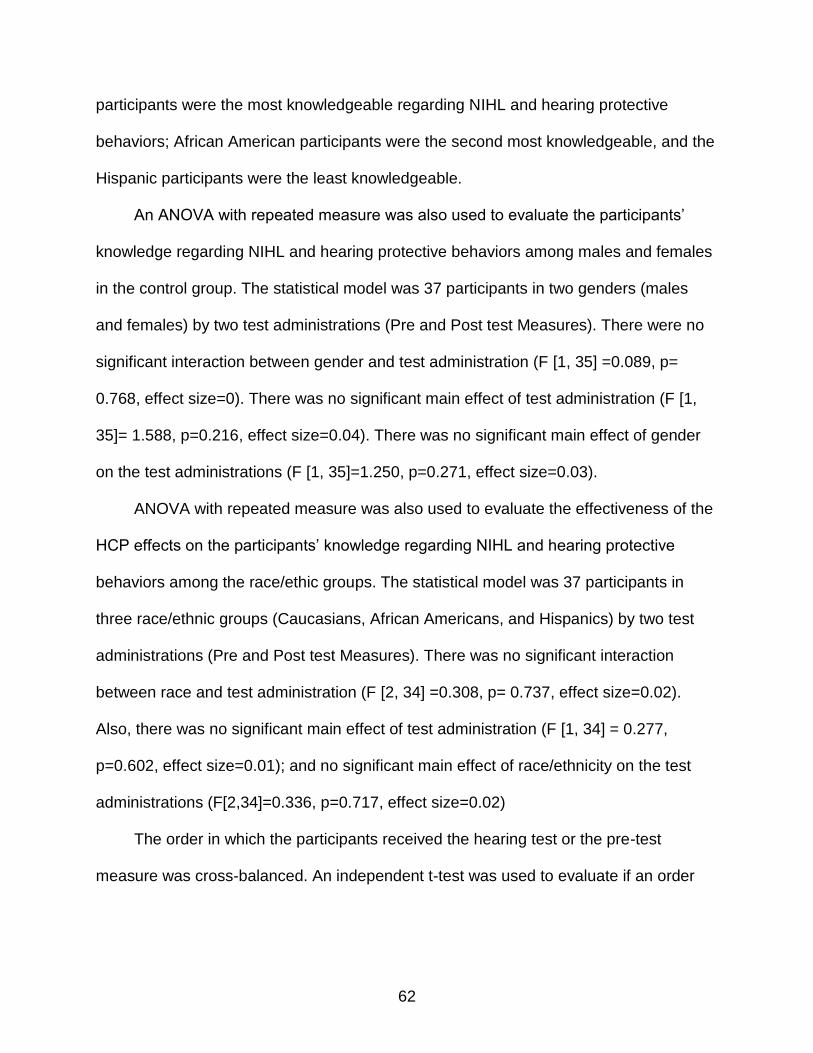
62
participants were the most knowledgeable regarding NIHL and hearing protective
behaviors; African American participants were the second most knowledgeable, and the
Hispanic participants were the least knowledgeable.
An ANOVA with repeated measure was also used to evaluate the participants’
knowledge regarding NIHL and hearing protective behaviors among males and females
in the control group. The statistical model was 37 participants in two genders (males
and females) by two test administrations (Pre and Post test Measures). There were no
significant interaction between gender and test administration (F [1, 35] =0.089, p=
0.768, effect size=0). There was no significant main effect of test administration (F [1,
35]= 1.588, p=0.216, effect size=0.04). There was no significant main effect of gender
on the test administrations (F [1, 35]=1.250, p=0.271, effect size=0.03).
ANOVA with repeated measure was also used to evaluate the effectiveness of the
HCP effects on the participants’ knowledge regarding NIHL and hearing protective
behaviors among the race/ethic groups. The statistical model was 37 participants in
three race/ethnic groups (Caucasians, African Americans, and Hispanics) by two test
administrations (Pre and Post test Measures). There was no significant interaction
between race and test administration (F [2, 34] =0.308, p= 0.737, effect size=0.02).
Also, there was no significant main effect of test administration (F [1, 34] = 0.277,
p=0.602, effect size=0.01); and no significant main effect of race/ethnicity on the test
administrations (F[2,34]=0.336, p=0.717, effect size=0.02)
The order in which the participants received the hearing test or the pre-test
measure was cross-balanced. An independent t-test was used to evaluate if an order

63
effect existed among the participants, which no order effect was seen for the post HCP
results (p=0.113).
Correlations were also measured to evaluate any association between the
attitudes and knowledge measures after receiving a HCP. There were significant
positive associations between the pre and post Entire YANS scores (r=0.692, p<0.01),
and the pre and post knowledge answers (r=0.610, p<0.01). There was a significant
negative association between the YANS and knowledge measures (r=-0.334 / p<0.01)
after receiving a HCP. Therefore, a relationship exists between a participant’s increased
knowledge and reduced positive regard of noise. Table 3-17 shows the correlation table
between the YANS and knowledge measures.
Figure 3-3 displays the participants’ anticipated use of hearing protection within
the next month. Only 9.46% of the participants reported that they would not use hearing
protection within the next month compared to 22.30% that reported that they were not
sure if they would use hearing protection or 68.24% reported that they would use
hearing protection within the next month.
Main Themes of Focus Groups
Two focus groups (n=7) were assembled to evaluate what information was
retained after receiving HCP and their opinions of the intervention program. Several
main factors were discussed in the focus groups that included: (1) knowledge of their
individual susceptibility to NIHL, (2) knowledge of the consequences of NIHL, (3)
knowledge of the protective hearing behaviors and efficacy to perform these behaviors,
and (4) their opinion of the positive and negative aspects of the HCP. All of the
participants reported knowing that loud sounds were dangerous for one’s hearing, and if

64
one repeatedly exposed themselves to loud sounds he or she would not be able to hear
normally in the future.
Prior to participating in the research study, the participants reported that they knew
a limited amount of the information presented in the HCP ahead of time, mainly learned
from their teachers in school or parental guidance. One participant learned about NIHL
at his or her doctor’s office. However, the majority reported that they learned about the
dangers of NIHL due to the intervention program. The participants were already aware
of the several sources of hazardous sounds, including traffic, motorcycles, lawnmowers,
fireworks/firecrackers, motor bikes, airplanes, space shuttles, and football games. The
participants further reported their individual susceptibility to hazardous sound sources
present in school, which included the cafeteria, classrooms (due to noisy students), the
music room, physical education classes, and/or doors are being slammed around the
school campus. The participants reported enjoying certain loud activities, such as going
to the park, attending music concerts, playing basketball, playing with their friends,
attending sporting events, and listening to music. As a result, the participants reported
that they became aware of their own IPod volumes and the potential that listening at
higher levels can decrease their hearing. All the focus groups participants learned from
the HCP that the level which is considered dangerous is at 85 dB A.
The participants identified the consequences to loud sounds to include hearing
loss and ringing in their ears. Further, one participant reported that any person of any
age could have hearing loss, including babies. The participants agreed that children
their same age could easily get hearing loss, and that they knew a friend with a hearing
aid. Another participant noted that once you lose your hearing, you lost it, and it won’t
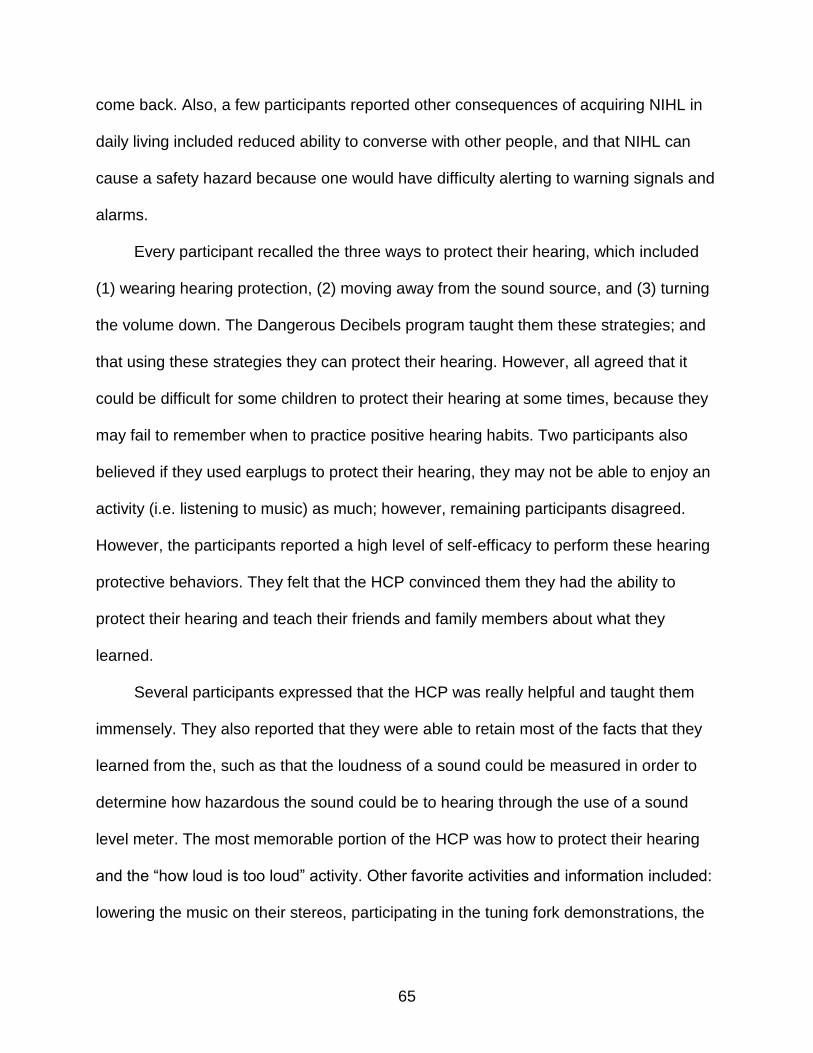
65
come back. Also, a few participants reported other consequences of acquiring NIHL in
daily living included reduced ability to converse with other people, and that NIHL can
cause a safety hazard because one would have difficulty alerting to warning signals and
alarms.
Every participant recalled the three ways to protect their hearing, which included
(1) wearing hearing protection, (2) moving away from the sound source, and (3) turning
the volume down. The Dangerous Decibels program taught them these strategies; and
that using these strategies they can protect their hearing. However, all agreed that it
could be difficult for some children to protect their hearing at some times, because they
may fail to remember when to practice positive hearing habits. Two participants also
believed if they used earplugs to protect their hearing, they may not be able to enjoy an
activity (i.e. listening to music) as much; however, remaining participants disagreed.
However, the participants reported a high level of self-efficacy to perform these hearing
protective behaviors. They felt that the HCP convinced them they had the ability to
protect their hearing and teach their friends and family members about what they
learned.
Several participants expressed that the HCP was really helpful and taught them
immensely. They also reported that they were able to retain most of the facts that they
learned from the, such as that the loudness of a sound could be measured in order to
determine how hazardous the sound could be to hearing through the use of a sound
level meter. The most memorable portion of the HCP was how to protect their hearing
and the “how loud is too loud” activity. Other favorite activities and information included:
lowering the music on their stereos, participating in the tuning fork demonstrations, the

66
“dangerous number” of 85 dB A, walking away from loud sounds, and turning down
sound sources. The least effective information provided was the information regarding
the auditory system. The participants further reported that they would have liked fewer
survey questions and more hands-on activities and group interaction, and to learn about
what kind of physical side effects occurred after obtaining hearing loss. The focus
groups also stated they would have liked more information concerning the life of those
living with hearing loss. For instance, to receive a real world account from those living
with hearing loss on their usage of lip-reading and social compensation strategies to
interact with others on a daily basis. Otherwise, the participants really liked the program.
One emergent theme not asked, yet was brought up by the participants was the
importance of completing the audiometric screening. Reportedly, hearing and eye
exams are given annually to the focus group participants. They further discussed that
hearing tests can be very scary for some children, especially younger ones. One
participant expressed being nervous and scared during the hearing test because she
was worried about having hearing loss due to her previous hearing behaviors.
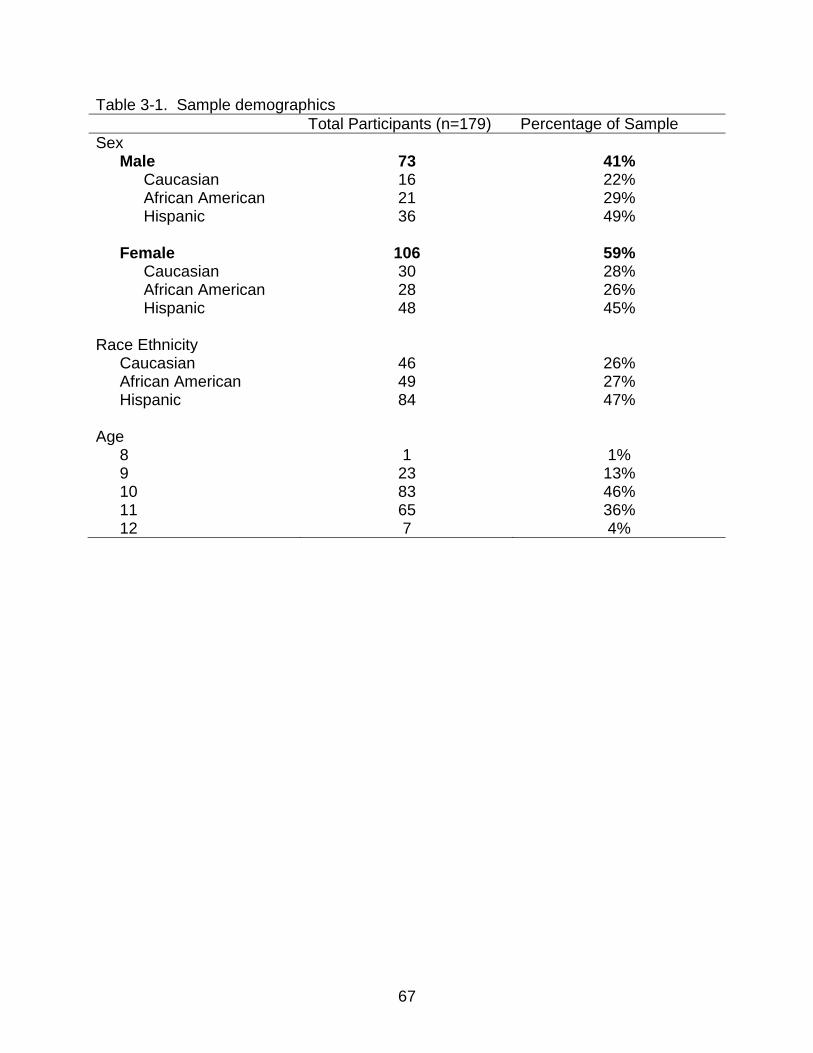
67
Table 3-1. Sample demographics
Total Participants (n=179) Percentage of Sample
Sex Male 73 41%
Caucasian 16 22% African American 21 29% Hispanic 36 49%
Female 106 59% Caucasian 30 28% African American 28 26% Hispanic 48 45%
Race Ethnicity Caucasian 46 26% African American 49 27% Hispanic 84 47%
Age 8 1 1% 9 23 13% 10 83 46% 11 65 36% 12 7 4%

68
Table 3-2. Count and Prevalence of Hearing Screening Failure of Study Participants that either passed or failed pure tone screening or tympanometry
Pure tone and Tympanometry(n=179) Passed (P) Failed (P) Total count
Caucasian
Male 14 (7.8%) 2 (1.1%) 16 Female 19 (10.6%) 11 (6.1%) 30
Total 33 (18.4%) 13 (7.2%) 46 African American
Male 16 (8.9%) 5 (2.8%) 21 Female 24 (13.4%) 4 (2.2%) 38
Total 40 (22.3%) 9 (5.0%) 49 Hispanic
Male 25 (13.9%) 11 (6.1%) 36 Female 28 (15.6%) 20 (11.2%) 47
Total 53 (29. 6%) 31 (17.3%) 84 Total Sample
Male 55 (30.7%) 18 (10.0%) 73 Female 71 (39.7%) 35 (19.6%) 106
Total 126 (70.4%) 53 (29.6%) 179

69
Table 3-3. Count and Prevalence of Hearing Screening Failure of Study Participants at any frequency (1-6k Hz) in either ear
Pure tone Screening (n=167) Passed (P) Failed (P) Total count
Caucasian
Male 14 (8.4%) 2 (1.2%) 16 Female 19 (11.4%) 8 (4.7%) 27
Total 33 (19.8%) 10 (5.9%) 43 African American
Male 16 (9.6%) 3 (1.8%) 19 Female 24 (14.4%) 3 (1.8%) 27
Total 40 (24.0%) 6 (3.6%) 46 Hispanic
Male 25 (15.0%) 9 (5.4%) 34 Female 28 (16.7%) 16 (9.6%) 44
Total 53 (31.7%) 25 (15.0%) 78 Total Sample
Male 55 (33.0%) 14 (8.4%) 69 Female 71 (42.5%) 27 (16.1%) 98
Total 126 (75.5%) 41 (24.5%) 167

70
Table 3-4. Count and Prevalence of failed high frequency (3k, 4k, or 6k Hz) in either ear
High Frequencies (n=167) Passed (P) Failed (P) Total count
Caucasian
Male 14 (8.4%) 2 (1.2%) 16 Female 22 (13.1%) 5 (2.9%) 27
Total 36 (21.5%) 7 (4.1%) 43 African American
Male 16 (9.6%) 3 (1.8%) 19 Female 24 (14.3%) 3 (1.8%) 27
Total 40 (23.9%) 6 (3.6%) 46 Hispanic
Male 27 (16.2%) 7 (4.2%) 34 Female 34 (20.3%) 10 (5.9%) 44
Total 61 (36.5%) 17 (10.1%) 78 Total Sample
Male 57 (34.1%) 12 (7.2%) 69 Female 80 (47.9%) 18 (10.8%) 98
Total 137 (82.0%) 30 (18.0%) 167
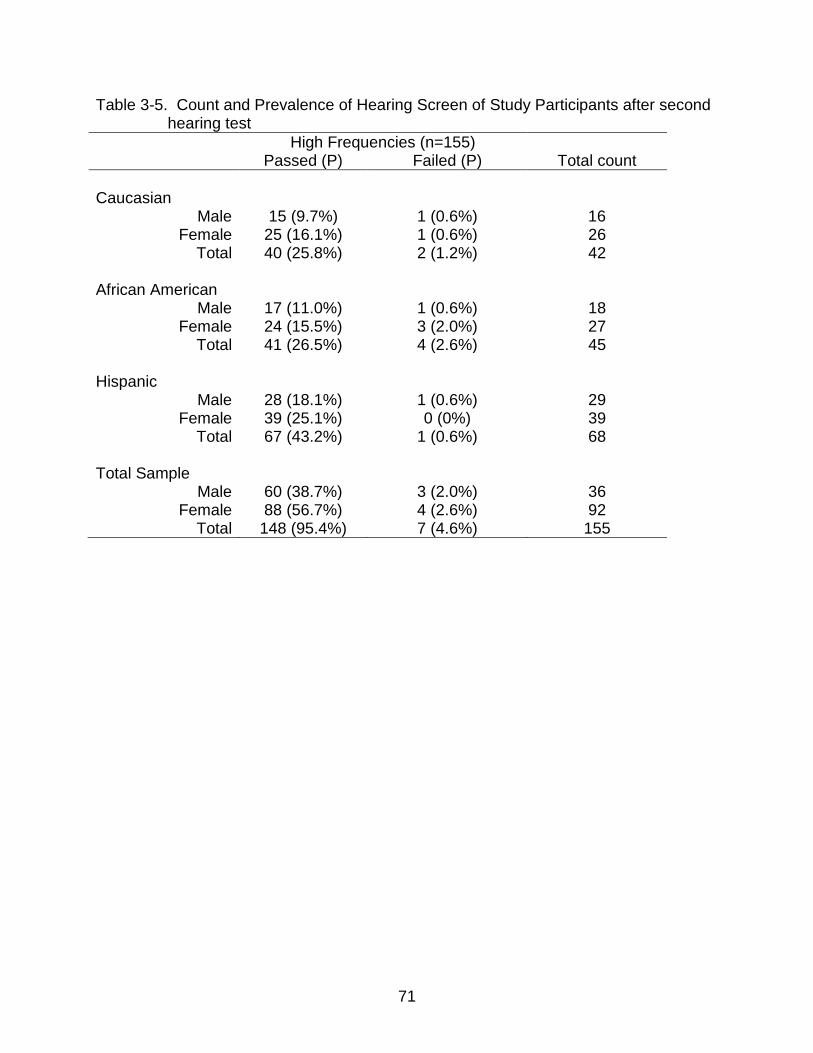
71
Table 3-5. Count and Prevalence of Hearing Screen of Study Participants after second hearing test
High Frequencies (n=155) Passed (P) Failed (P) Total count
Caucasian
Male 15 (9.7%) 1 (0.6%) 16 Female 25 (16.1%) 1 (0.6%) 26
Total 40 (25.8%) 2 (1.2%) 42 African American
Male 17 (11.0%) 1 (0.6%) 18 Female 24 (15.5%) 3 (2.0%) 27
Total 41 (26.5%) 4 (2.6%) 45 Hispanic
Male 28 (18.1%) 1 (0.6%) 29 Female 39 (25.1%) 0 (0%) 39
Total 67 (43.2%) 1 (0.6%) 68 Total Sample
Male 60 (38.7%) 3 (2.0%) 36 Female 88 (56.7%) 4 (2.6%) 92
Total 148 (95.4%) 7 (4.6%) 155
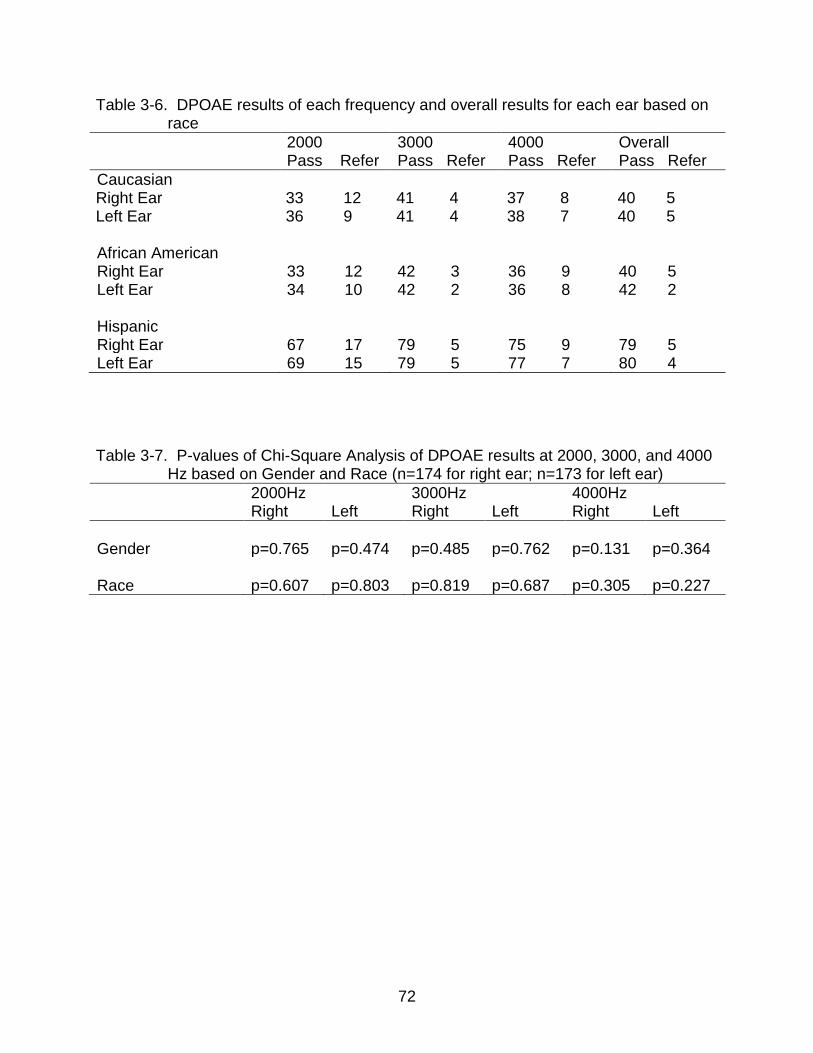
72
Table 3-6. DPOAE results of each frequency and overall results for each ear based on race
2000 Pass Refer
3000 Pass Refer
4000 Pass Refer
Overall Pass Refer
Caucasian Right Ear 33 12 41 4 37 8 40 5 Left Ear 36 9 41 4 38 7 40 5 African American Right Ear 33 12 42 3 36 9 40 5 Left Ear 34 10 42 2 36 8 42 2 Hispanic Right Ear 67 17 79 5 75 9 79 5 Left Ear 69 15 79 5 77 7 80 4
Table 3-7. P-values of Chi-Square Analysis of DPOAE results at 2000, 3000, and 4000 Hz based on Gender and Race (n=174 for right ear; n=173 for left ear)
2000Hz 3000Hz 4000Hz Right Left Right Left Right Left
Gender p=0.765 p=0.474 p=0.485 p=0.762 p=0.131 p=0.364 Race p=0.607 p=0.803 p=0.819 p=0.687 p=0.305 p=0.227
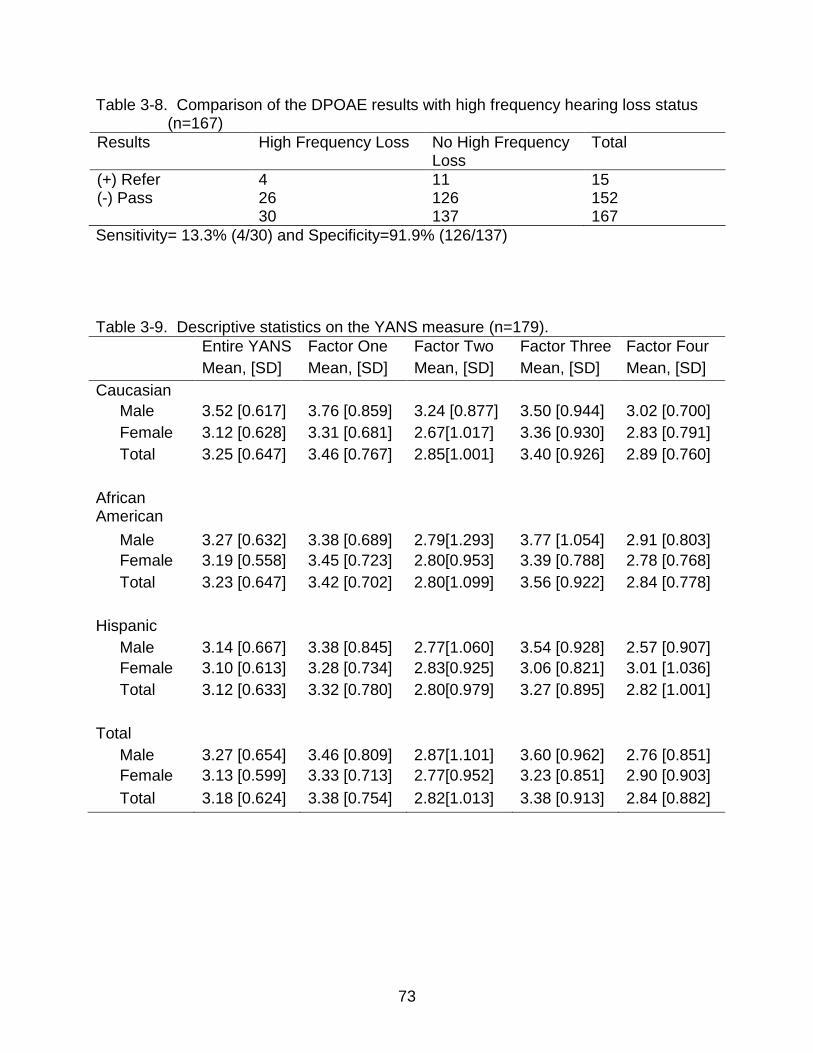
73
Table 3-8. Comparison of the DPOAE results with high frequency hearing loss status (n=167)
Results High Frequency Loss No High Frequency Loss
Total
(+) Refer 4 11 15 (-) Pass 26 126 152 30 137 167
Sensitivity= 13.3% (4/30) and Specificity=91.9% (126/137)
Table 3-9. Descriptive statistics on the YANS measure (n=179).
Entire YANS Factor One Factor Two Factor Three Factor Four
Mean, [SD] Mean, [SD] Mean, [SD] Mean, [SD] Mean, [SD]
Caucasian
Male 3.52 [0.617] 3.76 [0.859] 3.24 [0.877] 3.50 [0.944] 3.02 [0.700]
Female 3.12 [0.628] 3.31 [0.681] 2.67[1.017] 3.36 [0.930] 2.83 [0.791]
Total 3.25 [0.647] 3.46 [0.767] 2.85[1.001] 3.40 [0.926] 2.89 [0.760]
African American
Male 3.27 [0.632] 3.38 [0.689] 2.79[1.293] 3.77 [1.054] 2.91 [0.803]
Female 3.19 [0.558] 3.45 [0.723] 2.80[0.953] 3.39 [0.788] 2.78 [0.768]
Total 3.23 [0.647] 3.42 [0.702] 2.80[1.099] 3.56 [0.922] 2.84 [0.778]
Hispanic
Male 3.14 [0.667] 3.38 [0.845] 2.77[1.060] 3.54 [0.928] 2.57 [0.907]
Female 3.10 [0.613] 3.28 [0.734] 2.83[0.925] 3.06 [0.821] 3.01 [1.036]
Total 3.12 [0.633] 3.32 [0.780] 2.80[0.979] 3.27 [0.895] 2.82 [1.001]
Total
Male 3.27 [0.654] 3.46 [0.809] 2.87[1.101] 3.60 [0.962] 2.76 [0.851]
Female 3.13 [0.599] 3.33 [0.713] 2.77[0.952] 3.23 [0.851] 2.90 [0.903]
Total 3.18 [0.624] 3.38 [0.754] 2.82[1.013] 3.38 [0.913] 2.84 [0.882]
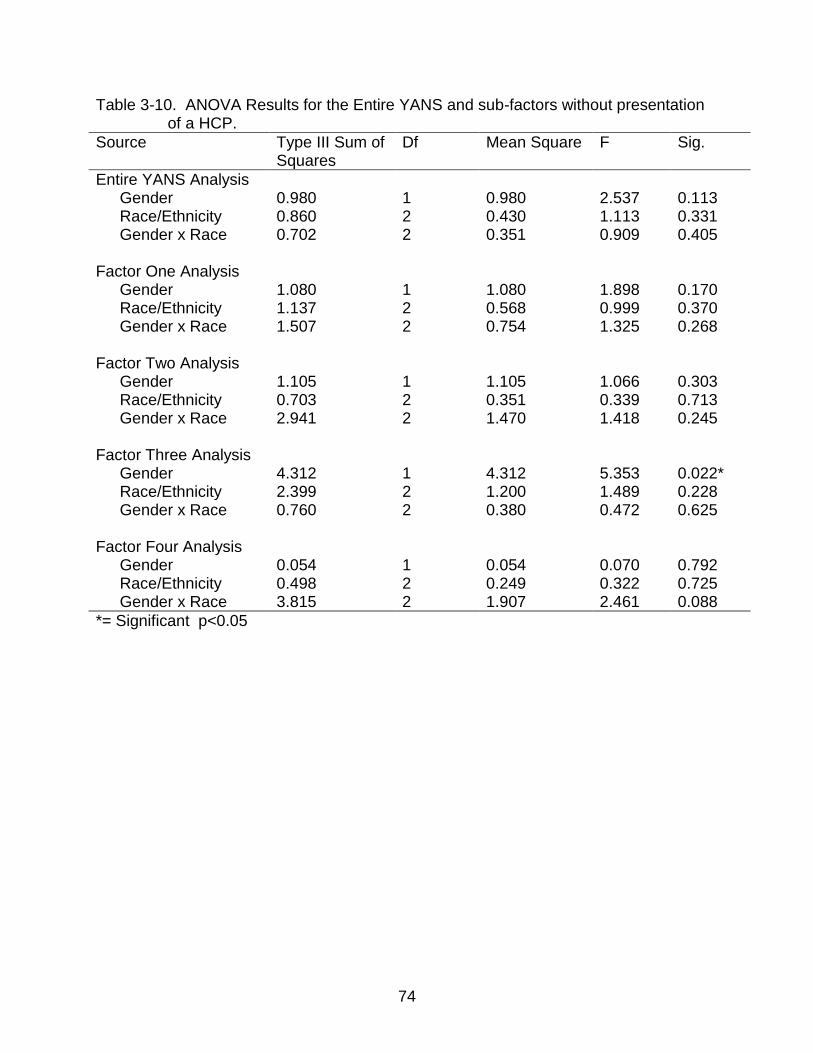
74
Table 3-10. ANOVA Results for the Entire YANS and sub-factors without presentation of a HCP.
Source Type III Sum of Squares
Df Mean Square F Sig.
Entire YANS Analysis Gender 0.980 1 0.980 2.537 0.113 Race/Ethnicity 0.860 2 0.430 1.113 0.331 Gender x Race 0.702 2 0.351 0.909 0.405
Factor One Analysis
Gender 1.080 1 1.080 1.898 0.170 Race/Ethnicity 1.137 2 0.568 0.999 0.370 Gender x Race 1.507 2 0.754 1.325 0.268
Factor Two Analysis
Gender 1.105 1 1.105 1.066 0.303 Race/Ethnicity 0.703 2 0.351 0.339 0.713 Gender x Race 2.941 2 1.470 1.418 0.245
Factor Three Analysis
Gender 4.312 1 4.312 5.353 0.022* Race/Ethnicity 2.399 2 1.200 1.489 0.228 Gender x Race 0.760 2 0.380 0.472 0.625
Factor Four Analysis
Gender 0.054 1 0.054 0.070 0.792 Race/Ethnicity 0.498 2 0.249 0.322 0.725 Gender x Race 3.815 2 1.907 2.461 0.088
*= Significant p<0.05

75
Table 3-11. Percentages of Participants Exposure to Dangerous Sounds in Daily Living
Activity Participation Non-participation
Used a Mp3 Player 84.9% 15.1% Fired a Gun 19% 81% Use a Gas Lawn Mower 22.9% 77.1% Went to a Concert 34.1% 65.9% Played in a Band 8.4% 91.6% Rode a Motorcycle, etc. 27.4% 72.6% Went to a Car Race 17.9% 82.1%
Table 3-12. Experimental Group’s Pre and Post Means and Standard Deviations, F-ratio, and Level of Significance for each Factor
Factors Pre-test Mean, [SD]
Post-test Mean, [SD]
F Significance
Entire YANS 3.19 [0.557] 3.07 [0.589] 8.667 p = 0.004* Factor One 3.37 [0.733] 3.12 [0.815] 16.072 p < 0.001* Factor Two 2.79 [0.872] 2.83 [0.921] 0.391 p = 0.533 Factor Three 3.44 [0.891] 3.43 [0.849] 0.043 P = 0.835 Factor Four 2.87 [0.774] 2.80 [0.728] 3.314 P = 0.071
*= Significant p<0.05
Table 3-13. Repeated Measures Analysis of the Experimental Group’s YANS scores based on Gender and Race
YANS Factors Race Gender
F p-value F p-value Entire YANS 0.865 0.424 0.703 0.404 Factor One 0.265 0.768 0.126 0.723 Factor Two 2.483 0.088 0.162 0.688 Factor Three 1.580 0.211 3.617 0.060 Factor Four 4.314 0.731 0.000 0.994
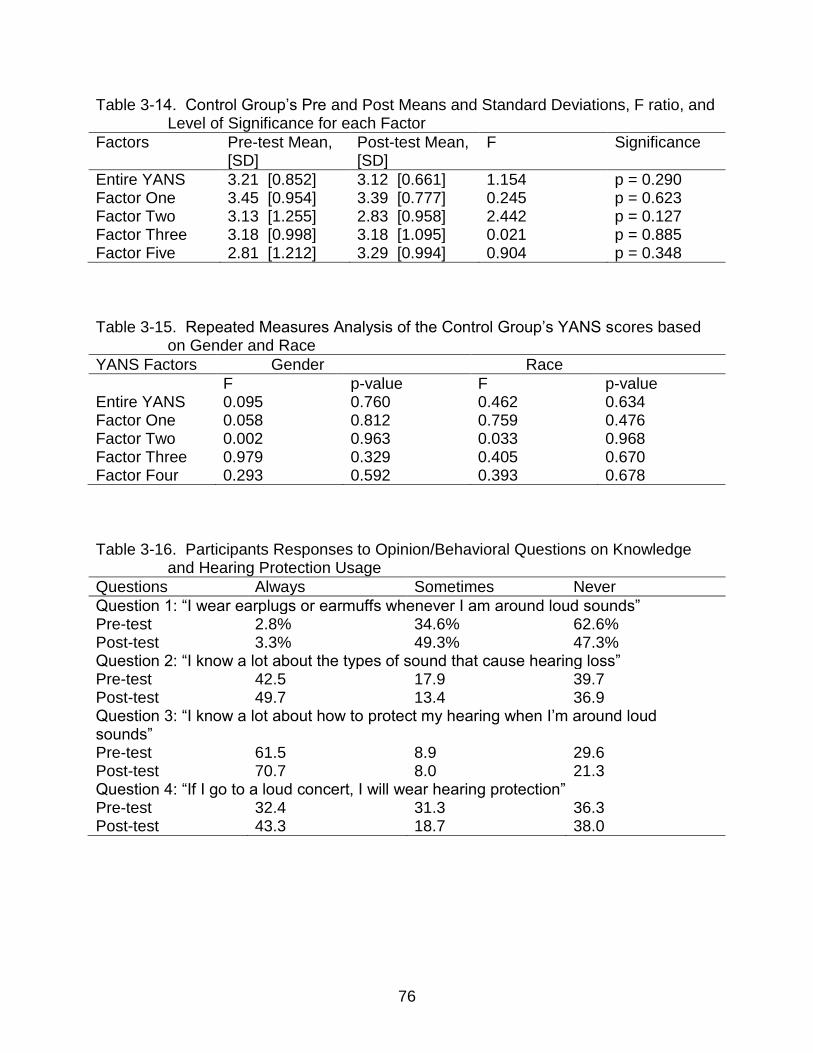
76
Table 3-14. Control Group’s Pre and Post Means and Standard Deviations, F ratio, and Level of Significance for each Factor
Factors Pre-test Mean, [SD]
Post-test Mean, [SD]
F Significance
Entire YANS 3.21 [0.852] 3.12 [0.661] 1.154 p = 0.290 Factor One 3.45 [0.954] 3.39 [0.777] 0.245 p = 0.623 Factor Two 3.13 [1.255] 2.83 [0.958] 2.442 p = 0.127 Factor Three 3.18 [0.998] 3.18 [1.095] 0.021 p = 0.885 Factor Five 2.81 [1.212] 3.29 [0.994] 0.904 p = 0.348
Table 3-15. Repeated Measures Analysis of the Control Group’s YANS scores based
on Gender and Race
YANS Factors Gender Race
F p-value F p-value Entire YANS 0.095 0.760 0.462 0.634 Factor One 0.058 0.812 0.759 0.476 Factor Two 0.002 0.963 0.033 0.968 Factor Three 0.979 0.329 0.405 0.670 Factor Four 0.293 0.592 0.393 0.678
Table 3-16. Participants Responses to Opinion/Behavioral Questions on Knowledge and Hearing Protection Usage
Questions Always Sometimes Never
Question 1: “I wear earplugs or earmuffs whenever I am around loud sounds” Pre-test 2.8% 34.6% 62.6% Post-test 3.3% 49.3% 47.3% Question 2: “I know a lot about the types of sound that cause hearing loss” Pre-test 42.5 17.9 39.7 Post-test 49.7 13.4 36.9 Question 3: “I know a lot about how to protect my hearing when I’m around loud sounds” Pre-test 61.5 8.9 29.6 Post-test 70.7 8.0 21.3 Question 4: “If I go to a loud concert, I will wear hearing protection” Pre-test 32.4 31.3 36.3 Post-test 43.3 18.7 38.0
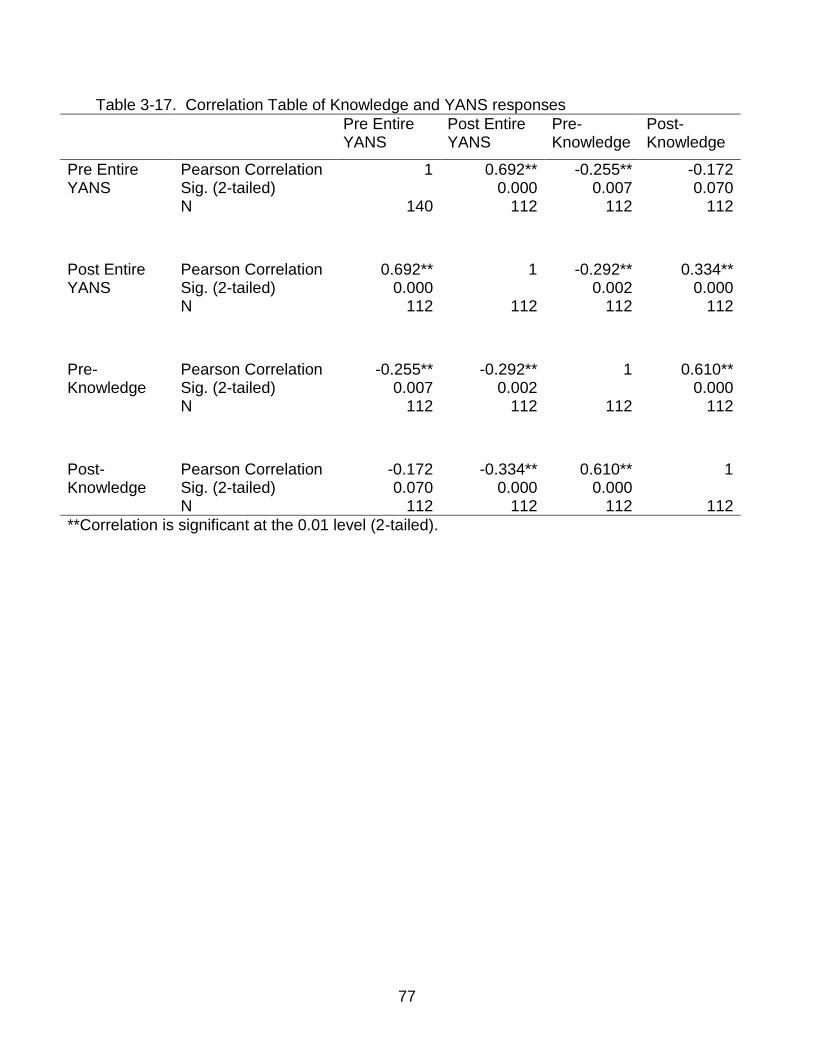
77
Table 3-17. Correlation Table of Knowledge and YANS responses
Pre Entire YANS
Post Entire YANS
Pre-Knowledge
Post-Knowledge
Pre Entire YANS
Pearson Correlation Sig. (2-tailed) N
1
140
0.692** 0.000
112
-0.255** 0.007
112
-0.172 0.070
112
Post Entire YANS
Pearson Correlation Sig. (2-tailed) N
0.692** 0.000
112
1
112
-0.292** 0.002
112
0.334** 0.000
112
Pre-Knowledge
Pearson Correlation Sig. (2-tailed) N
-0.255** 0.007
112
-0.292** 0.002
112
1
112
0.610** 0.000
112
Post-Knowledge
Pearson Correlation Sig. (2-tailed) N
-0.172 0.070
112
-0.334** 0.000
112
0.610** 0.000
112
1
112
**Correlation is significant at the 0.01 level (2-tailed).

78
Figure 3-1. Participants Reported Experience of Tinnitus
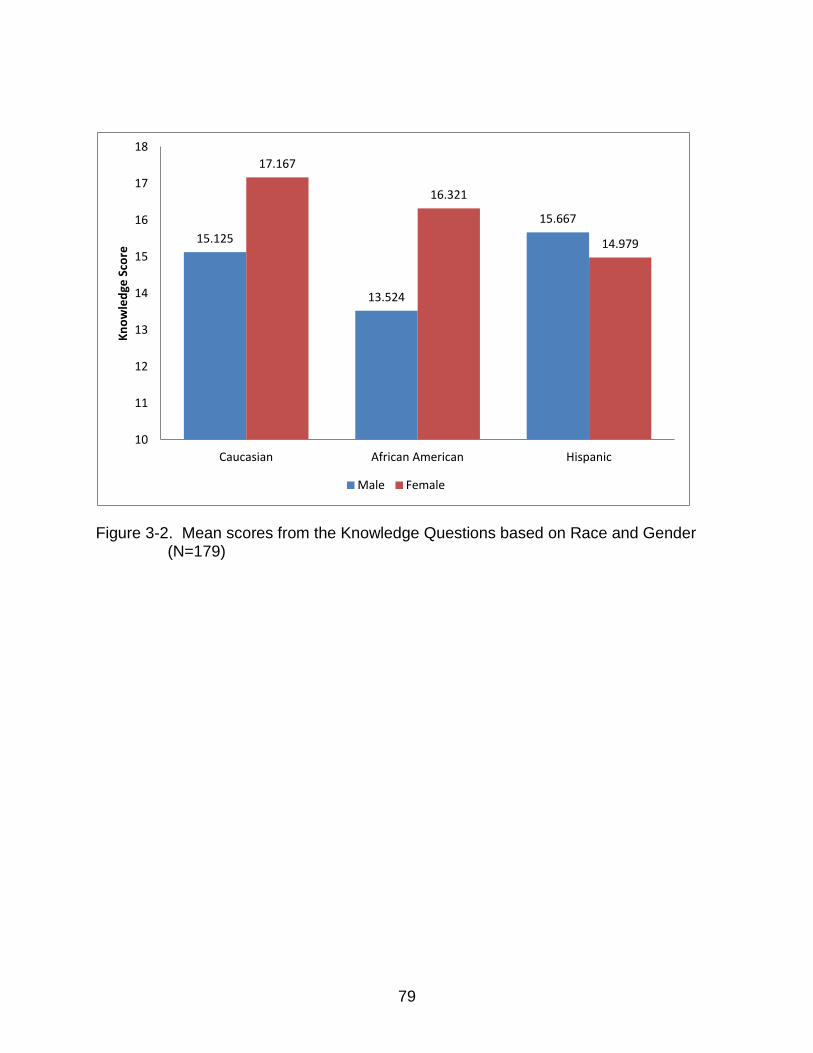
79
Figure 3-2. Mean scores from the Knowledge Questions based on Race and Gender (N=179)
15.125
13.524
15.667
17.167
16.321
14.979
10
11
12
13
14
15
16
17
18
Caucasian African American Hispanic
Kn
ow
led
ge S
core
Male Female

80
Figure 3-3. Participants Anticipated Use of Hearing Protection within the next month

81
CHAPTER 4 DISCUSSION
NIHL is insidious and it can affect all parts of a person’s life. NIHL causes several
poor psycho-social effects, such as loneliness, depression, and overall poor quality of
life. Hearing loss among children can produce reduced academic function and reduced
social competence among peers. Identification of hearing loss is important to provide
timely (re)habilitation services among children to ensure normal and on-level academic
performance.
The nexus of NIHL can be avoided based on positive health behaviors, such as
limiting one’s exposure to high intensity sounds. Hearing health professionals are
charged with the responsibility to provide adequate NIHL prevention services. Adequate
prevention of NIHL involves hearing health professionals identifying and understanding
the risk and prevalence of the problem (NIHL) among the target population (i.e.
children); and implementing of hearing conservation services, such as providing
information regarding use of hearing protective devices (i.e. ear plugs). The current
study sought to gain novel information regarding the prevalence of NIHL among racially
diverse children and determine the efficacy of evidenced based HCP in racially diverse
children. Eventually this information can be implemented into primary prevention
measures.
Prevalence of the Study Population
One-hundred and seventy-nine children between the ages of 8 and 12 years
received an initial hearing screening. From this 1st screening, the prevalence of hearing
loss in at least one ear was 22.9%; and more specifically 16.8% for high frequency
hearing loss. The prevalence rates obtained from this project are consistent with the

82
reported increases of hearing loss and high frequency hearing loss among children
reported by Shargorodsky et al. (2010) study. Shargorodsky compared the data from
the singular testing in the National Health and Nutrition Examination Survey (NHANES)
2005-2006 to the NHANES III (1988-1994) data. Shargorodsky et al. (2010) found a
30% increase in hearing loss. The prevalence of hearing loss increased from 14.9% to
19.5%; and the prevalence of high frequency hearing loss increased from 12.8% to
16.4%. E. Henderson et al. (2011) also completed a similar comparative study of the
data obtained from NHANES III to NHANES 2005-2006. This study excluded
tympanometric data, and found that there was no reliable increase in hearing loss-unlike
the earlier report from the Shargorodsky et al. (2010) study.
Twelve (6.7%) students in the current study failed tympanometry in at least one
ear. Maw, Hall, Pothier, Gregory, and Steer (2011) completed a longitudinal study of
children (n=6569, 8-11 years old) to identify the number of tympanic membrane
abnormalities and related middle ear pathology. Retraction of the tympanic membrane
on the pars tensa (located inferior or lower section of the tympanic membrane) was
seen in 6.1% in at least one ear, which is consistent with the rate found in the current
study. The Niskar et al. (2001)and Shargorodsky et al. (2010) prevalence studies did
not report tympanometric results, yet they reported the study participants reported
history of three ear infections or more and the reported prevalence was 20.8% (n=2928)
or 26.3% (n=1771), respectively(Niskar et al., 2001; Shargorodsky et al., 2010). The
lower prevalence of middle ear pathology seen in the current study is expected in the
older child population compared to young children due to the maturation of the
anatomical structures (i.e.Eustachian tubes).
83
The current study evaluated the hearing status, especially high frequency loss
among the participants. In the prevalence calculations for hearing loss those that failed
tympanometry were excluded. Results of the initial hearing test showed, Hispanic
participants presented with the highest prevalence of high frequency loss equal to
10.1%, Caucasian participants presented with the second highest prevalence of high
frequency loss equal to 4.1%, and African American participants presented with the
lowest prevalence of high frequency loss equal to 3.6%, yet there was no statistically
reliable effect of race/ethnicity. Taken together, the trend in which African American
participants presented with the lowest prevalence of high frequency hearing loss that is
consistent with the results from the Niskar et al. (1998)NHANES analysis which
showed that African Americans had the lowest prevalence of high frequency hearing
loss (11.7%) compared to other racial groups. However, in the Shargorodsky et al.
(2010) study, Hispanic children had the lowest prevalence rate (14.8%) compared to the
other racial groups, African Americans (17.2%) and Caucasian (17.6%). The noted
intrinsic protection (i.e. melanin) from hearing loss for African Americans was not seen
in this project, yet those within the Hispanic culture (due to the darker pigmentation, i.e.
dark brown eyes and olive skin) also have the potential to benefit from similar
protection. The literature has also shown a gender difference in the prevalence of high
frequency hearing loss, which females present with lower prevalence rates (10.1%-
13.4%) compared to males (15.3%-19.4%)(Shargorodsky et al., 2010). However, in the
current study there were no gender differences in the presence of high frequency
hearing loss.

84
Children classified with high frequency hearing loss in the current study were
retested; and the prevalence rate greatly reduced from 16.8% to 4.6%. Therefore, one
can speculate that the previous reported prevalence rates from Niskar et al. (2001) or
Shargorodsky et al. (2010) studies could be an over-estimation of high frequency
hearing loss among children. An article by Schlauch and Carney (2012) examined the
epidemiologic studies of Niskar and Shargorodsky to access the challenge of detecting
minimal hearing loss. They found that there was an over-estimation of minimal hearing
loss (false positives) due to several study limitations, such as only testing the
participants’ hearing once. As a result, the risk of NIHL may actually be much lower than
what was reported in the established literature.
The lower prevalence rate of 4.6% found in the current study is still too high of a
rate among children. Participants and participants’ parents were provided the results of
their audiometric screenings. Prior to the audiometric screenings, none of the
participants expressed any concerns of hearing problems in which a few participants
stated to the investigator that they had normal hearing. However, seven children (4.6%)
presented with high frequency hearing loss after the re-test. A study by Le Prell,
Hensley, Campbell, Hall, and Guire (2011) found a prevalence of hearing loss as low as
7% and as high as 12% (based on the classification/description of hearing loss) among
college students (n=56, mean age=21 years) that self reported as having normal
hearing in both ears. Using the conservative prevalence of 7% would mean that
approximately 4 college students out of the 56 students presented with a hearing loss.
Hence, the final prevalence found in the current study is more consistent with the
conservative prevalence rate reported in the Le Prell et al. (2011) study; however, a

85
prevalence of 4.6% still warrants attention and prevention among children and young
adults.
Pure tone audiometry serves as the “gold standard” for classifying hearing acuity;
on the other hand, pure tone audiometry is sensitive to variability. Sources of this
variability stem from participant’s motivation, test procedure, to the function of the test
equipment (Schlauch & Carney, 2012; Shargorodsky et al., 2010). In the current study,
many of the children that failed the initial audiometric screening can be attributed to
malingering or presenting with a non-organic hearing loss, reduced attention to the task
of the hearing screening, or not understanding how to perform the task of the hearing
screening. Schlauch and Carney (2012) made the following recommendations: (1)
multiple measurements of thresholds, (2) use of insert head-phones, (3) use of 20 or 25
dBHL as the pass-fail criterion, and (4) use of a clinical diagnostic evaluation to improve
detection of hearing loss in large scale audiometric screenings. They promoted
completion of multiple testing of thresholds to ensure reliability of the test results among
participants. The use of insert headphones reduces the risk of collapse of the external
ear canal and/or the possible calibration error at 6000 and 8000 Hz when a TDH style
headphone is calibrated using a NBS-9A coupler (which would make thresholds at the
those higher frequencies approximately 5 dB poorer). In addition, the use of a 20-25
dBHL pass-fail criterion to counter the limited time to obtain thresholds and the reduced
care in obtaining thresholds, because with more time and care yields higher participant
motivation and lower thresholds. Also, Schlauch and Carney (2012) reported the
importance of use of a clinical test method to include air and bone conduction to obtain
more accurate results.

86
Based on these recommendations and the current results, the limitations present
in the Niskar and Shargorodsky epidemiologic studies are evident. For instance in both
studies, participants were only tested once by trained volunteers NOT clinical
audiologists, so the reliability of the thresholds may be poor due to inexperience of the
examiner. In the current investigation, audiometric testing was completed by a licensed
audiologist and two second year Doctor of Audiology (Au.D.) students that assisted in
performing several audiometric screening on the participants under the audiologist’s
supervision. These AuD students had completed two years of clinical training versus the
trained volunteers. Schlauch and Carney advocated for the use insert headphones.
However, in this study TDH 39 headphones were used in the current study due to the
ability to maintain Universal Health Precautions. Further, the effect of collapsed ear
canals shows as an increase in threshold for low frequencies (less than 1000 Hz), which
no low frequencies were tested in the current study.
Distortion Product Otoacoustic emissions (DPOAEs) were used to assess the
otoacoustic emissions of the outer hair cells. DPOAE is a measure of cochlear function
of the outer hair cells. Outer hair cells are highly sensitive to noise exposure and once
these cells are damaged, the result is hearing loss. Pure tone audiometry cannot
measure this damage of the outer hair cells until a approximately 30-50% of these cells
are damaged (Daniel, 2007) and a permanent hearing loss has occurred. This study
found 8.4% children failed DPOAE testing in the right ear, and 6.1% children failed
DPOAE testing in the left ear. Nonetheless, in relation to the audiometric screening the
sensitivity of identifying high frequency hearing loss (prior to retesting) was poor at
13.3%. The specificity of those with normal hearing was great at 91.9%. DPOAE testing
87
is vulnerable to participant artifact and background noise, so the child participant had to
remain entirely still and quiet for at least five minutes, which may be difficult for some
children. Also, background noise can influence DPOAE test results by also creating too
much noise in which the probe is unable to accurately pick up and measure the
otoacoustic emission. This may be the cause of the false positives of the DPOAE
outputs. The sensitivity of DPOAE testing in relation to the retest hearing results was
poor (0%) because all of the students who failed the second hearing screening passed
DPOAE testing. Therefore, the validity of the DPOAEs testing in this study is in
question. The poor sensitivity found in this study may be attributed to the high noise and
patient artifact.
Hence, DPOAE testing may not be an effective test measure to use in a real world
mass screening situation. The GSI Audioscreener+ used in this study to acquire the
DPOAEs from participants was highly sensitive to patient artifact and noise, which
ultimately lead to an extended time period for obtaining results. Thus, it took on average
15 minutes to obtain DPOAE results. When one compares the time it took to obtain
audiometric results to the time it took to obtain DPOAE results, it was much quicker to
obtain the audiometric results (testing took 5-10 minutes to complete). As a result, the
use of pure tone audiometry “gold standard” was optimal compared to obtaining
DPOAEs from participants.
Although tinnitus was not the main focus in the current investigation, 34% of the
study population reported tinnitus. Commonly characterized as a ringing or buzzing in
the ears, tinnitus may occur in one or both ears, and can be perceived as originating
either inside or outside the ear (Axelsson & Ringdahl, 1989). Tinnitus is often one of the
88
first signs of NIHL and its major co-morbid symptom. Tinnitus affects 50 million
individuals or approximately 16% of the United States population (American Tinnitus
Association, 2009). Similarly, results from a Swedish study of 1,285 adolescents
between the ages of 13 and 19, 8.7% reported tinnitus and the symptoms were more
common in the 16 to 19 age group (10.3%) versus the 13 to 15 age group (6.8%)
(Olsen Widen & Erlandsson, 2004).
The 34% prevalence rate of tinnitus reported in the current project may differ from
the reported rates seen in Olsen-Widen and Erlandsson study due to the wording of the
question regarding tinnitus. For instance, the current study’s tinnitus question was:
“During the past year, I have been around loud sounds that made my ears hurt or gave
me ‘ringing’ sounds in my ears” versus “Do you have permanent tinnitus (buzzing or
ringing) in the ears all the time?”. Based on the current study one can speculate that a
participant may have had an episode of tinnitus within a year instead of constant
permanent tinnitus.
Tinnitus may also give an insight on an individual’s susceptibility to NIHL.
Approximately a third of the study population reported tinnitus. In addition, two
participants out of the seven participants classified with high frequency hearing loss
reported tinnitus. This is to be expected due to the reported noise exposures of the
study population. The vast majority of the 179 students reported participation in
hazardous noisy activities, such as use of a Mp3 player (84.9%), attendance at a
concert (34.1%), firing of a gun (19%), riding on a motorcycle (27.4%), and/or use of a
gas lawn mower (22.9%) that may contribute to NIHL without use of hearing protective
behaviors (i.e. use of hearing protection). Even with the reported noise exposures only

89
2.8% reported always using hearing protection or 34.6% sometimes using hearing
protection.
Half of the study population received either the audiometric screening or the
survey first to determine if the process of receiving a hearing test had any effect on a
person’s attitudes. There was no effect of the hearing test on participants’ attitudes. The
initial survey provided an insight on the participants’ attitudes and knowledge towards
noise. The YANS was used to access the populations’ attitudes toward noise.
Participants reported a moderate appreciation of noise with a mean score of 3.21 on a
scale of one to five (which a score of five would equal the highest appreciation of
noise/highly pro-noise). The participants also reported a moderate appreciation for each
sub-factor of YANS (Youth Culture, Concentration in Noise, Daily Noise, and Intent to
Influence). Erlandsson et al. (2008) showed that American young adults were more pro-
noise compared to Swedish young adults. Thus, it could be speculated that Americans
hold higher appreciation of noise.
In addition, the participants (n=179) presented with fair knowledge regarding NIHL
and hearing protection behaviors. The mean score was 15.61 out of the highest
possible score of 23. One study by Crandell et al. (2004) examined differences in
knowledge, behaviors, and attitudes of African American students compared to
Caucasian students. The data revealed that African American students were
consistently less likely to correctly identify symptoms of excessive noise and the risk of
hearing damage, therefore less knowledge compared to their Caucasian counterparts.
In addition, one of the knowledge questions asked if it was true or false that “Hearing
loss is only a problem of elderly people” and 16.8% of the study population answered
90
yes to this question. According to Kochkin (2009) many young individuals believe that
hearing loss is only a concern of elders and that they do not need to worry about
acquiring hearing loss. Thus, a number of children are not aware of the potential
difficulties that may affect their ability to hear and communicate, and their overall quality
of life.
Effects of the Hearing Conservation Program
The evidence-based practice to combat the ill effects of hazardous sound is
through the use of HCPs, which the use of HCPs is effective in increasing the
knowledge and awareness of NIHL among children (Borchgrevink, 2003; Chermak et
al., 1996; Daniel, 2007; Folmer, 2008; Weichbold & Zorowka, 2007). Thus, the results of
the current study indicated that a HCP was effective in reducing positive noise (pro-
noise) attitudes and increasing knowledge among the participants that were randomly
selected into the experimental group. The participants in the control group did not have
a change in their attitudes or an increase in their knowledge regarding NIHL. The Health
Belief Model’s (Rosenstock et al.,1988) constructs of perceived susceptibility, perceived
severity, perceived benefits, and cues to action relate to the study population of
children. First, this population did not perceive themselves at risk for acquiring hearing
loss at a young age believing that hearing loss is only a concern for elderly people.
Second, the children did not perceive the severity of hearing loss and feel that NIHL is
not that serious and can be simply solved by hearing aids. Prior to the HCP, the
participants did not realize that NIHL can affect their academic performance in school
(Kawada, 2004; Tharpe & Sladen, 2003; McFadden & Pittman, 2008, & Tharpe, 2008)
or their interactions with family and friends (Tharpe & Sladen, 2008; & Tharpe & Bess,
1999). Third, the goal of implementation of the HCP would allow participants to
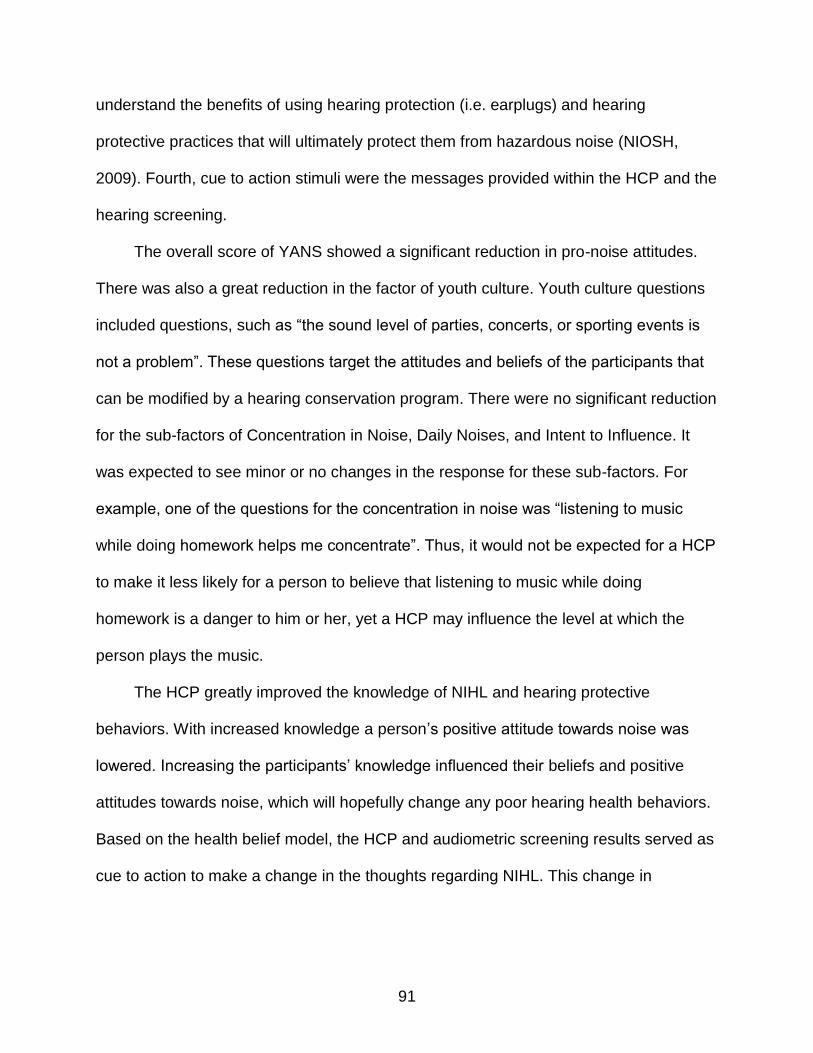
91
understand the benefits of using hearing protection (i.e. earplugs) and hearing
protective practices that will ultimately protect them from hazardous noise (NIOSH,
2009). Fourth, cue to action stimuli were the messages provided within the HCP and the
hearing screening.
The overall score of YANS showed a significant reduction in pro-noise attitudes.
There was also a great reduction in the factor of youth culture. Youth culture questions
included questions, such as “the sound level of parties, concerts, or sporting events is
not a problem”. These questions target the attitudes and beliefs of the participants that
can be modified by a hearing conservation program. There were no significant reduction
for the sub-factors of Concentration in Noise, Daily Noises, and Intent to Influence. It
was expected to see minor or no changes in the response for these sub-factors. For
example, one of the questions for the concentration in noise was “listening to music
while doing homework helps me concentrate”. Thus, it would not be expected for a HCP
to make it less likely for a person to believe that listening to music while doing
homework is a danger to him or her, yet a HCP may influence the level at which the
person plays the music.
The HCP greatly improved the knowledge of NIHL and hearing protective
behaviors. With increased knowledge a person’s positive attitude towards noise was
lowered. Increasing the participants’ knowledge influenced their beliefs and positive
attitudes towards noise, which will hopefully change any poor hearing health behaviors.
Based on the health belief model, the HCP and audiometric screening results served as
cue to action to make a change in the thoughts regarding NIHL. This change in

92
knowledge will affect the perception of susceptibility and severity of the risk of NIHL,
and the participants would appreciate having the benefit of normal hearing.
Influence of Gender and Race
There was an effect of gender on initial YANS sub factor of Daily noises.
Specifically, females scored significantly lower than males on accepting daily loud
sounds. Within the literature females tend to be more conservative and less risky in
actions compared to males (Vogel et al., 2007; Vogel et al., 2009). There were no other
gender effects within the experimental group or the control group. On the initial
knowledge survey, there was a race and gender interaction, so there was a significant
difference between African American males and females. Thus, African American
females were much more knowledgeable than African American males. Also,
Caucasian females were the most knowledgeable among all the other groups; and
African American males were the least knowledgeable of all the other racial groups.
The presence of racial differences in the experimental group’s attitudes was seen
for the sub factor of Intent to Influence the Sound Environment. Caucasians were most
likely to make an effort to change his or her sound environment. African Americans
were also willing to influence a change in their sound environment, but not as much as
Caucasians. Hispanics were significantly less likely to aspire to influence their sound
environment. One can hypothesize that this may be due to the cultural norms of
Hispanics in which they are taught obedience and respect to elders and authority
figures, so these children may be less likely to challenge authority figures (i.e. Parent
listening to loud music) to ensure a safe sound environment (LaVeist, 2005; Rivera &
Rogers-Adkinson, 1997).
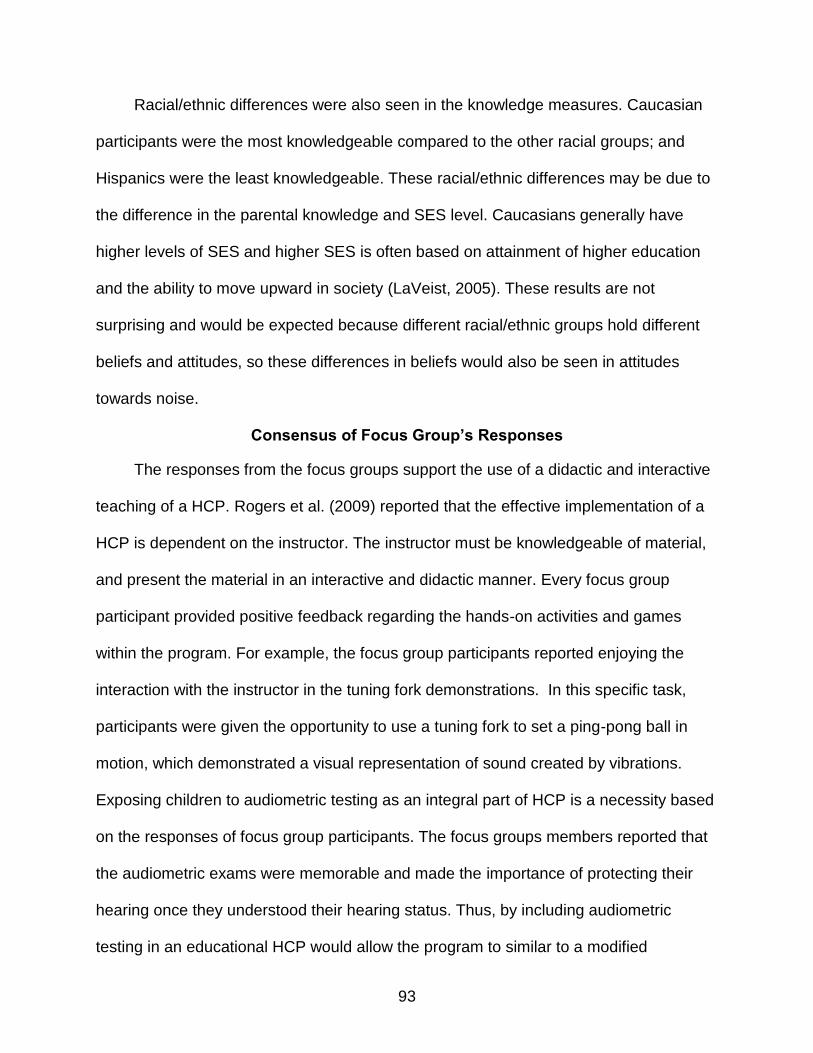
93
Racial/ethnic differences were also seen in the knowledge measures. Caucasian
participants were the most knowledgeable compared to the other racial groups; and
Hispanics were the least knowledgeable. These racial/ethnic differences may be due to
the difference in the parental knowledge and SES level. Caucasians generally have
higher levels of SES and higher SES is often based on attainment of higher education
and the ability to move upward in society (LaVeist, 2005). These results are not
surprising and would be expected because different racial/ethnic groups hold different
beliefs and attitudes, so these differences in beliefs would also be seen in attitudes
towards noise.
Consensus of Focus Group’s Responses
The responses from the focus groups support the use of a didactic and interactive
teaching of a HCP. Rogers et al. (2009) reported that the effective implementation of a
HCP is dependent on the instructor. The instructor must be knowledgeable of material,
and present the material in an interactive and didactic manner. Every focus group
participant provided positive feedback regarding the hands-on activities and games
within the program. For example, the focus group participants reported enjoying the
interaction with the instructor in the tuning fork demonstrations. In this specific task,
participants were given the opportunity to use a tuning fork to set a ping-pong ball in
motion, which demonstrated a visual representation of sound created by vibrations.
Exposing children to audiometric testing as an integral part of HCP is a necessity based
on the responses of focus group participants. The focus groups members reported that
the audiometric exams were memorable and made the importance of protecting their
hearing once they understood their hearing status. Thus, by including audiometric
testing in an educational HCP would allow the program to similar to a modified

94
occupational HCP targeted to children. Also, by implementing audiometric tests allowed
children to relate what they have learned in the HCP to real world consequences of a
potential high frequency hearing loss.
Limitations of the Study
Upon completing this project, several limitations became evident. There were
three major challenges to this study that included (1) accessibility to the study
participants, (2) background noise, (3) consistency of the HCP group interactions, (4)
possible peer interaction between the control and experimental group, (5) student self-
report of race/ethnicity, and (6) possible language issues. First, accessibility to the study
population was dependent on participants being present at school on the scheduled
study days. For instance, several participants had moved away or were absent during
the scheduled study days set aside for retests of audiometric screenings. Thus, the
inability to retest these participants affected the study’s calculated prevalence of high
frequency hearing loss among those first identified as having high frequency hearing
loss. In addition, 29 participants were unable to complete the post-test measure that
affected the total number of participants in each racial group, which may have affected
the statistical analyses for interactions for the variable of race. Another challenge to
accessibility was the various school schedule requirements placed on the children. The
participating schools implemented team/co-teaching in which students were taught by
two teachers in which they would switch between during the course of the day. A typical
school day started at 8:30 am and ended at 3:30pm; and due to schools’ policies,
participants could not be pulled for their audiometric screenings during reading time (90
minutes within the school day), math and/or science classes for fourth and fifth grades

95
(90 minutes within the school day); lunch (30 minutes of the school day); and/or if the
teacher stated that the child could not be pulled at the requested time.
Second, background noise due to the ambient noise, such as the fans of the air-
conditioning units or more commonly due to the extraneous background noise caused
by the other study participants affected the ability for some participants to pass at 1000
Hz. Three to five participants were pulled at once due to accessibility to participants,
and because of the number of participants in the designated testing room, it was difficult
to maintain complete silence from the participants. Third, the consistency of HCP
interactions among participants varied greatly. The same lesson plan was covered for
each HCP group within the experimental group; however, each group was allowed to
interrupt with questions and following the presentation there was an additional five
minutes allocated for questions. Thus, each group presented novel thoughts and
questions which lead to various group interactions that differed from one other.
Fourth, the issue of peer interactions of the control and experimental group
participants may have influence the control’s group responses on the second survey.
Because, participants in both groups had the same lunch period, same physical
education classes, and rode on the same school buses, they had an opportunity to
share and discuss the material covered in the HCP. Therefore, the non-statistically
significant reductions seen in control group could be an outcome of the sharing of
material within a peer group.
Another possible limitation was the researcher was dependent on the participants
self report of race/ethnicity. Some participants may not have been aware of their
race/ethnic background. This may have been a problem for students from multi-cultural

96
families. For example, children with interracial parents may not have a specific ethnic
identity. Several races can represent the Hispanic ethnicity, which may have resulted in
varying cultural differences.
Finally, some of the children had Spanish as their first language. Thus, the
researcher was dependent on the translation of teachers and fellow students for both
the survey and the HCP. Ideally, these both should have been done in their native
language.
Future Aims
A future investigation would be to implement a comparative study to measure the
consistency between the diagnosis of hearing loss using the audiometric methods used
from the Niskar and Shargorodsky studies compared to the suggestions made by
Schlauch and Carney. Schlauch and Carney (2012) suggested recommendations that
included the following: (1) use of a clinical method to obtain threshold (i.e. modified
Hughson Westlake procedure), (2) use of insert headphones versus TDH-style
headphones to reduce potential issues, such as collapse of the external ear canal, (3)
completion of multiple audiometric tests or retesting thresholds (to compensate for
patient reliability), and (4) use of a 20 dBHL as the new pass/fail criterion. With
implementation of these study recommendations would ultimately reduce the number of
false positive diagnoses of high frequency hearing loss seen in children. Thus, a more
accurate account of the risk of high frequency hearing loss could be obtained for this
population.
Another future aim of this study would be make this study into a longitudinal study
in which participants would have the same protocol completed twice, once in middle
school and once in high school. Thus, one may determine if attitudes remain less pro-
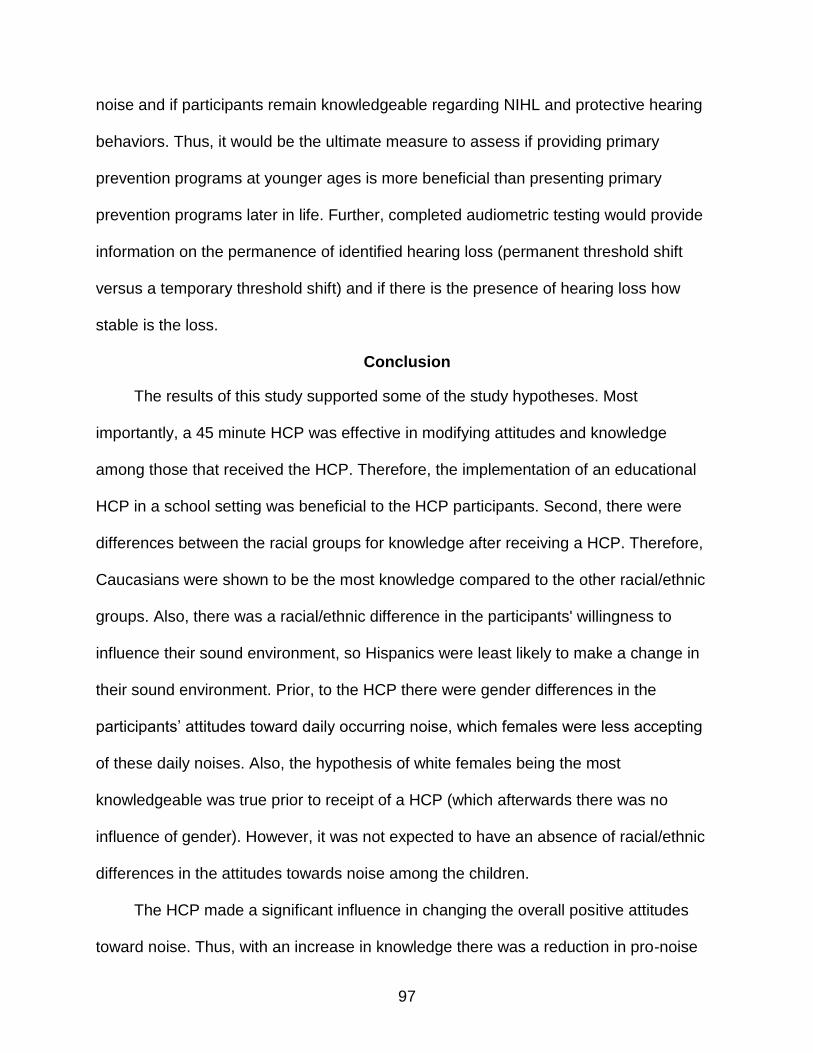
97
noise and if participants remain knowledgeable regarding NIHL and protective hearing
behaviors. Thus, it would be the ultimate measure to assess if providing primary
prevention programs at younger ages is more beneficial than presenting primary
prevention programs later in life. Further, completed audiometric testing would provide
information on the permanence of identified hearing loss (permanent threshold shift
versus a temporary threshold shift) and if there is the presence of hearing loss how
stable is the loss.
Conclusion
The results of this study supported some of the study hypotheses. Most
importantly, a 45 minute HCP was effective in modifying attitudes and knowledge
among those that received the HCP. Therefore, the implementation of an educational
HCP in a school setting was beneficial to the HCP participants. Second, there were
differences between the racial groups for knowledge after receiving a HCP. Therefore,
Caucasians were shown to be the most knowledge compared to the other racial/ethnic
groups. Also, there was a racial/ethnic difference in the participants' willingness to
influence their sound environment, so Hispanics were least likely to make a change in
their sound environment. Prior, to the HCP there were gender differences in the
participants’ attitudes toward daily occurring noise, which females were less accepting
of these daily noises. Also, the hypothesis of white females being the most
knowledgeable was true prior to receipt of a HCP (which afterwards there was no
influence of gender). However, it was not expected to have an absence of racial/ethnic
differences in the attitudes towards noise among the children.
The HCP made a significant influence in changing the overall positive attitudes
toward noise. Thus, with an increase in knowledge there was a reduction in pro-noise

98
attitudes; so the participants learned that noise is hazardous. The information from a
HCP presented in less than an hour was retained more than a month after the HCP was
presented. Thus, implementation of a HCP should receive the same resources that
other education programs (i.e. anti-smoking or anti-drug) within the school systems and
other community institutions (Dell & Holmes, 2012; Folmer, Griest, & Martin, 2002).
Thus, hearing health professional should take up the charge and implement HCP
programs that benefit children regardless of racial/ethnic or gender differences.
.
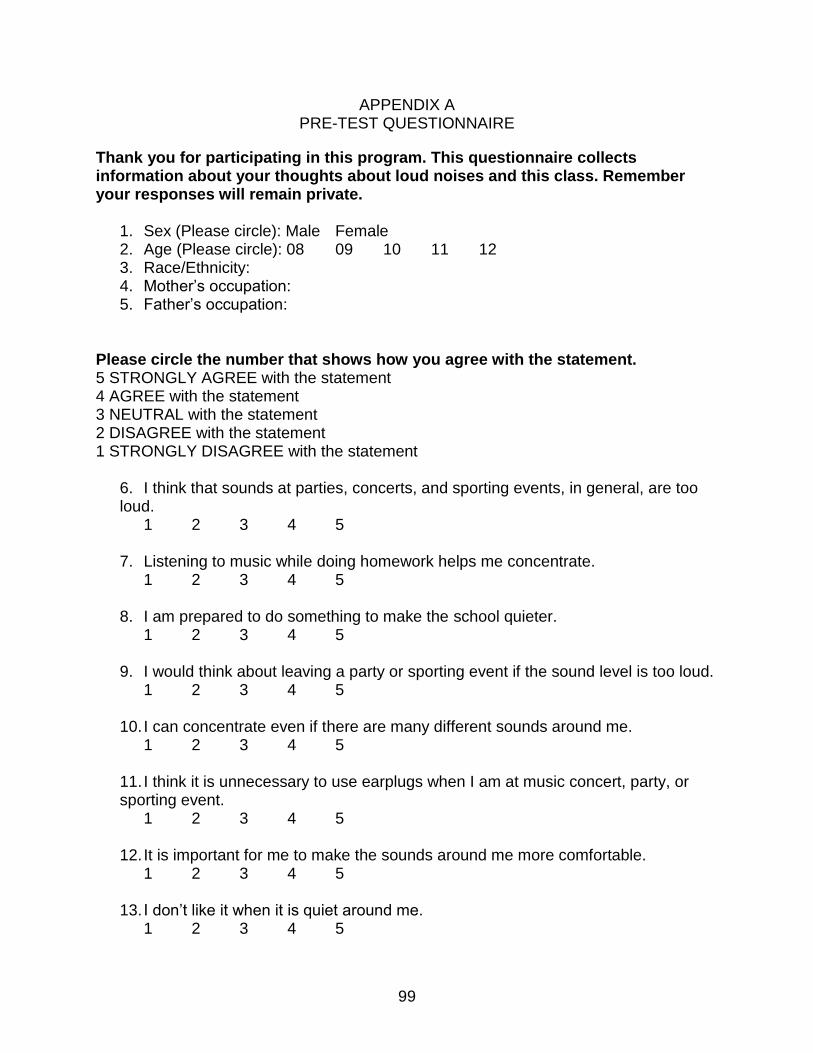
99
APPENDIX A PRE-TEST QUESTIONNAIRE
Thank you for participating in this program. This questionnaire collects information about your thoughts about loud noises and this class. Remember your responses will remain private.
1. Sex (Please circle): Male Female 2. Age (Please circle): 08 09 10 11 12 3. Race/Ethnicity: 4. Mother’s occupation: 5. Father’s occupation:
Please circle the number that shows how you agree with the statement. 5 STRONGLY AGREE with the statement 4 AGREE with the statement 3 NEUTRAL with the statement 2 DISAGREE with the statement 1 STRONGLY DISAGREE with the statement
6. I think that sounds at parties, concerts, and sporting events, in general, are too loud.
1 2 3 4 5
7. Listening to music while doing homework helps me concentrate. 1 2 3 4 5
8. I am prepared to do something to make the school quieter. 1 2 3 4 5
9. I would think about leaving a party or sporting event if the sound level is too loud.
1 2 3 4 5 10. I can concentrate even if there are many different sounds around me.
1 2 3 4 5 11. I think it is unnecessary to use earplugs when I am at music concert, party, or sporting event.
1 2 3 4 5 12. It is important for me to make the sounds around me more comfortable.
1 2 3 4 5 13. I don’t like it when it is quiet around me.
1 2 3 4 5
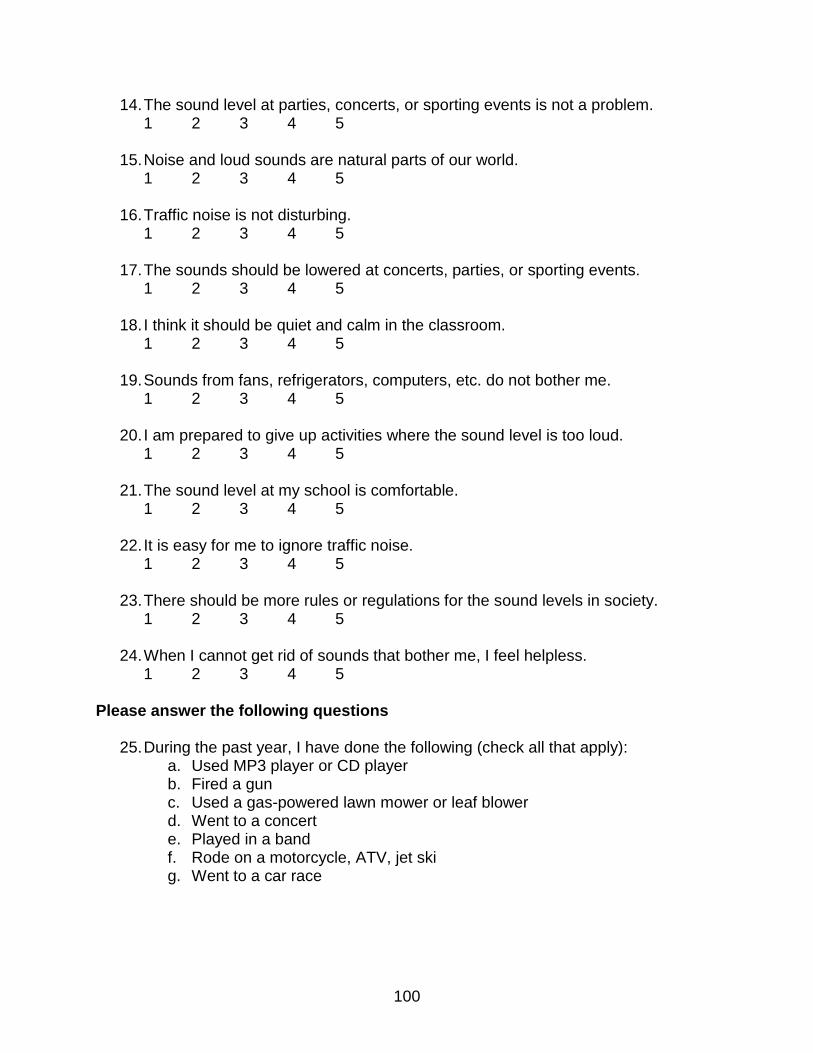
100
14. The sound level at parties, concerts, or sporting events is not a problem. 1 2 3 4 5
15. Noise and loud sounds are natural parts of our world.
1 2 3 4 5 16. Traffic noise is not disturbing.
1 2 3 4 5 17. The sounds should be lowered at concerts, parties, or sporting events.
1 2 3 4 5 18. I think it should be quiet and calm in the classroom.
1 2 3 4 5 19. Sounds from fans, refrigerators, computers, etc. do not bother me.
1 2 3 4 5 20. I am prepared to give up activities where the sound level is too loud.
1 2 3 4 5 21. The sound level at my school is comfortable.
1 2 3 4 5 22. It is easy for me to ignore traffic noise.
1 2 3 4 5 23. There should be more rules or regulations for the sound levels in society.
1 2 3 4 5 24. When I cannot get rid of sounds that bother me, I feel helpless.
1 2 3 4 5
Please answer the following questions
25. During the past year, I have done the following (check all that apply): a. Used MP3 player or CD player b. Fired a gun c. Used a gas-powered lawn mower or leaf blower d. Went to a concert e. Played in a band f. Rode on a motorcycle, ATV, jet ski g. Went to a car race
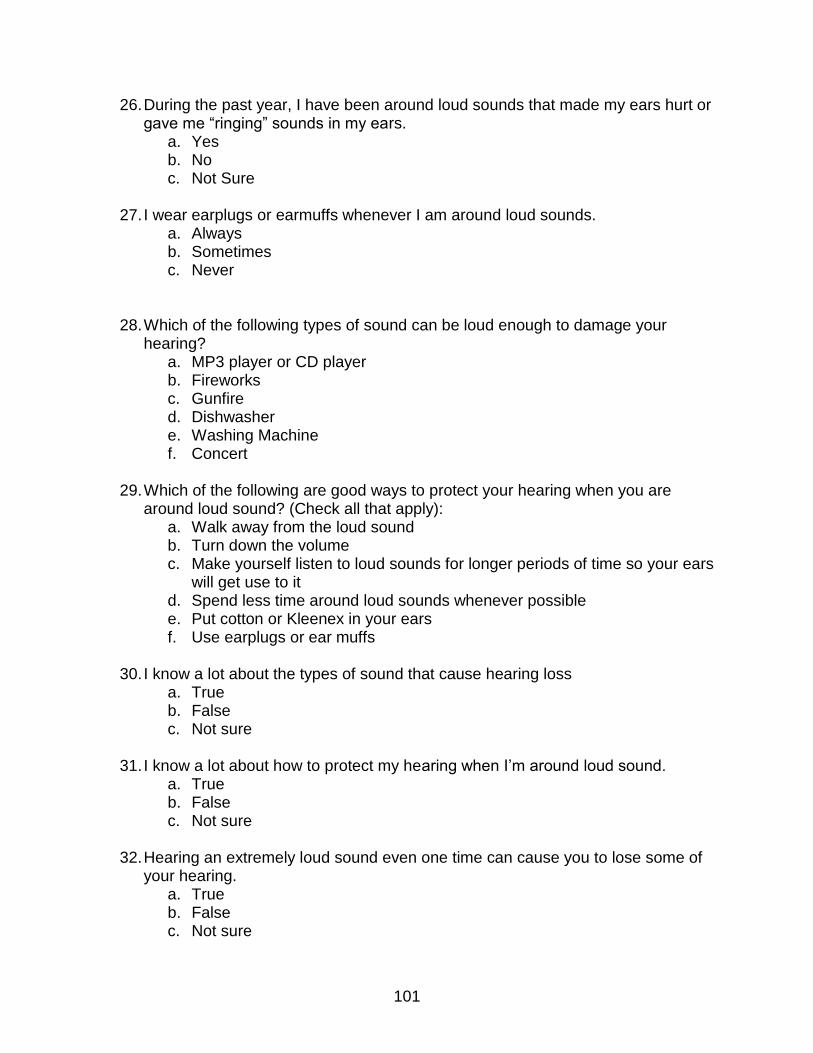
101
26. During the past year, I have been around loud sounds that made my ears hurt or gave me “ringing” sounds in my ears.
a. Yes b. No c. Not Sure
27. I wear earplugs or earmuffs whenever I am around loud sounds.
a. Always b. Sometimes c. Never
28. Which of the following types of sound can be loud enough to damage your hearing?
a. MP3 player or CD player b. Fireworks c. Gunfire d. Dishwasher e. Washing Machine f. Concert
29. Which of the following are good ways to protect your hearing when you are
around loud sound? (Check all that apply): a. Walk away from the loud sound b. Turn down the volume c. Make yourself listen to loud sounds for longer periods of time so your ears
will get use to it d. Spend less time around loud sounds whenever possible e. Put cotton or Kleenex in your ears f. Use earplugs or ear muffs
30. I know a lot about the types of sound that cause hearing loss
a. True b. False c. Not sure
31. I know a lot about how to protect my hearing when I’m around loud sound.
a. True b. False c. Not sure
32. Hearing an extremely loud sound even one time can cause you to lose some of
your hearing. a. True b. False c. Not sure

102
33. Sound that is too loud can damage tiny hair cells of the inner ear.
a. True b. False c. Not sure
34. Hearing loss is only a problem for elderly people.
a. True b. False c. Not sure
35. People with hearing loss often have problems with the following (check all that
apply): a. Hearing alarms, the doorbell, or the telephone ringing b. Understanding road signs c. Understanding what is said in a group d. Getting to work e. Understanding what is said at movies, plays or on TV f. Understanding what is said in class
36. Having hearing loss is not a big deal
a. Agree b. Disagree c. Not sure
37. Kids who listen to loud music all the time don’t seem to have a hearing loss, so I
don’t have to worry about getting hearing loss. a. Agree b. Disagree c. Not Sure
38. If I go to a loud concert, I will wear hearing protection.
a. Yes b. No c. Not Sure

103
APPENDIX B POST-TEST QUESTIONNAIRE
Thank you for participating in this program. This questionnaire collects information about your thoughts about loud noises and this class. Remember your responses will remain private.
6. Sex (Please circle): Male Female 7. Age (Please circle): 08 09 10 11 12 8. Race/Ethnicity: 9. Mother’s occupation: 10. Father’s occupation:
Please circle the number that shows how you agree with the statement. 5 STRONGLY AGREE with the statement 4 AGREE with the statement 3 NEUTRAL with the statement 2 DISAGREE with the statement 1 STRONGLY DISAGREE with the statement
6. I think that sounds at parties, concerts, and sporting events, in general, are too loud.
1 2 3 4 5
7. Listening to music while doing homework helps me concentrate. 1 2 3 4 5
8. I am prepared to do something to make the school quieter. 1 2 3 4 5
9. I would think about leaving a party or sporting event if the sound level is too loud.
1 2 3 4 5 10. I can concentrate even if there are many different sounds around me.
1 2 3 4 5 11. I think it is unnecessary to use earplugs when I am at music concert, party, or sporting event.
1 2 3 4 5 12. It is important for me to make the sounds around me more comfortable.
1 2 3 4 5 13. I don’t like it when it is quiet around me.
1 2 3 4 5
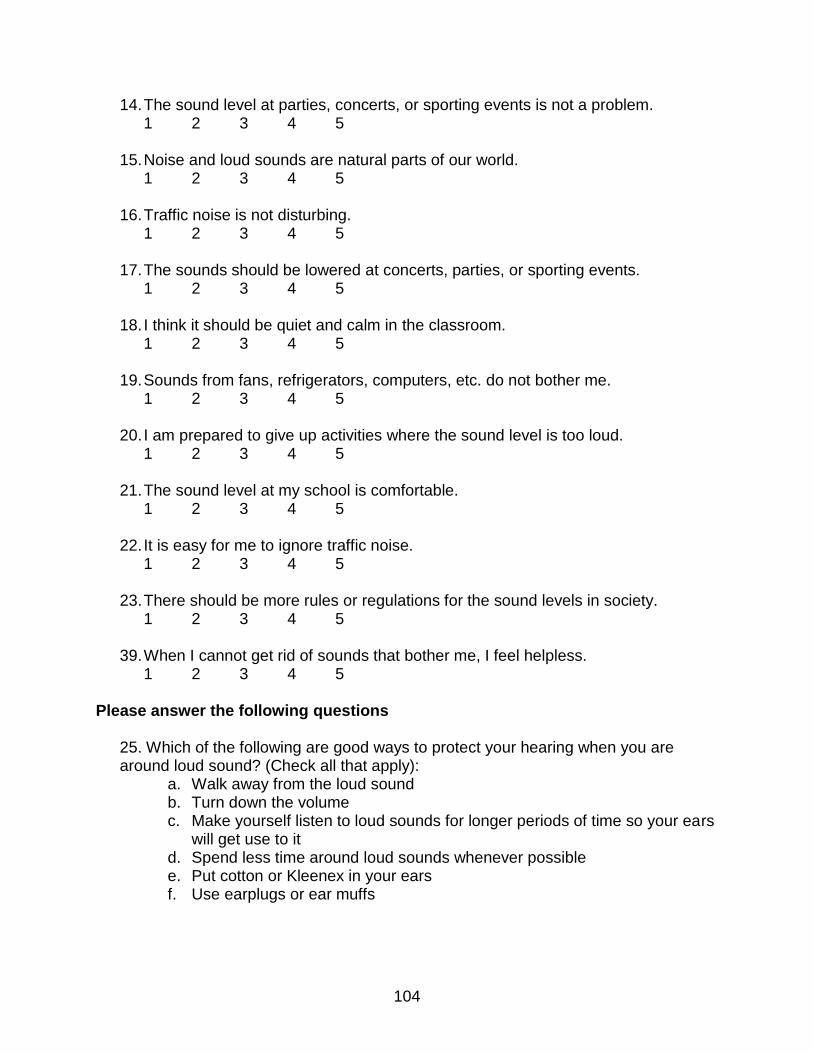
104
14. The sound level at parties, concerts, or sporting events is not a problem. 1 2 3 4 5
15. Noise and loud sounds are natural parts of our world.
1 2 3 4 5 16. Traffic noise is not disturbing.
1 2 3 4 5 17. The sounds should be lowered at concerts, parties, or sporting events.
1 2 3 4 5 18. I think it should be quiet and calm in the classroom.
1 2 3 4 5 19. Sounds from fans, refrigerators, computers, etc. do not bother me.
1 2 3 4 5 20. I am prepared to give up activities where the sound level is too loud.
1 2 3 4 5 21. The sound level at my school is comfortable.
1 2 3 4 5 22. It is easy for me to ignore traffic noise.
1 2 3 4 5 23. There should be more rules or regulations for the sound levels in society.
1 2 3 4 5 39. When I cannot get rid of sounds that bother me, I feel helpless.
1 2 3 4 5
Please answer the following questions
25. Which of the following are good ways to protect your hearing when you are around loud sound? (Check all that apply):
a. Walk away from the loud sound b. Turn down the volume c. Make yourself listen to loud sounds for longer periods of time so your ears
will get use to it d. Spend less time around loud sounds whenever possible e. Put cotton or Kleenex in your ears f. Use earplugs or ear muffs

105
26. Hearing loss is only a problem for elderly people. g. True h. False i. Not sure
27. I wear earplugs or earmuffs whenever I am around loud sounds.
a. Always b. Sometimes c. Never
28. I know a lot about the types of sound that cause hearing loss a. True b. False c. Not sure
29. Which of the following types of sound can be loud enough to damage your
hearing? a. MP3 player or CD player b. Fireworks c. Gunfire d. Dishwasher e. Washing Machine f. Concert
30. I know a lot about how to protect my hearing when I’m around loud sound. a. True b. False c. Not sure
31. Hearing an extremely loud sound even one time can cause you to lose some
of your hearing. a. True b. False c. Not sure
32. Sound that is too loud can damage tiny hair cells of the inner ear.
a. True b. False c. Not sure
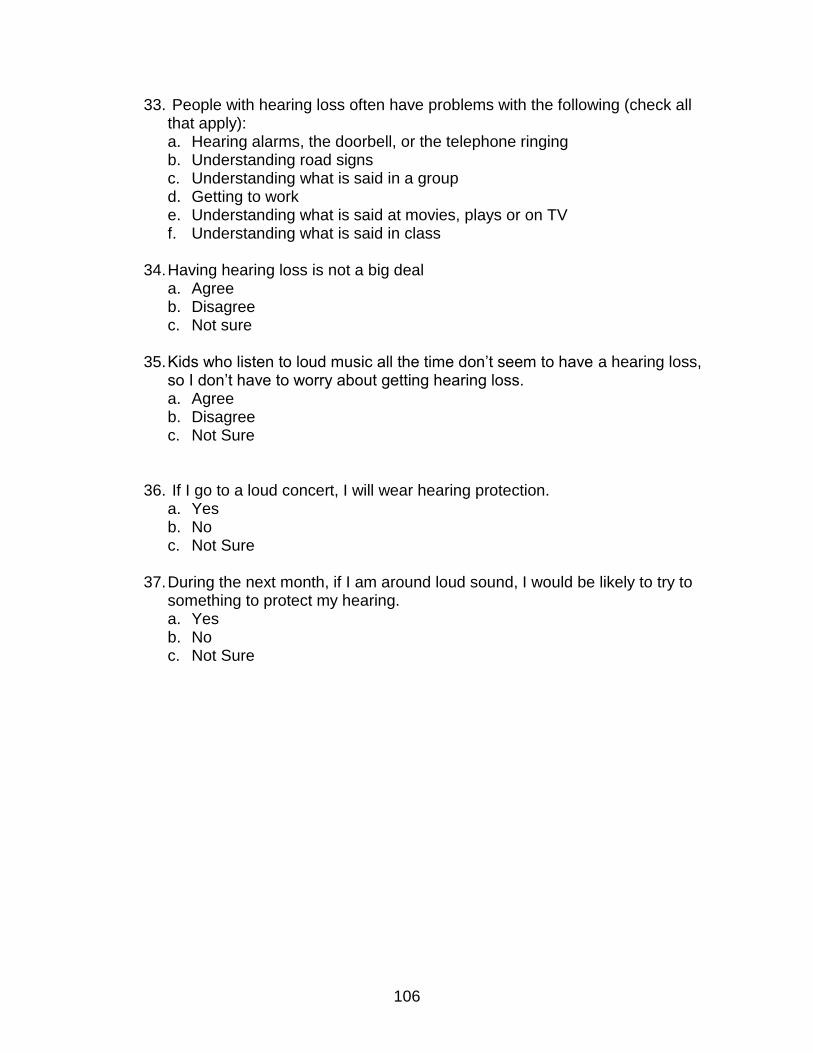
106
33. People with hearing loss often have problems with the following (check all that apply): a. Hearing alarms, the doorbell, or the telephone ringing b. Understanding road signs c. Understanding what is said in a group d. Getting to work e. Understanding what is said at movies, plays or on TV f. Understanding what is said in class
34. Having hearing loss is not a big deal
a. Agree b. Disagree c. Not sure
35. Kids who listen to loud music all the time don’t seem to have a hearing loss,
so I don’t have to worry about getting hearing loss. a. Agree b. Disagree c. Not Sure
36. If I go to a loud concert, I will wear hearing protection. a. Yes b. No c. Not Sure
37. During the next month, if I am around loud sound, I would be likely to try to
something to protect my hearing. a. Yes b. No c. Not Sure
107
LIST OF REFERENCES
Agrawal, Y., Platz, E. A., & Niparko, J. K. (2008). Prevalence of hearing loss and differences by demographic characteristics among US adults: data from the National Health and Nutrition Examination Survey, 1999-2004. Arch Intern Med, 168(14), 1522-1530.
American Academy of Audiology, A. (2009). Turn It to The Left Retrieved November 1, 2009, from www.turnittotheleft.org
American Speech Language and Hearing Association, A. (2009). Listen to Your buds Retrieved November 2, 2009, from www.listentoyourbuds.org
American Tinnitus Association, A. (2009). Frequently asked questions Retrieved April 8, 2009 from http://www.ata.org/about-tinnitus/patient-faq1
Anderson, K. L. (1992). Keys to effective hearing conservation programs: Hearing status of school-age children. American Speech and Hearing Associtation Reports, 21, 38-47.
Axelsson, A., & Ringdahl, A. (1989). Tinnitus: A study of its prevalence and characteristics. British Journal of Audiology, 23, 53-62.
Barrenas, M., & Lindgren, F. (1991). The influences of eye colour on susceptibility to TTS in Humans. British Journal of Audiology, 25, 303-307.
Berger, E. H., Royster, L. H., Royster, J. D., Driscoll, D. P., & Layne, M. (Eds.). (2003). The noise manual (5th ed.). Fairfax, VA: American Industrial Hygiene Association.
Bess, F. H., Dodd-Murphy, J., & Parker, R. A. (1998). Children with minimal sensorineural hearing loss: Prevalence, educational performance, and functional status. Ear and Hearing, 19 (5), 339-354.
Bloom, S. (2006). New hearing conservation initiatives: small steps with great potential. Hearing Journal, 59(1), 23.
Borchgrevink, H. M. (2003). Does health promotion work in relation to noise? Noise Health, 5(18), 25-30.
Caitlin, F. I. (1986). Noise-induced hearing loss. The American Journal of Otology, 7(2), 141-149.
California Department of Health Care Services, D. (2009). Hearing conservation programs Retrieved October 30, 2009, from http://www.dhcs.ca.gov/services/hcp/Pages/default.aspx

108
Cheng, A. G., Cunningham, L. L., & Rubel, E. W. (2005). Mechanisms of hair cell death and protection. Otolaryngology, Head, Neck, and Surgery, 13, 343-348.
Chermak, G. D., Curtis, L., & Seikel, J. A. (1996). The effectiveness of an interactive hearing conservation program for elementary school children. Language, Speech, & Hearing Services in Schools, 27(1), 29-39.
Coll, K. M., Cutler, M. M., Thobro, P., Haas, R., & Powell, S. (2009). An exploratory study of psychosocial risk behaviors of adolescents who are deaf or hard of hearing: comparisons and recommendations. Am Ann Deaf, 154(1), 30-35.
Crandell, C., Mills, T. L., & Gauthier, R. (2004). Knowledge, behaviors, and attitudes about hearing loss and hearing protection among racial/ethnically diverse young adults. J Natl Med Assoc, 96(2), 176-186.
Dangerous Decibels, D. (2009). Dangerous Decibels Retrieved November 1, 2009, from www.dangerousdecibels.org
Daniel, E. (2007). Noise and hearing loss: a review. J Sch Health, 77(5), 225-231.
Davis, J. M., Shepard, N. T., Stelmachowicz, P. G., & Gorga, M. P. (1981). Characteristics of hearing-impaired children in the public schools: part II--psychoeducational data. Journal of Speech and Hearing Disorders, 46(2), 130-137.
Dell, S., & Holmes, A. (2012). The effect of a hearing conservation program on adolescents' attitudes towards noise. Noise Health, 14(56), 39-44.
Dobie, R. A. (1995). Prevention of noise-induced hearing loss. Arch Otolaryngol Head Neck Surg, 121(4), 385-391.
Erlandsson, S. I., Holmes, A. E., Widen, S. E., & Bohlin, M. (2008). Cultural and social perspectives on attitudes, noise, and risk behavior in children and young adults. Seminars in Hearing, 29(1 ), 29-41.
Fausti, S. A., Wilmington, D. J., Helt, P. V., Helt, W. J., & Konrad-Martin, D. (2005). Hearing health and care: the need for improved hearing loss prevention and hearing conservation practices. Journal of Rehabilitation Research & Development, 42(4), 45-61.
Florida Department of Education. (2012). Student Membership by School by Race, Grade, Gender, 2011-12. Data Publications and Reports Retrieved September 11, 2012, from http://www.fldoe.org/eias/eiaspubs/pubstudent.asp
Folmer, R. L. (2008). Hearing-loss prevention practices should be taught in schools. Seminars in Hearing, 29(1), 67-80.
109
Folmer, R. L., Griest, S. E., & Martin, W. H. (2002). Hearing conservation education programs for children: a review. J Sch Health, 72(2), 51-57.
Griest, S. E. (2008). Evaluation of a hearing loss prevention program. Seminars in Hearing, 29(1), 122-136.
Gunderson, E., Molinem, J., & Catalano, P. (1997). Risks of Developing Noise-Induced Hearing Loss in Employees of Urban Music Clubs. Americal Journal of Industrial Medicine, 31, 75-79.
Harrison, R. V. (2008). Noise-induced hearing loss in children: A 'less than silent' environmental danger. Paediatr Child Health, 13(5), 377-382.
Hearing Foundation of Canada, H. (2009). Sound Sense Retrieved November 2, 2009, from www.soundsense.ca
Henderson, D., Bielefield, E. C., Harris, K. C., & Hu, B. H. (2006). The role of oxidative stress in noise-induced hearing loss. Ear & Hearing (01960202), 27(1-19).
Henderson, E., Testa, M. A., & Hartnick, C. (2011). Prevalence of noise-induced hearing-threshold shifts and hearing loss among US youths. Pediatrics, 127(1), e39-46.
House Ear Institute, H. (2009). Sound Partners Retrieved November 1, 2009, from http://www.hei.org/education/soundpartners/sp.htm
Howarth, L. C. (2008). Coordinating a hearing health education program: Challenges and strategies. Seminars in Hearing, 29(1), 111-121.
Hu, B. H., Henderson, D., & Yang, W. P. (2008). The impact of mitochondrial energetic dysfunction on apoptosis in outer hair cells of the cochlea following exposure to intense noise. Hearing Research, 236(1-2), 11-21.
Jahn, A. F., & Santos-Sacchi, J. (Eds.). (2001). Physiology of the Ear (Second ed.). Canada: Singular- Thomson Learning.
Katbamna, B., & Flamme, G. A. (2008). Acquired hearing loss in adolescents. Pediatric Clinics of North America, 55(6), 1391-1402.
Kawada, T. (2004). The effect of noise on the health of children. Journal of Nippon Medical School, 71(1), 5-10.
Kent, B. A. (2003). Identity Issues for Hard-of-Hearing Adolescents Aged 11, 13, and 15 in Mainstream Setting. J Deaf Stud Deaf Educ, 8(3), 315-324.
Keppler, H., Dhooge, I., Maes, L., D'haenens, W., Bockstael, A., Philips, B., . . . Vinck, B. (2010). Short-tern Auditory Effects of Listening to an MP3 Player. Arch Otolaryngol Head Neck Surg, 136(6), 538-548.

110
Knobloch, M. J., & Broste, S. K. (1998). A hearing conservation program for Wisconsin youth working in agriculture. Journal of School Health, 68(8), 313-318.
Kochkin, S. (2009). Hearing Loss: The prevalence of hearing loss. Better Hearing Institute. Retrieved from www. Betterhearing.org/hearing_loss/prevalence.cfm
Kopke, R., Allen, K. A., Henderson, D., Hoffer, M., Frenz, D., & Van der Water, T. (1999). A radical demise: Toxins and trauma share common pathways in hair cell death. Annals New York Academy of Sciences, 884, 171-191.
Lass, N. J. e. a. (1987). A survey of high school student’s knowledge and awareness of hearing, hearing loss, and hearing health. Hearing Journal, 15-19.
LaVeist, T. (2005). Minority Populations and Health: An introduction to health disparities in the United States. San Francisco: Jossey-Bass.
Le Prell, C. G., Hensley, B. N., Campbell, K. C. M., Hall, J. W., & Guire, K. (2011). Evidence of hearing loss in a ‘normally-hearing’ college-student population. International Journal of Audiology, 50(S1), S21-S31.
Lee, D. J., Gomez-Marin, O., Lam, B. L., & Zheng, D. D. (2004). Trends in hearing impairment in United States adults: the national health interview survey, 1986-1995. J Gerontol A Biol Sci Med Sci, 59(11), 1186-1190.
LePrell, C. G., Yamashita, D., Minami, S. B., Yamasoba, T., & Miller, J. M. (2007). Mechanisms of noise-induced hearing loss indicate multiple methods of prevention. Hearing Research, 226, 22-43.
Lusk, S. L. (1997). Noise exposures. Effects on hearing and prevention of noise induced hearing loss. AAOHN J, 45(8), 397-408; quiz 409-310.
Martin, W. H. (2008). Dangerous decibels: Partnership for preventing noise-induced hearing loss and tinnitus in children. Seminars in Hearing, 29(1), 102-110.
Maw, A. R., Hall, A. J., Pothier, D. D., Gregory, S. P., & Steer, C. D. (2011). The Prevalence of Tympanic Membrane and Related Middle Ear Pathology in Children: A Large Longitudinal Cohort Study Followed From Birth to Age Ten. Otology & Neurotology, 32(8), 1256-1261
McFadden, B., & Pittman. (2008). Effect of minimal hearing on children’s ability to multitask in quiet and noise. Language, Speech, and Hearing Services in Schools, 39, 342-351.
Meinke, D. (2009). Crank It Down update Retrieved October 31, 2009, from www.hearingconservation.org
Montana Office of Public Instruction, M. (2008). Hearing conservation programs Retrieved October 30, 2009, from www.opi.state.mt.us/specED/audio2.html

111
National Aeronautics and Space Administration, N. (2009). Acoustical Testing Laboratory's Hearing Conservation Retrieved November 1, 2009, from http://atl.grc.nasa.gov/index.cfm
National Institute of Occupational Safety and Health. (1998). Occupational Noise Exposure: Revised Criteria 1998. Cincinnati, Ohio: U.S. Department of Health and Human Services.
National Institute of Occupational Safety and Health. (2009). Noise and Hearing Loss Prevention Retrieved June 15, from http://www.cdc.gov/niosh/topics/noise/default.html
National Institute on Deafness and Other Communicative Disorders. (2009a). It's a noisy planet: Protect their hearing Retrieved October 30, 2009, from http://www.noisyplanet.nidcd.nih.gov/Pages/Default.aspx
National Institute on Deafness and Other Communicative Disorders. (2009b). Wise Ears Retrieved October 30, 2009, from www.nidcd.nih.gov/health/wise
Niskar, Kieszak, S., Holmes, A., Esteban, E., Rubin, C., & Brody, D. J. (1998). Prevalence of hearing loss among children 6 to 19 years of age: The third national health and nutrition examination survey. Journal of American Medical Association, 279, 1071-1075.
Niskar, Kieszak, S. M., Holmes, A. E., Esteban, E., Rubin, C., & Brody, D. J. (2001). Estimated prevalence of noise-induced hearing threshold shifts among children 6 to 19 years of age: the Third National Health and Nutrition Examination Survey, 1988-1994, United States. Pediatrics, 108(1), 40-43.
Olsen Widen, S., & Erlandsson, S. (2004). Self-reported tinnitus and noise sensitivity among adolescents in Sweden (Vol. 7).
Osteen, P., & Bright, C. (2010). Effect sizes and intervention research Retrieved November 29, 2012, from http://www.family.umaryland.edu/ryc_research_and_evaluation/publication_product_files/selected_presentations/presentation_files/pdfs/effect%20size%20and%20intervention%20research.pdf
Rivera, B. D., & Rogers-Adkinson, D. (1997). Culturally sensitive interventions: Social skills training. [Article]. Intervention in School & Clinic, 33(2), 75.
Robertson, C., Kerr, M., Garcia, C., & Halterman, E. (2007). Noise and Hearing Protection: Latino construction workers' experiences. AAOHN J, 55(4), 153-160.
Roeser, R. J. (1980). Industrial hearing conservation programs in the high schools (Protect the Ear Before the 12th Year). Ear Hear, 1(3), 119-120.
112
Roeser, R. J., Coleman, T., & Adams, R. M. (1983). Implementing an industrial hearing conservation program in the schools. J Sch Health, 53(7), 408-411.
Rogers, B., Meyer, D., Summey, C., Scheessele, D., Atwell, T., Ostendorf, J., . . . Buckheit, K. (2009). What makes a successful hearing conservation program? AAOHN J, 57(8), 321-335.
Rosenstock, I. M., Strecher, V. J., & Becker, M. H. (1988). Social learning theory and health belief model. Health Education and Behavior, 15(2), 175-183.
Ryberg, J. B. (2009). A national project to evaluate and reduce high sound pressure levels from music. Noise Health, 11(43), 124-128.
Schlauch, R. S., & Carney, E. (2012). The Challenge of Detecting Minimal Hearing Loss in Audiometric Surveys. Am J Audiol, 21(1), 106-119.
Shargorodsky, J., Curhan, S. G., Curhan, G. C., & Eavey, R. (2010). Change in prevalence of hearing loss in US adolescents. [Research Support, Non-U.S. Gov't]. JAMA, 304(7), 772-778.
Sight and Hearing Association, S. (2009). Know Noise Retrieved November 1, 2009, from www.sightandhearing.org
Smith, A. W. (1998). The World Health Organisation and the prevention of deafness and hearing impairment caused by noise. Noise Health, 1(1), 6-12.
Spear, H. J., & Kulbok, P. A. (2001). Adolescent health behaviors and related factors: A review. Public Health Nurs, 18(2), 82-93.
Stansfeld, S. A., & Matheson, M. P. (2003). Nonauditory effects of noise on health. British Medical Bulletin, 68 (1), 243-257.
Suter, A. H. (2009). The hearing conservation amendment: 25 years later. Noise Health, 11(42), 2-7.
Tanaka, e. a. (2009). The effects of acoustic environment after traumatic exposure on hearing and outer hair cells. Hearing Research, 250, 10-18.
Tharpe, A. M. (2008). Unilateral and mild bilateral hearing loss in children: past and current perspectives. Trends Amplif, 12(1), 7-15.
Tharpe, A. M., & Bess, F. H. (1999). Minimal, progressive, and fluctuating hearing losses in children. Characteristics, identification, and management. Pediatr Clin North Am, 46(1), 65-78.
Tharpe, A. M., & Sladen, D. P. (2008). Causation of permanent unilateral and mild bilateral hearing loss in children. Trends in Amplification, 12(1), 17-25.
113
U.S. Census Bureau. (2000). The 2000 census Retrieved February 19, 2009, from www.census.gov
U.S. Census Bureau. (2009). Poverty Tables: Current Population Survey Annual Social and Economic Supplement Retrieved June 26, 2010
U.S. Census Bureau (2010). The 2010 Census Retrieved September, 2012, from http://www.census.gov/prod/cen2010/briefs/c2010br-05
Vogel, I., Brug, J., Hosli, E. J., van der Ploeg, C. P., & Raat, H. (2008). MP3 players and hearing loss: adolescents' perceptions of loud music and hearing conservation. J Pediatr, 152(3), 400-404.
Vogel, I., Brug, J., van der Ploeg, C. P., & Raat, H. (2007). Young people's exposure to loud music: a summary of the literature. Am J Prev Med, 33(2), 124-133.
Vogel, I., Verschuure, H., van der Ploeg, C. P., Brug, J., & Raat, H. (2009). Adolescents and MP3 players: too many risks, too few precautions. Pediatrics, 123(6), e953-958.
Waldo, M. T. (2009). Operation BANG Retrieved November 1, 2009, from www.militaryaudiology.org
Weichbold, V., & Zorowka, P. (2007). Can a hearing education campaign for adolescents change their music listening behavior? International Journal of Audiology, 46(3), 128-133.
Widen, S. E., & Erlandsson, S. I. (2004). The influence of socio-economic status on adolescent attitude to social noise and hearing protection. Noise and Health, 7(25), 59-70.
Widen, S. E., Holmes, A. E., & Erlandsson, S. I. (2006). Reported hearing protection use in young adults from Sweden and the USA: Effects of attitude and gender. International Journal of Audiology, 45(5), 273-280.

114
BIOGRAPHICAL SKETCH
Shawna M. Dell received her Bachelor of Arts degree in communication sciences
and disorders from the University of Florida. She continued her education at the
University of Florida to receive her Doctor of Audiology degree in 2008. A year later, Dr.
Shawna M. Dell received her certification in public health with specialization in social
behavioral science. She recently received her Doctor of Philosophy in the major of
communication sciences and disorders. Dr. Dell’s research interests include:
incorporation of the aims of public health among the world of audiology, hearing
conservation, prevention and education of hearing loss among diverse populations, and
audiologic rehabilitation.
Dr. Dell is a licensed clinical audiologist in the State of Florida since 2008. She
also holds her certificate of Clinical Competence in Audiology issued by the American
Speech and Hearing Association. Dr. Dell has supervised students in various clinical
settings at the Speech and Hearing Clinics at the University of Florida, and she has
worked with Veterans at the Veteran Administration in Gainesville, FL.