to know or not to know: stock market implications of firms
TRANSCRIPT

To Know or Not to Know:
Stock Market Implications of Firms with Superior
Knowledge Management1
Mark DeFond
Yaniv Konchitchki
Jeff McMullin
Daniel E. O’Leary
Leventhal School of Accounting
Marshall School of Business University of Southern California
Los Angeles, CA 90089
November 2009
ABSTRACT: In recent years firms have dramatically increased their expenditures on “knowledge management” (KM), where KM can be defined as the processes managers use to create new knowledge and leverage existing knowledge. Economic theory argues that knowledge is an important driver of firm value and case study evidence suggests that firms with superior KM practices outperform their peers. We are unaware, however, of any systematic evidence that KM benefits shareholders. We fill this void by examining the stock market reaction to companies receiving the “Most Admired Knowledge Enterprise” (MAKE) award, which recognizes companies that excel at KM. We find that MAKE winners experience abnormal stock returns of 1.25% during the five days surrounding the award announcements, and that the magnitude of the abnormal returns is correlated with MAKE winners’ future operating performance. We also find that MAKE winners report superior accounting performance relative to their peers subsequent to the receipt of the award, and that analysts make significant upward revisions to MAKE winners’ earnings forecasts during the month following the award. Taken together, our findings are consistent with superior KM practices creating shareholder wealth by improving future operating performance. These findings are consistent with economic theory that argues knowledge is a fundamental driver of firm value, and with KM literature in a variety of business disciplines that alleges superior KM practices provide firms with a competitive advantage.
Keywords: knowledge management; asset pricing; valuation; information; performance.
Data Availability: Data are available from public sources indicated in the text.
1 This paper has benefited greatly from comments by Mingyi Hung, Ken Merchant, Tatiana Melguizo, Kayli Sanders, Tatiana Sandino, KR Subramanyam, Biqin Xie, and workshop participants at the University of Southern California. We also thank Rory Chase, Director of Teleos, for helpful conversations.

1
To Know or Not to Know:
Stock Market Implications of Firms with Superior
Knowledge Management
"The economic problem of society is thus not merely a problem of how to allocate given resources…it is a problem of the utilization of knowledge not given to anyone in its totality."
- F. A. Hayek “The Use of Knowledge in Society” The American Economic Review, 1945.
I. INTRODUCTION
Economists have long recognized that knowledge plays a central role in creating firm
value (e.g., Schumpeter, 1934; Hayek, 1945; Machlup, 1962). Recently, rapid advances in
information technology have increased firms’ ability to manage knowledge. At the same time,
growth in intellectual capital and global competition have increased the benefits of “knowledge
management” (KM). In response, expenditures on KM have grown dramatically, increasing from
$400 million in 1994 to $34 billion in 2007, and are expected to exceed $150 billion in 2012
(O’Leary, 1998; GIA, 2008). In addition, a large body of case study evidence suggests that
management’s increased investments in KM can improve financial performance (e.g., Barclay
and Murray, 1997). There is little systematic evidence, however, that superior KM enhances
shareholder value. The purpose of this study, therefore, is to test whether KM increases
shareholder value by examining the stock market reaction and future performance of companies
receiving the “Most Admired Knowledge Enterprise” (MAKE) award.
MAKE awards are granted annually by an international organization of knowledge
management professionals to acknowledge companies that excel in using KM to create
organizational wealth (Asian Productivity Organization, 2007). While there is no single accepted

2
definition for KM, a typical definition is “the processes through which organizations generate
value from their intellectual and knowledge-based assets” (Levinson, 2006). “Knowledge-based
assets” in this context refer to knowledge within the firm about factors that create firm value
(Boisot, 1999). In essence, KM addresses the comment by Hewlett Packard’s Chairman that “I
wish we knew what we know at HP” (O’Dell and Grayson, 1998). The notion underlying this
quote is that companies contain vast reservoirs of valuable knowledge, and tapping into this
knowledge can create substantial wealth. The objective of KM is to capture, leverage, and reuse
this knowledge, as well as create new knowledge. To achieve this, KM activities commonly
include sharing best practices, identifying internal experts, and facilitating the exchange of
information among employees (Barclay and Murray, 1997; O’Leary, 2007).
Economists have recognized the importance of knowledge as early as Schumpeter (1934),
which argues that knowledge creation, along with its application, is the cornerstone of economic
growth. The economics literature on knowledge has grown enormously since Schumpeter (1934)
and now influences numerous economic sub-disciplines. At the firm level, Hayek (1945)
provides prescient insights into KM by observing that a major barrier in creating firm value is
harnessing the knowledge that resides “within the heads” of employees, many of whom are
widely dispersed. An analogy that captures Hayek’s observation is that firms consist of islands of
knowledge, and KM systems attempt to bridge these islands (e.g., Melster and Davenport, 2005).
Another important influence from economics on the KM literature is Machlup (1962), which
empirically documents the shift in the US economy from industrial-based to knowledge-based.
An important observation in Machlup (1962) is that while success in an industrial-based
economy depends primarily on industrial inputs such as natural resources and labor, success in a
knowledge-based economy depends primarily on investments in knowledge assets, such as
expertise and intellectual property.
3
More recently, a large body of literature outside of economics, spanning many business
disciplines, investigates the recent trend in managers adopting KM systems. Much of this
research consists of case studies documenting how companies implement KM systems and the
benefits these systems produce (e.g., O’Leary, 2008).2 These case studies present examples of
successfully implemented KM systems across a wide variety of industries and in virtually all
functional areas (e.g., sales, production, logistics, marketing, operations, human resources, and
financial). A striking feature of this literature is the number of anecdotal cases suggesting that
KM generates significant cost effective improvements in operating performance (e.g., Nonaka,
1991).
Two KM case studies are summarized in Appendix B. The first discusses Siemens
Corporation’s response to a dramatic increase in global competition and poor financial health in
the late 1990’s. Among other things, Siemens developed “knowledge communities” that allow
globally dispersed business units to share best practices within the organization for solving
customer problems. In particular, this system reuses customer solutions across different
developing economies, and as these economies develop, it leverages solutions from more
developed economies. Siemens management claims this KM system increased 2001 sales by
$122 million at a cost of under $8 million. The second case study in Appendix B discusses
British Petroleum’s (BP) response to a loss of knowledge from significant downsizing and
decentralization, which resulted in a drastic reduction in employees and increased geographic
dispersion.3 Among other things, BP created a search engine with a “who is who” feature called
2 There are also a large number of articles in the popular press that provide management self-reports of large net benefits from instituting KM systems. According to a PwC survey of public company CEOs, ninety-seven percent believe that knowledge management is an “absolutely critical factor” for firm success (PwC, 1999). 3 The “loss of knowledge” due to factors such as downsizing and the recent trend in early retirement is an impetus for KM systems that locate, document, and retain extant knowledge within the firm (Alavi and Leidner, 2001). A survey by KPMG reports that loss of staff impaired customer relations in 43% of the firms surveyed and 13% reported a loss of income as a result of losing a single employee (KPMG, 1998).

4
“Connect,” that allows employees to easily access others with the knowledge needed for a given
task. According to BP, this KM system increased net income by $260 million in a single year
(Stewart, 1999).
Whereas economic theory argues that knowledge is an important driver of value creation,
and a large body of case-study evidence from a broad variety of business disciplines suggests
that KM initiatives provide firms with a competitive advantage, we are unaware of research that
tests whether superior KM is associated with increased shareholder value. Thus, the purpose of
this paper is to test whether superior KM practices increase shareholder value, where superior
KM practices are evidenced by receipt of a MAKE award. MAKE awards are issued by Teleos,
an independent research firm, in conjunction with the KNOW Network, a global organization of
KM professionals (Asian Productivity Organization, 2007). MAKE winners are selected by
panels of KM experts typically ranging in size from 750 to 3,000 members. The panelists select
winners using the Delphi research methodology, a process developed by Rand Corporation to
improve decision-making by expert groups (Dalkey, 1969).4 The panelists include KM experts
from public and private organizations, as well as executives from global corporations (including
Chief Knowledge Officers, Chief Information Officers, and Chief Learning Officers). The
panel’s objective is to identify firms that excel at transforming enterprise knowledge into
superior products and services that increase shareholder wealth, or in the case of non-public and
not-for-profit organizations, increase societal capital. MAKE winners include public, non-public,
and not-for-profit organizations. Because each MAKE award panelist possesses his or her
individual information and expert opinions about potential MAKE winners, the consensus
4 Evidence suggests that the Delphi process results in group decisions that are superior to the decisions of the individual members (Dalkey, 1969).

5
decision is expected to provide new information to the market about the winners’ abilities to
effectively manage knowledge.5
Our first test examines the abnormal stock returns of the MAKE winners during the five-
day window surrounding the award announcement. Because superior KM practices are expected
to result in superior operating performance, and because winning a MAKE is expected to provide
new information to the stock market about firms’ KM abilities, we expect a positive stock market
reaction to the announcement. Our sample consists of all publicly traded MAKE winners from
2001 through 2008 with available data, comprising 247 MAKE awards issued to 46 distinct
firms. Our event study test finds a significantly positive mean abnormal return of 1.25% during
the five days surrounding the MAKE award announcement, consistent with the MAKE awards
providing new information to the market about firms’ superior KM abilities, and with the market
expecting superior KM practices to result in superior operating performance.
Our second test analyzes whether the magnitude of the abnormal returns found in our first
test is associated with superior future operating performance. If the stock market reaction during
the announcement window reflects market expectations that superior KM practices result in
higher future operating performance, we expect a positive association between the MAKE
announcement abnormal returns and future performance. We test this prediction by regressing
three future performance measures on the abnormal stock returns around the announcement date.
The three performance measures are return-on-assets (ROA), return-on-equity (ROE), and cash
flows from operations over total assets (CFO), and are measured over the four quarters following
the MAKE award announcement quarter. After controlling for market expectations of future
5 Examples of public companies winning a MAKE award include Toyota, Microsoft, Apple, Nokia, Caterpillar, General Electric, and 3M. Examples of non-pubic and not-for-profits winning a MAKE award include KPMG, NASA, the BBC, the US Navy, Wikipedia, the Hong Kong Police Department, and the Korean Water Resources Agency.
6
performance, we find a significantly positive association between both of our accounting-based
performance measures, ROA and ROE, and the five-day abnormal stock returns. This is
consistent with the abnormal returns around the announcement dates being a rational response to
information about superior future operating performance by the MAKE winners.
Our third test examines our prediction that MAKE winners outperform their peers. This
analysis compares our three performance measures (ROA, ROE, and CFO) during the four
quarters following the receipt of the MAKE award with two matched portfolios of peer firms.
One peer firm portfolio is matched on industry and the other is matched on both industry and
percentile of total assets. We find that the MAKE winners outperform both matched peer
portfolios for each performance measure. This finding corroborates our stock market analysis
and is consistent with superior KM resulting in superior future operating performance.
Our fourth test analyzes whether equity analysts revise their annual earnings forecasts
upward for MAKE winners. Because we expect the MAKE award to provide new information to
the market about the winners’ future performance, we expect equity analysts to revise their
beliefs about the MAKE winners’ future performance. We find that during the month following
the MAKE award announcement month, the number and proportion of analysts that revise their
forecasts upward are significantly higher than the number and proportion of analysts that revise
their forecasts downward. We also find that the net forecast revisions for the MAKE winners are
significantly higher than for their peers. These findings lend support to the evidence that the
MAKE awards convey new information to the market about the MAKE winners’ superior KM
abilities, which in turn results in higher future performance.
Our fifth test investigates abnormal stock returns over a 12-month period following the
announcement of the MAKE awards. It is only relatively recently that companies have begun to
make large investments in KM, and the MAKE awards are relatively new. If the market is still

7
learning about the benefits of KM and the credibility of the MAKE awards, the short window
returns around the MAKE announcement dates are not expected to fully anticipate MAKE
winners’ superior future performance. Thus, we use a portfolio intercept test (Konchitchki, 2008)
to test whether the MAKE winning firms report abnormally high stock returns following the
announcement of the awards. We find that abnormal returns are significantly positive over a 12-
month period following the award announcements. These findings are consistent with the market
still learning that the MAKE awards identify firms that excel at KM and that KM leads to
superior future performance.
Taken together, our results provide evidence that MAKE award winners experience an
increase in shareholder value due to expected superior operating performance. To the extent that
the MAKE awards provide market participants with new information about firms that excel at
KM, our results are consistent with superior KM increasing shareholder value. These findings
contribute to several streams of prior research. Importantly, our results are generally consistent
with the long history of economics research that argues knowledge is a critical element in value
creation. Our results are also consistent with an extensive body of literature that suggests
superior KM practices improve firm performance.6 We also contribute to the stream of
accounting literature that examines intangible assets. While prior research focuses primarily on
the valuation implications of intangibles such as R&D and brand names (e.g., Lev and
Sougiannis, 1996; Barth, Clement, Foster, and Kasznik, 1998), we focus on “knowledge-based
6 We also note that our research adds to, but is distinct from, the research that investigates the valuation implications of transaction-oriented systems, such as enterprise resource planning (ERP) systems (e.g., Hayes, Hunton, and Reck, 2001; Hunton, Lippincott, and Reck, 2003). While transaction-based systems may facilitate KM activities, they are fundamentally different from KM, as noted in prior literature (Borghoff and Pareschi, 1998; McDermott, 1999; Wah, 1999; Gao, Li, and Clarke, 2008). KM is not transaction-oriented, focusing instead on issues related to knowledge creation, use and reuse. Nevertheless, while KM systems are distinct from transaction-based systems, KM is an issue that is also of interest to accounting systems researchers (e.g., Arnold and Sutton, 2002; Leech and Sutton, 2002).

8
assets,” intangibles that are conceptually and fundamentally different from R&D and brand
names. While R&D pertains to a relatively well-defined activity within the firm (i.e., research),
and brand name represents a relatively specific aspect of firm value (i.e., branding), knowledge-
based assets are intrinsically related to all activities and sources of value within the firm. Thus,
managing knowledge-based assets entails a much broader scope of activities compared with
managing these other intangibles, and the benefits are potentially broader in scope.7
In summation, our results provide the first systematic evidence consistent with superior
KM practices increasing shareholder value. We emphasize, however, that we cannot generalize
our results beyond our sample of MAKE winners. While we find evidence that the KM activities
of MAKE winners create value for shareholders, our evidence does not suggest that
implementing KM systems, per se, necessarily leads to increased shareholder value. Whereas the
firms in our sample exhibit superior KM practices, firms with poorly implemented KM systems
are less likely to benefit. Indeed, there are well-documented instances in which KM initiatives
are poorly designed and implemented (Malhotra, 2004). However, a normative evaluation of the
costs and benefits associated with implementing KM is beyond the scope of this study. In
addition, we do not suggest that our sample companies are the only firms that excel at KM.
Although MAKE winners are chosen because they have superior KM practices, we do not expect
them to be the only firms that excel at KM. Finally, we do not suggest that the market reaction to
the MAKE winners represents the total net benefits from superior KM practices. Because firms
have been investing in KM systems since the mid 1990’s, market participants should understand
7 We note that prior studies also examine the stock market reaction to awards such as the Malcolm Baldrige Award, and the J. D. Power and Associates Award (e.g., Hendricks and Singhal, 1997; Przasnyski and Tai, 2002; Balasubramanian, Mathur, and Thakur, 2005). This research generally uses these awards as surrogates for the successful implementation of product quality systems, typically in a manufacturing environment. The results of this prior literature are quite mixed, with some studies finding a significant reaction to the awards and other studies not finding a significant reaction to the awards. Importantly, the awards examined in these other studies surrogate for something very different from what we examine in our study. The MAKE awards are uniquely designed to gather expert opinions about firms that excel at KM.

9
that KM investments potentially improve shareholder value even in the absence of the MAKE
award. The increase in stock price in reaction to the awards is consistent with investors
attributing value to firms that excel at KM.
The next section discusses the motivation for the paper and Section III discusses the
sample selection. Section IV presents our analysis and results, Section V presents sensitivity
analysis, and section VI summarizes our conclusions.
II. MOTIVATION
Economic Foundations of Knowledge Management
Economists have acknowledged the economic importance of knowledge as early as
Schumpeter (1934). Schumpeter (1934) observes that the process of combining and creating
intellectual capital is the foundation for economic development, and this perspective has become
the starting point for a large body of research. The economics literature that addresses knowledge
creation and its applications has broadened into a large number of areas since Schumpeter
(1934). At the firm level, Hayek (1945) observes “the knowledge of the circumstances of which
we must make use never exists in concentrated or integrated form, but solely as the dispersed bit
of incomplete and frequently contradictory knowledge which all the separate individuals
possess.” This observation emphasizes that a central problem in organizing firms is that
knowledge is often widely distributed across individuals within the firm, which creates
difficulties in coordinating firm activities. Importantly, Hayek (1945) also makes a distinction
between “scientific knowledge”, defined as knowledge of facts, and “unscientific knowledge”,
defined as “…the knowledge of the particular circumstances of time and place…special
knowledge of circumstances of the fleeting moment, not known to others.” Hayek (1945) notes
that scientific knowledge, or “information,” is a central concept in neoclassical economics,

10
where agents often possess perfect and identical information. But focusing solely on information,
Hayek argues, greatly oversimplifies the task of explaining economic behavior because it ignores
the central importance of unscientific knowledge.
Hayek’s dichotomy between scientific and unscientific information is similar to the
distinction between “explicit” and “tacit” knowledge made in Polanyi (1966). Explicit
knowledge is defined as knowledge that is documented (or can be easily documented) and easily
communicated and interpreted. An example is an owners’ manual that accompanies the purchase
of an electronic product (Alavi and Leidner, 2001). In contrast, tacit knowledge is obtained from
experience and involvement in a specific context, and typically resides “in the heads” of
individuals. This knowledge includes individuals’ mental models, beliefs, and viewpoints, and is
inherently difficult to communicate (Nonaka, 1991). A simple example of tacit knowledge is the
best means of approaching a particular customer: such as through flattery, hard sell, or a no-
nonsense approach (Alavi and Leidner, 2001). Such knowledge can only derive from experience.
Much of the KM literature focuses on creating and exploiting tacit knowledge. However, both
tacit and explicit knowledge are related in that explicit knowledge can be used in the creation of
tacit knowledge, and a primary objective of many KM systems it to turn tacit knowledge into
explicit knowledge so that it can be shared and used to create tacit knowledge (Alavi and
Leidner, 2001).8
Machlup (1962) is another important influence on the growth in KM and KM research.
Machlup coined the term “knowledge economy” and is credited with being the first to document
that the US economy is in the process of transitioning from primarily industrial-based to
8 As with KM, there is no single accepted definition for “knowledge” as it is used in the context of KM. A commonly accepted definition is “…a state or fact of knowing, with knowing being a condition of understanding gained through experience or study” (Schubert et al., 1998). In this view, knowledge does not exist outside of individuals, and is the result of cognitive processing. Other definitions, however, suggest that knowledge is an object, which can be processed and stored (e.g., Carlsson, El Sawy, Eriksson, and Raven, 1996).

11
primarily knowledge-based. Importantly, Machlup (1962) argues that the factors for business
success are fundamentally different in an industrial-based economy than in a knowledge-based
economy: while industrial-based firms rely primarily on factors such as land, labor and natural
resources, knowledge-based firms rely more heavily on factors such as intellectual capital,
expertise, and know-how.
Knowledge Management Research
KM researchers tend to adopt a knowledge-based perspective of the firm, which
originates in the strategic management literature (e.g., Nonaka and Takeuchi, 1995). This
perspective argues that firms create value primarily from combining and applying resources
through the use of firm-specific knowledge, which are termed knowledge-based assets, and
which reside primarily with the firm’s employees. Knowledge-based assets are costly to imitate
and therefore can provide the firm with a sustainable long-term competitive advantage. This
literature also observes that the business environment is characterized by rapid shifts in product
markets, high levels of competition, and fast changing technologies (Alavi and Leidner, 2001).
Successful companies are those that are able to adapt by creating new products and embracing
new technologies. A major implication of these arguments is that all business enterprises are
essentially in the business of innovation, and success ultimately lies in a company’s ability to
manage knowledge.9 Importantly, this means that a firm’s survival does not just depend on its
knowledge at a particular point in time, but on its ability to create new knowledge, with this new
knowledge fueling innovation (Nonaka, 1991). This view suggests that knowledge is renewable
and can be systematically managed within the firm.
9 Nonaka (1991) argues that Honda, NEC, and Sharp are examples of such companies.

12
KM research has flourished over the last two decades and permeates a wide variety of
academic business disciplines. Much KM research tends to use methodologies based on case
studies and surveys. Case studies documenting the implementation of KM systems include many
well-known companies, including Daimler Chrysler (Johnson, Rukstad, and Coughlin, 2001),
Siemens (MacCormack, 2002), and British Petroleum (Berzins, Podolny, and Roberts, 1998).
Some companies, such as KPMG, have case studies from multiple authors that have followed the
evolution of the companies’ KM practices over many years (Gladstone and Eccles, 1991; Alavi,
1997; O’Leary, 2008). A major objective of much of the survey literature is to identify the
factors associated with successful KM initiatives (e.g., O’Leary, 2001; Schultz and Jobe, 2001;
Lee and Choi, 2003; Chuang, 2004; Kim and Lee, 2004). Based on a plethora of case studies in a
variety of business areas, the KM literature presents strong anecdotal evidence that KM systems
can significantly improve firm performance.
Research on Intangibles
Our study addresses whether the efficient use of knowledge assets improves shareholder
value. Because knowledge-based assets are intangibles, the accounting research area that most
closely relates to our study is the research that examines the valuation of intangibles. Most of the
empirical research in this area addresses whether intangibles, such as brand names and R&D, are
valued in the capital markets. This is an important issue because US GAAP is traditionally
reluctant to allow capitalization of intangibles because of the belief their values are unreliable.
While the evidence is somewhat mixed, many of these papers find support for the value
relevance of intangibles. For example, Barth and Clinch (1998) examine whether intangible
assets that are internally valued and included on the books of Australian firms are value relevant
in the stock market. Australian GAAP allows firms to estimate and capitalize intangibles, and the
majority of capitalized intangibles in their sample consists of brand names, patents, and licensing
13
agreements. They find that intangibles are indeed valued by the market. Similarly, Barth,
Clement, Foster, and Kasznik (1998) also find evidence that brand name values are priced in the
stock market and that brand names can be reliably estimated. Lev and Sougiannis (1996)
examine whether the value of R&D can be reliably estimated from past financial information.
They find evidence that R&D estimates can provide reliable and economically relevant
information about the value of R&D expenditures.
Our study relates to an intangible asset that has not been previously examined in the
accounting literature, “knowledge-based assets.” Importantly, knowledge-based assets are
fundamentally different from intangibles that have been previously studied in the literature. The
value derived from a brand name relates to a very specific aspect of value creation – the
establishment and effective use of branding. Similarly, R&D expenditures pertain to a relatively
well-defined activity within the firm – research. In contrast, knowledge-based assets permeate all
functional area within the firm and hence can impact firm value on many dimensions. For
example, while KM may include facilitating the exchange of ideas to improve the effectiveness
of the firm’s branding activities or the innovativeness of its research, KM also includes systems
designed to improve production efficiency and customer relations. Thus, managing knowledge-
based assets entails a much broader scope of activities when compared to managing other
intangibles, and the benefits are more wide-ranging.
III. SAMPLE SELECTION
MAKE winners are chosen by panels of KM experts with balanced membership from
publicly held companies, privately held companies, and not-for-profit organizations. Each panel
has 750 to 3,000 members, comprised of leading KM experts, executives from Fortune 500
companies, and organizational learning experts, with no more than four panelists from any one
14
organization (Asian Productivity Organization, 2007; Chase 2007). The panelists identify MAKE
winners using the Delphi method, a mechanism developed by the Rand Corporation for seeking
consensus decisions among experts (Dalkey, 1969). The objective of the Delphi method is to
aggregate the divergent beliefs of the individual experts and converge on a single collective
decision. The process typically consists of three or four “rounds” of anonymously sharing the
experts’ views among themselves, where the experts’ identities are not revealed to one another.
In the first round, the panelists are asked to nominate organizations (public, non-public, or not-
for-profit) based on eight criteria that are indicators of companies that excel at KM. As explained
more fully in Appendix A, these criteria are:
1. Creating a knowledge-driven enterprise culture. 2. Developing knowledge workers through senior management leadership. 3. Delivering knowledge-based products/services/solutions. 4. Maximizing enterprise intellectual capital. 5. Creating an environment for collaborative knowledge sharing. 6. Creating a learning organization. 7. Creating value based on customer knowledge. 8. Transforming enterprise knowledge into organizational wealth.
The panelists are asked to provide information to support their nominations, including
personal experiences and case study evidence. The first round typically results in the selection of
50 to 150 organizations. In the second round, the first round choices and supporting explanations
are anonymously shared among the panelists. The panelists are asked to evaluate the new
information received from the other experts, then create a short list of no more than three
organizations (again based on the eight criteria). Firms that are short-listed by 10% or more of
the panelists are included in the third round. In the third round the panelists are asked to formally
score each of the finalists on a Likert scale from one to ten based on the eight criteria listed
above. The scores are equally weighted across the eight categories and the firms with the highest

15
scores are selected as the winners. The winning organizations typically have scores ranging
between seven and nine on each of the eight criteria.
MAKE winners are announced through emails to the KNOW Network members,
followed by the issuance of a public press release. The winners are announced by geographical
region periodically throughout the year, with no pre-determined announcement dates.10 Winners
include a variety of organizations, including public corporations, government entities, non-public
business enterprises, and not-for-profit organizations. We begin our data collection by searching
the Factiva and Lexis-Nexis databases for news announcements of the MAKE winners. This
search identifies 425 MAKE winners, with the earliest winners announced during 2001.11 After
excluding MAKE winners that do not have data in the CRSP database (primarily non-listed
companies such as Ernst & Young and not-for-profit companies such as NASA), we reduce our
sample to 222 observations. We then obtain press release dates directly from Teleos for another
25 publicly traded MAKE winners that we cannot identify in the Factiva and Lexis-Nexis
databases.12 This process results in a final sample of 247 MAKE awards issued to 46 distinct
companies from 2001 through 2008.
Table 1 provides descriptive statistics of the MAKE award-winning firms by industry and
year. Panel A presents the number of MAKE awards by industry (based on the industry
classifications in Fama and French, 1997). Firms in Business Services have the largest number of
MAKEs, with 27%, followed by Computers and Automobiles & Trucks with 13% each. Firms in
10 MAKE awards are issued by various geographic regions (e.g., North America, Asia, and Europe) as well as an overall global award. Thus, firms may win more than one MAKE award per year if they win an award in their geographic region and a global award. 11 The KNOW Network website report that the first MAKE award was announced in 1998, but we find no news announcements prior to 2001. Thus, we begin our sample with the 2001 awards. 12 Teleos issues a press release publicly announcing the MAKE winners. To establish the validity of the press release dates obtained directly from Teleos, we compare the dates of the MAKE announcements of a sample of 97 Teleos press releases for which we also have news announcements and find that the Teleos dates match the news announcement dates in all but three cases, and in those cases the press release dates are within one day of the news announcement dates.

16
the Electronic Equipment industry have the third largest number of MAKEs, with 11%, and
firms in the Petroleum and Natural Gas industry have the fourth largest number of MAKEs with
10%. Appendix B includes a description of KM systems introduced at Siemens (a firm in the
Electronic Equipment industry), and British Petroleum (a firm in the Petroleum and Natural Gas
industry). The remaining industries receive 5% or less of the awards. Panel B of Table 1 lists the
number and percentage of MAKE winners in our sample by year, and indicates that the number
of MAKE winners increases over time.
Table 2 lists descriptive statistics for our distinct MAKE winning firms using data from
the Compustat database. We report statistics on each sample firm based on their average values
over the period 2001-2008, equally-weighted by firm. Table 2 reports that the sample firms tend
to be reasonably large, with median assets of over $34 billion and median sales of over $8
billion. Our sample firms are also financially healthy, with median ROA of 1.9%, median ROE
of 4.7%, and median cash flows-to-assets of 8.5%.
IV. ANALYSES AND RESULTS
Stock Market Reaction to Winning a MAKE Award
Our first analysis tests our prediction that the stock market reacts positively to the
announcement of the MAKE winners. As in DeFond, Hann, and Hu (2005), we test our
prediction using standard event-study methodology with cumulative abnormal returns (CAR)
computed over a five-day event window, beginning two days before the announcement through
two days after the announcement day (e.g., Binder, 1998). We employ a five-day window
because the MAKE awards are announced to members of the KNOW Network via email a day or
two prior to the official press release date, which suggests news of the awards may be leaked
prior to the official announcement date. In addition, the MAKE awards are relatively new and

17
the benefits of KM may be relatively unclear to market participants, suggesting that market
participants may be slow to react to the announcement of the winners. Specifically, we compute
CAR as follows:
2
[ 2, 2]
2
t
t
t
CAR AR=+
− +
=−
=∑ (1)
where:
; ; and t = (–2, –1, 0, +1, +2);
Rit is the return of the sample firm i on day t; E(Rit) is the corresponding market return from CRSP on day t.
We report two t-statistics that test the statistical significance of the CAR, one using the
time-series mean abnormal returns as in Brown and Warner (1980, 1985), and the other using the
calendar-time abnormal returns as in Jaffe (1974) and Mandelker (1974). The t-statistics using
the time-series approach are computed as follows:
1/22 2
2
2 2
[ ]t t
t t
t t
t AR S AR=+ =+
=− =−
=
∑ ∑ (2)
where:
S 2[ARt] = AR
t− AAR
2
t =−244
t =−6
∑
238 ;
AAR = AR
t
t = −244
t = −6
∑ 239 .
We use 239 days (-244 through -6) in the estimation period to derive the standard
deviation and restrict the analysis to firms with at least 120 daily returns in the estimation period.
Because a portfolio average abnormal return is used in the calculation of the standard deviation,
the test statistic takes into account cross-sectional dependence in the abnormal returns.
To implement the calendar-time test we first sort all firms into portfolios by event
calendar date. Next we estimate a portfolio standard deviation from the time series of portfolio
abnormal returns in the estimation period, and used it to standardize the portfolio return. Our
1
1 ti N
t it
it
AR ARN
=
=
= ∑ ( )it it it
AR R E R= −

18
calendar-time p-value from this test is based on a cross-sectional t-test on the standardized
portfolio abnormal return. We calculate the calendar-time t-statistic as follows:
t = CAAR
[−2,+2]S
CAAR[−2,+2]
N( ) (3)
where:
[ 2 , 2]
22 2
2
1 2 1 2
1 1
1
N t N t
CAAR t t
i t j ti j
S AR ARN N− +
=+ =+
= =− = =−
= − −
∑ ∑ ∑ ∑ ;
2
[ 2, 2]
1 2
1 N t
t
j t
CAAR ARN
=+
− +
= =−
=
∑ ∑ ; and
i, j are firm indices.
Table 3 reports the results of the stock market reaction analysis. Consistent with our
prediction, we find a positive portfolio mean abnormal return for the MAKE winners of 1.25%,
which is significant at p = 0.042 using the time-series abnormal return t-statistic from Brown and
Warner (1980, 1985), and at p = 0.029 using the calendar-time abnormal return t-statistic from
Jaffe (1974) and Mandelker (1974).13 To assess the economic significance of our findings, we
evaluate the impact of the market reaction to the MAKE award. Evaluated at the mean and
median market value of equity for our sample firms of $72,066 and $50,191 million (see Table
2), our findings are consistent with an increase in market value of $900.8 and $627.4 million per
sample firm, respectively. Overall, our findings are consistent with the MAKE awards providing
new information about which firms excel at KM, and with market participants expecting firms
that excel at KM to exhibit superior future operating performance.
The Association between the Market Reaction to Winning a MAKE Award and Future
Performance
Our second analysis tests our prediction that the abnormal returns around the MAKE
award announcements are associated with superior future performance. We assess future
performance using three accounting-based performance measures: ROA, ROE, and CFO. Each
13 Significance levels are one-tailed where we have predictions and two-tailed otherwise.

19
measure is averaged over the four quarters following the quarter in which the MAKE award is
received, with data obtained from the Compustat Quarterly database. We use the average of all
available quarters for the MAKE winners with less than four quarters of available data following
the receipt of the award. We then regress each of the future performance measure on the
cumulative abnormal stock returns during the five days surrounding the announcement of the
MAKE winners, using two models as follows:
Model 1: FuturePerformanceif = αi + β1CARit + εif (4)
Model 2: FuturePerformanceif = αi + β1CARit + β2ExpectedPerformanceif + εif
where: CARit = Cumulative abnormal return for firm i over period t, which equals the five days
surrounding the award announcement day (day –2 through day +2). FuturePerformanceif = ROA, ROE, or CFO, for firm i, over future period f. Period f refers to
the average of the future four quarters following the quarter in which the MAKE award is received.
ExpectedPerformanceif = Analyst expectations of future ROA, ROE or ROA, for firm i, over future period f.
We include expected future performance in our second model to control for market
expectations of future performance at the time the awards are announced. Thus, Model 2 tests
whether the MAKE awards reflect information about future performance that is incremental to
the market’s expectations just prior to the award announcement. We operationalize expected
future return on assets and future return on equity as the I/B/E/S consensus annual earnings per
share forecast divided four (because our dependent variable is average quarterly performance),
scaled by total assets per share and by stockholders’ equity per share, respectively. We
operationalize analyst expectations of future cash flows from operations as the I/B/E/S consensus
analyst forecast of annual cash flows from operations per share divided by four (because our
dependent variable is average quarterly performance), scaled by total assets per share. We
measure total assets and stockholders’ equity during the quarter in which the MAKE award is

20
announced or, in the case of missing data, the quarter with data immediately before the MAKE
winning quarter. Also, because some firms win multiple awards over the period of our analysis,
we cluster the regression residuals by firm and year to control for potential cross-sectional and
time-series correlation (Petersen, 2008; Gow, Ormazabal, and Taylor, 2009). A positive and
significant coefficient on β1 is consistent with our expectation that the event period abnormal
stock returns are associated with higher expected future performance.
Table 4 presents the results of estimating the two models for the three performance
measures. The number of observations in this analysis drops to 202 (from the 247 in our event
study test) for Model 1 primarily because the 37 MAKE winners in 2008 (see Table 1, Panel B)
received their awards in October and November 2008, and we lack future performance variables
for these observations.14 Because analyst forecast data are not available in I/B/E/S for all 202
firms, there is a slight loss of observations for estimating Model 2 (195 for ROA and ROE, and
170 for CFO). Consistent with our prediction, Table 4, Panel B, reports that for Model 1 the
coefficient on CAR is significant at p = 0.026 or less for all three future performance measures.
That is, all three regressions find a positive and statistically significant association between
future operating performance for the MAKE winners and abnormal stock returns around the
announcement of the MAKE awards. Table 4, Panel B, also reveals that when investigating
Model 2 the coefficient on CAR is significant for future ROA (p = 0.009) and ROE (p = 0.001),
but not for CFO (p = 0.378).
Taken together, our findings in Table 4 corroborate the findings in our first analysis by
providing evidence that the positive stock market reaction to the MAKE award announcements is
due to the market’s expectation that the MAKE winners will exhibit superior future performance.
14 We also delete 3 observations without past performance data required for our analysis in Table 4. This exclusion does not change our inferences as we explain in Section V.

21
Because we expect the MAKE awards to identify firms with superior KM abilities, this is
consistent with the market expecting firms that excel at KM to exhibit superior operating
performance.
Future Performance of MAKE Award Winners Compared to their Peers
Because the MAKE awards are expected to identify firms with superior KM abilities, we
expect the MAKE winners to outperform their peers, on average, subsequent to the receipt of the
award. We investigate this by comparing the MAKE winners’ performance with the performance
of two sets of peer firms. The first set of peers contains all of the other firms in the MAKE
winners’ industry during the quarter in which the MAKE is awarded. The second set of peers is
more narrowly matched, consisting of the portfolios of all of the firms that are in both the
industry and the percentile of total assets of the MAKE winners during the quarter in which the
MAKE is issued.15 We compare the performance of the winner and peer firms based on the three
performance measures we use in Table 4 (ROA, ROE, and CFO). Because the first peer group is
matched only on industry, we compare the MAKE winners with this group by estimating the
following regression model that adds control variables capturing past performance, total assets,
and the book-to-market ratio:
FuturePerformanceit = αi + β1Winnerit + β2PastPerformanceit + β3Assetsit + BTMit + εit (5)
where: FuturePerformanceit = ROA, ROE, and CFO, for firm i, over period t, which equals the
average of the four quarters following the quarter in which the MAKE award is received. Where four quarters are not available we use all available quarters.
Winnerit = An indicator variable indicating the observation is a MAKE winner. PastPerformanceit = Similar to the future performance measures but captured over the
four quarters prior to the quarter in which the MAKE is awarded. Where four quarters are not available we use all available quarters.
15 We use the industry classification in Campbell (1997) for this analysis because it contains fewer industries than the 48 Fama-French industries, thereby facilitating our identification of matched firms when we also match on percentile of total assets.
22
Assetsit = Total assets from Compustat measured during the quarter in which the MAKE is awarded. When quarterly Compustat data is missing, we use the most recent quarterly or annual data prior to the quarter in which the MAKE is awarded.
BTMit = Book-to-Market ratio from Compustat measured during the quarter in which the MAKE is awarded. When quarterly Compustat data is missing, we use the most recent quarterly or annual data prior to the quarter in which the MAKE is awarded.
We cluster the regression residuals by firm and year to control for potential correlations
among the error terms. We include control variables for past performance, size, and the book-to-
market ratio because these variables are potentially related to future operating performance. A
significantly positive coefficient on the dummy variable capturing MAKE winners is consistent
with the MAKE winners outperforming the matched peer firms over the quarters following the
announcement of the MAKE award.
Table 5 presents the results of this analysis, where we analyze the same 202 MAKE
winning observations we use in Model 1 of Table 4. Panel A presents descriptive statistics for
the 202 MAKE winner observations used in the analysis, Panel B presents descriptive statistics
for the 51,033 peer firms matched on industry alone, and Panel C presents descriptive statistics
for the 202 peer firm portfolios matched on industry and percentile of total assets. Panel A
indicates the mean future ROA, ROE, and CFO is 2.9%, 6.2%, and 10.1%, respectively, for the
202 MAKE winning observations. Comparing this with the past ROA, ROE and CFO on 2.9%,
5.9%, and 10.2%, indicates that performance is highly persistent. Panel B indicates that the peer
firms matched on industry alone are smaller and perform more poorly when compared to the
MAKE winners. In addition, the book-to-market ratios of the peer firms tend to be larger than for
the MAKE winners. Panel C indicates the peer firms matched on industry and size yields a
significantly closer match to the MAKE winners in Panel A. In particular, these matched firms
are much larger and more profitable than the peers matched on industry alone.

23
Panel D of Table 5 presents the regression analysis comparing the MAKE winners with
the peer sample matched on industry alone. The results report a positive coefficient on the
dummy capturing MAKE winners in all three regressions, with a significance of p ≤ 0.001. Thus,
we find that when compared to the peers in their industry, the MAKE winners report
significantly higher future performance, after controlling for past performance, size, and the
book-to-market ration. Panel E presents a univariate analysis of the peer group matched on
industry and size. This analysis indicates that mean and median performance, across all three
performance measures, is higher among the MAKE winners than among the peers, with a
significance of p ≤ 0.001. Thus, the analysis in Table 5 is consistent with the MAKE awards
identifying firms that outperform their peers subsequent to receiving the MAKE award. This is
consistent with the MAKE awards identifying firms that excel at KM and with firms that excel at
KM outperforming their peers.
Analyst Earnings Forecast Revisions following MAKE Award Announcements
Equity analysts are financial intermediaries that are potentially interested in the valuation
implications of the MAKE awards. Thus, in addition to investigating the stock market’s reaction
to the announcement of the MAKE awards, we also investigate equity analysts’ reaction. We
predict that equity analysts make upward revisions to their annual earnings forecasts for the
MAKE award winners during the month following the announcements. Finding that equity
analysts make upward revisions to their forecasts in response to the awards is consistent with the
awards providing analysts with new information about the award winners’ expected future
performance.
We perform four analyses to test the reactions of analysts to the MAKE award
announcements. Our first analysis tests whether the consensus forecast revision for the MAKE
winners is significantly positive during the month following the MAKE award. If the MAKE

24
awards provide new information about improved future performance, we expect to find a
positive average consensus forecast revision. We compute the average consensus forecast
revision for each MAKE award winner as follows, where time t = 0 is the month during which
the award is announced:
t+1 t-1
t-1
Consensus EPS Forecast - Consensus EPS Forecast
Consensus EPS Forecast (6)
Table 6, Panel A, reports the results of this test. This analysis restricts our sample to
observations with consensus forecasts in the I/B/E/S database, which reduces our sample to 183
observations.16 Panel A indicates that the mean consensus forecast revision is +2.8% and
significant at p = 0.027. Thus, we find that the consensus forecast revision during the month
following the MAKE awards is positive and statistically significant for the winners.
Our second analysis tests whether the average number of upward earnings forecast
revisions is larger than the average number of downward earnings forecast revisions for the
MAKE winners during the month following the announcement of the award. If the MAKE
awards provide new information about improved future performance, we expect to find
significantly more upward revisions than downward revisions. Using the I/B/E/S database, we
compute the averages as the total number of upward and downward revisions for all observations
with available data, divided by the number of MAKEs awarded to the firms with available data.
Specifically, we calculate the following two ratios, where time t is the month of the award:
t+1
t+1
Number of Upward RevisionsMeasure 1 =
Number of Awards
Number of Downward RevisionsMeasure 2 =
Number of Awards
(7)
16 Note that the forecasted annual earnings during the month prior to the MAKE must also be for the same year as the forecast during the month subsequent to the MAKE. This restriction results in dropping seven observations.

25
Table 6, Panel B, reports the results of this test. This analysis requires I/B/E/S data from
the month following the award month, and also restricts the MAKE sample to firms with either
an upward or downward forecast revision. This increases our sample to 190 observations. Panel
B indicates that an average of 3.04 analysts per MAKE winner revise upwards (Measure 1), and
an average of 1.90 analysts per MAKE winner revise downwards (Measure 2), and that the
average number of upward revisions is significantly greater than the average number of
downward revisions at p = 0.009. Thus, we find that the average number of upward forecast
revisions is larger than the average number of downward forecast revisions for the MAKE award
winners during the month following the announcement of the award.
Our third analysis tests whether the proportion of analysts making upward revisions is
greater than fifty percent of the total analyst revisions during the month following the
announcement of a MAKE award. If the MAKE awards provide new information about
improved future performance, we expect to find the proportion of upward revisions to be
significantly higher than fifty percent for the MAKE winning firms. Using all observations with
available data in I/B/E/S, we compute the proportion of upward revisions for each MAKE award
winner as follows, where time t is the month of the award:
t 1
t+1Number of Upward Revisions
Total Number of Upward or Downward Revisions +
(8)
Table 6, Panel C, reports the results of this test. This analysis contains the same sample
we analyze in Panel B. Panel C indicates that the mean proportion of upward forecast revisions
relative to total revisions is 59.4%, and it is significantly greater than 50% at (p = 0.002). Thus,
this finding is consistent with a significantly higher proportion of analysts revising their forecasts
upward for MAKE winners during the month following the winning of the award.

26
Our fourth test investigates analyst forecast revisions of MAKE firms relative to a control
sample. We first match each MAKE award observation with a matched portfolio of firms in the
same industry, year, quarter, and percentile of total assets, where each portfolio contains an
average of 6.4 matched peer firms. Next we calculate the revisions in analyst consensus EPS
forecasts over three periods surrounding the award month: month –1 relative to month –3 (–3, –
1), month +1 relative to month –1 (–1, +1), and month +3 relative to month +1 (+1, +3), where
the award month is defined as month = 0. We scale the analyst EPS forecast revisions by the
analyst consensus EPS forecast from the first month of each period and winsorize at the first and
ninety-ninth percentile for both the MAKE firms and the peer portfolios. We then compute the
mean and median of the scaled revisions, and conduct a two-sample t-test and a two-sample
Wilcoxon z-test to compare the means and medians, respectively, between the MAKE firms and
the matched control portfolios.
Table 6, Panel D, reports the results of this test. The first three rows show the mean and
median revisions during each of our revision windows for the MAKE firm observations. This
portion of Panel D indicates that during (–1, +1) the revisions are significantly positive, with
mean and median values of 0.033 (p = 0.024) and 0.004 (p = 0.001), respectively. In addition,
the revisions during (+1, +3) are significantly positive for the median, with a value of 0.005 (p =
0.005). The next three rows in Panel D show the mean and median revisions during each of our
revision windows for the matched portfolios. This analysis indicates that the mean and median
revisions are insignificant at conventional levels during all three windows. The last three rows
show the differences in the mean and median revisions between the MAKE firm observations
and the matched portfolios. This analysis finds that during the (–1, +1) window the mean and
median MAKE firms’ revisions are significantly higher than the matched portfolios’ revisions,
with values of 0.033 (p = 0.035) and 0.013 (p = 0.021), respectively. In addition, during the (+1,
27
+3) window, the MAKE firms’ revisions are significantly higher than the matched portfolios’
revisions for the median, with a value of 0.009 (p = 0.019). Thus, Panel D reveals that equity
analysts make significantly larger upward revisions to MAKE winners than to their control peers
during the months immediately surrounding the award announcement month.
In summary, for MAKE winners during the month following the award announcement:
(1) analysts make significant upward revisions to their forecasts; (2) the average number of
upward analyst forecast revisions is larger than the average number of downward revisions; (3)
the proportion of upward analyst forecast revisions is significantly larger than 50%; and (4)
analysts’ revisions for MAKE winners are significantly higher than for their peers. Taken
together, these findings present evidence that the MAKE awards communicate information to
equity analysts indicating the winners will exhibit higher future performance than previously
anticipated. Because we expect the MAKE awards to identify firms with superior KM abilities,
this is consistent with equity analysts expecting firms that excel at KM to exhibit superior
operating performance.
Subsequent Abnormal Stock Returns of MAKE Award Winners
It is only relatively recently that companies have begun to make large investments in
KM, and the MAKE awards are relatively new. Therefore the market may still be learning about
the benefits of KM and the credibility of the MAKE awards. If so, the market may not impound
all of the value relevant information about the award winners around the announcement date. If
so, and if the MAKE winners outperform their peers, we expect abnormally high stock returns
for the MAKE winners to persist subsequent to the announcement of the awards, as the market
learns of their superior performance. Thus, our final analysis examines the risk-adjusted one-
year-ahead returns of the MAKE winners.

28
We examine the subsequent stock market performance of the MAKE winners using an
asset pricing test that examines the Fama-French intercepts (alphas) from a monthly time-series
model for MAKE portfolios (e.g., Fama and French, 1993; Konchitchki, 2008; Barth,
Konchitchki, and Landsman, 2009). Specifically, we form portfolios on July 1st of each sample
year that consists of all MAKE winners during the preceding twelve months. Figure 1 presents a
timeline for the construction of our portfolios relative to the announcement of the MAKE
winners. We then regress the monthly portfolio returns during the subsequent twelve months on
the three Fama-French factors, excess return on the market (MKT), small-minus-big (SMB),
high-minus-low (HML), and a momentum factor (MOM). Specifically, we estimate the
following model:
(Ret – Rf)pm = αp + β1MKT + β2SMB + β3HML + β4MOM + εpm (9)
where: (Ret – Rf)pm = Month m equally-weighted return in excess of the one month Treasury Bill, Rf,
to portfolio p formed each July 1st and includes all MAKE winners in our sample during the preceding 12 months.
MKT= the monthly return on the stock market minus the return on the one month Treasury Bill.
SMB and HML = the respective monthly return to the size (Small-Minus-Big) and book-to-market (High-Minus-Low) factor mimicking portfolios as described in Fama and French (1993).
MOM = the monthly return to the momentum factor mimicking portfolio (Jegadeesh and Titman, 1993; Carhart, 1997).
A significantly positive intercept in this regression indicates the MAKE winners report
abnormal stock returns over the year following the MAKE awards.
Table 7 presents the results of this analysis. The sample size is 90 observations,
corresponding to the number of months in the analysis (6 months of returns for 2001, and 12
months of returns for 2002-2008). We find that the coefficient on the intercept is 0.9% and
significant at p = 0.005. This finding indicates that MAKE winners continue to experience
29
abnormal stock returns, on average, during the year following the announcement of the MAKE
award. This is consistent with the market not fully impounding the information about the awards
around the award announcement date.
V. SENSITIVITY TESTS
Alternative Analysis of Abnormal Short Window Returns
We repeat the analysis in Table 3 using firm-level instead of portfolio-level returns. In
untabulated tests we continue to find significantly positive abnormal returns during the five-day
window centered on our MAKE award days. Thus, our interpretation from our analysis in Table
3 remains unchanged using this alternative measure of returns.
We also investigate the robustness of our inferences to the choice of the statistical tests
we use to examine the stock market reaction in Table 3. Specifically, instead of the time-series
and calendar-time t-tests we use to calculate the p-values, we use the standardized abnormal
return Z-test following Patell (1976), which estimates a separate standard error for each security-
event and assumes cross-sectional independence. The second measure is the nonparametric
generalized sign test that, instead of assuming a probability for a positive abnormal return of
half, adjusts for the fraction of positive versus negative abnormal returns in the estimation
period. In untabulated analysis we continue to find a significantly positive stock market reaction
to the MAKE award. Thus, our inferences in Table 3 remain unchanged using these two
alternative tests.
Alternative Analysis of Future Performance
The analysis in Table 5, Panel E, is currently a univariate test. We test the robustness of
this analysis by repeating it using the regression specification we use in Table 5, Panel D.
Specifically, we regress future performance for our sample of MAKE winners and peer firm

30
portfolios (matched on industry and same percentile of total assets), on an indicator variable for
MAKE winners, past performance, total assets, and the book-to-market ratio. In untabulated
analysis we find a significantly positive coefficient on the MAKE winner indicator variable.
Thus, our inferences in Table 5, Panel E, remain unchanged using a multivariate analysis.
We also test the sensitivity of our results in Table 5, Panel D, and the alternative
regression specification of Table 5, Panel E (described above), to the inclusion of past
performance by repeating the regression analysis after omitting the past performance variable. In
untabulated analysis we find that the coefficient on the indicator variable for MAKE winners
remains significant and positive in both specifications. Thus, our inferences regarding
multivariate analysis of Table 5, Panels D and E are unchanged when we drop past performance
from the analysis.
Alternative Specification for Future Returns
We repeat our future return tests in Table 7 using the Fama-French three-factor model
(i.e. after dropping the momentum factor). In untabulated analysis we find that the coefficient on
the intercept remains significant at the p < 5% level. Thus, our interpretation from our analysis in
Table 7 remains unchanged with this alternative specification.
VI. SUMMARY AND CONCLUSIONS
A long history of economic research suggests that knowledge plays a critical role in wealth
creation. Recently, factors such as advances in technology and increased global competition have
resulted in large increases in firms’ expenditures on KM systems. In addition, a large body of
literature across several business disciplines presents case study evidence that firms with superior
KM abilities outperform their peers. However, despite the trend towards greater investment in
KM, and the theoretical and anecdotal evidence that KM improves performance, we are unaware

31
of any systematic evidence that KM results in higher shareholder values. Thus, the purpose of
this study is to test whether superior KM abilities increases shareholder value by examining the
stock market reaction and future performance of companies receiving the “Most Admired
Knowledge Enterprise” (MAKE) award, which recognizes companies with superior KM
abilities.
We perform tests that examine the share price reaction to the announcement of the MAKE
award, the link between the share price reaction and future performance, analysts’ reaction to the
announcement of the award, the future operating and stock price performance of the award
winners. We find that during the five days surrounding the award announcement, MAKE
winners experience 1.25% abnormal stock returns, and that these returns are positively
associated with MAKE winners’ subsequent operating performance. We also find that equity
analysts are relatively more likely to make significant upward revisions to MAKE winners’
earnings forecasts during the month following the award, and that MAKE winners surpass their
peers in terms of both operating performance and stock price performance during the year
subsequent to winning the award. All told, our findings are consistent with firms that excel at
KM improving shareholder wealth through superior future operating performance. These
findings are consistent with economic theory that argues knowledge is a fundamental driver of
firm value, and with the KM literature in a variety of business disciplines that alleges superior
KM systems provide firms with a competitive advantage.

32
REFERENCES
Alavi, M. 1997. KPMG Peat Marwick US: One Giant Brain. Harvard Business School, Boston, MA.
Alavi, M. and D. E. Leidner. 2001. Review: Knowledge Management and Knowledge
Management Systems: Conceptual Foundations and Research Issues. Management
Information Systems Quarterly 25: 107-136. Arnold, V. and S. G. Sutton. 2002. Researching Accounting as an Information Systems
Discipline, American Accounting Association, Gainesville FL. Asian Productivity Organization. 2007. Knowledge Management: From Brain to Business.
Hiakawacho, Chiyoda-ku, Japan. Barclay, R. and P. Murray. 1997. What is Knowledge Management? Knowledge Praxis,
Knowledge Management Associates. Balasubramanian, S., I. Mathur, and R. Thakur. 2005. The Impact of High-Quality Firm
Achievements on Shareholder Value: Focus on Malcolm Baldrige and J. D. Power and Associates Awards. Journal of the Academy of Marketing Science 33: 413-422.
Barth, M., M. Clement, G. Foster, and R. Kasznik, 1998. Brand Values and Capital Market
Valuation. Review of Accounting Studies 3: 41–68. Barth, M.E., and G. Clinch. 1998. Revalued Financial, Tangible, and Intangible Assets:
Associations with Share Prices and Non-Market-Based Value Estimates. Journal of
Accounting Research 36: 199-233. Barth, M. E., Y. Konchitchki, and W. R. Landsman. 2009. Cost of Capital and Earnings
Transparency. Stanford University Research Paper Number 2015. Berzins, A., J. Podolny, and J. Roberts. 1998. British Petroleum (B): Focus on Learning. S-1B-
16B, Graduate School of Business, Stanford University. Binder, J.J. 1998. The Event Study Methodology Since 1969. Review of Quantitative Finance
and Accounting 11: 111-137. Borghoff, U., R. Pareschi. 1998. Information Technology for Knowledge Management. Springer,
New York, NY.
Brown, S.J. and J.B. Warner. 1980. Measuring Security Price Performance. Journal of Financial
Economics 8: 205-258.
Brown, S.J. and J.B. Warner. 1985. Using Daily Stock Returns: The Case of Event Study. Journal of Financial Economics 14: 3-31.

33
Carhart, M. M. 1997. On Persistence in Mutual Fund Performance. Journal of Finance 52: 57-
82.
Carlsson, S. A., El Sawy, O. A., Eriksson, I., and Raven, A. 1996. Gaining Competitive Advantage Through Shared Knowledge Creation: In Search of a New Design Theory for Strategic Information Systems. in Proceedings of the Fourth European Conference on
Information Systems, J. Dias Coelho, T. Jelassi, W. Konig, H. Krcmar, R. O'Callaghan, and M. Saaksjarvi (eds.), Lisbon.
Chase, R. 2007. Speech by Rory Chase, Executive Director of Teleos and The KNOW Network. Chuang, S. 2004. A Resource-based Perspective on Knowledge Management Capability and
Competitive Advantage. Expert Systems with Applications 27: 459-465. Dalkey, N. 1969. The Delphi Method: An Experimental Study of Group Opinion. Rand Corporation, Santa Monica, CA. DeFond, M., R. Hann and X. Hu. 2005. Does the Stock Market Value Financial Expertise on
Audit Committees of Boards of Directors? Journal of Accounting Research 43, 153-193. Ewing, J. 2001. Sharing the Wealth. Business Week, March 19, 2001. Fama, E.F. and K.R. French. 1993. Common Risk Factors in the Returns of Stocks and Bonds.
Journal of Financial Economics 33: 3-56. Gao, F., M. Li, and S. Clarke. 2008. Knowledge, Management, and Knowledge Management in
Business Operation. Journal of Knowledge Management 12, 3-17. Gladstone, J. and R. Eccles. 1991. KPMG Peat Marwick: The Shadow Partner. Harvard Business
School, 9-492-002, revised 1995. Global Industry Analysts, Inc. (GIA). 2008. Knowledge Management: A Global Strategic
Business Report. Gow, I.D., G. Ormazabal, and D.J. Taylor. 2009. Correcting for both Cross-Sectional and Time-
Series Dependence in Accounting Research. The Accounting Review, Forthcoming. Hayek, F. 1945. The Use of Knowledge in Society. The American Economic Review 35: 519–
530. Hayes, D., Hunton, J., Reck, J. 2001. Market Reaction to ERP Implementation Announcements.
Journal of Information Systems 15: 3-18. Hendricks, K.B., V. R. Singhal. 1997. Does Implementing an Effective TQM Program Actually
Improve Operating Performance? Empirical Evidence from Firms that have Won Quality Awards. Management Science 43: 1258- 1274.

34
Hunton, J., Lippincott, B., Reck, J. 2003. Enterprise Resource Planning Systems: Comparing
Firm Performance of Adopters and Nonadopters. International Journal of Accounting
Information Systems 4: 165-184. Jaffe, J.F. 1974. Special Information and Insider Trading. Journal of Business 47: 410-428. Jegadeesh, N. and S. Titman. 1993. Returns to Buying Winners and Selling Losers: Implications
for Stock Market Efficiency. Journal of Finance 48: 65-91. Johnson, C., M. Rukstad and P. Coughlin. 2001. DaimlerChrysler Knowledge Management
Strategy. 9-702-412, Harvard Business School. Kim, S. and H. Lee. 2004. Organizational Factors Affecting Knowledge Sharing Capabilities in
e-Government. Lecture Notes in Computer Science, Springer – Verlag Issue 3035: 265-277. Konchitchki, Y. 2008. Inflation and Nominal Financial Reporting: Implications for Performance
and Stock Prices. University of Southern California Working Paper. KPMG. 1998. Management Consulting. Knowledge Management: Research Report. KPMG,
Newark, NJ. Leech, S. A. and S. G. Sutton. 2002. Knowledge Management Issues in Practice: Opportunities
for Research. International Journal of Accounting Information Systems 3: 69-73. Lee, H. and B. Choi. 2003. Knowledge Management Enablers, Processes, and Organizational
Performance. Journal of Management Information Systems, Volume 20, Number 1: 179-228.
Lev, B., T. Sougiannis. 1996. “The capitalization, amortization, and value-relevance of R&D.”
Journal of Accounting and Economics 21: 107-138.
Levinson, M. 2006. ABCs of Knowledge Management.” CIO.com. MacCormick, A. 2002. Siemens ShareNet: Building a Knowledge Network. 9-603-036, Harvard
Business School. Machlup, F.1962. The Production and Distribution of Knowledge in the United States. Princeton:
Princeton University Press. Mandelker, G. 1974. Risk and Return: The Case of Merging Firms. Journal of Financial
Economics 1: 303-336. McDermott, R. 1999. Why Information Technology Inspired but Cannot Deliver Knowledge
Management. California Management Review 41: 103-117.

35
Melster, D. and T. Davenport. 2005. Knowledge Management at Accenture. Harvard Business
Publishing, 905E18-PDF-ENG. Milton, N. and Palen, W. 2000. The Origin of Species: The Evolution of Networks at BP Amoco.
Inside Knowledge 3. Nonaka, I. 1991. The Knowledge Creating Company. Harvard Business Review 69, 96-104. Nonaka, I., and Takeuchi, H. 1995. The Knowledge-Creating Company: How Japanese
Companies Create the Dynamics of Inovation. Oxford University Press, New York. O’Dell, C. and C. Grayson. 1998. If Only We Knew What We Know. California Management
Review 40: 154-174. O’Leary, D.E. 1998. Knowledge-Management Systems: Converting and Connecting. Intelligent
Systems and their Applications, IEEE, Volume 13, Issue 3, May/Jun 1998: 30-33. O’Leary, D.E. 2001. How Knowledge Reuse Informs Effective System Design and
Implementation. IEEE Intelligent Systems: 44-49. O’Leary, D.E. 2007. Empirical Analysis of the Evolution of a Taxonomy for Best Practices.
Decision Support Systems, 43: 1650 – 1663. O’Leary, D.E. 2008. Evolution of Knowledge Management Towards Enterprise Decision
Support: The Case of KPMG. in F. Bersein and C. Holsapple, Handbook on Decision
Support Systems, Springer. Patell, J.M. 1976. Corporate Forecasts of Earnings Per Share and Stock price Behavior:
Empirical Tests. Journal of Accounting Research 14: 246-274. Petersen, M. 2008. Estimating Standard Errors in Finance Panel Data Sets: Comparing
Approaches. Review of Financial Studies, Advance Access: 1-46. Polanyi, M. 1966. The Tacit Dimension. Routledge & Kegan Paul, London, UK. Przasnyski, Z. and L. Tai. 2002. Stock Performance of Malcolm Baldrige National Quality
Award Winning Companies. Total Quality Management 13: 475-488. Prokesch, S. 1997. Unleashing the Power of Learning: An Interview with British Petroleum’s
John Browne. Harvard Business Review, September – October. Schumpeter, J. 1934. The Theory of Economic Development: An Inquiry into Profits, Capital,
Credit, Interest and the Business Cycle. Cambridge, MA: Harvard University Press. Schultz, M. and L. Jobe. 2001. Codefication and Tacitness as Knowledge Management
Strategies: An Empirical Exploration. Journal of High Technology Management Research, 12: 139-165.

36
Stewart, T. 1999. Telling Tales at BP Amoco Knowledge Management at Work. Fortune, June 7. Wah, L. 1999. Behind the Buzz. Management Review 88: 16-26.

37
Table 1. MAKE Award Distribution by Year and Industry
Panel A reports the number of MAKEs awarded from 2001-2008 by industry for firms with available CRSP data, where industries are based on the Fama French (1997) 48 industry classification method. Panel B reports the number of MAKE awards by year.
Panel A: MAKE Awards by Industry
Industry MAKEs Awarded Percentage
Business Services 66 27
Computers 33 13
Automobiles and Trucks 32 13
Electronic Equipment 28 11
Petroleum and Natural Gas 24 10
Consumer Goods 13 5
Recreational Products 12 5
Construction 7 3
Miscellaneous 7 3
Medical Equipment 6 2
Banking 5 2
Pharmaceutical Products 3 1
Steel Works, Etc. 3 1
Chemicals 2 1
Machinery 2 1
Nonmetallic Mining 2 1
Telecommunications 1 <1
Transportation 1 <1
Total 247 100
Panel B: MAKE Awards by Year
Year N %
2001 12 5
2002 9 4
2003 22 9
2004 31 13
2005 41 17
2006 47 19
2007 38 15
2008 37 15
Total 247 100

38
Table 2. Descriptive Statistics
Descriptive statistics for distinct MAKE award winning firms with available Compustat data. All statistics are equally-weighted by firm, and dollar amounts are in millions. There are 46 distinct MAKE firms. Variable definitions: Stockholders' Equity (Compustat item SEQQ), Net Income (Compustat item NIQ), Total Assets (Compustat item ATQ), Sales (Compustat item SALEQ), Cash Flows from Operations (Compustat item OANCFY), Book-to-Market (Compustat items SEQQ/(PRCCQ*CSHOQ)), Return on Assets (Compustat items NIQ/ATQ), Cash Flows from Operations over Total Assets (Compustat items OANCFY/ATQ), and Return on Equity (Compustat items NIQ/SEQQ).
Mean Median Standard Deviation
25th Percentile
75th Percentile
Stockholders' Equity ($MM) 24,032 16,620 25,769 5,650 33,066
Net Income ($MM) 1,080 706 1,117 229 1,361
Total Assets ($MM) 121,925 34,396 271,851 14,367 95,482
Sales ($MM) 15,613 8,574 17,553 3,890 22,958
Cash Flows from Operations ($MM) 4,830 2,706 7,207 882 5,995
Market Value of Equity ($MM) 72,066 50,191 71,853 21,214 85,663
Book-to-Market 0.379 0.291 0.245 0.215 0.494
Return on Assets 0.024 0.019 0.020 0.009 0.038
Cash Flows from Operations/Assets 0.092 0.085 0.054 0.050 0.130
Return on Equity 0.065 0.047 0.084 0.028 0.075

39
Table 3. Market Reaction to Announcement for 247 MAKE Award Winners
Portfolio abnormal returns are the five-day cumulative abnormal returns surrounding the announcement day for 247 MAKE award winners using standard event study methodology (Binder, 1998). The CARs are computed as follows:
, where: ; ; and ; Rit is the return of
the sample firm i on day t; and E(Rit) is the corresponding market return from CRSP on day t. P-values are based on t-statistics computed using the time-series mean abnormal returns as in Brown and Warner (1980, 1985), and the calendar-time abnormal returns as in Jaffe (1974) and Mandelker (1974). We calculate the time-series t-statistic as follows:
, where: ; .
We calculate the calendar-time t-statistic as follows:
, where: ;
; and i, j are firm indices.
Portfolio-Level Abnormal Returns 1.25% p-value (time-series) (0.042)
p-value (calendar-time) (0.029)
2
[ 2, 2]
2
t
t
t
CAR AR=+
− +
=−
=∑1
1 ti N
t it
it
AR ARN
=
=
= ∑ ( )it it it
AR R E R= − ( 2, 1,0, 1, 2)t = − − + +
1/22 2
2
2 2
[ ]t t
t t
t t
t AR S AR=+ =+
=− =−
=
∑ ∑
6 22
244
[ ] 238t
t t
t
S AR AR AAR=−
=−
= −
∑
6
244
239t
t
t
AAR AR=−
=−
= ∑
( )[ 2 , 2 ][ 2, 2 ] CAARt CAAR S N− +− +=
SCAAR
[ −2,+2]
2 =1
N − 1AR
tt=−2
t=+2
∑
i
−1
NAR
tt=−2
t=+2
∑
jj=1
N
∑
i=1
N
∑2
CAAR[−2,+2]
=1
NAR
tt=−2
t=+2
∑
j=1
N
∑

40
Table 4. Relation Between Future Performance and Abnormal Returns around the MAKE Announcement
Panel A reports descriptive statistics for the future performance of MAKE winning firms over the year following the quarter in which the MAKE is awarded. Panel B reports results from estimating a model of FuturePerformanceif , defined as ROA, ROE, and CFO for firm i over future period f , regressed on firm-level cumulative abnormal return, CAR, during the five days surrounding the MAKE award announcement (-2,+2). Period f refers to the average of the future four quarters following the quarter in which the MAKE award is received.. Where less than four quarters of data are available we use all available quarters. CAR is computed as follows:
, where: ; ; and ; Rit is the return of
the sample firm i on day t; and E(Rit) is the corresponding market return from CRSP on day t. The expected performance variable, ExpectedPerformanceif, is expected ROA, ROE, and CFO for firm i over future period f, calculated as the I/B/E/S consensus analyst annual earnings per share forecast divided by four (because our dependent variable is average quarterly performance), scaled by total assets per share or by stockholders’ equity per share for expected ROA or expected ROE, respectively. Expected Cash Flows from Operations are the I/B/E/S consensus analyst forecast of annual cash flows from operations per share divided by four (because our dependent variable is average quarterly performance), scaled by total assets per share. Total assets and stockholders’ equity are measured during the quarter in which the MAKE award is announced or, in the case of missing data, the quarter with data immediately before the MAKE winning quarter. P-values are in parentheses. Regression residuals are clustered by firm and year to control for potential cross-sectional and time-series correlation.
1
1
Model 1 : FuturePerformance = + CAR +
Model 2 : FuturePerformance = + CAR + ExpectedPerformance
α β ε
α β ε+
if i it if
if i it if if
Panel A: Descriptive Statistics
Mean Median
Standard Deviation
25th Percentile
75th Percentile N
Future Return on Assets 0.029 0.025 0.024 0.011 0.044 202
Future Return on Equity 0.062 0.056 0.046 0.034 0.086 202 Future Cash Flows from Operations over Assets
0.101 0.097 0.057 0.061 0.138 202
Expected Return on Assets 0.025 0.020 0.017 0.012 0.039 195
Expected Return on Equity 0.056 0.046 0.041 0.029 0.071 195 Expected Cash Flows from Operations over Assets
0.034 0.031 0.019 0.018 0.046 170
Panel B: Regression of Future Performance on Abnormal Returns around the MAKE Award Announcement Date
Dependent Variable
Predicted
Sign Future Return on Assets Future Return on Equity Future Cash Flows from Operations over Assets
Model 1 Model 2 Model 1 Model 2 Model 1 Model 2
Intercept 0.029 0.004 0.062 0.013 0.101 0.042
(<0.001) (0.042) (<0.001) (0.001) (<0.001) (<0.001)
CAR + 0.108 0.069 0.169 0.151 0.211 0.031
(0.004) (0.009) (0.026) (0.001) (0.013) (0.378)
Expected Performance
+ 1.034 0.873 1.809
(<0.001) (<0.001) (<0.001)
N 202 195 202 195 202 170
R2 0.030 0.561 0.020 0.625 0.021 0.392
2
[ 2, 2]
2
t
t
t
CAR AR=+
− +
=−
=∑1
1 ti N
t it
it
AR ARN
=
=
= ∑ ( )it it it
AR R E R= − ( 2, 1,0, 1, 2)t = − − + +
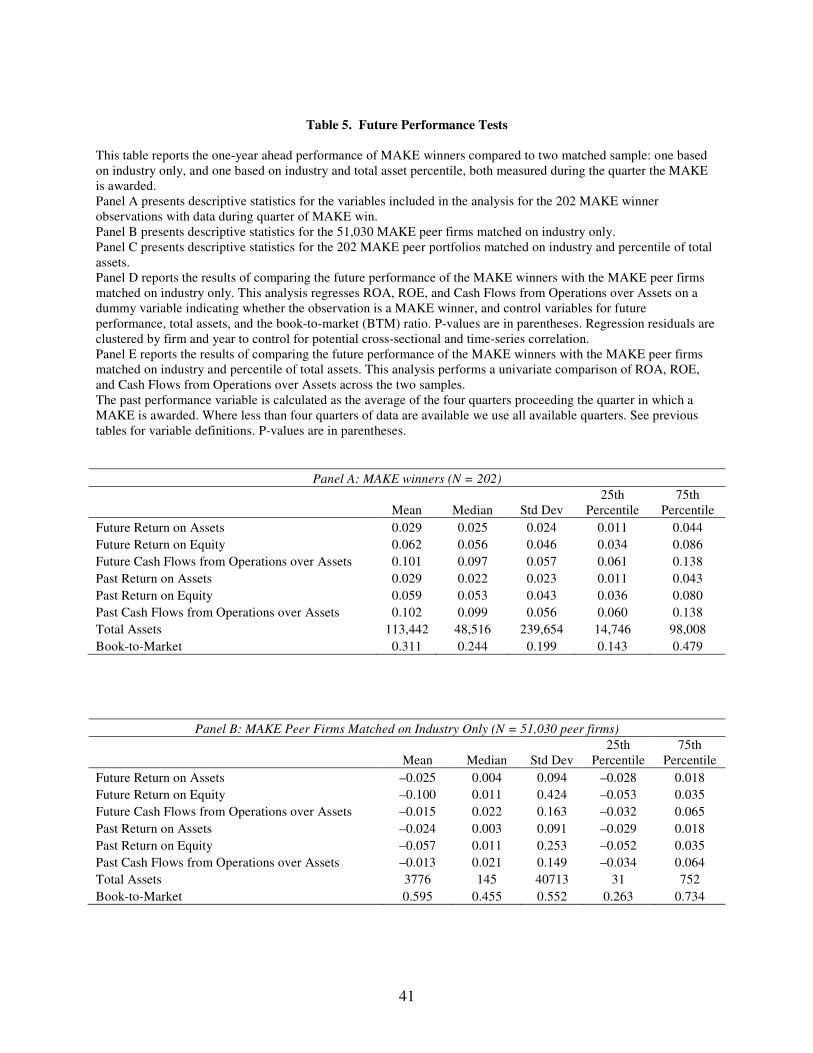
41
Table 5. Future Performance Tests
This table reports the one-year ahead performance of MAKE winners compared to two matched sample: one based on industry only, and one based on industry and total asset percentile, both measured during the quarter the MAKE is awarded. Panel A presents descriptive statistics for the variables included in the analysis for the 202 MAKE winner observations with data during quarter of MAKE win. Panel B presents descriptive statistics for the 51,030 MAKE peer firms matched on industry only. Panel C presents descriptive statistics for the 202 MAKE peer portfolios matched on industry and percentile of total assets. Panel D reports the results of comparing the future performance of the MAKE winners with the MAKE peer firms matched on industry only. This analysis regresses ROA, ROE, and Cash Flows from Operations over Assets on a dummy variable indicating whether the observation is a MAKE winner, and control variables for future performance, total assets, and the book-to-market (BTM) ratio. P-values are in parentheses. Regression residuals are clustered by firm and year to control for potential cross-sectional and time-series correlation. Panel E reports the results of comparing the future performance of the MAKE winners with the MAKE peer firms matched on industry and percentile of total assets. This analysis performs a univariate comparison of ROA, ROE, and Cash Flows from Operations over Assets across the two samples. The past performance variable is calculated as the average of the four quarters proceeding the quarter in which a MAKE is awarded. Where less than four quarters of data are available we use all available quarters. See previous tables for variable definitions. P-values are in parentheses.
Panel A: MAKE winners (N = 202)
Mean Median Std Dev 25th
Percentile 75th
Percentile
Future Return on Assets 0.029 0.025 0.024 0.011 0.044
Future Return on Equity 0.062 0.056 0.046 0.034 0.086
Future Cash Flows from Operations over Assets 0.101 0.097 0.057 0.061 0.138
Past Return on Assets 0.029 0.022 0.023 0.011 0.043
Past Return on Equity 0.059 0.053 0.043 0.036 0.080
Past Cash Flows from Operations over Assets 0.102 0.099 0.056 0.060 0.138
Total Assets 113,442 48,516 239,654 14,746 98,008
Book-to-Market 0.311 0.244 0.199 0.143 0.479
Panel B: MAKE Peer Firms Matched on Industry Only (N = 51,030 peer firms)
Mean Median Std Dev 25th
Percentile 75th
Percentile
Future Return on Assets –0.025 0.004 0.094 –0.028 0.018
Future Return on Equity –0.100 0.011 0.424 –0.053 0.035
Future Cash Flows from Operations over Assets –0.015 0.022 0.163 –0.032 0.065
Past Return on Assets –0.024 0.003 0.091 –0.029 0.018
Past Return on Equity –0.057 0.011 0.253 –0.052 0.035
Past Cash Flows from Operations over Assets –0.013 0.021 0.149 –0.034 0.064
Total Assets 3776 145 40713 31 752
Book-to-Market 0.595 0.455 0.552 0.263 0.734

42
Table 5. Continued
Panel C: MAKE Peer Firms Matched on Industry and Asset Percentile (N = 202 peer portfolios)
Mean Median Std Dev 25th
Percentile 75th
Percentile
Future Return on Assets 0.015 0.014 0.011 0.008 0.020
Future Return on Equity 0.031 0.037 0.040 0.019 0.049
Future Cash Flows from Operations over Assets 0.065 0.062 0.027 0.049 0.077
Total Assets 95,152 39,363 173,375 13,489 129,801
Book-to-Market 0.816 0.443 2.061 0.352 0.578
Panel D: Regression of Future Performance for MAKE winners (N = 202) and MAKE Peer Firms Matched on
Industry Only (N = 51,030 peer firms)
FuturePerformance
it= α
i+ β
1Winner + β
2PastPerformance
it+ β
3Assets
it+ β
4BTM + ε
it
Dependent Variable
Future Return on Assets Future Return on Equity Future Cash Flows from Operations over Assets
Intercept –0.006 –0.059 –0.004
(<0.001) (<0.001) (<0.001)
Winner 0.015 0.066 0.020
(<0.001) (<0.001) (<0.001)
Past Performance 0.678 0.723 0.814
(<0.001) (<0.001) (<0.001)
Assets (in billions) 2.010E–05 1.134E–04 1.430E–05
(<0.001) (<0.001) (<0.001)
Book-to-Market –5.205E–03 3.663E–04 –7.786E–04
(<0.001) (0.936) (0.502)
N 51232 51232 51232
R2 0.432 0.187 0.561
Panel E: Univariate Analysis of Future Performance MAKE Winners (N =202) Compared with MAKE Peer Firms
Matched on Industry and Percentile of Total Assets (N = 202)
Knowledge
Management Firms
Knowledge Management Peer
Portfolios Difference in
Means Wilcoxon Sign Ranked Test
Future Performance Measure mean median mean median p-value p-value
Future Return on Assets 0.029 0.025 0.014 0.014 (<0.001) (<0.001)
Future Return on Equity 0.062 0.056 0.021 0.037 (<0.001) (<0.001)
Future Cash Flows from Operations over Assets
0.101 0.097 0.067 0.062 (<0.001) (<0.001)

43
Panel A: The Magnitude of Analyst Forecast Revisions (N = 183)
1 1
1
t t
t
+ −
−
Consensus EPS Forecast - Consensus EPS Forecast
Consensus EPS Forecast
Mean analyst forecast revision during month following the MAKE award month relative to the month prior to MAKE award month 0.028
P-value (0.027)
Table 6. Analyst Forecast Revisions Following MAKE award
Panel A reports the number of upward and downward I/B/E/S analyst revisions of annual EPS forecasts during month t+1, where month t is the month in which the MAKE is awarded. Panel B reports the average of each firm's proportion of revising analysts who revise their annual EPS forecast upward during month t+1. The p-values under the mean and median correspond to one-tailed t-tests and Wilcoxon Sign tests, respectfully, in accordance with our prediction that the consensus forecast revisions are positive, that the mean number of upward revisions is higher than the mean number of downward revisions, and that the proportion of upward to total revisions exceeds 50%. Panel C reports the relative change in magnitude of the mean consensus annual EPS forecast from month t–1 to month t+1. The p-values, in parentheses, correspond to a one-sample t-test and a Wilcoxon Sign test for the mean and median, respectively. Panel D reports a comparison in the change of the mean consensus annual EPS forecast from month t–1 to month t+1 between MAKE winning firms and a control group of peer firms matched on same industry, year, quarter, and percentile of total assets.
Panel B: The Direction of Analyst Forecast Revisions (N =190)
1
1
Number of Upward RevisionsMeasure 1 =
Number of Awards
Number of Downward RevisionsMeasure 2 =
Number of Awards
+
+
t
t
Mean number of analysts per MAKE winner that revise upward (Measure 1) 3.037
Mean number of analysts per MAKE winner that revise downward (Measure 2) 1.900
P-value for difference in means (0.009)
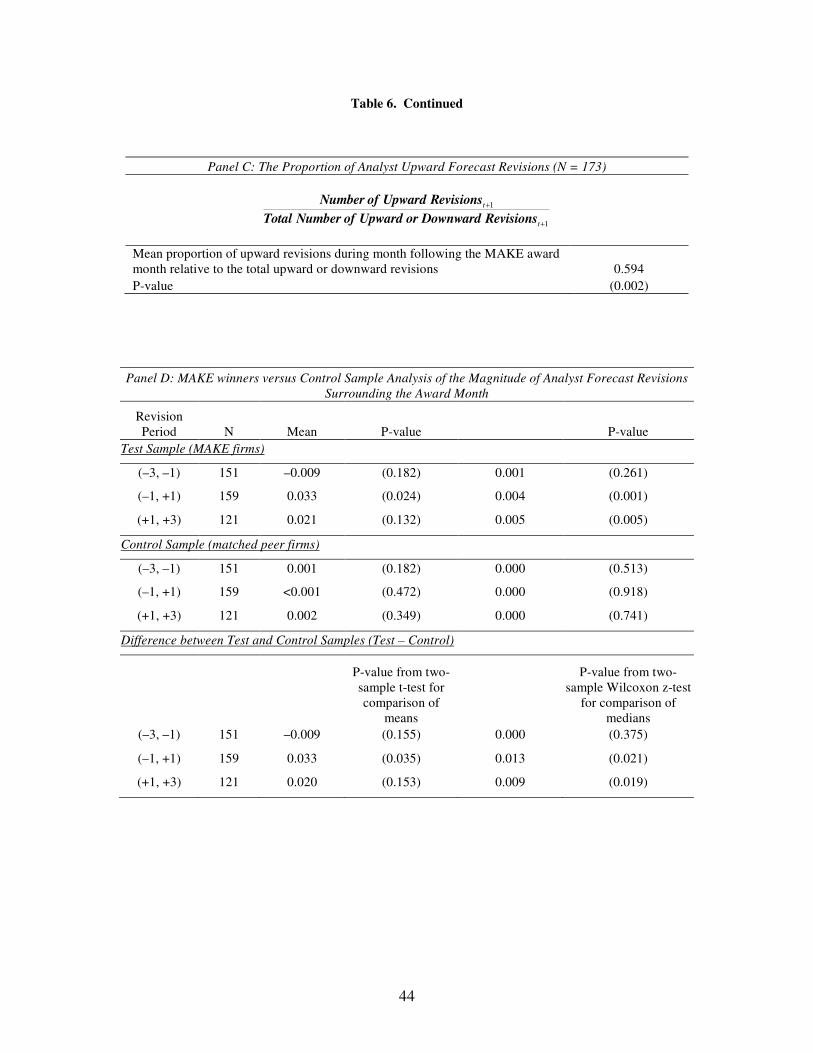
44
Table 6. Continued
Panel D: MAKE winners versus Control Sample Analysis of the Magnitude of Analyst Forecast Revisions
Surrounding the Award Month
Revision Period N Mean P-value P-value
Test Sample (MAKE firms)
(–3, –1) 151 –0.009 (0.182) 0.001 (0.261)
(–1, +1) 159 0.033 (0.024) 0.004 (0.001)
(+1, +3) 121 0.021 (0.132) 0.005 (0.005)
Control Sample (matched peer firms)
(–3, –1) 151 0.001 (0.182) 0.000 (0.513)
(–1, +1) 159 <0.001 (0.472) 0.000 (0.918)
(+1, +3) 121 0.002 (0.349) 0.000 (0.741)
Difference between Test and Control Samples (Test – Control)
P-value from two-sample t-test for comparison of
means
P-value from two-sample Wilcoxon z-test
for comparison of medians
(–3, –1) 151 –0.009 (0.155) 0.000 (0.375)
(–1, +1) 159 0.033 (0.035) 0.013 (0.021)
(+1, +3) 121 0.020 (0.153) 0.009 (0.019)
Panel C: The Proportion of Analyst Upward Forecast Revisions (N = 173)
Mean proportion of upward revisions during month following the MAKE award month relative to the total upward or downward revisions 0.594
P-value (0.002)
1
1
t
t
+
+
Number of Upward Revisions
Total Number of Upward or Downward Revisions

45
Table 7. Future Abnormal Returns for Portfolios Constructed on MAKE Winners
This table reports results from estimating future abnormal returns for portfolios constructed on MAKE winners during 2001-2008. Portfolios are constructed on July 1st of each year, and include all MAKE winners during the preceding 12 months. Monthly return data are obtained from CRSP, and portfolio monthly returns are calculated each month as the equally-weighted monthly returns for all firms in the portfolio. Portfolios are rebalanced every year, and portfolio monthly returns in excess of the monthly risk-free rate, (Ret –
Rf)pm, are regressed on the four Fama-French and Momentum factors: Excess Return on the Market (MKT), Small-Minus-Big Return (SMB), High-Minus-Low Return (HML), and Momentum (MOM). The monthly risk-free rate is the return on the one month Treasury Bill.
(Ret – Rf)pm = αp + β1MKT + β2SMB + β3HML + β4MOM + εpm
Variable Coefficient t-statistic p-value
Intercept 0.009 2.870 0.005
MKT 1.292 14.870 (<0.001)
SMB 0.012 0.100 0.922
HML –0.663 –4.820 (<0.001)
MOM 0.007 0.090 0.926
No. of months with returns 90
Adj R-Sq 0.813

46
Figure 1. Timeline for Test of Future Risk-Adjusted Returns for Portfolios Constructed on MAKE Winners
The figure plots the timeline for the analysis of one-year ahead abnormal returns for portfolios constructed on MAKE winners. The first portfolio, constructed on July 1, 2001, includes all firms that receive a MAKE award during the prior 6 months. Portfolios are reconstructed on July 1 of each year t based on KM award winners during the prior 12 months. Our sample includes the monthly observations from July 2001 through December 2008 (N = 90). Each firm’s monthly returns are obtained from the CRSP Monthly Stock File, and the monthly portfolio returns are obtained by averaging all firms’ returns in each month during the test period. The monthly portfolio returns are regressed on the four Fama-French and Momentum factors: excess return on the market (MKT), Small-Minus-Big Return (SMB), High-Minus-Low Return (HML), and Momentum Factor (MOM).

47
APPENDIX A
This appendix provides a summary explanation of each of the eight criteria used by the expert panelists to determine the MAKE winners, extracted and paraphrased from Asian Productivity Organization (2007). These are the activities and characteristics that the MAKE award organizers expect to distinguish companies that are successful at KM.
1. Creating a Knowledge-Driven Enterprise Culture A logical first question in evaluating knowledge management is to ask: Do we have the type of organizational culture that rewards knowledge-driven activities? Many organizations are very old and were created in an industrialized age. Newer companies like Google, Yahoo and Microsoft were formed in different times with different characteristics. Issues to consider with respect to culture include: How does an organization hire people? What are the attributes one is looking for? What are the behaviors, attitudes and skills? Does the organization have a knowledge sharing, collaborative environment already in place? How innovative is the organization? Does the organization listen to customers? Does the organization reward people for sharing knowledge? 2. Developing Knowledge Workers through Senior Management Leadership Companies that are successful at managing knowledge tend to have senior management teams that are devoted to knowledge-driven activities. Many organizations have created a post called the “Chief Knowledge Officer,” or “Chief Information Officer,” which acts as a focal point and a way by which organizations can vividly demonstrate that knowledge is a critical activity within the business. 3. Delivering Knowledge-Based Products/Services/Solutions The third area refers to innovation, which takes many forms. It may simply be new product development that is taking current products, ideas or solutions and changing them slightly. Alternatively, an organization could devote major resources to the development of new innovative products. It is not necessarily just innovation regarding products and services. Firms may also be innovative internally, such as creating innovative processes for logistics. For example, Dell is a company that is very innovative in its ability to use the Internet and logistics services to build computers for customers on demand. 4. Maximizing Enterprise Intellectual Capital The fourth area is maximizing enterprise intellectual capital. Intellectual capital can be the value of an organization’s brand or brands. It can also be patents, copyrights, trademarks, proprietary processes or those core abilities of an organization which separate it from its competitors or from other organizations. A challenge for companies in this area is identifying what intellectual capital they have. Companies that are able to manage their intellectual capital are expected to be successful in the future.

48
5. Creating an Environment for Collaborative Knowledge Sharing The fifth area is creating a collaborative environment. Many companies spend considerable resources to create IT platforms and ways to transform tacit knowledge into explicit knowledge. These include tools such as “After Action Reviews” (used by Buckman Laboratories) which are mechanisms for learning and sharing best practices. In the early days of KM, this was an area where many companies worked very hard to differentiate themselves. Today, it is almost a given that if an organization is not able to collaborate, share and re-use knowledge effectively it will not be able to compete in its marketplace. 6. Creating a Learning Organization Organizational learning is a key characteristic of leading knowledge-driven organizations. Organizational learning includes corporate memory, which is the accumulated knowledge of how companies do business. It also includes the ability to give employees skills and competencies that allow them to be innovative, to be creative and to deal with customers intelligently. The objective is to avoid following a traditional learning curve when faced with a new problem or opportunity. Instead, learning organizations have a workforce that is trained to deal with the next problem and able to create the next new product. 7. Creating Value based on Customer Knowledge The seventh area is creating value based on customer knowledge. This is more than just customer satisfaction and customer information. This is an ability to create relationships with customers, where Toyota Motor Corporation or Sony are examples of success in this area. It is being able to understand how customers use a product, what their needs are and what their expectations are. Creating value based on customer knowledge is the ability to understand the customers’ needs and to create a revenue stream from a customer or customers. 8. Transforming Enterprise Knowledge into Organizational Wealth While the first seven criteria above are the input criteria, the eighth area is essentially output. It is the overall ability of the organization to transform the knowledge and capabilities of its people and processes into either shareholder wealth or some similar form of wealth creation. Many organizations are good at several of the seven characteristics I have named. They might be good at marketing, they might be good at product development or they might be a learning organization. But it is extremely difficult to integrate all seven of those such that the output of an organization’s abilities is maximized.

49
APPENDIX B
Siemens ShareNet
In the late 1990’s Siemens began implementing knowledge management as a means of
responding to increasing competition and deregulation.17 Siemens had recognized that so-called
“knowledge islands” had developed within their organization based on organizational and
hierarchical barriers; business, process, project and functional barriers; and local time, culture
and language barriers. As a result, Siemens had “poor reuse” of solutions generated for
customers and there was “limited” best practice sharing in sales. In order to mitigate these
limitations, Siemens took the approach of generating support for “knowledge communities” that
cut across and integrated those many knowledge islands. In addition, they set out to capture and
disseminate their best practices across Siemens world-wide organization.
The core idea was that knowledge management initially would focus on sales and
marketing. Siemens saw that countries in similar stages of economic development and regulatory
environments would have similar needs. They also noted that as markets developed, solutions
could be leveraged from more economically developed countries to developing countries. As a
result, they developed a system that allowed users to enter best practices in the form of
“solutions objects” and “environmental objects.” In addition, the system permitted “urgent
requests” that allowed sales people to ask other sales people if they had a solution for a specific
problem.
The resulting system allowed Siemens to address questions such as “What sales deals
have we lost or won recently?” “Why and how did we win them?” and “Who in Siemens is the
17 This example is taken from Ewing (2001), MacCormack (2002) Nielsen and Ciabuschi (2003), and Ramhorst (2003).

50
expert on a specific topic?” Ultimately, in the fiscal year 2000-2001, the system resulted in an
incremental $122 million in revenue at a system cost of $7.8 million.
British Petroleum
Sir John Browne, CEO of British Petroleum (BP), in acknowledging the success of BP’s
KM initiatives that were implemented in the mid-1990’s, stated "In order to generate
extraordinary value for shareholders, a company has to learn better than its competitors and
apply that knowledge throughout its businesses faster and more widely than they do. The way we
see it, anyone in the organization who is not directly accountable for making a profit should be
involved in creating and distributing knowledge that the company can use to make a profit."
(Prokesch, 1997)
In 1992, BP was top heavy with bureaucracy and facing bankruptcy (Roberts 2005). In
response, BP decentralized and downsized, which resulted in what the company refers to as “lost
knowledge” (Milton and Palen, 2000). In an attempt to leverage the remaining knowledge in
their organization, BP instituted a KM initiative that set up a number of technical, functional and
commercial networks, as well as a series of informal networks based on employee interests.
These networks encompassed a number of technological and organizational approaches designed
to facilitate employee learning from others within the company, cooperation, and learning from
those outside the company (Berzins et al., 1998). For example, there were formal operations
management networks that were designed to accelerate or increase production, and train and
deploy new operators. Networks also were used to capture informal “communities of interest”
across different units with virtual meetings. According to BP, this change in organization design
reportedly resulted in a bottom line increase of $260 million in a singe year (Stewart, 1999).

51
By 2000 BP had more than 50 formal networks and roughly 300 informal networks with
the explicit goal of generating and capturing knowledge (Milton and Palen, 2000). BP’s KM
initiative also included the institution of an intranet system to facilitate sharing data, information
and knowledge. Search engines were used to facilitate access to the substantial digital resources
that were generated, and a “who is who” feature, called “connect” was developed so that
employees could easily access others in the organization with the knowledge needed for a given
application. Among other things, the contact pages included the employees area of expertise, and
at one point in time, more than 12,000 employees were in the “connect” network (Stewart,
1999).
A particularly successful feature of BP’s efforts to “learn from others within the
company” was accomplished by what were termed “peer assists.” Peer assists consisted of
members of the staff in one business unit helping those in another business unit. Peer groups
were formed that consisted of confederations of business units that faced similar problems, who
benchmarked each other. For example, a Dutch refinery got a “peer assist” two-day meeting that
ended up resulting in knowledge acquisition that saved the refinery $9 million. Cooperation from
business units, exemplified by peer assists is grounded in the spirit of commitment to long-term
improvement. Each business unit benchmarks itself against key best practices using an
assessment tool. Good practices are shared and tools and requests are made available through an
intranet community of interest network.