to gas - diva portal352935/fulltext01.pdf · coffee husk remained for the case of 900°c whereas...
TRANSCRIPT
Biomass Energy Systems and
Resources in Tropical Tanzania
Lugano Wilson
F
F
F
1
4 2
7
38
9
1213
1615
11
20
21
6
14
22
5
O2
N2
10
18
1719
To data acquisition
system
To gas
analyzers
Licentiate Thesis in Furnace Technology
Stockholm, Sweden 2010

ii
Biomass Energy Systems and Resources in Tropical Tanzania
Lugano Wilson
Licentiate Thesis
Stockholm 2010 Royal Institute of Technology
School of Industrial Engineering and Management Department of Material Science and Engineering
Division of Energy and Furnace Technology SE-100 44 Stockholm
Sweden
Akademisk avhandling som med tillstånd av Kungliga Tekniska Högskolan I Stockholm framlägges för offentlig granskning för avläggande av teknologie
licentiatexamen fredagen den 17 September 2010, kl. 10 i sal B1, Brinellvägen 23, Kungliga Tekniska Högskolan, Stockholm.
ISRN KTH/MSE--10/44--SE+ENERGY/AVH
ISBN 978-91-7415-732-1

iii
Lugano Wilson. Biomass Energy Systems and Resources in Tropical Tanzania
Royal Institute of Technology School of Industrial Engineering and Management Department of Material Science and Engineering
Division of Energy and Furnace Technology SE-100 44 Stockholm
Sweden
ISRN KTH/MSE--10/44--SE+ENERGY/AVH
ISBN 978-91-7415-732-1
© The author
iv
ABSTRACT
Tanzania has a characteristic developing economy, which is dependent on
agricultural productivity. About 90% of the total primary energy consumption of
the country is from biomass. Since the biomass is mostly consumed at the
household level in form of wood fuel, it is marginally contributing to the
commercial energy supply. However, the country has abundant energy
resources from hydro, biomass, natural gas, coal, uranium, solar, wind and
geothermal. Due to reasons that include the limited technological capacity, most
of these resources have not received satisfactory harnessing. For instance: out
of the estimated 4.7GW macro hydro potential only 561MW have been
developed; and none of the 650MW geothermal potential is being harnessed.
Furthermore, besides the huge potential of biomass (12 million tons of oil
equivalent), natural gas (45 million cubic metres), coal (1,200 million tones), high
solar insolation (4.5 – 6.5 kWh/m2), 1,424km of coastal strip, and availability of
good wind regime (> 4 m/s wind speed), they are marginally contributing to the
production of commercial energy. Ongoing exploration work also reveals that the
country has an active system of petroleum and uranium. On the other hand, after
commissioning the 229km natural gas pipeline from SongoSongo Island to Dar
es Salaam, there are efforts to ensure a wider application in electricity
generation, households, automotive and industry.
Due to existing environmental concerns, biomass resource is an attractive future
energy for the world, Tanzania inclusive. This calls for putting in place
sustainable energy technologies, like gasification, for their harnessing. The high
temperature gasification (HTAG) of biomass is a candidate technology since it
has shown to produce improved syngas quality in terms of gas heating value that
has less tar.
This work was therefore initiated in order to contribute to efforts on realizing a
commercial application of biomass in Tanzania. Particularly, the work aimed at
establishing characteristic properties of selected biomass feedstock from
Tanzania. The characteristic properties are necessary input to thermochemical

v
process designers and researchers. Furthermore, since the properties are origin-
specific, this will provide baseline data for technology transfer from north to south.
The characteristic properties that were established were chemical composition,
and thermal degradation behaviour. Furthermore, laboratory scale high
temperature gasification of the biomasses was undertaken.
Chemical composition characteristics was established to palm waste, coffee
husks, cashew nut shells (CNS), rice husks and bran, bagasse, sisal waste,
jatropha seeds, and mango stem. Results showed that the oxygen content
ranged from 27.40 to 42.70% where as that of carbon and hydrogen ranged from
35.60 to 56.90% and 4.50 to 7.50% respectively. On the other hand, the
elemental composition of nitrogen, sulphur and chlorine was marginal. These
properties are comparable to findings from other researchers. Based on the
results of thermal degradation characteristics, it was evident that the cashew nut
shells (CNS) was the most reactive amongst the analyzed materials since during
the devolatilization stage the first derivative TG (DTG) peak due to hemicellulose
degradation reached (-5.52%/minute) compared palm stem whose first peak was
-4.81%/minute. DTG first peak for the remaining materials was indistinct.
Results from the laboratory gasification experiments that were done to the coffee
husks showed that gasification at higher temperature (900°C) had an overall
higher gasification rate. For instance, during the inert nitrogen condition, 7% of
coffee husk remained for the case of 900°C whereas the residue mass for the
gasification at 800 and 700°C was 10 and 17% respectively. Steam injection to
the biomass under high temperature gasification evolved the highest volumetric
concentration of carbon monoxide. The CO peak evolution at 900°C steam only
was 23.47 vol. % CO whereas that at 700°C was 21.25 vol. % CO.
Comparatively, the CO peaks for cases without steam at 900°C and 2, 3, and 4%
oxygen concentrations were 4.59, 5.93, and 5.63% respectively. The reaction
mechanism of coffee husks gasification was highly correlated to zero reaction
order exhibiting apparent activation energy and the frequency factor 161 kJ/mol
and 3.89x10⁴/minute respectively.

vi
ACKNOWLEDGEMENT
The Swedish International Development Cooperation Agency (SIDA) through the
Department for Research Cooperation (SAREC) is acknowledged for the financial
support through the Capacity Building Project at the College of Engineering and
Technology (CoET) of the Universality of Dar es Salaam, Tanzania. Additional
financial support came from the Swedish Research Council (Vetenskapsrådet),
which is highly acknowledged.
My Supervisors at KTH, Prof. Weihong Yang and Wlodzimierz Blasiak, including
those at the University of Dar es Salaam, Prof. Geoffrey R. John and Cuthbert F.
Mhilu are acknowledged for their academic support throughout the study period.
Life at KTH and Stockholm in general was interesting through the social
interaction and academic challenges from my colleagues at the Division of
Energy and Furnace Technology: Aliaksandr Alevanau, Amit Kumar Biswas,
Xiaolei Zhang, Owden Robert Mwaikondela, Pawel Donaj, Lan Zhang, Efthymios
Kantarelis, and Qingli Zhang.
The continued moral support from my family and family members is highly
appreciated as it was the main foundation leading to this output. Unfortunately, it
is not possible to mention all those who contributed to this work, in one form or
another, I am taking this opportunity to thank all of you. May the blessing of our
Almighty God be extended to you, THANK YOU!

vii
To my Wife Grace (Mandiga) and our beloved children: Priscilla (Lahabu),
Maureen, and Joylyn

viii
Papers Included in the Thesis Supplement 1: Lugano Wilson, Geoffrey R. John, Cuthbert F. Mhilu,
Weihong Yang, and Wlodzimierz Blasiak, (2010) “Coffee
Husks Gasification Using High Temperature Air/Steam
Agent”, Fuel Processing Technology, Volume 91, Issue
10, pp. 1330 – 1337
Supplement 2: Lugano Wilson, Weihong Yang, Wlodzimierz Blasiak,
Geoffrey R. John, Cuthbert F. Mhilu, (2010), “Thermal
Characterization of Tropical Biomass Feedstocks”, Energy
Conversion and Management, doi:10.1016/
j.enconman.2010.06.058
Papers not Included in the Thesis
1. L. Wilson, G. R. John, C. F. Mhilu, W. Yang, and W.
Blasiak; (2009), “Combustion Characteristics of Cashew
Nut Shells and Coffee Husks by Thermogravimetry and
Calorimetry”, 17th European Biomass Conference &
Exhibition, 29th June – 3rd July, CCH - Congress Center
Hamburg, Germany
2. L. Wilson, G. R. John and C. F. Mhilu; (2008), “Thermal
Characteristics of Sugar Cane Bagasse with Storage”, The
9th Asia-Pacific International Symposium on Combustion
and Energy Utilization, 2nd – 6th November, Beijing, China
3. L. Wilson, W. Yang, W. Blasiak, G. R. John and C. F.
Mhilu; (2007), “Opportunities and Challenges of Biomass
Energy for Heat and Power Production in Tanzania”. 3rd
International Green Energy Conference, 18th – 20th June,
Västerås, Sweden
The author is the main contributor to the supplemented papers whereas co-
authors provided the necessary support in literature, experimental design, and
interpretation.

ix
TABLE OF CONTENTS
ABSTRACT .........................................................................................................IV
ACKNOWLEDGEMENT ......................................................................................VI
LIST OF TABLES ................................................................................................XI
LIST OF FIGURES ..............................................................................................XI
ABBREVIATIONS ..............................................................................................XII
SYMBOLS .........................................................................................................XIII
1 INTRODUCTION ............................................................................................ 1
1.1 ENERGY BALANCE ......................................................................... 1
1.2 POTENTIAL ENERGY RESOURCES .................................................... 3
1.2.1 Hydropower ................................................................................. 3
1.2.2 Natural Gas ................................................................................. 5
1.2.3 Biomass ....................................................................................... 5
1.2.4 Coal ............................................................................................. 9
1.2.5 Solar ............................................................................................ 9
1.2.6 Wind .......................................................................................... 10
1.2.7 Geothermal ................................................................................ 11
1.2.8 Tidal and Wave .......................................................................... 12
1.2.9 Petroleum Oil and Uranium Exploration .................................... 13
1.3 ELECTRICITY GENERATION MIX ..................................................... 15
1.4 BIOMASS COGENERATION ............................................................. 18
1.4.1 Kilombero Sugar Company........................................................ 18
1.4.2 Mtibwa Sugar Estate Limited ..................................................... 18
1.4.3 Tanganyika Planting Company Limited (TPC) ........................... 19
1.4.4 Kagera Sugar Limited (KASC) ................................................... 19
1.4.5 Saohill Sawmill .......................................................................... 19
1.4.6 Tanganyika Wattle Company (TANWAT) .................................. 20
1.5 ELECTRICITY DEMAND .................................................................. 21
1.6 ELECTRICITY DISTRIBUTION AND DISTRIBUTION NETWORK .............. 22
2. LITERATURE REVIEW ................................................................................ 23
x
2.1 BIOMASS GASIFICATION ................................................................ 23
2.2 HIGH TEMPERATURE AIR/STEAM GASIFICATION (HTAG) ................. 24
2.3 EFFECTS OF HEATING RATE AND TEMPERATURE ............................ 25
3. OBJECTIVES ............................................................................................... 26
4. METHODOLOGY ......................................................................................... 27
4.1 CHEMICAL COMPOSITION .............................................................. 27
4.2 THERMAL DEGRADATION CHARACTERISTICS .................................. 27
4.3 LABORATORY EXPERIMENTATION .................................................. 28
5. RESULTS AND DISCUSSION ..................................................................... 30
5.1 CHEMICAL COMPOSITION OF TROPICAL BIOMASSES........................ 30
5.2 THERMAL DEGRADATION OF TROPICAL BIOMASSES ........................ 34
5.2.1 Mass Loss Characteristics ......................................................... 34
5.2.2 Rate of Mass Loss Characteristics ............................................. 35
5.2.3 Burnout Temperature ................................................................. 37
5.3 LABORATORY GASIFICATION OF COFFEE HUSKS ............................ 38
5.3.1 Effects of Gasification Agent on Heating Rate ........................... 38
5.3.2 Gasification Rate ........................................................................ 39
5.3.3 Syngas Evolution ....................................................................... 43
5.3.4 Syngas Heating Value ............................................................... 49
5.3.5 Estimation of Coffee Husks Kinetic Parameters......................... 51
6. CONCLUSION .............................................................................................. 53
7 FUTURE WORK ........................................................................................... 54
REFERENCES .................................................................................................... 55

xi
LIST OF TABLES
Table 1: Petroleum fuels importation detail .......................................................... 2
Table 2: Planned Macro hydropower plants ........................................................ 4
Table 3: Existing small-scale hydropower schemes ............................................ 4
Table 4: Waste generated (Tones) in Tanzania Cities ......................................... 8
Table 5: Wind stations with annual mean wind speeds ≥ 4.5 m/s ..................... 10
Table 6: Oil and gas exploration companies ..................................................... 14
Table 7: Installed generation capacity and source ............................................. 17
Table 8: Potential additional cogeneration capacity ........................................... 21
Table 9: Tropical biomasses chemical composition ............................................ 31
Table 10: Mass loss summary ............................................................................ 35
Table 11: Material’s characteristic properties summary ...................................... 36
Table 12: Residue mass summary for steam injected experiments .................... 41
Table 13: CO evolution characteristics summary ................................................ 48
Table 14: Syngas composition summary ............................................................ 51
LIST OF FIGURES
Figure 1: Geothermal potential sites in Tanzania ............................................... 12
Figure 2: Installed generation capacity and share (%) by source ....................... 16
Figure 3: Electricity generation and consumption, million kWh ......................... 22
Figure 4: Existing and proposed grid and isolated transmission system ........... 23
Figure 5: The high temperature gasification test rig ............................................ 29
Figure 6: Coalification diagram for the tropical biomasses .................................. 33
Figure 7: TG thermogram characteristics based on the coffee husks sample .... 34
Figure 8: Material‟s characteristic properties based on palm stem degradation . 37
Figure 9: Sample temperature profiles ................................................................ 40
Figure 10: Gasification rate under different experimental conditions .................. 42
Figure 11: Syngas (CO/CO2) evolution profiles ................................................... 47
Figure 12: Syngas evolution profiles ................................................................... 50
Figure 13: ln[g(α)/T2] versus 1/T for 900°C N2 condition experiment .................. 53

xii
ABBREVIATIONS
AVGAS Aviation Gasoline
CNG Compressed Natural Gas
CNS Cashew Nut Shells
DSC Differential Scanning Calorimetry
DTG Derivative TG
GC Gas Chromatograph
GDP Gross Domestic Product
GEF Global Environmental Fund
HHV Higher Heating Value (Gross Calorific Value)
HiTAC High Temperature Combustion
HTAG High Temperature Air/Steam Gasification
IEA International Energy Agency
IGCC Integrated Gasification Combined Cycle
IPTL Independent Power Tanzania Limited
KASC Kagera Sugar Limited
LHV Lower Heating Value (Net Calorific Value)
LPG Liquid Petroleum Gas
m.a.s.l Meters Above Sea Level
MEM Ministry of Energy and Minerals
MRP Mkuju River Project
NGOs Non-Government Organizations
OECD Organization for Economic Co-operation and Development
OTEC Ocean Thermal Energy Conversion
PSMP Power System Master Plan
PV Photovoltaic
SIDA Swedish International Development Authority
TANESCO Electric Supply Company Limited
TANWAT Tanganyika Wattle Company
TCH Tones of Cane Per Hour
TG Thermogravimetry
TOE Tons of Oil Equivalent
TPC Tanganyika Planting Company
TPDC Tanzania Petroleum Development Corporation
UNDP United Nations Development Program

xiii
SYMBOLS
Mass loss fraction
A Apparent frequency factor (Avogadro's constant) [/min]
Heating rate [K/min]
E Apparent activation energy [kJ/mole]
k Arrhenius constant
n Reaction order
R Universal gas constant [kJ/kmole K]
R2 Coefficient of Determination
T Absolute temperature [K]

1
1 INTRODUCTION
Tanzania has a characteristic developing economy of the world. The economy is
dependent on agricultural productivity. Information available from the National
Bureau of Statistics [1] shows that the agricultural sector contributes more than
44.70% of the total gross domestic product (GDP). It accounts for almost 56
percent of total merchandise exports and employs nearly 80% of the population.
Major agricultural exports are coffee, cotton, tea, tobacco, cashew nuts, and
sisal. The developing economy is reflected in inadequate infrastructure like roads
and electricity. On the other hand, the agricultural sector (in terms of agricultural
waste and dedicated energy crops), provides a potential energy source when
harnessed sustainably. This requires putting in place sustainable and innovative
biomass energy technologies that will contribute to the economic development.
1.1 ENERGY BALANCE
The Tanzania energy policy document [2] shows that over 90% of Tanzania‟s
primary energy consumption is accounted by biomass whereas petroleum and
electricity accounts for 8% and 1.2%, respectively. Other energy sources
including coal, solar, biogas and wind account for less than 1% of the total
primary energy consumption.
The distribution of the primary energy consumption by sector is such that
households consume 89.8%, agriculture 3.6%, transport 3.1%, industry 1.9%,
commerce 0.2% and other sectors 1.4%. The total final energy consumption
amounts to over 22 million tons of oil equivalent (TOE) or 0.7 TOE per capita.
The Commercial energy consumption pattern shows that the contribution by
individual end users is: transport sector 40.5%, industry 24.6%, household
18.6%, agriculture 8.2%, commerce 2.6% and others 5.5%. Imported petroleum,
whose importation per annum averages 850,000 metric tones, supplies over 90%
of the commercial energy needs. Its importation per annum consumes more than
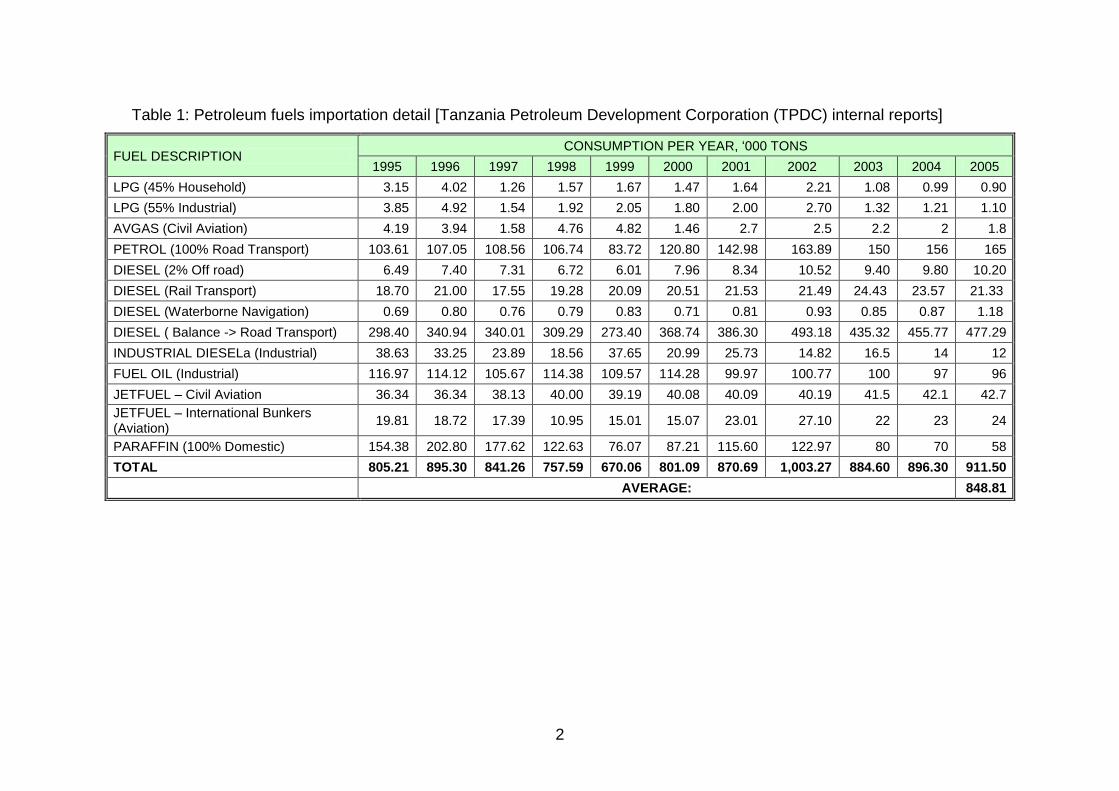
30% of the foreign exchange earned by the country. Table 1 details the
petroleum fuels importation.
2
Table 1: Petroleum fuels importation detail [Tanzania Petroleum Development Corporation (TPDC) internal reports]
FUEL DESCRIPTION CONSUMPTION PER YEAR, „000 TONS
1995 1996 1997 1998 1999 2000 2001 2002 2003 2004 2005
LPG (45% Household) 3.15 4.02 1.26 1.57 1.67 1.47 1.64 2.21 1.08 0.99 0.90
LPG (55% Industrial) 3.85 4.92 1.54 1.92 2.05 1.80 2.00 2.70 1.32 1.21 1.10
AVGAS (Civil Aviation) 4.19 3.94 1.58 4.76 4.82 1.46 2.7 2.5 2.2 2 1.8
PETROL (100% Road Transport) 103.61 107.05 108.56 106.74 83.72 120.80 142.98 163.89 150 156 165
DIESEL (2% Off road) 6.49 7.40 7.31 6.72 6.01 7.96 8.34 10.52 9.40 9.80 10.20
DIESEL (Rail Transport) 18.70 21.00 17.55 19.28 20.09 20.51 21.53 21.49 24.43 23.57 21.33
DIESEL (Waterborne Navigation) 0.69 0.80 0.76 0.79 0.83 0.71 0.81 0.93 0.85 0.87 1.18
DIESEL ( Balance -> Road Transport) 298.40 340.94 340.01 309.29 273.40 368.74 386.30 493.18 435.32 455.77 477.29
INDUSTRIAL DIESELa (Industrial) 38.63 33.25 23.89 18.56 37.65 20.99 25.73 14.82 16.5 14 12
FUEL OIL (Industrial) 116.97 114.12 105.67 114.38 109.57 114.28 99.97 100.77 100 97 96
JETFUEL – Civil Aviation 36.34 36.34 38.13 40.00 39.19 40.08 40.09 40.19 41.5 42.1 42.7
JETFUEL – International Bunkers (Aviation)
19.81 18.72 17.39 10.95 15.01 15.07 23.01 27.10 22 23 24
PARAFFIN (100% Domestic) 154.38 202.80 177.62 122.63 76.07 87.21 115.60 122.97 80 70 58
TOTAL 805.21 895.30 841.26 757.59 670.06 801.09 870.69 1,003.27 884.60 896.30 911.50
AVERAGE: 848.81
3
The high dependence on biomass is contributed by the fact that majority of
Tanzanians (75% of the population) live in rural areas that are far from modern
energy service infrastructure. As a result, the biomass energy is consumed at
the household level with a marginal contribution from commercial energy. A
sustainable harnessing of available potential energy resources is therefore
necessary to realize the commercial energy to the economy.
1.2 POTENTIAL ENERGY RESOURCES
Tanzania has abundant natural resources that can be harnessed into commercial
energy. These natural resources include hydro, biomass, natural gas, coal,
uranium, solar, wind and geothermal.
1.2.1 Hydropower
Tanzania‟s hydropower resource comprise of macro (large scale) and micro
(small scale) systems. The macro hydro potential is about 4.7GW out of which
only 561MW have been developed [3]. The micro hydropower potential is
estimated at more than 314MW out of which 1.5% has been developed [4].
The 561MW developed macro hydro-electricity power system comprises six
TANESCO owned and operated hydropower plants at Mtera (80MW), Kidatu
(204MW), Hale (21MW), Pangani Falls (68MW), Nyumba ya Mungu (8MW) and
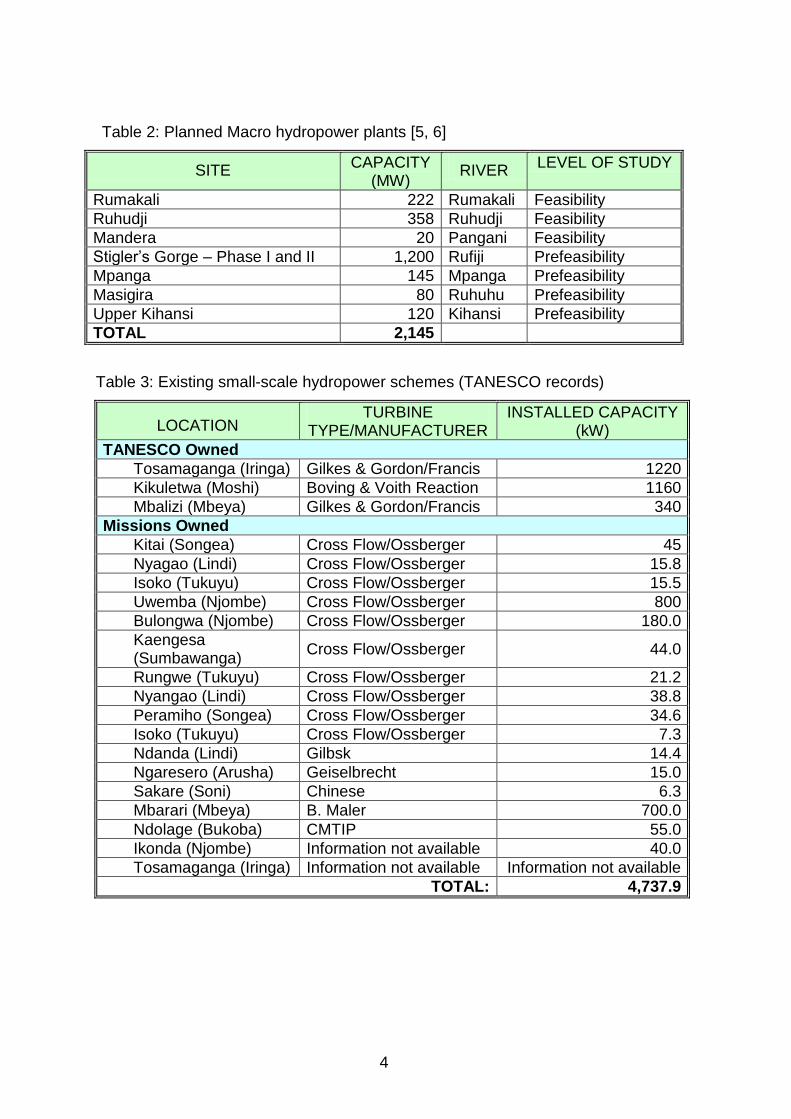
Kihansi (180MW). As detailed in Table 2, other hydropower sites identified and
studied for further development include Rumakali (222MW), Ruhudji (358MW),
Mandera (21MW), Stigler‟s Gorge (1,200 to 1,400MW), Mpanga (200MW),
Masigira (250), and Upper Kihansi (120MW).
Tanzania has an estimated mini hydro potential of about 315MW, out of which
only 4.74MW is developed. A sustainable harnessing of this resource could
contribute significantly to the overall country‟s energy production and the overall
electrification. Details available in Table 3 show that religious missions have
installed most of the existing small-scale hydropower schemes the majority of
which are located in the southern highlands regions of Tanzania.
4
Table 2: Planned Macro hydropower plants [5, 6]
SITE CAPACITY
(MW) RIVER
LEVEL OF STUDY
Rumakali 222 Rumakali Feasibility
Ruhudji 358 Ruhudji Feasibility
Mandera 20 Pangani Feasibility
Stigler‟s Gorge – Phase I and II 1,200 Rufiji Prefeasibility
Mpanga 145 Mpanga Prefeasibility
Masigira 80 Ruhuhu Prefeasibility
Upper Kihansi 120 Kihansi Prefeasibility
TOTAL 2,145
Table 3: Existing small-scale hydropower schemes (TANESCO records)
LOCATION TURBINE
TYPE/MANUFACTURER INSTALLED CAPACITY
(kW)
TANESCO Owned
Tosamaganga (Iringa) Gilkes & Gordon/Francis 1220
Kikuletwa (Moshi) Boving & Voith Reaction 1160
Mbalizi (Mbeya) Gilkes & Gordon/Francis 340
Missions Owned
Kitai (Songea) Cross Flow/Ossberger 45
Nyagao (Lindi) Cross Flow/Ossberger 15.8
Isoko (Tukuyu) Cross Flow/Ossberger 15.5
Uwemba (Njombe) Cross Flow/Ossberger 800
Bulongwa (Njombe) Cross Flow/Ossberger 180.0
Kaengesa (Sumbawanga)
Cross Flow/Ossberger 44.0
Rungwe (Tukuyu) Cross Flow/Ossberger 21.2
Nyangao (Lindi) Cross Flow/Ossberger 38.8
Peramiho (Songea) Cross Flow/Ossberger 34.6
Isoko (Tukuyu) Cross Flow/Ossberger 7.3
Ndanda (Lindi) Gilbsk 14.4
Ngaresero (Arusha) Geiselbrecht 15.0
Sakare (Soni) Chinese 6.3
Mbarari (Mbeya) B. Maler 700.0
Ndolage (Bukoba) CMTIP 55.0
Ikonda (Njombe) Information not available 40.0
Tosamaganga (Iringa) Information not available Information not available
TOTAL: 4,737.9

5
1.2.2 Natural Gas
Ongoing petroleum exploration in Tanzania through the Tanzania Petroleum
Development Corporation has discovered natural gas along SongoSongo Island
and Mnazi Bay both of which are located in southeastern Tanzania. The
SongoSongo natural gas reserve is estimated at 30 million cubic metres whereas
the Mnazi Bay reserve is estimated to contain 15 million cubic metres.
Exploitation of the SongoSongo gas started in July 2004 after completion of the
229km gas pipeline from SongoSongo Island to Dar es Salaam. Todate, the
natural gas is utilized to generate 331MW of electricity through thermal power
plants located in Dar es Salaam City. Other uses of the gas include thermal
applications in factories, households, and automotive based within the City.
Natural gas application in automotive commenced following the commissioning of
the natural gas filling station project. The project has been implemented by the
Government of the United Republic of Tanzania in collaboration with the TPDC.
It has a capacity to benefit over 8,000 cars and some 30,000 households. Motor
vehicles conversion to run on compressed natural gas (CNG) from this project
commenced in mid 2009. Starting with the city of Dar es Salaam, two initial CNG
stations are designated at Ubungo and Mikocheni areas.
1.2.3 Biomass
Tanzania has about 33.5 million hectares of forest and woodlands, which is about
38% of total land area [7]. Out of this total area, almost two thirds are woodlands
on public lands that are under enormous pressure from human activities also
being an energy source. Besides wood fuel, the country has considerable
biomass resources in form of agricultural and forest residues and animal wastes
which, in combination with the woodlands, meet the majority of household energy
requirement.
Biomass potential can therefore be estimated from existing plantation forests and
agricultural waste. Currently, there are about 80,000 hectares of state owned
plantation forests that were mostly linked to state owned wood based panel
industry (veneer and plywood, hardboards, and chipboards) and the pulp and

6
paper industry. It is also estimated that there are 20,000 – 25,000 hectares of
private owned plantations, and in addition, there are up to 80,000 hectares of
plantations belonging to villagers, local Governments, non-Government
organizations (NGOs), civil societies, and religious organizations [8]. At 20%
residue factor from the harvested wood, it is estimated that the total biomass
potential from plantation forests residue is over 205,400 m3 [8, 9]. About 75% of
this potential is within the Saohill plantation forests followed by Buhindi plantation
that shares 4.67% of total potential.
On the other hand, evaluation of agricultural production data available from the
National Bureau of Statistics [1] shows that the total amount of waste that
originates from agricultural activities is over 12 million tones. With a share of
61.15% to total waste potential, corn stalks and cobs have the highest potential of
agricultural waste. Rice straw and husks follow in their contribution to the
potential stock, sharing 32.69% of total waste. Waste from sugarcane processing
(bagasse) is already being used for cogeneration in all four Tanzania‟s sugar
plants. The available bagasse shares 3.55% of total agro waste potential. It can
therefore be implied that agricultural wastes from corn, rice, and sugarcane have
the overall importance since they contribute 97.39% of the existing agricultural
waste potential.
From the available biomass resources in terms of 12 million tones of agricultural
waste; 205,400 tones of forestry waste; including planting the available 19 million
hectares with biomass forests, Wilson et al. [10] estimated that the total biomass
energy potential amounts to 12 million TOE. Currently, Tanzania imports a total
of 850,000 tones of petroleum oils per annum, the estimated biomass surpasses
the demand and, it suggests that Tanzania may become a net exporter of this
renewable energy.
A study by Kaseva and Mbuligwe [11] established that per capita waste
generation in the city of Dar es Salaam is 0.40kg/person/day. This shows that a
considerable solid waste is being generated in urban areas, and hence, the
potential energy and materials recovery. Shown in Table 4 is the municipal solid
waste data for 21 municipalities and major cities in Tanzania. Major Cities like
Dar es Salaam, Mwanza, Shinyanga, Kagera, Mbeya and Kigoma have relatively

7
higher potential energy from the waste. However, all over Tanzania urban waste
collection is marginal, at 32 percent of the total generated amount. Therefore for
this waste to be applied in energy generation there is a need to put in place
organized waste collection and management procedures and infrastructure.

8
Table 4: Waste generated (Tones) in Tanzania Cities [12]
NO. CITY/TOWN AMOUNT
GENERATED (TONES/DAY)
AMOUNT OPEN
DUMPED (TONES/DAY)
DUMPED/ GENERATED
RATIO
AMOUNT GENERATED
IN 2000 (TONES/DAY)
AMOUNT GENERATED
IN 2003 (TONES/DAY)
AMOUNT GENERATED
IN 2005 (TONES/DAY)
1 Dar es Salaam 2,200 2,000 2,848 3,100
2 Mwanza 210 80 38 751 977 1,036
3 Shinyanga 100 25 25 564 898 991
4 Kagera 24 8 31 64 242 714
5 Mbeya 145 66 46 442 662 712
6 Kigoma 60 15 25 274 537 620
7 Tabora 120 12 10 405 550 612
8 Morogoro 260 54 21 391 563 608
9 Dodoma 156 42 27 395 544 585
10 Tanga 400 190 48 519 657 554
11 Iringa 36 11 31 382 479 500
12 Mara 30 7 23 303 438 472
13 Kilimanjaro 92 45 49 354 442 464
14 Arusha 200 125 63 413 414 440
15 Rukwa 45 16 36 240 390 407
16 Lindi 206 253 385
17 Ruvuma 56 21 38 249 358 385
18 Mtwara 50 15 30 222 361 380
19 Singida 65 17 26 253 349 374
20 Manyara 193 332 373
21 Pwani 203 284 305
TOTAL 4,249 749 33 8,823 12,577 14,017

9
1.2.4 Coal
Coal reserves in Tanzania are estimated at about 1,200 million tones of which
304 million tones are proven. Coal sites include Kiwira, northwest of Lake Nyasa
and Mchuchuma/Katewaka on the southeast of the Lake. Generally, the
available coal is bituminous, with an average ash content of about 25% and
calorific value of between 22 and 28 MJ/kg. Some coal from Kiwira is generating
electricity (6 MW) and is also used for other thermal requirements in industries
like cement and textiles most of which are located in the neighbouring regions of
Mbeya, Iringa and Morogoro.
The coal has been analyzed to contain high content of sulphur (up to 9.2 wt.%),
which calls for the application of cleaner technologies [13, 14]. As indicated in
the National Power System Master Plan (PSMP) it is planned to utilize coal from
Mchuchuma and Kiwira to generate, respectively, 600 and 400MW of electricity.
While increasing the electrification level, such developments will also improve the
existing generation mix by relieving its strong bias to the hydropower.
1.2.5 Solar
Tanzania lies between 10 and 110 South of the Equator, with long sunshine
hours. The average daily insolation is about 4.5 – 6.5 kWh/m2 [15]. This
insolation provides an opportunity for installing solar photovoltaic (PV) and solar
thermal energy systems. However, todate there is a limited harnessing of the
solar resource as only about 1.2MWp of PV are installed countrywide as solar
home systems. The main PV applications in Tanzania include
telecommunications, lighting, vaccine refrigeration, water pumping, cathodic
protection of Tanzania Zambia oil pipeline and providing power backup systems.
Furthermore, solar thermal applications in Tanzania include solar water
heaters/pasteurizers, crop driers and solar cookers.
Some of the bottlenecks to the wider application of solar PV systems include:
high initial cost, limited market infrastructure, and lack of local technical capacity.
In its effort to bridge this, The Ministry of Energy and Minerals (MEM) initiated two
10
programs, respectively, supported by UNDP/GEF (2004 – 2009) and Sida (2005
– 2010). Besides putting in place PV systems demonstration facilities, the main
project output were: training to local technicians, development of PV standards,
and increased PV market infrastructure.
1.2.6 Wind
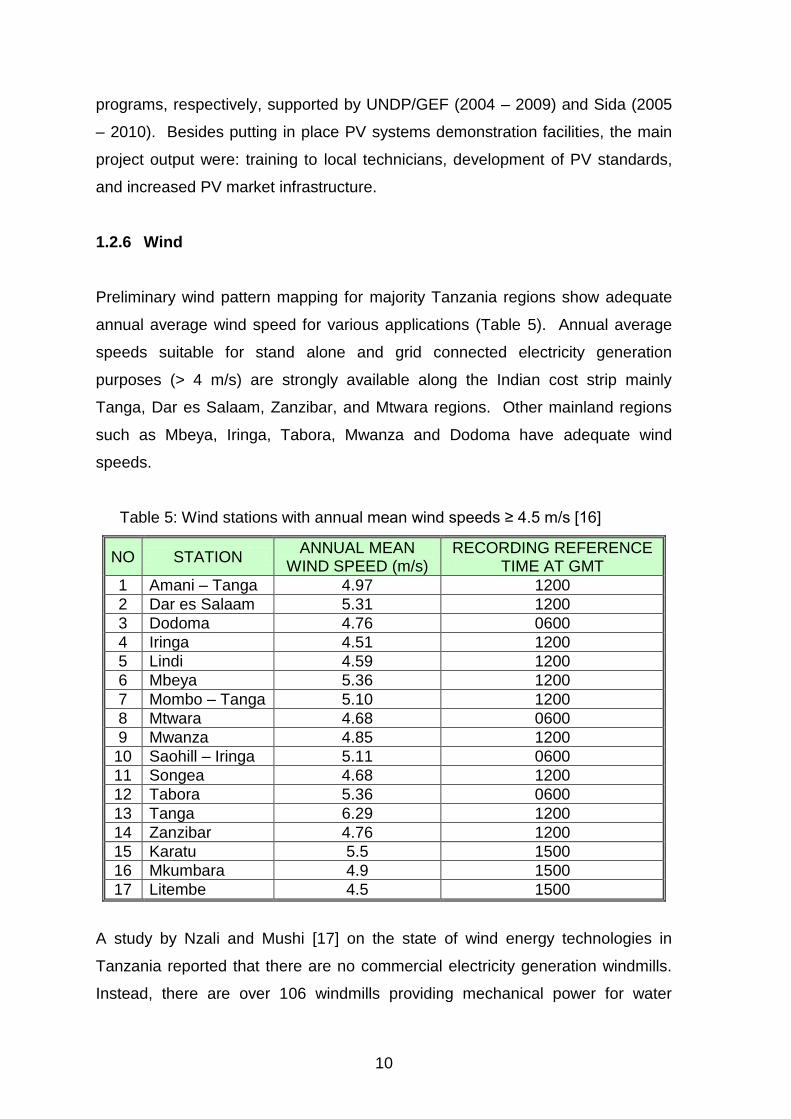
Preliminary wind pattern mapping for majority Tanzania regions show adequate
annual average wind speed for various applications (Table 5). Annual average
speeds suitable for stand alone and grid connected electricity generation
purposes (> 4 m/s) are strongly available along the Indian cost strip mainly
Tanga, Dar es Salaam, Zanzibar, and Mtwara regions. Other mainland regions
such as Mbeya, Iringa, Tabora, Mwanza and Dodoma have adequate wind
speeds.
Table 5: Wind stations with annual mean wind speeds ≥ 4.5 m/s [16]
NO STATION ANNUAL MEAN
WIND SPEED (m/s) RECORDING REFERENCE
TIME AT GMT
1 Amani – Tanga 4.97 1200
2 Dar es Salaam 5.31 1200
3 Dodoma 4.76 0600
4 Iringa 4.51 1200
5 Lindi 4.59 1200
6 Mbeya 5.36 1200
7 Mombo – Tanga 5.10 1200
8 Mtwara 4.68 0600
9 Mwanza 4.85 1200
10 Saohill – Iringa 5.11 0600
11 Songea 4.68 1200
12 Tabora 5.36 0600
13 Tanga 6.29 1200
14 Zanzibar 4.76 1200
15 Karatu 5.5 1500
16 Mkumbara 4.9 1500
17 Litembe 4.5 1500
A study by Nzali and Mushi [17] on the state of wind energy technologies in
Tanzania reported that there are no commercial electricity generation windmills.
Instead, there are over 106 windmills providing mechanical power for water
11
pumping in 11 regions of Tanzania. The study reported that 75.47% of the
installed windmills are owned by the local communities whereas church
organization owns 9.43% and 8.49% is owned by the Government. The
remaining 6.6% of the installations are owned by other organizations. With the
exception of two installations that used three-bladed horizontal axis and vertical
axis savonious rotor, respectively, the remaining installations utilized multi-bladed
horizontal axis technology, which is a proven technology for water pumping
purposes.
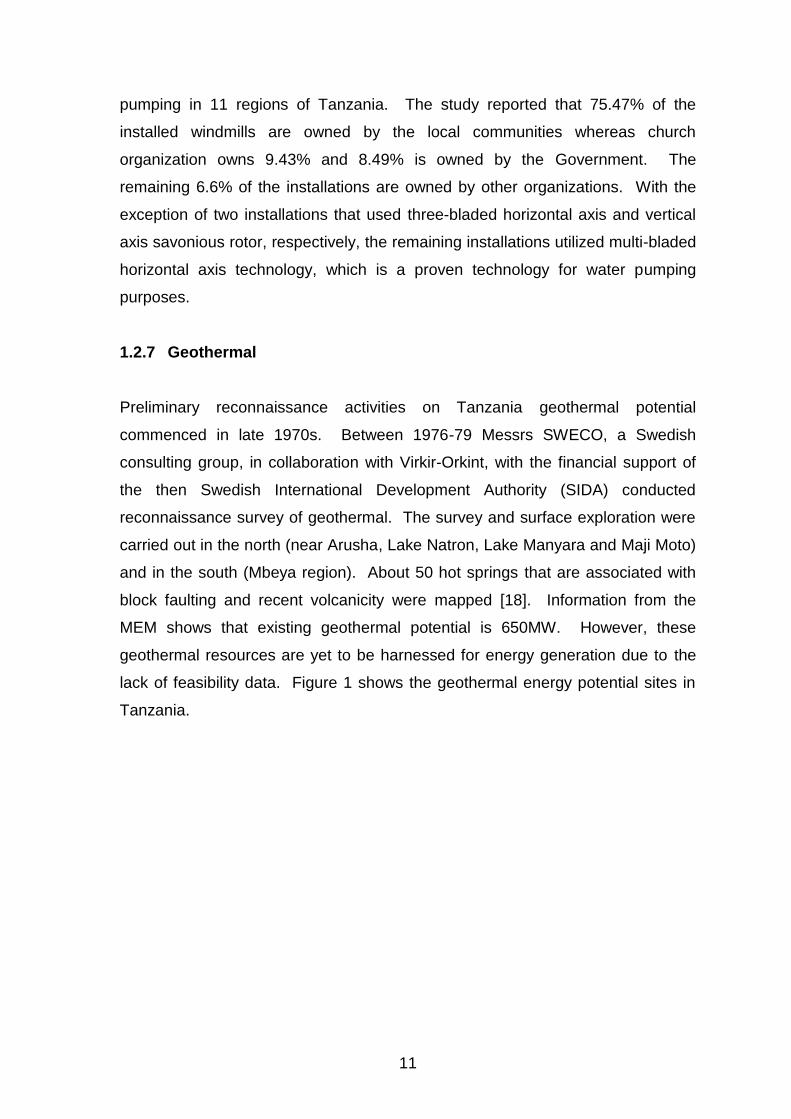
1.2.7 Geothermal
Preliminary reconnaissance activities on Tanzania geothermal potential
commenced in late 1970s. Between 1976-79 Messrs SWECO, a Swedish
consulting group, in collaboration with Virkir-Orkint, with the financial support of
the then Swedish International Development Authority (SIDA) conducted
reconnaissance survey of geothermal. The survey and surface exploration were
carried out in the north (near Arusha, Lake Natron, Lake Manyara and Maji Moto)
and in the south (Mbeya region). About 50 hot springs that are associated with
block faulting and recent volcanicity were mapped [18]. Information from the
MEM shows that existing geothermal potential is 650MW. However, these
geothermal resources are yet to be harnessed for energy generation due to the
lack of feasibility data. Figure 1 shows the geothermal energy potential sites in
Tanzania.
12
Figure 1: Geothermal potential sites in Tanzania (Documents available with
the MEM)
1.2.8 Tidal and Wave
Eastern Tanzania is a 1,424km coastal strip along the Indian Ocean. This strip
including those along the Zanzibar and Mafia Islands constitute a potential
energy source for tidal, wave, and ocean thermal energy conversion (OTEC)
technologies. However, the lack of full feasibility assessments and technological
capacity has led to the limited deployment.
13
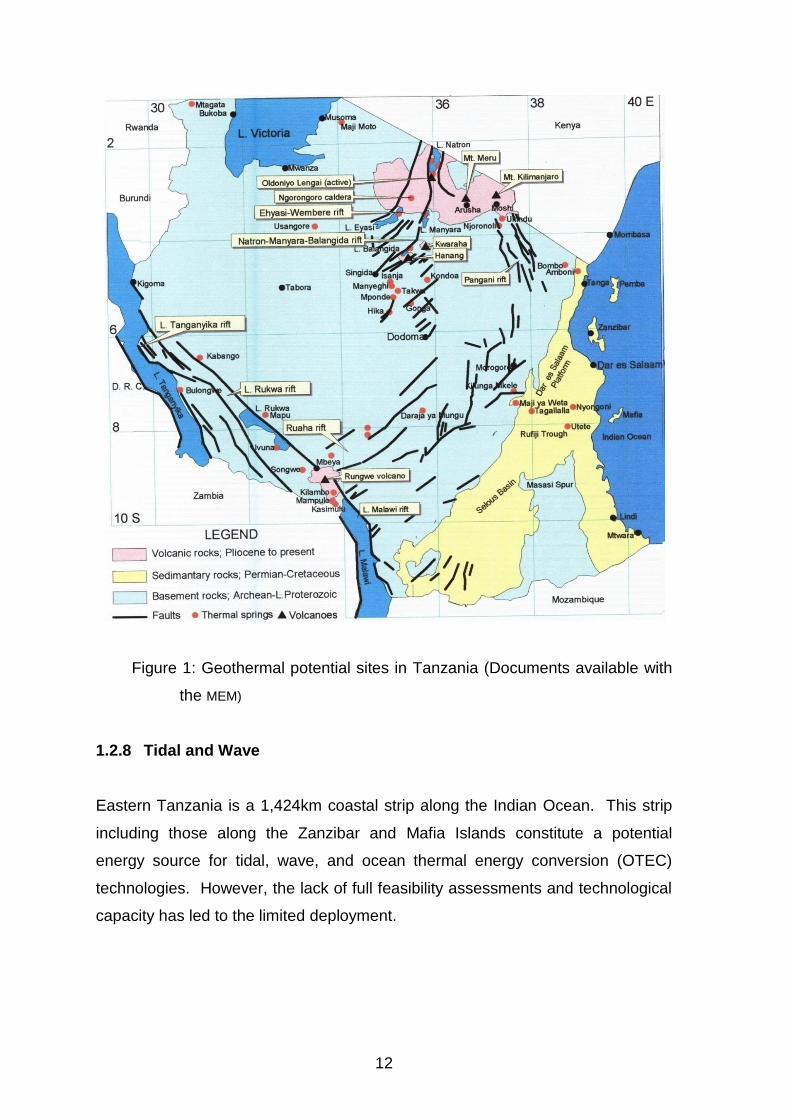
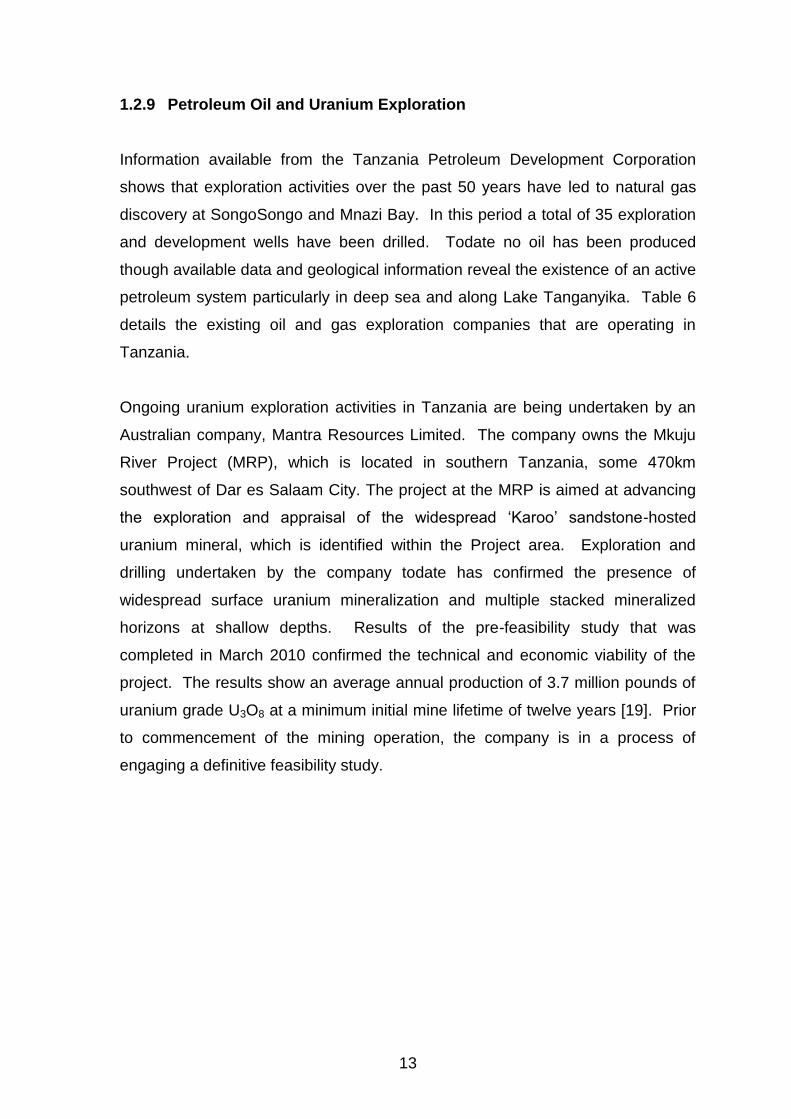
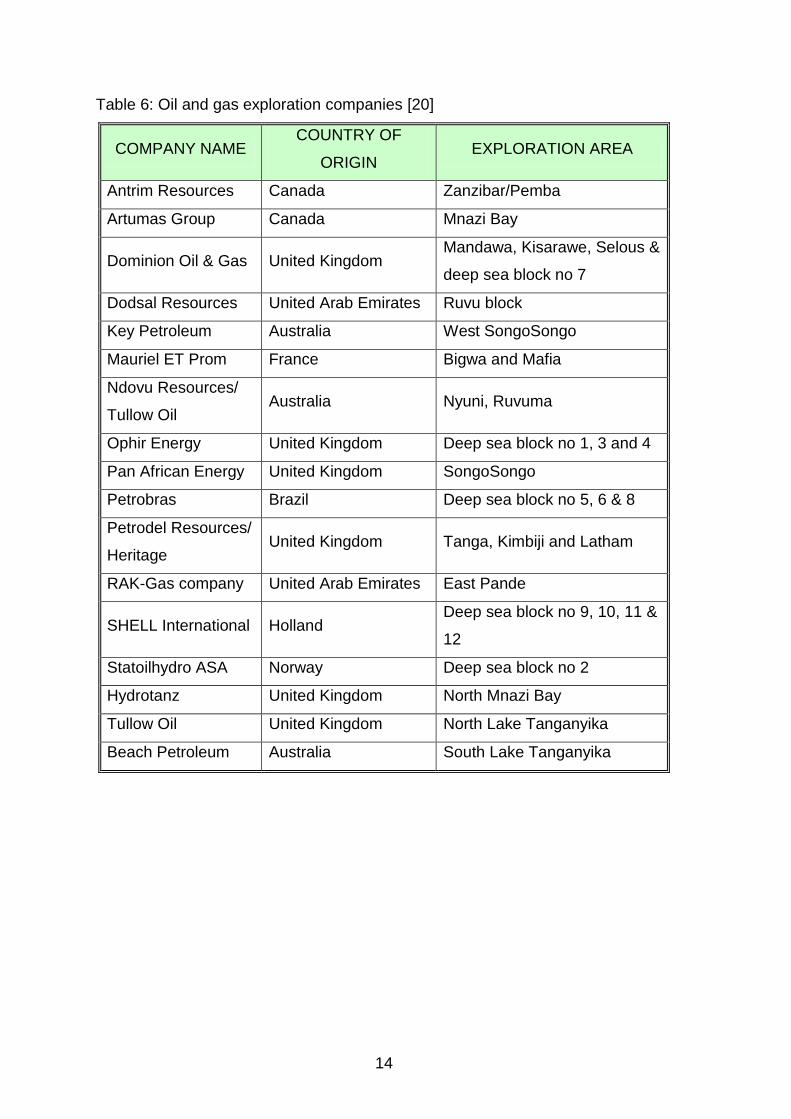
1.2.9 Petroleum Oil and Uranium Exploration
Information available from the Tanzania Petroleum Development Corporation
shows that exploration activities over the past 50 years have led to natural gas
discovery at SongoSongo and Mnazi Bay. In this period a total of 35 exploration
and development wells have been drilled. Todate no oil has been produced
though available data and geological information reveal the existence of an active
petroleum system particularly in deep sea and along Lake Tanganyika. Table 6
details the existing oil and gas exploration companies that are operating in
Tanzania.
Ongoing uranium exploration activities in Tanzania are being undertaken by an
Australian company, Mantra Resources Limited. The company owns the Mkuju
River Project (MRP), which is located in southern Tanzania, some 470km
southwest of Dar es Salaam City. The project at the MRP is aimed at advancing
the exploration and appraisal of the widespread „Karoo‟ sandstone-hosted
uranium mineral, which is identified within the Project area. Exploration and
drilling undertaken by the company todate has confirmed the presence of
widespread surface uranium mineralization and multiple stacked mineralized
horizons at shallow depths. Results of the pre-feasibility study that was
completed in March 2010 confirmed the technical and economic viability of the
project. The results show an average annual production of 3.7 million pounds of
uranium grade U3O8 at a minimum initial mine lifetime of twelve years [19]. Prior
to commencement of the mining operation, the company is in a process of
engaging a definitive feasibility study.
14
Table 6: Oil and gas exploration companies [20]
COMPANY NAME COUNTRY OF
ORIGIN EXPLORATION AREA
Antrim Resources Canada Zanzibar/Pemba
Artumas Group Canada Mnazi Bay
Dominion Oil & Gas United Kingdom Mandawa, Kisarawe, Selous &
deep sea block no 7
Dodsal Resources United Arab Emirates Ruvu block
Key Petroleum Australia West SongoSongo
Mauriel ET Prom France Bigwa and Mafia
Ndovu Resources/
Tullow Oil Australia Nyuni, Ruvuma
Ophir Energy United Kingdom Deep sea block no 1, 3 and 4
Pan African Energy United Kingdom SongoSongo
Petrobras Brazil Deep sea block no 5, 6 & 8
Petrodel Resources/
Heritage United Kingdom Tanga, Kimbiji and Latham
RAK-Gas company United Arab Emirates East Pande
SHELL International Holland Deep sea block no 9, 10, 11 &
12
Statoilhydro ASA Norway Deep sea block no 2
Hydrotanz United Kingdom North Mnazi Bay
Tullow Oil United Kingdom North Lake Tanganyika
Beach Petroleum Australia South Lake Tanganyika

15
1.3 ELECTRICITY GENERATION MIX
As detailed in Table 7 and shown in Figure 2, about 51.43% of the electricity is
generated from renewable sources comprising of 47.20% hydro and 4.23% from
biomass. The total country‟s installed electricity generation capacity is
1,190.37MW. Due to the availability of indigenous natural gas, it has acquired
the second in importance as 331MW is now being generated from the natural
gas. Electricity generated from natural gas will continue to increase so as to
diversify power generated and alleviate the current bias to hydro sources, which
are prone to climate change particularly the extended drought. Drought
experience was gained in year 2004 – 2007 when its effect led to extended
power shading countrywide. On 3rd December 2006 water level recorded at
Mtera reservoir was 686.92 meters above sea level (m.a.s.l), which is about 3.08
meters below the dead storage level of 690.0 m.a.s.l [21]. Future power
generation need also increase the share of coal from Kiwira and
Liganga/Mchuchuma from the current 0.50% as supplied by Kiwira only.
Currently, isolated and grid connected thermal power plants (from petroleum oils)
shares 20.26% of the installed generation capacity. With the exception of the
Independent Power Tanzania Limited (IPTL) plant, all petroleum-based power
plants are owned by the national utility company (TANESCO). Their operation is
intermittent as they are backup sources when the generation from hydro falls
below the demand. The general generation mode has been to run the
hydropower system at near full generating capacity during rainy season and to
reduce hydropower generation during dry season. During the dry season,
thermal generation is increased while suppressing part of the load demand to
ensure sufficient water is available to supply the power system throughout the
year. The closure of petroleum-based power plants will be mandatory when
future demand is met by natural gas, coal, and other potential resources.
Tanzania electricity grid is also fed by imported electricity from neighbouring
Zambia and Uganda. The importation, respectively, is currently at 5 and 8MW.
This trend is expected to reverse after a full capacity harnessing the indigenous
energy resources particularly natural gas, coal and uranium.

16
Figure 2: Installed generation capacity and share (%) by source
Hydro 47.20%
Natural gas27.81%
Petroleum oils20.26%
Coal0.50% Biomass
4.23%

17
Table 7: Installed generation capacity and source (TANESCO records, 2010)
SNO. DESCRIPTION INSTALLED
CAPACITY (MW) EFFECTIVE
(MW) %
SHARE
1
Hydro
47.20
Mtera
80.00
66.00
Kidatu
204.00
180.00
Hale
21.00
5.00
Pangani Falls
68.00
20.00
Nyumba ya Mungu
8.00
3.50
Lower Kihansi
180.00
75.00
Uwemba 0.843 0.71
Total hydro
561.84
350.21
2
Natural gas
Songas
182.00
180.50
27.81
TANESCO Ubungo
104.00
102.50
TANESCO Tegeta
45.00
45.00
Total natural gas
331.00
328.00
3
Petroleum oils
20.26
TANESCO grid diesel plants
85.70
35.30
TANESCO isolated diesel plants
55.50 35.3
IPTL plant
100.00
100.00
Total petroleum oils
241.20
170.60
4 Coal
6.00
2.00
0.50
5
Biomass
4.23
Bagasse cogeneration
46.80
Wood biomass cogeneration
3.53
3.53
Total biomass
50.33
Total generation
1,190.37
100.00

18
1.4 BIOMASS COGENERATION
Biomass cogeneration shares a marginal (3.03%) contribution to installed
electricity generation capacity of the country. There are three privately owned
biomass cogeneration facilities in Tanzania. They are being owned by sugar-
processing factories, a wattle processing plant, and by a forestry plant.
Tanganyika Wattle Company (TANWAT) operates a cogeneration plant which is
fueled by wood logs and spent wattle barks. On the other hand, Kilombero Sugar
Company located in Morogoro region, Mtibwa Sugar Estate Limited also located
in Morogoro region, Kagera Sugar Limited from Kagera region and Tanganyika
Planting Company (TPC) of Kilimanjaro are utilizing bagasse in their
cogeneration plants. Saw mill waste is the fuel for cogeneration plant owned by
Sao Hill Saw Mill located in Iringa region.
1.4.1 Kilombero Sugar Company
Sugar processing is through two processing plants known as Msolwa (Kilombero
K1) and Ruembe (Kilombero K2). The Msolwa plant has a cane crushing
capacity of 80 tones of cane per hour (TCH) with total sugarcane plantation
amounting to 2,960 hectares and average yield of 70 tones per hectare. Ruembe
plant has a cane crushing capacity of 100 TCH. About 3,400 hectares of
sugarcane are harvested annually.
Msolwa plant has two steam turbines rated 3MW where as Ruembe has one
steam turbine with a rating of 1.2MW and two other steam turbines rated 800kW
each. The installed generation capacity at Kilombero Sugar Company is
insufficient to export the power to the national grid.
1.4.2 Mtibwa Sugar Estate Limited
Mtibwa Sugar Estate Limited has a total sugarcane plantation of 4,200 hectares
with an average yield of 80 tones per hectare. The company has three steam
boilers that produce steam for running two sets of back-pressure turbo-

19
alternators of 2.5MW and 1.5MW respectively. In addition, there is a turbo
generator rated 9MW. Up to a total of 10GWh of electricity is generated during
production season. Since the locally produced power is insufficient, about
4.0GWh are imported annually from TANESCO. Imported power is mainly used
for irrigation and for domestic uses.
1.4.3 Tanganyika Planting Company Limited (TPC)
The TPC has a total of 16,000 ha of land out of which about 6,100 ha is under
cane cultivation. TPC has just commissioned a boiler to produce 90t/hr steam at
45 bar and 450C. The steam will be fed to a generator for producing 17.5MW of
electricity. At this capacity the plant will be able to sustain its power requirements
to factory, residential areas, irrigation, and export excess power to TANESCO.
1.4.4 Kagera Sugar Limited (KASC)
Kagera Sugar Limited owns 860 hectares of sugarcane plantation with plant cane
crushing capacity of 60 TCH. Cane yield is 70 tones per hectare. The
cogeneration at KSC is through two steam turbines rated 2.5MW. There is a
potential for the extra power to be used for electrifying nearby villages as the
national electricity grid is yet to be in Kagera region.
1.4.5 Saohill Sawmill
Saohill sawmill is an integrated wood establishment that operates sawmill,
impregnated treated wood poles, planer mill and joinery factory. The company
has leased plantation coverage of 35,000 hectares of both hard and soft wood
species. Saohill sawmill has installed 4 diesel generators each rated 250kW,
which is capable of meeting the installed load capacity of about 850kW. Further
to the diesel generators, there is a 1MW electrical generator being coupled to a
steam engine. Steam is generated through a water tube boiler, which is fueled
by wood chips, sawdust and wood shavings.

20
1.4.6 Tanganyika Wattle Company (TANWAT)
TANWAT is located at Njombe district in the southern highlands of Tanzania,
Iringa region. The company owns a 15,000 hectares site out of which 8,000
hectares are wattle plantations, 4,000 hectares pines and 1,000 hectares of
eucalyptus. Main activities being the production of tannin extract from the bark of
wattle trees. About 3,000 tones of timber are also produced per annum from the
pine trees.
Wattle barks are stripped in the fields and transported to the factory for
processing and manufacture of the tannin extract. The wood is a waste of the
process and resulting in excess of 60,000 tones of wood logs per annum. Once
the bark is extracted of the tannin, it is also a waste accumulating to over 10,000
tones of spent barks per annum. Further to these, at a 40% recovery rate there
is an added 4,500 tones of pines waste per annum in terms of off cuts and
sawdust. Additional volume of wood is available from the eucalyptus plantation.
TANWAT company information shows that its cogeneration plant has an installed
capacity of 2,500kW. There are 2 boilers rated 15 tones per hour of superheated
steam for generating electricity through a single stage condensing steam turbine.
TANWAT does not import power from TANESCO. Instead TANESCO shares
35% of total power generated at TANWAT.
A study by Mwihava and Wilson [22] showed that the immediate potential
expansion in cogeneration in these plants amounts to over 120MW (Table 8).
Increment of the cane crushing capacity and systems improvement is necessary
for realizing the potential.

21
Table 8: Potential additional cogeneration capacity [22]
S/N NAME OF COMPANY
EXISTING
COGENERATON
CAPACITY (MW)
POTENTIAL
ADDITIONAL
COGENERATION
CAPACITY (MW)
1 Mtibwa Sugar Estates
Limited 13 15
2 Kagera Sugar Limited 5 15
3 Tanganyika Planting
Company (TPC) 20 14 to 30
4 Kilombero Sugar Company 8.8 30
5 Pangani Sugar Limited 0 15
6 Tanganyika Wattle
Company 2.5 15
7 Sao Hill Saw Mill 1.025 3 to 4
Total 35.825 107 to 124
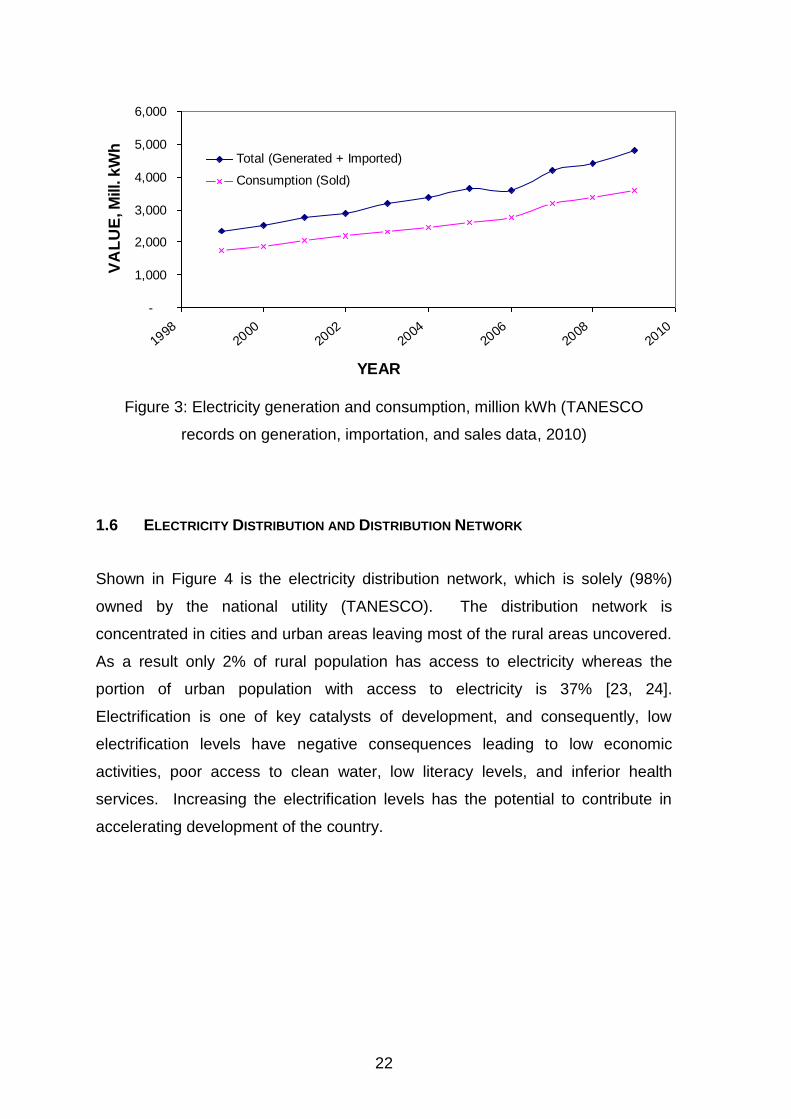
1.5 ELECTRICITY DEMAND
Figure 3 shows the trend of energy generation and consumption in Tanzania.
The current total annual electricity generation and consumption, respectively, is
4,800 and 3,600 million kWh. The difference between generation and
consumption is accounted by system loss, which averages 26%. Over the
analyzed period covering years 1999 to 2009 the consumption trend is growing at
7.49% per annum. The growth in power demand is attributed to population
growth and increasing economic activities. The peak demand is suppressed in
order to save the national grid from a total collapse, as the existing generation
and distribution capacity is far less than sufficient to meet peak demand.
22
Figure 3: Electricity generation and consumption, million kWh (TANESCO
records on generation, importation, and sales data, 2010)
1.6 ELECTRICITY DISTRIBUTION AND DISTRIBUTION NETWORK
Shown in Figure 4 is the electricity distribution network, which is solely (98%)
owned by the national utility (TANESCO). The distribution network is
concentrated in cities and urban areas leaving most of the rural areas uncovered.
As a result only 2% of rural population has access to electricity whereas the
portion of urban population with access to electricity is 37% [23, 24].
Electrification is one of key catalysts of development, and consequently, low
electrification levels have negative consequences leading to low economic
activities, poor access to clean water, low literacy levels, and inferior health
services. Increasing the electrification levels has the potential to contribute in
accelerating development of the country.
-
1,000
2,000
3,000
4,000
5,000
6,000
1998
2000
2002
2004
2006
2008
2010
YEAR
VA
LU
E, M
ill. k
Wh
Total (Generated + Imported)
Consumption (Sold)

23
Figure 4: Existing and proposed grid and isolated transmission system [25]
2. LITERATURE REVIEW
2.1 BIOMASS GASIFICATION
In terms of energy supply and environmental conservation, biomass energy is the
most important renewable energy. Studies establishing the technical biomass
energy potential of biomass show that the annually available biomass is over
seven times the current consumption of petroleum oil, coal and natural gas [26,
27]. In year 2000 biomass energy supplied 7% of total renewable energy in the
OECD countries being second to hydro, which supplied 87% of total renewables
[28]. However, the importance of biomass energy in environmental conservation
is from the tendency to recycle the greenhouse gas carbon dioxide in the growing
feedstock [29, 30].

24
Biomass gasification is an efficient biomass-to-energy conversion technology.
Through integrated gasification combined cycles (IGCC), it is possible to increase
the conventional Rankine cycle power generation‟s efficiency from 30% to 50%
[31]. Besides the syngas energy from biomass gasification, various other energy
streams can be generated. These energy steams are conventionally used for
electricity generation and for thermal applications. However, it is foreseeable that
the transport sector is the most important end use sector due to its poor
environmental performance [32-34]. In this respect renewable hydrogen and
second generation bio-automotive fuels are expected to decarbonize the
transport sector. The renewable hydrogen can be produced by upgrading the
producer gas from biomass gasification [35, 36], whereas the two main biomass
syngas components, H2 and CO, are widely recognized as an important platform
in the production of second generation bio-automotive fuels like methanol,
ethanol, dimethyl-ether (DME), Fischer-Tropsch (FT)-diesel, synthetic natural gas
(SNG), and hydrogen [37].
2.2 HIGH TEMPERATURE AIR/STEAM GASIFICATION (HTAG)
The high temperature air/steam gasification (HTAG) of biomass technology
stems from an advanced combustion technology, the high temperature
combustion (HiTAC). Tshuji et al. [38] have shown that the key sustainability
criterion of the HiTAC technology is from its energy savings, which is a key
feature of sustainable energy technologies. Further studies by Rafidi & Blasiak
[39] and Tiwari et al. [40] revealed the low NOx emission characteristic of the
HiTAC technology. From Le Chatelier's Principle, the high operating temperature
of the HTAG process favours achieving a dynamic equilibrium of the endothermic
primary water gas reaction (Eq. 1), which becomes significant from 1000C.
Studies by Lucas [41] reported that the formation of H2 increased by about 14%
with an increase of HTAG feed gas temperature from 350C to 830C.
C + H2O CO + H2 (1)

25
2.3 EFFECTS OF HEATING RATE AND TEMPERATURE
Pyrolysis is an important initial stage during thermal degradation of biomass the
control of which determines the final product and product distribution [42, 43].
Yield of the main syngas components of CO, H2, CH4, and CO2 is enhanced by
increasing temperature and heating rate with longer residence time [44, 45].
However, the tendency of the CO2 and CH4 yield is to increase with temperature
to an asymptotic value. The high temperature, high heating rate and longer
residence time is sufficient to allow for secondary thermocracking reactions that
lead to more syngas yield [46].
2.3 CO/CO2 Ratio of Product Gas
Different fire indices have been traditionally used in characterization of the extent
and progression of fires. Such indices as the C/H ratio, CO/O2 deficiency % and
the CO/CO2% are commonly used [47]. During gasification, high concentration of
CO will be produced in the oxygen deficient atmosphere and at a proper
temperature. CO is produced mainly from devolatilization stages and through the
partial oxidation (Eq. 2), Boudouard (Eq. 3) and primary water gas reaction (Eq.
1). Various studies have shown that higher CO/CO2 ratios are favoured by higher
gasification temperatures [48, 49].
C + ½ O2 CO (2)
C + CO2 2CO (3)

26
3. OBJECTIVES
Studies that established the potential renewable energy from biomass show the
existence of enormous potential. However, biomass is a complex material having
varied characteristic properties that poses challenges while harnessing the
energy potential. Variations in the characteristics and volume of the biomass
components and differences in cellular structure make woods heavy or light, stiff
or flexible, and hard or soft. This also implies to the differences in moisture
content, volatile matter, heating value, elemental composition, and the inclusion
of inorganic materials. Further, the differences in the growing location and
condition will influence the biomass properties.
While the characteristic properties of biomass feedstock in the developed world
are well-studied, those in the developing counterpart are partially studied. It is
therefore the objective of this work to establish the characteristic properties of
selected biomass feedstock from Tanzania. The characteristic properties to be
established will provide the necessary input to thermochemical process designers
and researchers. Furthermore, since the properties are origin-specific, they
provide baseline data for technology transfer from north to south.
27
4. METHODOLOGY
4.1 CHEMICAL COMPOSITION
In order to correlate the chemical composition to the respective thermal
behaviour of the biomass materials under characterization, standard test
methods namely proximate and ultimate analysis were done. The proximate
analysis (ASTM D3172-5) reports volatile matter and ash content, fixed carbon,
and higher heating value. On the other hand, the elemental composition of the
biomass is determined by the ultimate analysis (ASTM D3176).
4.2 THERMAL DEGRADATION CHARACTERISTICS
A thermal gravimetric analyzer type NETZSCH STA 409 PC Luxx was utilized to
establish the thermal degradation characteristics of the biomasses under the
study. The STA 409 PC Luxx is a dynamic thermal analyzer that combines both
the heat flux Differential Scanning Calorimetry (DSC) and Thermogravimetry
(TG). The experiments were carried out under controlled inert nitrogen condition
with nitrogen flow rate kept at 60 ml/min while heating the sample at 10 K/min.
The TG data acquisition, storage and analysis were done using the “Proteus”
software. Prior to testing, the biomasses were dried in oven overnight. This was
necessary for removing the naturally absorbed moisture.

28
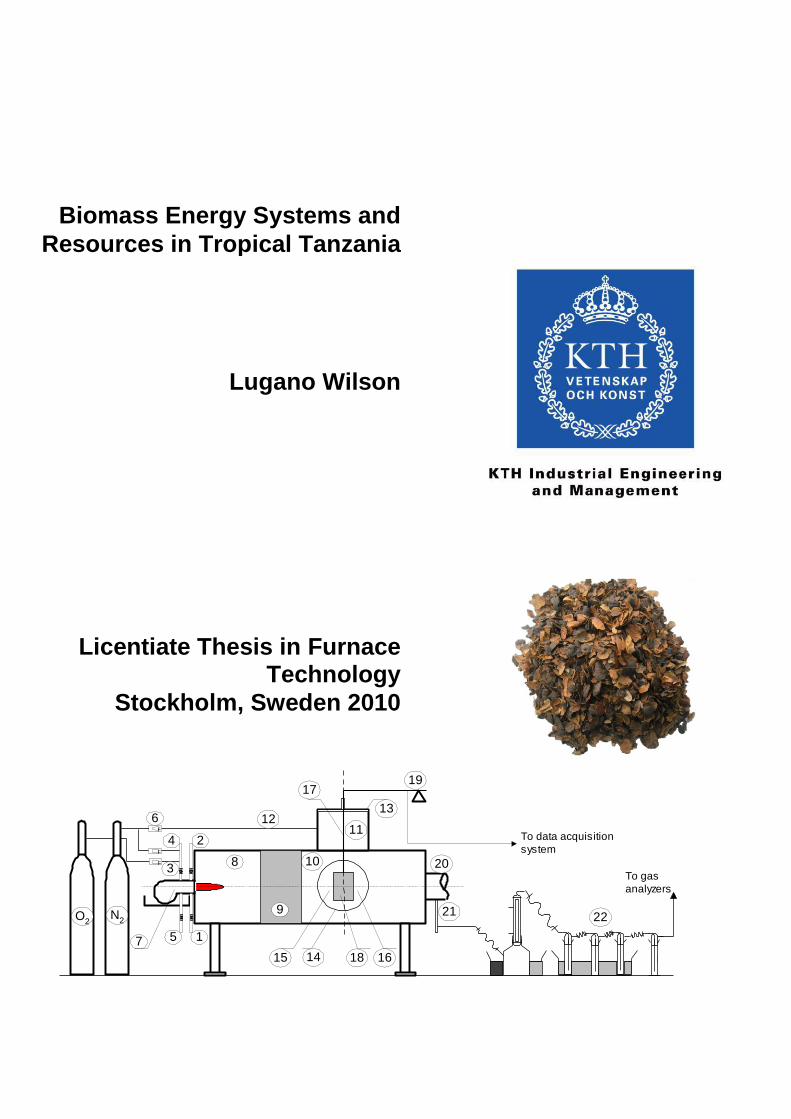
4.3 LABORATORY EXPERIMENTATION
Besides establishing the chemical composition and thermal degradation
characteristic of the biomasses under study, a laboratory scale high temperature
gasification of biomass was undertaken. The gasification experiments were done
for the purpose of investigating the influence of steam and oxygen oxidizers while
varying temperature in three different ranges of 900, 800, and 700°C. During the
laboratory gasification experiments, the oxygen level was maintained at three
concentrations of 2, 3, and 4%. Coffee husk, which is a tropical agricultural
waste, was the material utilized for the laboratory investigation. Fifteen grams of
the coffee husk sample was taken for each gasification experimental run. Steam
flow to the gasification was set at 0.469 kg/min.
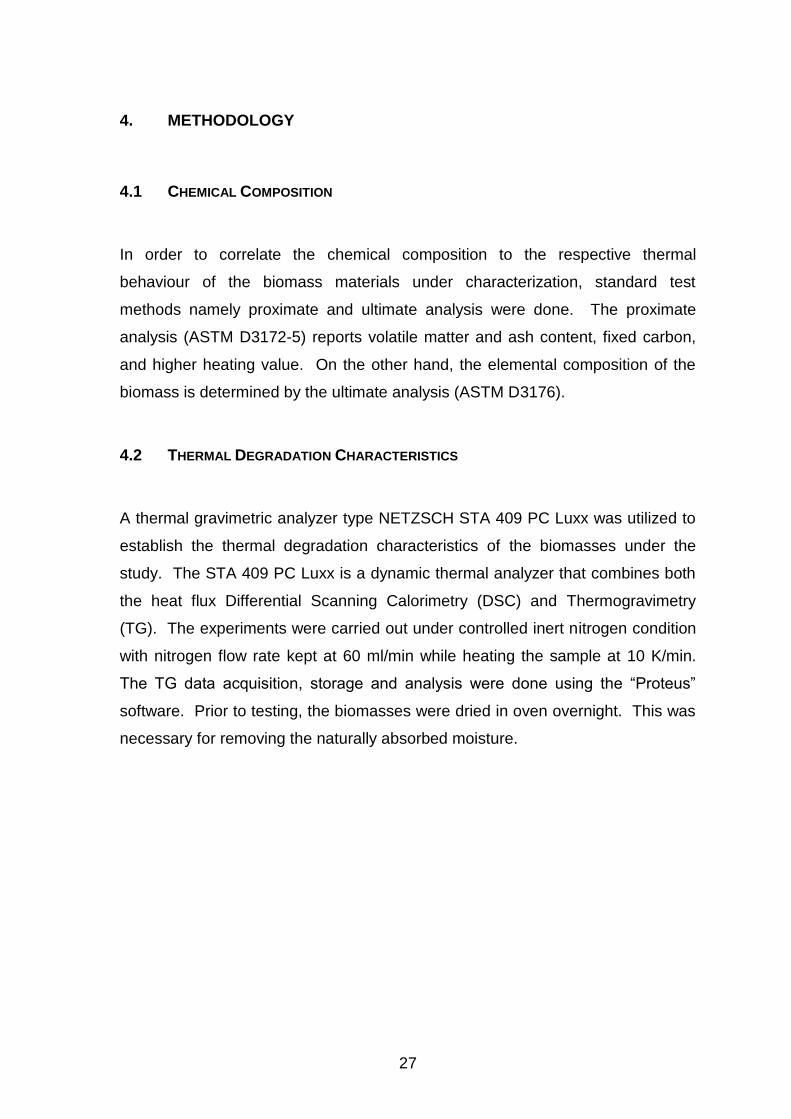
The schematic diagram of the high temperature gasification rig is shown in Figure
5. The rig is batch type, which is preheated to predetermined temperature using
a methane burner (7). Honeycomb (9) stores heat energy from primary
combustion chamber (8). The heat stored in the honeycomb is then released to
heat the secondary combustion chamber (10) to a constant desired experimental
temperature. A thermocouple (15) records the secondary chamber temperature,
when it reaches the desired level the burner is switched off. Oxygen
concentration (%) is achieved by setting oxygen and nitrogen flow through
respective inlets (3) and (4) that are controlled by Bronkhorst EL-Flow mass flow
meters and controllers (6). Steam is injected through inlet pipe (1) whereas inlet
pipes (2) and (5) are available for more oxidants. The sample (18) is inserted
into the furnace through inlet flange (13) where it is also cooled through the
chamber (11). Nitrogen (12) is used to purge air infiltrated while inserting the
sample and it is also used to cool down the sample before exiting the furnace.
Sample temperature is monitored at the cooling chamber and during the
experiments through thermocouples (17) and (16) respectively. The behaviour of
the sample during the experiment can be observed through glass window (14).
The syngas exits through pipe (20) where the sampling probe (21) collects gas
for analysis. Prior to composition analysis, the sampled syngas is cleaned by
passing through sampling train (22). The syngas enters the first flat bottomed

29
flask which is in ice bath that allows the collection of syngas condensates that
includes water vapour. Further condensation is enhanced by a condenser. On
exiting the condenser the syngas enters a series of three bottles that are
contained in a second ice bath. Further syngas condensates and particulates are
collected in the first bottle that contains water. The second bottle and third bottle
contains iso-butanol (Isobutyl alcohol), which allows absorption of all tars
remaining in the syngas after exiting the first bottle. A clean syngas exits the
third bottle and enters the fourth dry bottle that contains a dry cotton wool. The
cotton wool allows further cleaning of the gas and traps all the escaping
particulates.
Online carbon monoxide and carbon dioxide analyzer type Maihak Multor 610
was utilized to monitor flue gas composition whereas mass loss data was
measured by a digital online balance (19) type Radwag model WPX 1500.
Furthermore, a micro GC monitored the syngas composition with respect to CO,
CO2, CH4, C2H4, C2H6, and C2H2 species. All data generated by the
thermocouples, gas analyzer, micro GC, and digital balance were collected in a
laptop computer via TCP/IP multiplexer type Keithley 2710.
F
F
F
1
4 2
7
38
9
1213
1615
11
20
21
6
14
22
5
O2
N2
10
18
1719
To data acquisition
system
To gas
analyzers
Figure 5: The high temperature gasification test rig
30
5. RESULTS AND DISCUSSION
5.1 CHEMICAL COMPOSITION OF TROPICAL BIOMASSES
A total of 15 tropical biomasses were analyzed for their chemical composition.
The analyzed materials were palm waste, coffee husks, cashew nut shells (CNS),
rice husks and bran, bagasse, sisal waste, jatropha seeds, and mango stem.
Results of their chemical properties as established by undertaking proximate and
ultimate analysis are detailed in Table 9. With respect to biomass materials
analysis done by Jenkins et al. [50], the analyzed tropical biomasses have
comparable heating value and contents of volatiles, carbon, hydrogen and
oxygen. Furthermore, the relative content of nitrogen, sulphur, and chlorine is
marginal.
The relatively higher presence of chlorine (Cl) and sulphur (S) in biomass as
exhibited in the palm branch and jatropha seeds are not desirable combustion
properties. Chlorine and sulphur are the major contributing factor to ash formation
as they facilitate the mobility of inorganic compounds from the fuel to surfaces
where they form the corrosive compounds [51, 52].

31
Table 9: Tropical biomasses chemical composition
MATERIAL AND PROPERTY PALM
STEM
PALM
BRANCH
PALM
FIBRE
PALM
SHELLS
COFFEE
HUSKS
MASASI
CNS
OLAM
CNS
RICE
HUSKS
Proximate analysis (%), dry basis
Moisture 9.10 8.10 4.98 8.40 10.10 6.70 6.10 8.80
Volatile matter 81.20 79.60 79.00 75.40 83.20 84.10 84.80 59.20
Fixed carbon 15.30 12.60 9.30 20.00 14.30 14.00 13.10 14.60
Ash 3.50 7.80 11.80 4.60 2.50 1.90 2.00 26.20
Ultimate analysis (%), dry basis
C 47.50 45.60 52.20 51.50 49.40 56.00 56.90 35.60
H 5.90 5.60 7.10 5.70 6.10 6.90 7.00 4.50
N 0.28 0.19 0.70 0.36 0.81 0.44 0.45 0.19
O (by difference) 42.50 39.30 28.00 37.70 41.20 34.70 33.60 33.40
Cl 0.18 1.33 0.06 0.05 0.03 0.03 0.03 0.08
S 0.13 0.16 0.07 0.03 0.07 0.05 0.04 0.02
Higher heating value (MJ/kg) 17.38 16.24 21.98 19.29 18.34 22.38 22.83 13.24
"H:C" Ratio 0.12 0.12 0.14 0.11 0.12 0.12 0.12 0.13
"O:C" Ratio 0.89 0.86 0.54 0.73 0.83 0.62 0.59 0.94

32
MATERIAL AND PROPERTY RICE
BRAN
TPC MILL
BAGASSE
SISAL
BOLES
SISAL
POLE
SISAL
LEAF
JATROPHA
SEEDS
MANGO
STEM
Proximate analysis (%), dry basis
Moisture 7.80 9.00 7.50 10.10 8.50 6.60 7.50
Volatile matter 64.60 80.50 84.10 79.30 80.20 80.30 83.50
Fixed carbon 14.20 16.20 12.80 14.60 12.60 14.70 12.00
Ash 21.10 3.30 3.10 6.10 7.20 5.00 4.50
Ultimate analysis (%), dry basis
C 37.80 48.10 48.00 47.00 47.00 56.60 48.00
H 5.00 5.90 6.00 6.00 5.70 7.50 5.80
N 0.55 0.15 0.10 1.66 0.14 3.16 0.13
O (by difference) 35.40 42.40 42.70 39.10 39.90 27.40 41.50
Cl 0.09 0.07 0.06 0.05 0.04 0.12 0.03
S 0.05 0.02 0.03 0.13 0.03 0.17 <0.012
Higher heating value (MJ/kg) 13.93 17.33 17.20 17.35 17.23 21.90 16.90
"H:C" Ratio 0.13 0.12 0.13 0.13 0.12 0.13 0.12
"O:C" Ratio 0.94 0.88 0.89 0.83 0.85 0.48 0.86
33
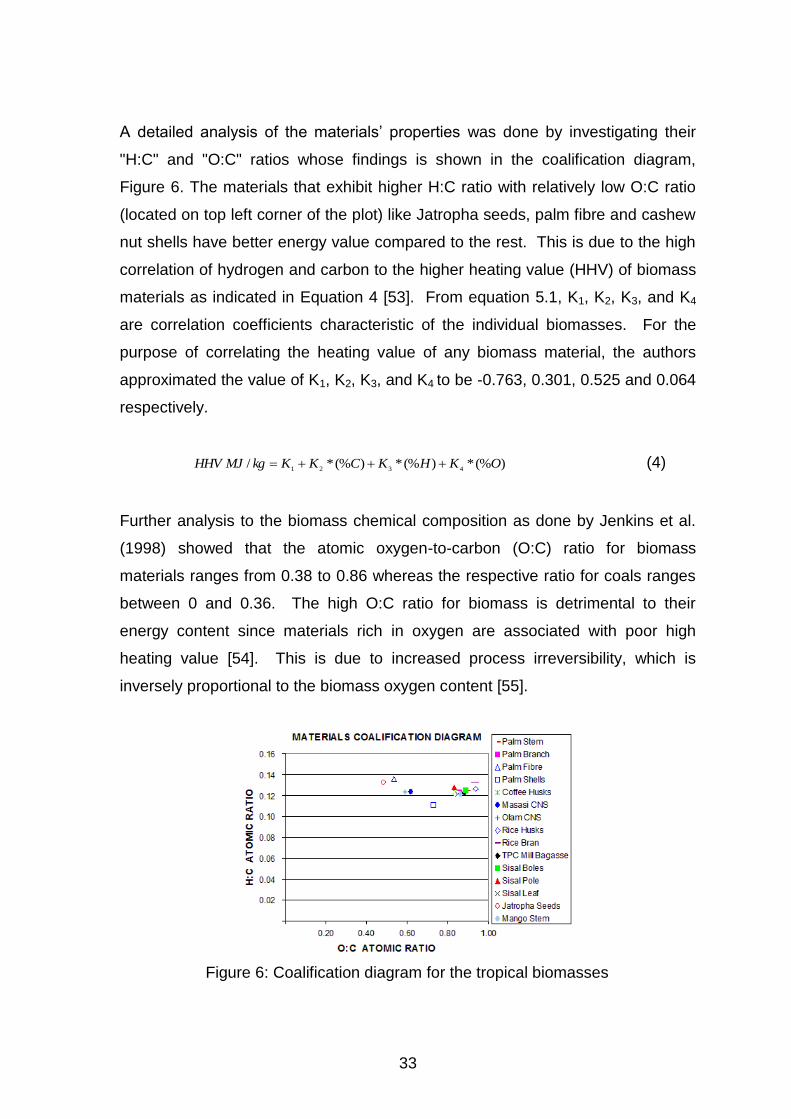
A detailed analysis of the materials‟ properties was done by investigating their
"H:C" and "O:C" ratios whose findings is shown in the coalification diagram,
Figure 6. The materials that exhibit higher H:C ratio with relatively low O:C ratio
(located on top left corner of the plot) like Jatropha seeds, palm fibre and cashew
nut shells have better energy value compared to the rest. This is due to the high
correlation of hydrogen and carbon to the higher heating value (HHV) of biomass
materials as indicated in Equation 4 [53]. From equation 5.1, K1, K2, K3, and K4
are correlation coefficients characteristic of the individual biomasses. For the
purpose of correlating the heating value of any biomass material, the authors
approximated the value of K1, K2, K3, and K4 to be -0.763, 0.301, 0.525 and 0.064
respectively.
)(%*)(%*)(%*/4321
OKHKCKKkgMJHHV (4)
Further analysis to the biomass chemical composition as done by Jenkins et al.
(1998) showed that the atomic oxygen-to-carbon (O:C) ratio for biomass
materials ranges from 0.38 to 0.86 whereas the respective ratio for coals ranges
between 0 and 0.36. The high O:C ratio for biomass is detrimental to their
energy content since materials rich in oxygen are associated with poor high
heating value [54]. This is due to increased process irreversibility, which is
inversely proportional to the biomass oxygen content [55].
Figure 6: Coalification diagram for the tropical biomasses

34
5.2 THERMAL DEGRADATION OF TROPICAL BIOMASSES
5.2.1 Mass Loss Characteristics
The mass loss characteristics of five selected tropical biomasses as derived from
thermogravimetry analysis are represented by Figure 7. All TG thermograms
clearly showed three regions of moisture release, devolatilization, and char
degradation. The TG profiles are typical for biomasses as observed by other
researchers [54, 56].
Figure 7: TG thermogram characteristics based on the coffee husks sample
The study findings on the mass loss during the moisture release stage shows that
the cashew nut shells suffered the most mass loss of 12.27% compared to the
rest whose mass loss was below 8%. Coffee husks and bagasse suffered a
relatively high mass loss of 7.16% and 6.33% respectively. The least mass loss
due to moisture release was observed from the palm stem, which experienced a
mass loss of 3.55% (Table 10). The apparently higher moisture released from the
CNS is due to a simultaneous moisture and low temperature volatiles release.
The presence of low temperature volatiles in the cashew nut shell liquid was also
mentioned by Das and Ganesh [57]. While extracting bio-oil from the CNS, the
authors found that a larger portion of the bio-oil oozed out from the CNS up to a
temperature of 150°C. Analysis of the resulting bio-oil depicted a moisture
content of 3.5%. Further analysis of the DTG profile for the CNS shows two

35
peaks in the moisture region. The two moisture peaks have same value of -
1.1%/min but appears at higher temperature (133°C and 161°C) compared to the
remaining materials whose moisture peaks occurred at about 80°C. This shows
that the moisture in the CNS material is entrained in its cell walls and for this
particular structure its evaporation requires more energy and this occurs at higher
temperatures [58].
Table 10: Mass loss summary
SNO MATERIAL
MASS LOSS, % BURNOUT TEMPERATURE,
C MOISTURE
VOLATILES RELEASE
CHAR
1 Bagasse 6.33 63.81 15.88 377.00
2 Palm stem 3.55 52.25 12.84 365.00
3 Cashew nut shells (CNS)
12.27 44.80 20.94 364.01
4 Coffee husks 7.16 46.77 17.39 378.00
5 Sisal bole 4.67 57.47 18.41 382.00
AVERAGE 6.80 53.02 17.09 373.20
Volatiles release stage is the most important region of the thermogram shown in
Figure 7 since on the average over 53% of the materials´ mass loss was
experienced in this region. Details presented in Table 10 show that the bagasse
and sisal bole had the highest mass loss of 63.81% and 57.47% respectively.
Mass loss to the palm stem was the average at the value of 52.25% whereas the
least mass loss were from coffee husks and cashew nut shells whose values
were 46.77% and 44.8% respectively.
5.2.2 Rate of Mass Loss Characteristics
Rate of mass loss as expressed by the derivative TG (DTG) is an indication of
reactivity of the material under investigation [59, 60]. From the DTG
thermograms, the reactivity is indicated by the respective peaks due to
hemicellulose and cellulose degradation. Table 11 summarizes the characteristic
properties of the analyzed materials as extracted from their respective DTG
thermograms as defined by Jeguirim and Trouvé [61] and represented in Figure 8.

36
Besides indicating the material‟s reactivity, these characteristics are also important
in the establishment of the material‟s kinetic parameters.
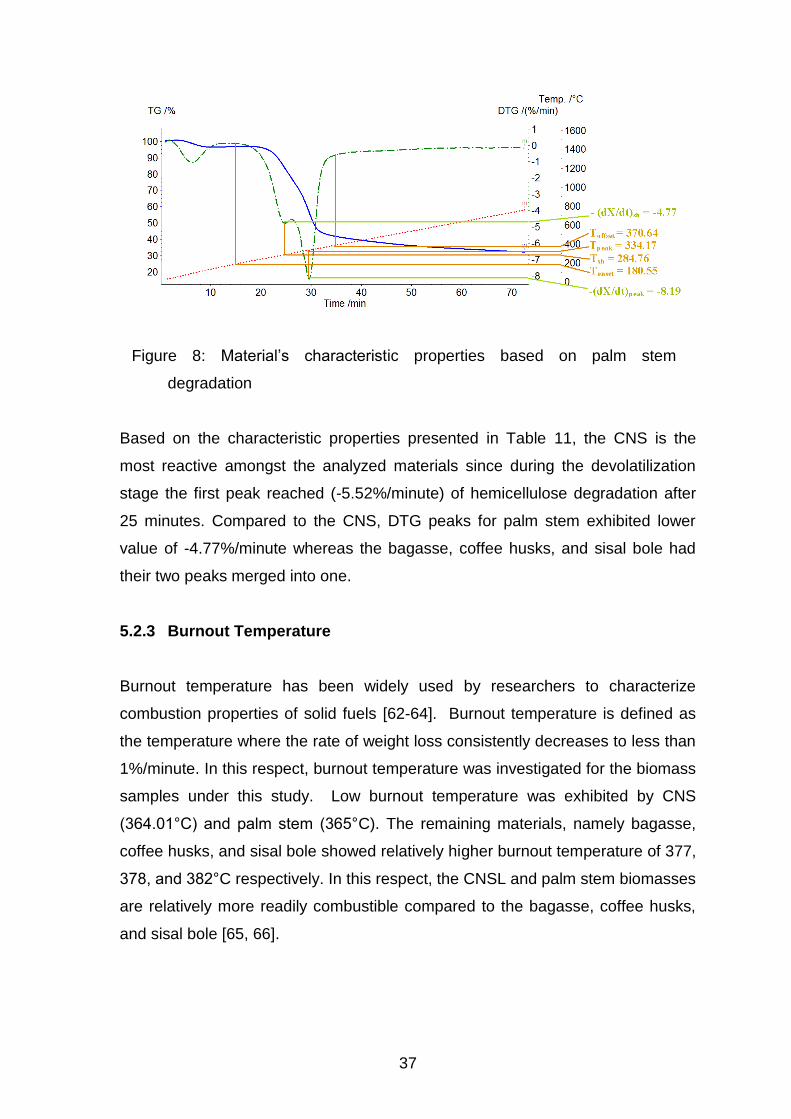
Table 11: Material‟s characteristic properties summary
MATERIAL AND CHARACTERISTIC PROPERTY
Tonset [°C]
Hemicellulose peak
Cellulose peak Toffset [°C] (-dX/dt)sh
[%/Min.] Tsh [°C]
(-dX/dt)peak [%/Min.]
Tpeak [°C]
Bagasse 234.57 -9.02 346.63 397.61
Palm stem 180.55 -4.77 284.76 -8.19 334.17 370.64
Cashew nut shells (CNS)
203.13 -5.52 291.03 -4.35 343.02 371.97
Coffee husks 218.75 -6.33 352.74 381.75
Sisal bole 122.83 -8.10 353.18 406.70
Where,
Tonset Is the extrapolated onset temperature calculated from the
partial peak that results from the decomposition of the
hemicellulose component
(-dX/dt)sh Is the overall maximum of the hemicellulose decomposition
rate
Tsh Is the temperature corresponding the overall maximum of the
hemicellulose decomposition rate
(-dX/dt)peak Is the overall maximum of the cellulose decomposition rate
Tpeak Is the temperature corresponding the overall maximum of the
cellulose decomposition rate
Toffset Is the extrapolated offset temperature of the (-dX/dt) curves.
This value describes the end of the cellulose decomposition.
37
Figure 8: Material‟s characteristic properties based on palm stem
degradation
Based on the characteristic properties presented in Table 11, the CNS is the
most reactive amongst the analyzed materials since during the devolatilization
stage the first peak reached (-5.52%/minute) of hemicellulose degradation after
25 minutes. Compared to the CNS, DTG peaks for palm stem exhibited lower
value of -4.77%/minute whereas the bagasse, coffee husks, and sisal bole had
their two peaks merged into one.
5.2.3 Burnout Temperature
Burnout temperature has been widely used by researchers to characterize
combustion properties of solid fuels [62-64]. Burnout temperature is defined as
the temperature where the rate of weight loss consistently decreases to less than
1%/minute. In this respect, burnout temperature was investigated for the biomass
samples under this study. Low burnout temperature was exhibited by CNS
(364.01°C) and palm stem (365°C). The remaining materials, namely bagasse,
coffee husks, and sisal bole showed relatively higher burnout temperature of 377,
378, and 382°C respectively. In this respect, the CNSL and palm stem biomasses
are relatively more readily combustible compared to the bagasse, coffee husks,
and sisal bole [65, 66].
38
5.3 LABORATORY GASIFICATION OF COFFEE HUSKS
By utilizing the laboratory test rig shown in Figure 5, experiments on high
temperature gasification of coffee husks were done for the purpose of
investigating the influence of steam and oxygen oxidizers while varying
temperature in three different ranges of 900, 800, and 700°C. During these
gasification experiments, the oxygen level was maintained at three
concentrations of 2, 3, and 4%.
5.3.1 Effects of Gasification Agent on Heating Rate
The sample centre temperature profiles resulting from this study are shown in
Figure 9 (a) to (c). It can be generalized that in all gasification experiments that
were carried using both oxygen and steam oxidizers achieved relatively higher
sample centre temperature compared to the experiments that were carried using
individual oxidizers including those under inert nitrogen condition. A detailed
analysis of the profiles shows that this effect was more remarkable in all
experimental cases that were carried at 800°C including all the experimental
cases that were carried with 4% oxygen concentration. Maintaining the reactor
temperature at 800°C is beneficial since this temperature is thermodynamically
favourable for higher yield of hydrogen [67].
The high sample centre temperature is partly induced by the highly preheated
steam oxidizer, which provides the extra reaction enthalpy. Furthermore, the
effect of exothermic character of the water-gas shift reaction (Eq. 5) and the
carbon oxidation reaction (Eq. 6) are responsible for liberating a sensible heat at
elevated oxygen concentrations as for the cases of 4% oxygen concentration
experiments.
222 HCOOHCO (5)
22 COOC (6)

39
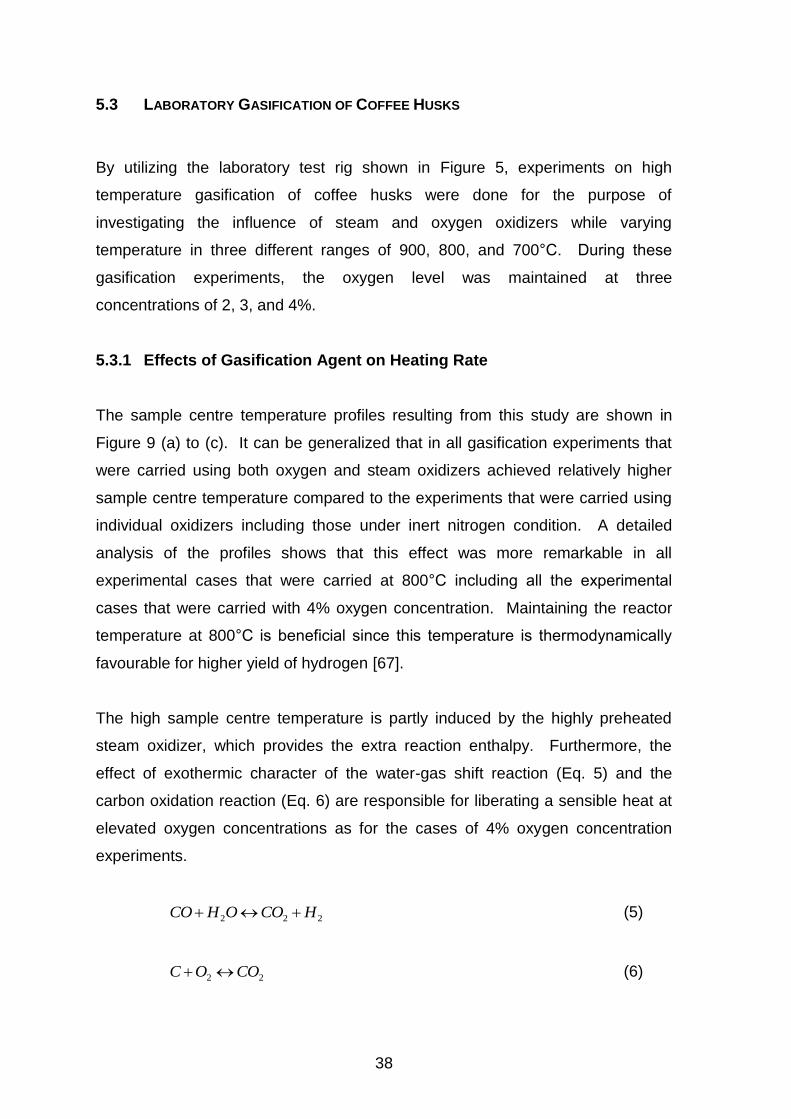
5.3.2 Gasification Rate
The coffee husk gasification rate profiles as indicated by the mass loss to the
respective experimental runs are shown in Figure 10 (a) to (c). From Figure 10
(a) on the effect of varying temperature on gasification rate, it can be seen that
gasification at 900°C had an overall higher gasification as exhibited by less
materials left at the end of the experiment. For instance, during the inert nitrogen
condition, 7% of coffee husk remained for the case of 900°C whereas the residue
mass for the gasification at 800 and 700°C was 10 and 17% respectively.
Furthermore, the higher temperature (900°C) had the effect of accelerating
gasification rate in the initial stages, which is mainly for devolatilization of the
biomass material.

40
Figure 9 (a): Sample temperature at 700°C with varied oxygen concentration
Figure 9 (b): Sample temperature at 800°C with varied oxygen concentration
Figure 9 (c): Sample temperature at 900°C with varied oxygen concentration
Figure 9: Sample temperature profiles
SAMPLE TEMPERATURE AT 700 C; O2 = 2%
0
200
400
600
800
010
020
030
040
050
060
0
TIME, S.
TE
MP
., C
.
O2=2%
N2
(O2-Steam)
(Steam)
SAMPLE TEMPERATURE AT 700 C; O2 = 3%
0
200
400
600
800
010
020
030
040
050
060
0
TIME, S.
TE
MP
., C
.
O2=3%
N2
(O2-Steam)
(Steam)
SAMPLE TEMPERATURE AT 700 C; O2 = 4%
0
200
400
600
800
010
020
030
040
050
060
0
TIME, S.
TE
MP
., C
.
O2=4%
N2
(O2-Steam)
(Steam)
SAMPLE TEMPERATURE AT 800 C; O2 = 2%
0
200
400
600
800
010
020
030
040
050
060
0
TIME, S.
TE
MP
., C
.
N2
O2=2%
(O2-Steam)
(Steam)
SAMPLE TEMPERATURE AT 800 C; O2 = 3%
0
200
400
600
800
010
020
030
040
050
060
0
TIME, S.
TE
MP
., C
.
N2
O2=3%
(O2-Steam)
(Steam)
SAMPLE TEMPERATURE AT 800 C; O2 = 4%
0
200
400
600
800
010
020
030
040
050
060
0
TIME, S.
TE
MP
., C
.
N2
O2=4%
(O2-Steam)
(Steam)
SAMPLE TEMPERATURE AT 900 C; O2 = 2%
0
200
400
600
800
1000
0 50 100
150
200
250
300
350
400
450
TIME, S.
TE
MP
., C
N2
O2=2%
(O2-Steam)
(Steam)
SAMPLE TEMPERATURE AT 900 C; O2 = 3%
0
200
400
600
800
1000
0 50 100
150
200
250
300
350
400
450
TIME, S.
TE
MP
., C
N2
O2 = 3%
(O2-Steam)
(Steam)
SAMPLE TEMPERATURE AT 900 C; O2 = 4%
0
200
400
600
800
1000
0 50 100
150
200
250
300
350
400
450
TIME, S.
TE
MP
., C
N2
O2 = 4%
(O2-Steam)
(Steam)

41
Figure 10 (b) and (c) shows that steam injection, generally, had no positive
effects on enhancing the mass loss of the material under gasification. Figure 10
(b), which represents the variation of temperature at fixed oxygen concentration
of 2%, shows that in all cases the residue mass for steam injected experiments
was higher than the without cases. Similarly, in Figure 10 (c), with exception of
the case of 3% oxygen concentration the remaining cases showed no
enhancement in mass loss due to steam injection. Steam oxidizer supports gas
phase reactions namely water gas shift (Eq. 5) and steam reforming of methane
(Eq. 7), which at higher temperature result in more hydrogen and CO formation.
Steam and carbon reaction under the endothermic primary water gas shift
reaction (Eq. 8) requires higher temperatures above 1000°C. Table 12
summarizes the residue masses for Figure 10 (b) and (c).
224 3HCOOHCH (7)
22 HCOOHC (8)
Table 12: Residue mass summary for steam injected experiments
RESIDUE MASS AT 2% OXYGEN CONCENTRATION
TEMPERATURE 700°C 800°C 900°C
Without steam 4.74 2.93 1.76
With steam 18.42 9.76 13.53
RESIDUE MASS AT 900°C
OXYGEN CONCENTRATION 2% 3% 4%
Without steam 2.93 27.27 8.18
With steam 13.17 13.64 23.64
Figure 10 (a): Effects of temperature and agent on gasification rate
N2 condition
Steam injected
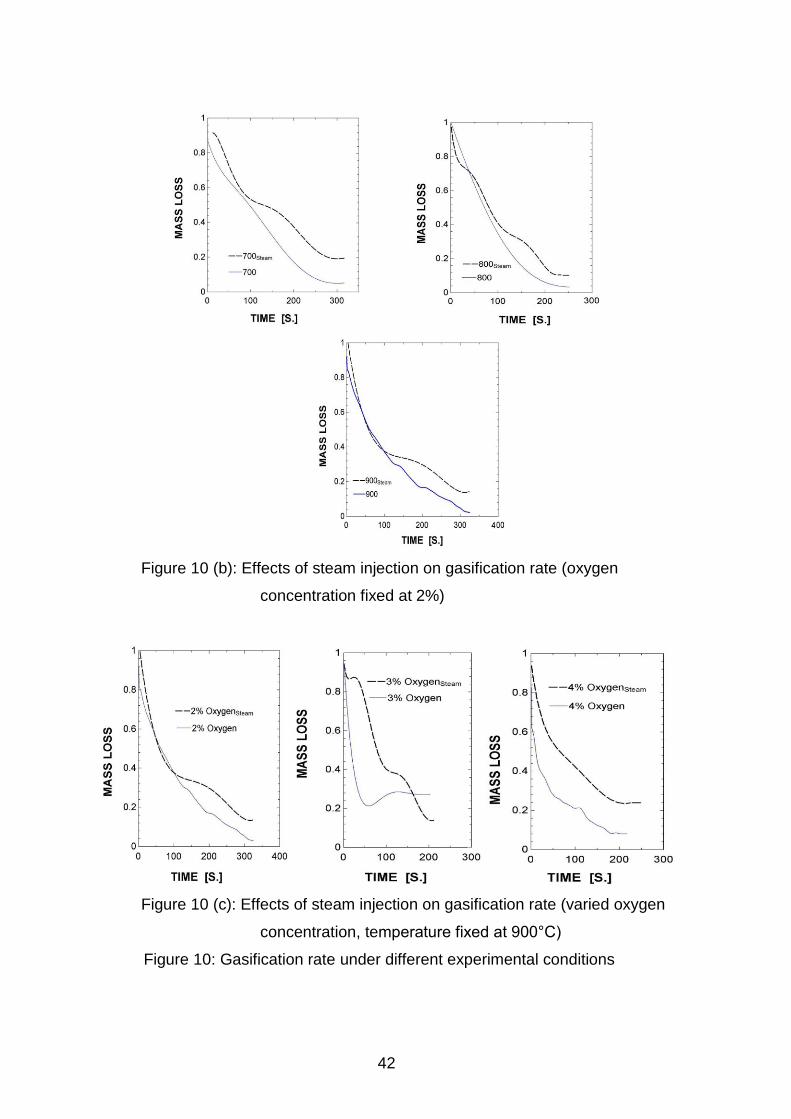
42
Figure 10 (b): Effects of steam injection on gasification rate (oxygen
concentration fixed at 2%)
Figure 10 (c): Effects of steam injection on gasification rate (varied oxygen
concentration, temperature fixed at 900°C)
Figure 10: Gasification rate under different experimental conditions

43
5.3.3 Syngas Evolution
The gasification experiments under the study generated data on carbon
monoxide and carbon dioxide evolution. The two gases are major components of
the syngas though each has a different role on the syngas quality and heating
value. Being combustible, the carbon monoxide is desired component of the
syngas whereas carbon dioxide is not desired as it plays a negative role on
syngas heating value.
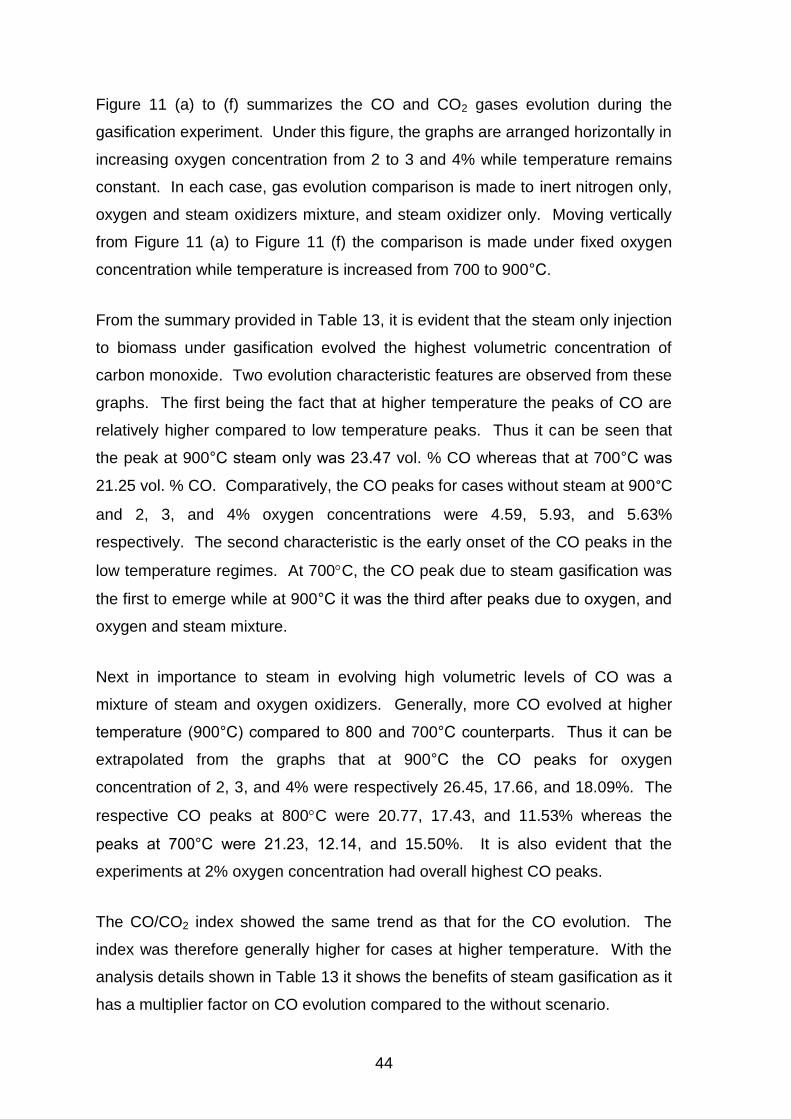
44
Figure 11 (a) to (f) summarizes the CO and CO2 gases evolution during the
gasification experiment. Under this figure, the graphs are arranged horizontally in
increasing oxygen concentration from 2 to 3 and 4% while temperature remains
constant. In each case, gas evolution comparison is made to inert nitrogen only,
oxygen and steam oxidizers mixture, and steam oxidizer only. Moving vertically
from Figure 11 (a) to Figure 11 (f) the comparison is made under fixed oxygen
concentration while temperature is increased from 700 to 900°C.
From the summary provided in Table 13, it is evident that the steam only injection
to biomass under gasification evolved the highest volumetric concentration of
carbon monoxide. Two evolution characteristic features are observed from these
graphs. The first being the fact that at higher temperature the peaks of CO are
relatively higher compared to low temperature peaks. Thus it can be seen that
the peak at 900°C steam only was 23.47 vol. % CO whereas that at 700°C was
21.25 vol. % CO. Comparatively, the CO peaks for cases without steam at 900°C
and 2, 3, and 4% oxygen concentrations were 4.59, 5.93, and 5.63%
respectively. The second characteristic is the early onset of the CO peaks in the
low temperature regimes. At 700C, the CO peak due to steam gasification was
the first to emerge while at 900°C it was the third after peaks due to oxygen, and
oxygen and steam mixture.
Next in importance to steam in evolving high volumetric levels of CO was a
mixture of steam and oxygen oxidizers. Generally, more CO evolved at higher
temperature (900°C) compared to 800 and 700°C counterparts. Thus it can be
extrapolated from the graphs that at 900°C the CO peaks for oxygen
concentration of 2, 3, and 4% were respectively 26.45, 17.66, and 18.09%. The
respective CO peaks at 800C were 20.77, 17.43, and 11.53% whereas the
peaks at 700°C were 21.23, 12.14, and 15.50%. It is also evident that the
experiments at 2% oxygen concentration had overall highest CO peaks.
The CO/CO2 index showed the same trend as that for the CO evolution. The
index was therefore generally higher for cases at higher temperature. With the
analysis details shown in Table 13 it shows the benefits of steam gasification as it
has a multiplier factor on CO evolution compared to the without scenario.
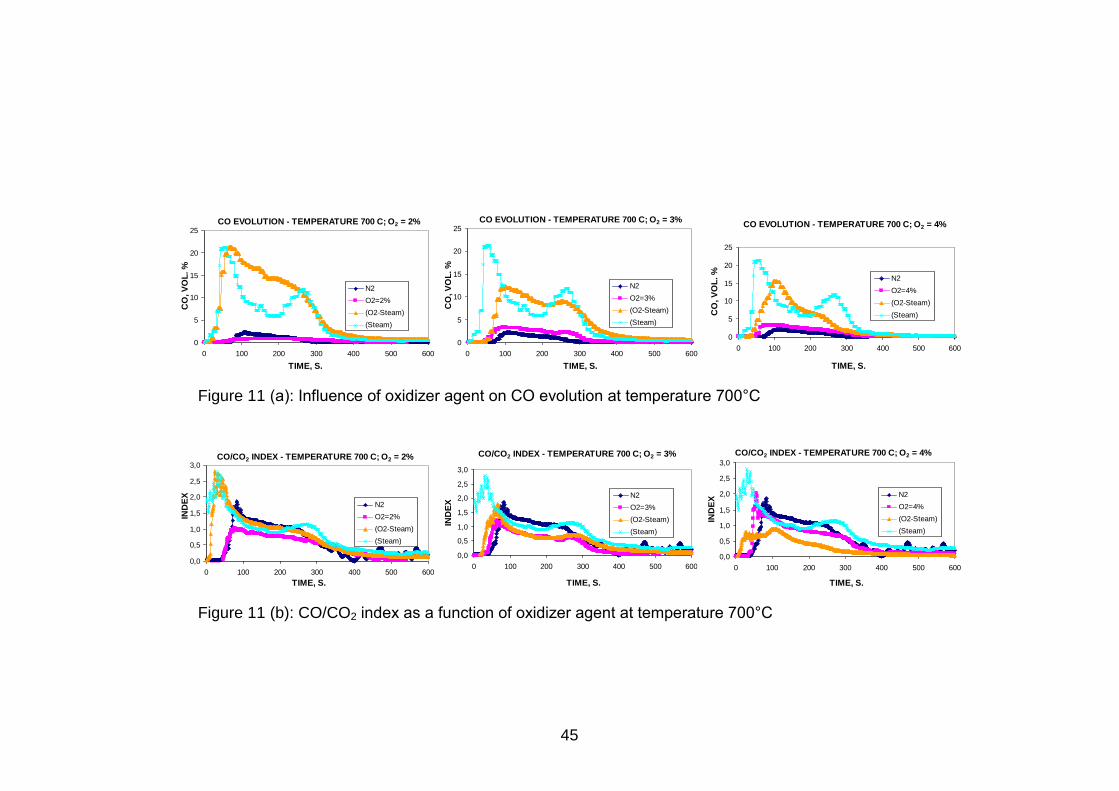
45
Figure 11 (a): Influence of oxidizer agent on CO evolution at temperature 700°C
Figure 11 (b): CO/CO2 index as a function of oxidizer agent at temperature 700°C
CO EVOLUTION - TEMPERATURE 700 C; O2 = 2%
0
5
10
15
20
25
0 100 200 300 400 500 600
TIME, S.
CO
, V
OL
. %
N2
O2=2%
(O2-Steam)
(Steam)
CO EVOLUTION - TEMPERATURE 700 C; O2 = 3%
0
5
10
15
20
25
0 100 200 300 400 500 600
TIME, S.
CO
, V
OL
. %
N2
O2=3%
(O2-Steam)
(Steam)
CO EVOLUTION - TEMPERATURE 700 C; O2 = 4%
0
5
10
15
20
25
0 100 200 300 400 500 600
TIME, S.
CO
, V
OL
. %
N2
O2=4%
(O2-Steam)
(Steam)
CO/CO2 INDEX - TEMPERATURE 700 C; O2 = 2%
0,0
0,5
1,0
1,5
2,0
2,5
3,0
0 100 200 300 400 500 600
TIME, S.
IND
EX
N2
O2=2%
(O2-Steam)
(Steam)
CO/CO2 INDEX - TEMPERATURE 700 C; O2 = 3%
0,0
0,5
1,0
1,5
2,0
2,5
3,0
0 100 200 300 400 500 600
TIME, S.
IND
EX
N2
O2=3%
(O2-Steam)
(Steam)
CO/CO2 INDEX - TEMPERATURE 700 C; O2 = 4%
0,0
0,5
1,0
1,5
2,0
2,5
3,0
0 100 200 300 400 500 600
TIME, S.
IND
EX
N2
O2=4%
(O2-Steam)
(Steam)

46
Figure 11 (c): Influence of oxidizer agent on CO evolution at temperature 800°C
Figure 11 (d): CO/CO2 index as a function of oxidizer agent at temperature 800°C
Figure 11 (e): Influence of oxidizer agent on CO evolution at temperature 900°C
CO EVOLUTION - TEMPERATURE 800C; O2 = 2%
0
5
10
15
20
25
0 100 200 300 400 500 600
TIME, S.
CO
, V
OL
. %
N2
O2=2%
(O2-Steam)
CO EVOLUTION - TEMPERATURE 800C; O2 = 3%
0
2
4
6
8
10
12
14
16
18
20
0 100 200 300 400 500 600
TIME, S.
CO
, V
OL
. %
N2
O2=3%
(O2-Steam)
CO EVOLUTION - TEMPERATURE 800C; O2 = 4%
0
2
4
6
8
10
12
14
0 100 200 300 400 500 600
TIME, S.
CO
, V
OL
. %
N2
O2=4%
(O2-Steam)
CO/CO2 INDEX - TEMPERATURE 800 C; O2 = 2%
0,0
0,5
1,0
1,5
2,0
2,5
3,0
0 100 200 300 400 500 600
TIME, S.
IND
EX
N2
O2=2%
(O2-Steam)
CO/CO2 INDEX - TEMPERATURE 800C; O2 = 3%
0,0
0,5
1,0
1,5
2,0
2,5
0 100 200 300 400 500 600
TIME, S.
IND
EX
N2
O2=3%
(O2-Steam)
CO/CO2 INDEX - TEMPERATURE 800C; O2 = 4%
0,0
0,5
1,0
1,5
2,0
2,5
0 100 200 300 400 500 600
TIME, S.
IND
EX
N2
O2=4%
(O2-Steam)
CO EVOLUTION - TEMPERATURE 900 C; O2 = 2%
0
5
10
15
20
25
30
0 100 200 300 400 500 600
TIME, S.
CO
, V
OL
. %
N2
O2=2%
(O2-Steam)
(Steam)
CO EVOLUTION - TEMPERATURE 900 C; O2 = 3%
0
5
10
15
20
25
0 100 200 300 400 500 600
TIME, S.
CO
, V
OL
. %
N2
O2=3%
(O2-Steam)
(Steam)
CO EVOLUTION - TEMPERATURE 900 C; O2 = 4%
0
5
10
15
20
25
0 100 200 300 400 500 600
TIME, S.
CO
, V
OL
. %
N2
O2=4%
(O2-Steam)
(Steam)
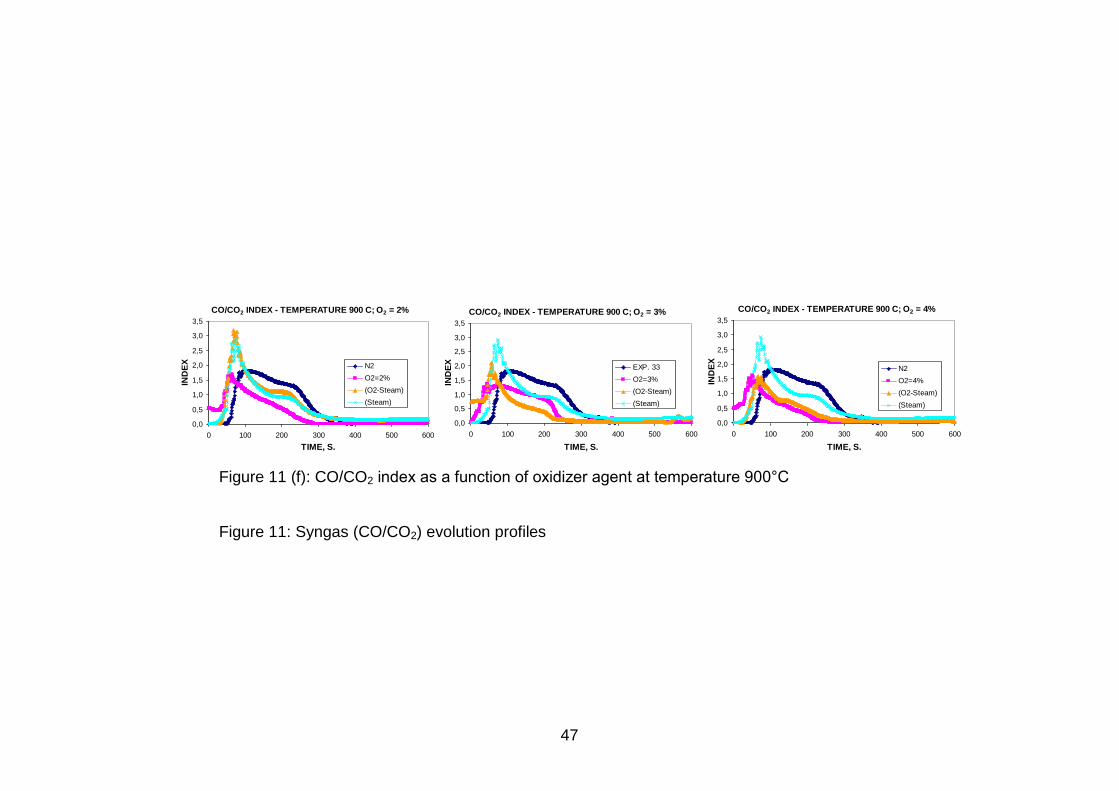
47
Figure 11 (f): CO/CO2 index as a function of oxidizer agent at temperature 900°C
Figure 11: Syngas (CO/CO2) evolution profiles
CO/CO2 INDEX - TEMPERATURE 900 C; O2 = 2%
0,0
0,5
1,0
1,5
2,0
2,5
3,0
3,5
0 100 200 300 400 500 600
TIME, S.
IND
EX N2
O2=2%
(O2-Steam)
(Steam)
CO/CO2 INDEX - TEMPERATURE 900 C; O2 = 3%
0,0
0,5
1,0
1,5
2,0
2,5
3,0
3,5
0 100 200 300 400 500 600
TIME, S.IN
DE
X
EXP. 33
O2=3%
(O2-Steam)
(Steam)
CO/CO2 INDEX - TEMPERATURE 900 C; O2 = 4%
0,0
0,5
1,0
1,5
2,0
2,5
3,0
3,5
0 100 200 300 400 500 600
TIME, S.
IND
EX
N2
O2=4%
(O2-Steam)
(Steam)
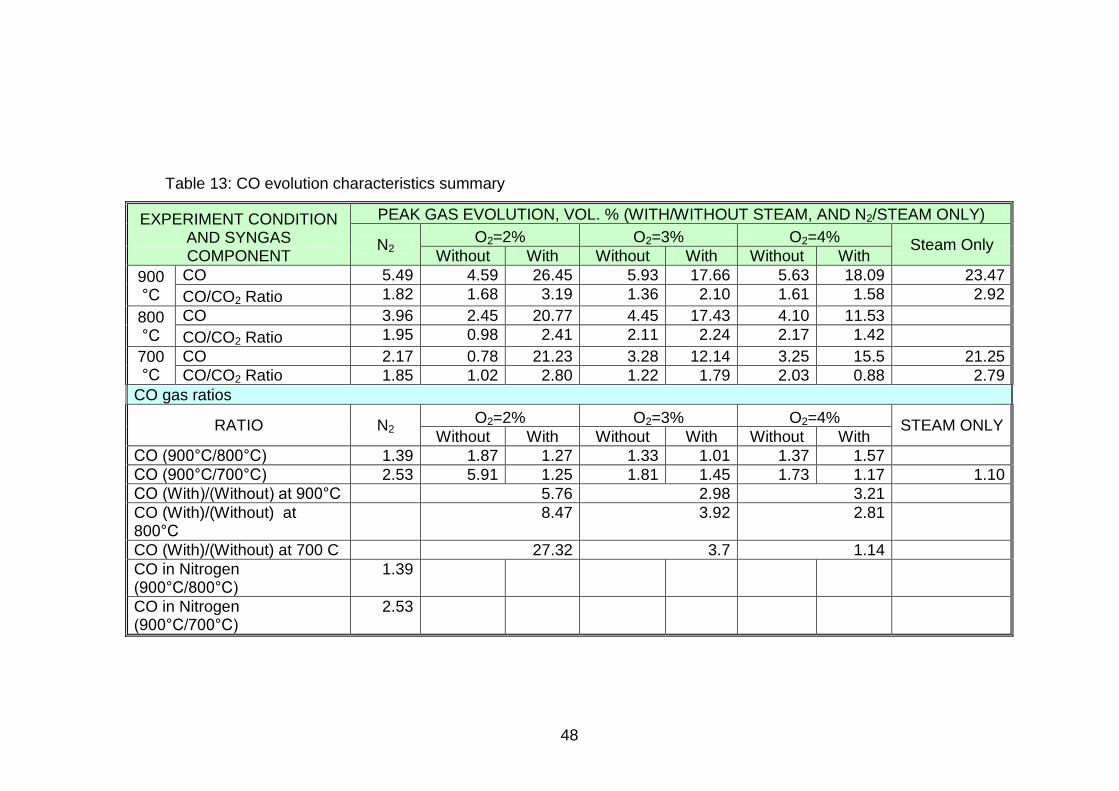
48
Table 13: CO evolution characteristics summary
EXPERIMENT CONDITION AND SYNGAS COMPONENT
PEAK GAS EVOLUTION, VOL. % (WITH/WITHOUT STEAM, AND N2/STEAM ONLY)
N2 O2=2% O2=3% O2=4%
Steam Only Without With Without With Without With
900 °C
CO 5.49 4.59 26.45 5.93 17.66 5.63 18.09 23.47
CO/CO2 Ratio 1.82 1.68 3.19 1.36 2.10 1.61 1.58 2.92
800 °C
CO 3.96 2.45 20.77 4.45 17.43 4.10 11.53
CO/CO2 Ratio 1.95 0.98 2.41 2.11 2.24 2.17 1.42
700 °C
CO 2.17 0.78 21.23 3.28 12.14 3.25 15.5 21.25
CO/CO2 Ratio 1.85 1.02 2.80 1.22 1.79 2.03 0.88 2.79
CO gas ratios
RATIO N2 O2=2% O2=3% O2=4%
STEAM ONLY Without With Without With Without With
CO (900°C/800°C) 1.39 1.87 1.27 1.33 1.01 1.37 1.57
CO (900°C/700°C) 2.53 5.91 1.25 1.81 1.45 1.73 1.17 1.10
CO (With)/(Without) at 900°C 5.76 2.98 3.21
CO (With)/(Without) at 800°C
8.47 3.92 2.81
CO (With)/(Without) at 700 C 27.32 3.7 1.14
CO in Nitrogen (900°C/800°C)
1.39
CO in Nitrogen (900°C/700°C)
2.53
49
5.3.4 Syngas Heating Value
The syngas higher heating value (HHV) was obtained from the micro gas
chromatograph (GC) data, which was collected during the experimentation. The
micro GC data was collected to selected experiments that were carried at 900 °C
using oxygen, steam and, a mixture of oxygen and steam oxidizers. From the
syngas evolution profiles presented in Figure 12 (a) and (b), it can be seen that
steam gasification consistently evolved more combustible gas components of H2,
CO, and CH4. Higher hydrocarbons profile had the same characteristics. The
syngas heating value is calculated based on these combustible gas components
[68, 69]. The summary shown in Table 14 reveals that the HHV of syngas from
3% oxygen oxidizer was 14,21 MJ/nm3 while the HHV from steam, and oxygen
and steam oxidizer mixtures gasification was 11,95 MJ/nm3 and 11,18 MJ/nm3
respectively. The results of steam gasification is plausible though due to
problems of merging peaks associated with early onset of syngas components
from steam gasification, the micro GC could not capture all the peaks of H2, CO,
and CH4.

50
Figure 12 (a): Syngas composition with respect to H2, CO, and CH4 components at 900°C
Figure 12 (b): Syngas composition with respect to higher hydrocarbons components at 900°C
Figure 12: Syngas evolution profiles
H2 GAS EVOLUTION, VOL. %
0
2
4
6
8
10
0 100 200 300 400 500 600
TIME, S.
EV
OL
UT
ION
, V
OL
. %
O2=3%
Steam
O2-Steam
CO GAS EVOLUTION, VOL. %
0
5
10
15
20
0 100 200 300 400 500 600
TIME, S.
EV
OL
UT
ION
, V
OL
. %
O2=3%
Steam
O2-Steam
CH4 GAS EVOLUTION, VOL. %
0
1
2
3
4
5
6
7
8
0 100 200 300 400 500 600
TIME, S.
EV
OL
UT
ION
, V
OL
. %
O2=3%
Steam
O2-Steam
C2H4 EVOLUTION, VOL. %
0,00
0,50
1,00
1,50
2,00
0 100 200 300 400 500 600 700 800
TIME, S.
EV
OL
UT
ION
, V
OL
. %
O2=3%
Steam
O2-Steam
C2H6 EVOLUTION, VOL. %
0,00
0,05
0,10
0,15
0,20
0,25
0,30
0,35
0,40
0 100 200 300 400 500 600 700 800
TIME, S.
EV
OL
UT
ION
, V
OL
. % O2=3%
Steam
O2-Steam
C2H2 GAS EVOLUTION, VOL. %
0,00
0,10
0,20
0,30
0,40
0,50
0,60
0,70
0 100 200 300 400 500 600 700 800
TIME, S.
EV
OL
UT
ION
, V
OL
. %
O2=3%
Steam
O2-Steam
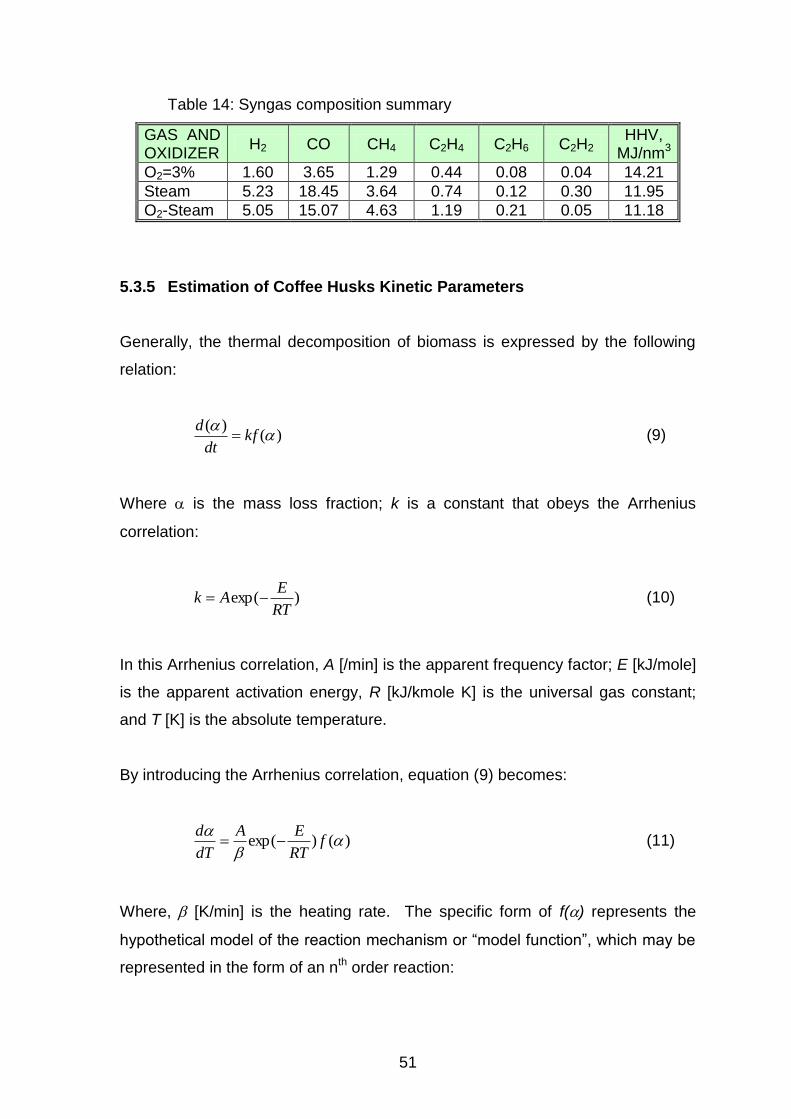
51
Table 14: Syngas composition summary
GAS AND OXIDIZER
H2 CO CH4 C2H4 C2H6 C2H2 HHV,
MJ/nm3
O2=3% 1.60 3.65 1.29 0.44 0.08 0.04 14.21
Steam 5.23 18.45 3.64 0.74 0.12 0.30 11.95
O2-Steam 5.05 15.07 4.63 1.19 0.21 0.05 11.18
5.3.5 Estimation of Coffee Husks Kinetic Parameters
Generally, the thermal decomposition of biomass is expressed by the following
relation:
)()(
kfdt
d (9)
Where is the mass loss fraction; k is a constant that obeys the Arrhenius
correlation:
)exp(RT
EAk (10)
In this Arrhenius correlation, A [/min] is the apparent frequency factor; E [kJ/mole]
is the apparent activation energy, R [kJ/kmole K] is the universal gas constant;
and T [K] is the absolute temperature.
By introducing the Arrhenius correlation, equation (9) becomes:
)()exp(
f
RT
EA
dT
d (11)
Where, [K/min] is the heating rate. The specific form of f() represents the
hypothetical model of the reaction mechanism or “model function”, which may be
represented in the form of an nth order reaction:

52
nf )1()( (12)
Following Coats and Redfern [70] the approximation to the integral form of (11)
is:
RT
E
E
RT
E
AR
T
g ]
21[ln]
)(ln[
2
(13)
and,
11
)1(1
1)1ln(
)( 1
nn
n
g n
(14)
By adopting the Coats and Redfern method, the kinetic parameters (A and E) of
the material under study can be derived from the thermo balance data. A plot of
2/)(ln[ Tg versus 1/T results in a straight line whose slope is equivalent to –E/R.
The frequency factor (A) is derived from the intercept of this line.
Integral and differential kinetic methods that bases on single heating rate
experiments are bound to errors for material involving complex reactions [71-73].
However, their adoption finds useful application in materials analysis [74-75].
Mass loss and rate of mass loss data for the experiment conducted at 900°C
nitrogen condition were adopted for estimating kinetic parameters as per the
Coats and Redfern algorithm. Figure 13 shows a plot of 2/)(ln[ Tg versus 1/T
with each line representing, respectively, results for reaction order (n) of 0, 1, 2,
and 3. From this figure it is evident that the reaction mechanism was highly
correlated to zero reaction order (R2 = 0.962). The apparent activation energy
and the frequency factor are therefore established to be 161 kJ/mol and
3.89x10⁴/minute respectively.

53
Figure 13: ln[g(α)/T2] versus 1/T for 900°C N2 condition experiment
6. CONCLUSION
Chemical composition characteristics was established to palm waste, coffee
husks, cashew nut shells (CNS), rice husks and bran, bagasse, sisal waste,
jatropha seeds, and mango stem. Results showed that the oxygen content
ranged from 27.40 to 42.70% where as that of carbon and hydrogen ranged from
35.60 to 56.90% and 4.50 to 7.50% respectively. On the other hand, the
elemental composition of nitrogen, sulphur and chlorine was marginal. These
properties are comparable to findings from other researchers. Based on the
results of thermal degradation characteristics, it was evident that the cashew nut
shells (CNS) was the most reactive amongst the analyzed materials since during
the devolatilization stage the first derivative TG (DTG) peak due to hemicellulose
degradation reached (-5.52%/minute) compared palm stem whose first peak was
-4.81%/minute. DTG first peak for the remaining materials was indistinct.
Results from the laboratory gasification experiments that were done to the coffee
husks showed that gasification at higher temperature, 900°C, had an overall
higher gasification rate as during the inert nitrogen condition, 7% of coffee husk
remained for the case of 900°C whereas the residue mass for the gasification at
LN(g( )/T2) Vs. 1/T (900 C)
y = -0,0296x - 9,9612
R2 = 0,8976
n=3y = -0,0185x - 11,065
R2 = 0,9267
n=2
y = -0,0193x - 12,499
R2 = 0,962
n=0
y = -0,0242x - 11,996
R2 = 0,952
n=1-15,00
-14,00
-13,00
-12,00
-11,00
-10,00
-9,00
-8,00
0,0
0231
0,0
0219
0,0
0210
0,0
0202
0,0
0195
0,0
0188
0,0
0182
0,0
0176
1/T
LN
(g(
)/T
2)

54
800 and 700°C was 10 and 17% respectively. Steam injection to the biomass
under high temperature gasification evolved the highest volumetric concentration
of carbon monoxide. The CO peak evolution at 900°C steam only was 23.47 vol.
% CO whereas that at 700°C was 21.25 vol. % CO. Comparatively, the CO
peaks for cases without steam at 900°C and 2, 3, and 4% oxygen concentrations
were 4.59, 5.93, and 5.63% respectively. Syngas heating value as calculated
from its composition as captured by the micro GC reveals that the HHV of syngas
from 3% oxygen oxidizer was 14,21 MJ/nm3 while the HHV from steam, and
oxygen and steam oxidizer mixtures gasification was 11,95 MJ/nm3 and 11,18
MJ/nm3 respectively.
The reaction mechanism of coffee husks gasification was established using the
mass loss and rate of mass loss data for the experiment conducted at 900°C
nitrogen condition. The results showed that its reaction mechanism was highly
correlated to zero reaction order. The respective apparent activation energy and
the frequency factor were established to be 161 kJ/mol and 3.89x10⁴/minute.
7 FUTURE WORK
The biomass materials under this study were successfully characterized with
respect to chemical composition, and thermal degradation. Laboratory scale
gasification also showed promising results. For the purpose of process design
prior to putting in place real gasification plants there are more detailed work to be
done. This will involve undertaking detailed simulation work for the purpose of
investigating various parameters such as moisture and inorganic materials, which
are influential in the syngas quality and performance of the HTAG process of
biomass. Parametric studies on the effect of moisture and inorganic materials
with respect to syngas gas composition, gas heating value, and cold gas
efficiency of the process need therefore be undertaken. The simulation work
need be validated by laboratory scale gasification.
55
REFERENCES
1. National Bureau of Statistics, The United Republic of Tanzania, (2006),
“Statistical Abstract 2006”, available online at <
http://www.nbs.go.tz/index.php?option=com_phocadownload&view=categor
y&id=70:orher-abstract&Itemid=106>
2. Ministry of Energy and Minerals, (2003), “The National Energy Policy of
Tanzania”
3. Mrindoko, B. and Mwihava, N. C. X. (2001), “Opportunities for Construction
Industry in the Energy and Mineral Sectors”, Construction Industry (CI)
Forum, April 2001, Dar es Salaam
4. Mwihava, N. C. X. (2004), “Brief Paper on Status of Renewable Energy
Development in Tanzania”
5. Mrindoko, B. Mwihava, N. C. X. and Mbise, H. (2003), “Energy Resources
for Manufacturing and Household Sectors”, Engineers' Registration board
(ERB) Special Meeting, 13 – 14 January, Dar es Salaam
6. TANESCO – Tanzania Electric Supply Company Limited, (2002), “Power
System Master Plan (2001) updated draft report”
7. Ministry of Natural Resources and Tourism (1998), “National Forest Policy”
8. Ngeleja, J. L. (2003), “Potential Role of Forest/Wood Based Cogeneration in
Tanzania‟s Power Sector Reform”, The Cooperative Technology
Implementation Plan for Southern Africa Workshop, Dar es Salaam,
Tanzania
9. Kamwenda, G. J. and Mkeya, F. M. (2000), “Status Report on Forest Based
Industry and Products in Tanzania and Vision for the Future”, Status of
Forest Based Industry and Products in Tanzania and Vision for the Future
Conference, Dar es Salaam, Tanzania
10. Wilson, L., Yang, W., Blasiak, W., John, G.R. and Mhilu, C. F. (2007),
“Opportunities and Challenges of Biomass Energy for Heat and Power
Production in Tanzania”, Proceedings of the 3rd International Green Energy
Conference, Västerås, Sweden
56
11. Kaseva, M. E. and Mbuligwe, S. E. (2005), “Appraisal of Solid Waste
Collection Following Private Sector Involvement in Dar es Salaam City,
Tanzania”, Habitat International, Vol., 29, pp. 353 – 366
12. CEEST – The Centre for Energy, Environment, Science and Technology,
(2008), “Greenhouse Gases Inventory (Tanzania)”, Unpublished Report,
Dar es Salaam
13. Semkiwa, P., Kalkreuth, W., Utting, J., Mpanju, F., and Hagemann, H.
(2003), “The Geology, Petrology, Palynology and Geochemistry of Permian
Coal Basins iIn Tanzania: 2. Songwe-Kiwira Coalfield”, International Journal
of Coal Geology, Vol. 55, pp. 157 – 186
14. Mkilaha, I. S. N. and John, G. R. (2001), “Prospects of Coal Utilization in
Tanzania”, In IET Seminar proceedings, Arusha, Tanzania
15. Thomas, M. G. (1996), “Water Pumping – the Solar Alternative”,
Photovoltaic Systems Design Assistance Center, Sandia National
Laboratories, Albuquerque, NM 87185-0753
16. Riso National Laboratory, (2003), “Wind Measurements and Wind Power
Feasibility at Selected Sites in Tanzania”, Report no. 104.Tanz.1.mfs.13,
prepared for the Ministry of Foreign Affairs and Danida
17. Nzali, A. H. and Mushi, S. J. (2004), “A study on the State of Wind Energy
Technology in Tanzania”, a report prepared for the Tanzania Commission
for Science and Technology (COSTECH), Dar es Salaam
18. Marobhe, I. M. (2006), “Geothermal Energy as Alternative Energy Source in
Tanzania”, Seminar on Alternative Energy Sources, Dar es Salaam,
Tanzania
19. Mantra Resources Limited (2010), “Financial Report and MD&A for the Third
Quarter and Nine Months Ended 31 March 2010, report no. ABN 26 116 478
703, available online at http://mantraresources.com.au/upload/documents/
releases/reports/20100517_100514-ThirdQuarterFinancialReport_Final.pdf
20. TPDC (2010), “Oil and Gas Exploration Companies Operating in Tanzania”,
available online at <http://www.tpdc-tz.com/>
21. Mtolera, J. B. C. (2007), “Environmental Management for Sustainable
Hydro Power Generation: Experience of Mtera and Kidatu Hydro Power
Stations in Tanzania”, 19th African Hydro Symposium, Aswan

57
22. Mwihava, N. C. X. and Wilson, L. (2007), “Cogen for Africa (Tanzania
Country Report)”, a report prepared for African Energy Policy Research
Network (AFREPREN)
23. Ellegard, A., Gustavsson, M. and Nordstrom, M., (2003), “Solar Service is
Rural Infrastructure, Renewable Energy for Development”, SEI vol. 16, no 1
24. Mwihava, N. C. X. and Mbise, H. (2005), “Energy and Economic
Development, Infrastructure and Utilities as Stimulants of Economic
Development”, in Proceedings of the 3rd Annual Engineers Day, Dar es
Salaam, Tanzania
25. Mrindoko, B. J. (2009), “Available Business Opportunities in the Energy
Sector”, EABC/EAC Energy Conference, Dar es Salaam, Tanzania
26. Hall, D. O. and Moss, P. A. (1983), “Biomass for Energy in Developing
Countries”, GeoJournal, Vol. 7, Issue 1, pp. 5 – 14
27. Strehler, A. (2000), “Technologies of Wood Combustion”, Ecological
Engineering, Vol. 16, pp. 25 – 40
28. IEA, (2009 ), “Renewables Information 2002” Paris, Energy Statistics
Division, International Energy Agency, available online at
<http://gasunie.eldoc.ub.rug.nl/FILES/root/2003/2564862/2564862.pdf>
29. Kaltschmitt, M., Reinhardt, G. A and Stelzer, T. (1997), “Life Cycle Analysis
of Biofuels Under Different Environmental Aspects”, Biomass and
Bioenergy, Vol. 12, Issue 2, pp. 121 – 134
30. Demirbas, A. (2008), “Biofuels Sources, Biofuel Policy, Biofuel Economy
and Global Biofuel Projections”, Energy Conversion and Management, Vol.
49, Issue 8, pp. 2106 – 2116
31. Bridgwater, A. V. (1995), “The Technical and Economic Feasibility of
Biomass Gasification for Power Generation”, Fuel, Vol. 74, pp 631 – 653
32. Quadrelli, R. and Peterson, S. (2007), “The energy–climate Challenge:
Recent Trends in CO2 Emissions from fuel Combustion”, Energy Policy, Vol.
35, pp (5938 – 5952)
33. El-Fadel, M. and Bou-Zeid, E. (1999), “Transportation GHG Emissions in
Developing Countries: The Case of Lebanon”, Research Part D: Transport
and Environment, Vol. 4, Issue 4, pp. 251 – 264
34. Hekkert, M. P., Hendriks, F. H. J. F., Faaij, A. P. C. and Neelis, M. L. (2005),
“Natural Gas as an Alternative to Crude Oil in Automotive Fuel Chains Well-

58
To-Wheel Analysis and Transition Strategy Development”, Energy Policy,
Vol. 33, pp. 579 – 594
35. Hulteberg, P. C. and Karlsson, H. T. (2009), “A study of combined biomass
gasification and electrolysis for hydrogen production”, Int. J. Hydrogen
Energy, Vol. 34, pp. 772 – 782
36. Koroneos, C., Dompros, A. and Roumbas, G. (2008), “Hydrogen production
via biomass gasification – A life cycle assessment approach”, Chem. Eng.
Process., Vol. 47, pp. 1261 – 1268
37. Zhang, W. (2009), “Automotive fuels from biomass via gasification”, Fuel
Process. Technol., doi:10.1016/j.fuproc.2009.07.010
38. Tsuji, H., Gupta, A.K., Hasegawa, T., Katsuki, M., Kishimoto, K. and Morita,
M. (2002), “High Temperature Air Combustion - From Energy Conservation
to Pollution Prevention”, ISBN: 0 8493 1036 9, CRC Press, Florida
39. Rafidi, N. and Blasiak, W. (2006), “Heat Transfer Characteristics of HiTAC
Heating Furnace Using Regenerative Burners”, Applied Thermal
Engineering, Vol. 26, PP. 2027 – 2034
40. Tiwari, M. K., Mukhopadhyay, A. and Sanyal, D., (2005) “Parameter
Optimization Through Performance Analysis of Model Based Control of a
Batch Heat Treatment Furnace With Low NOx Radiant Tube Burner”, Energy
Conversion and Management, Vol. 46, pp. 2114 – 2133
41. Lucas, C. (2005), “High temperature air/steam gasification of biomass in an
updraft fixed bed batch type gasifier”, Doctoral thesis in energy and furnace
technology, Royal Institute of Technology (KTH), Stockholm, Sweden, ISBN:
91-7178-067-X
42. Demirbas, A. (2001), “Biomass Resource Facilities and Biomass Conversion
Processing for Fuel and Chemical”, Energy Conversion and Management,
Vol. 42, pp. 1357 – 1378
43. Okumura, Y., Hanaoka, T. and Sakanishi, K. (2009), “Effect of Pyrolysis
Conditions on Gasification Reactivity of Woody Biomass-Derived Char”,
Proceedings of the Combustion Institute, Vol. 32, pp. 2013 – 2020
44. Becidan, M., Skreiberg, Ø. and Hustad, J. E. (2007), “Products Distribution
and Gas Release in Pyrolysis of Thermally Thick Biomass Residues
Samples”, Journal of Analytical and Applied Pyrolysis, Vol. 78, Issue 1, pp.
207 – 213
59
45. Jeguirim, M. and Trouvé, G. (2009), “Pyrolysis Characteristics and Kinetics
of Arundo Donax Using Thermogravimetric Analysis”, Bioresource
Technology, Vol. 100, Issue 17, pp. 4026 – 4031
46. Zabaniotou, A. A., Roussos, A.I. and Koroneos, C. J. (2000), “A Laboratory
Study of Cotton Gin Waste Pyrolysis”, Journal of Analytical and Applied
Pyrolysis, Vol. 56, Issue 1, pp. 47 – 59
47. Banerjee, S. C., Nandy, D. K., Ghosh, S. K., Banerjee, D. D., Sen, S. K. and
Singh, B. (1990), “An approach to Assessing the Status of Sealed-off Fires
by Examination of Fire Indices”, Mining Science and Technology, Vol. 10,
Issue 1, pp. 37 – 51
48. Sun, S., Zhao, Y., Ling, F. and Su, F. (2009), “Experimental Research on Air
Staged Cyclone Gasification of Rice Husk”, Fuel Processing Technology,
Vol. 90, pp. 465 – 471
49. Wang, F. Y and Bhatia, S. K. (2001), “A Generalised Dynamic Model for
Char Particle Gasification With Structure Evolution and Peripheral
Fragmentation, Chemical Engineering Science, Vol. 56, pp. 3683 – 3697
50. Jenkins B. M., Baxter L. L., Miles Jr. T. R., and Miles T. R. (1998),
“Combustion Properties of Biomass”, Fuel Processing Technology, Vol. 54,
pp. 17 – 46
51. Obernberger, I., Biedermann F., Widmann, W., and Riedl, R. (1997),
“Concentrations of Inorganic Elements in Biomass Fuels and Recovery in
the Different Ash Fractions”, Biomass and Bioenergy, Vol. 12, pp. 211 – 214
52. Vamvuka, D. and Zografos, D. (2004), “Predicting the Behaviour of Ash from
Agricultural Wastes During Combustion”, Fuel, Vol. 83, pp. 2051 – 2057
53. Jenkins B. M. and Ebeling J. M. (1985), “Correlation of Physical Properties
of Terrestrial Biomass with Conversion”, Proceedings of energy from
biomass and wastes IX, Institute of Gas Technology, Chicago, IL.
54. Tsamba, A. J., Yang, W., and Blasiak, W. (2006), “Pyrolysis Characteristics
and Global Kinetics of Coconut and Cashew Nut Shells”, Fuel Processing
Technology, Vol. 87, pp. 523 – 30
55. Kasembe, E. D., Mhilu, C. F. and John, G. R. (2008), “Limitation in Mass
and Energy Balances in High Temperature Agent Gasification of Biomass”,
9th Asia-Pacific International Symposium on Combustion and Energy
Utilization Conference, Beijing, China
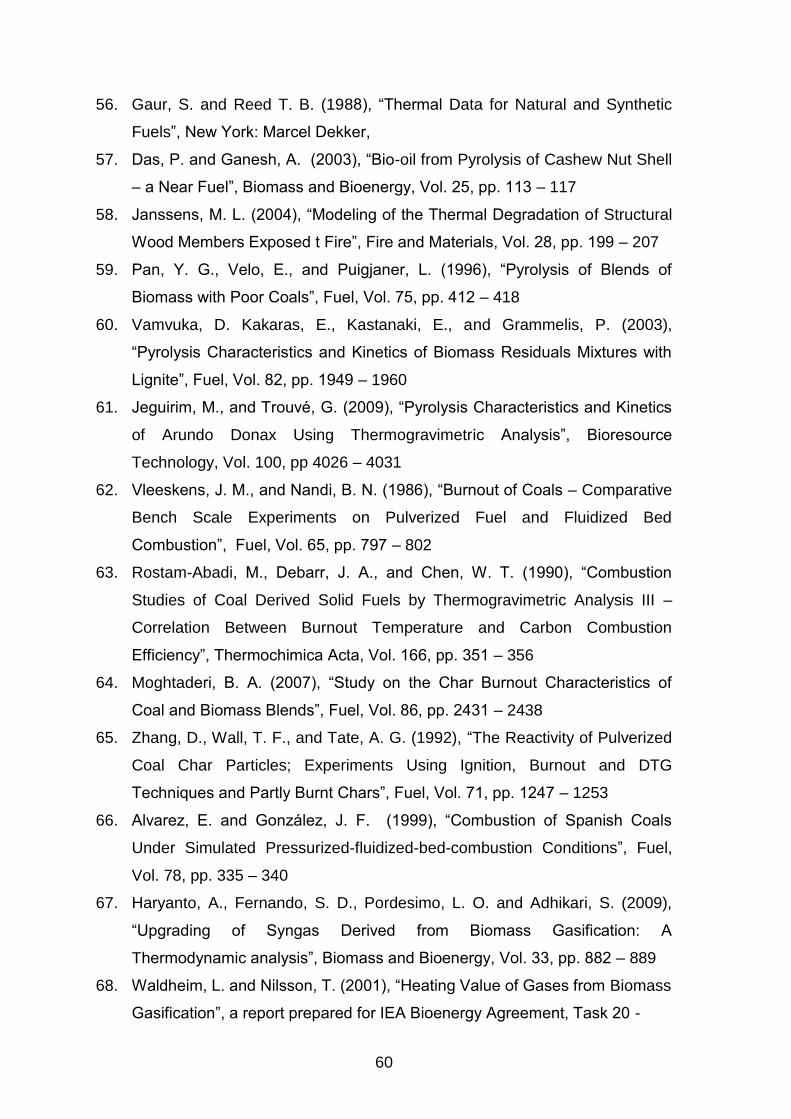
60
56. Gaur, S. and Reed T. B. (1988), “Thermal Data for Natural and Synthetic
Fuels”, New York: Marcel Dekker,
57. Das, P. and Ganesh, A. (2003), “Bio-oil from Pyrolysis of Cashew Nut Shell
– a Near Fuel”, Biomass and Bioenergy, Vol. 25, pp. 113 – 117
58. Janssens, M. L. (2004), “Modeling of the Thermal Degradation of Structural
Wood Members Exposed t Fire”, Fire and Materials, Vol. 28, pp. 199 – 207
59. Pan, Y. G., Velo, E., and Puigjaner, L. (1996), “Pyrolysis of Blends of
Biomass with Poor Coals”, Fuel, Vol. 75, pp. 412 – 418
60. Vamvuka, D. Kakaras, E., Kastanaki, E., and Grammelis, P. (2003),
“Pyrolysis Characteristics and Kinetics of Biomass Residuals Mixtures with
Lignite”, Fuel, Vol. 82, pp. 1949 – 1960
61. Jeguirim, M., and Trouvé, G. (2009), “Pyrolysis Characteristics and Kinetics
of Arundo Donax Using Thermogravimetric Analysis”, Bioresource
Technology, Vol. 100, pp 4026 – 4031
62. Vleeskens, J. M., and Nandi, B. N. (1986), “Burnout of Coals – Comparative
Bench Scale Experiments on Pulverized Fuel and Fluidized Bed
Combustion”, Fuel, Vol. 65, pp. 797 – 802
63. Rostam-Abadi, M., Debarr, J. A., and Chen, W. T. (1990), “Combustion
Studies of Coal Derived Solid Fuels by Thermogravimetric Analysis III –
Correlation Between Burnout Temperature and Carbon Combustion
Efficiency”, Thermochimica Acta, Vol. 166, pp. 351 – 356
64. Moghtaderi, B. A. (2007), “Study on the Char Burnout Characteristics of
Coal and Biomass Blends”, Fuel, Vol. 86, pp. 2431 – 2438
65. Zhang, D., Wall, T. F., and Tate, A. G. (1992), “The Reactivity of Pulverized
Coal Char Particles; Experiments Using Ignition, Burnout and DTG
Techniques and Partly Burnt Chars”, Fuel, Vol. 71, pp. 1247 – 1253
66. Alvarez, E. and González, J. F. (1999), “Combustion of Spanish Coals
Under Simulated Pressurized-fluidized-bed-combustion Conditions”, Fuel,
Vol. 78, pp. 335 – 340
67. Haryanto, A., Fernando, S. D., Pordesimo, L. O. and Adhikari, S. (2009),
“Upgrading of Syngas Derived from Biomass Gasification: A
Thermodynamic analysis”, Biomass and Bioenergy, Vol. 33, pp. 882 – 889
68. Waldheim, L. and Nilsson, T. (2001), “Heating Value of Gases from Biomass
Gasification”, a report prepared for IEA Bioenergy Agreement, Task 20 -

61
Thermal Gasification of Biomass, available online at
<http://media.godashboard.com/gti/IEA/HeatingValue.pdf>
69. Reed, T. B. and Das, (1988), “A. Handbook of Biomass Downdraft Gasifier
Engine Systems”, The Biomass Energy Foundation Press, Colorado
70. Coats, A. W. and Redfern, J. P. (1964), “Kinetic Parameters from
Thermogravimetric Data”, Nature, Vol. 201, pp. 68 – 69
71. Chan, J. H. and Balke, S. T. (1997), “The Thermal Degradation Kinetics of
Polypropylene: Part III – Thermogravimetric Analyses”, Polymer
Degradation and Stability, Vol. 57, pp. 135 – 149
72. Keuleers, R. R., Janssens, J. F. and Desseyn, H. O. (2002), “Comparison of
Some Methods for Activation Energy Determination of Thermal
Decomposition Reactions by Thermogravimetry”, Thermochimica Acta, Vol.
385, pp. 127 – 142
73. Capart, R., Khezami, L. and Burnham, A. K. (2004), “Assessment of Various
Kinetic Models for the Pyrolysis of a Microgranular Cellulose”,
Thermochimica Acta, Vol. 417, pp. 79 – 89
74. Thipkhunthod, P., Meeyoo, V., Rangsunvigit, P., Kitiyanan, B., Siemanond,
K. and Rirksomboon, T. (2006), “Pyrolytic Characteristics of Sewage
Sludge”, Chemosphere, 64, 955 – 962
75. Kantarelis, E. (2009 ), “Thermochemical Treatment of Electric and Electronic
Waste for Energy Recovery”, a Licentiate Thesis in Furnace and
Technology, Stockholm, Royal Institute of Technology

Supplement I
Supplement I
Coffee Husks Gasification Using High Temperature Air/Steam Agent
Lugano Wilson, Geoffrey R. John, Cuthbert F. Mhilu, Weihong Yang, and
Wlodzimierz Blasiak
Published in the Fuel Processing Technology Journal, Volume 91, Issue 10,
(2010), pp. 1330 – 1337
Royal Institute of Technology
School of Industrial Engineering and Management
Department of Material Science and Engineering
Division of Energy and Furnace Technology
SE-100 44 Stockholm
Sweden

Supplement II

Supplement II
Thermal Characterization of Tropical Biomass Feedstocks,
Lugano Wilson, Weihong Yang, Wlodzimierz Blasiak, Geoffrey R. John,
Cuthbert F. Mhilu,
Article in press with the Energy Conversion and Management Journal, (2010),
doi:10.1016/j.enconman.2010.06.058
Royal Institute of Technology
School of Industrial Engineering and Management
Department of Material Science and Engineering
Division of Energy and Furnace Technology
SE-100 44 Stockholm
Sweden