to - dtic.mil · mc61a-near field inf e background noise, oiallation '~z ~r~jrich~ard) h....
TRANSCRIPT

UNCLASSIFIED
AD NUMBER
AD462729
NEW LIMITATION CHANGE
TOApproved for public release, distributionunlimited
FROMDistribution authorized to U.S. Gov't.agencies and their contractors;Administrative/Operational Use; JAN 1965.Other requests shall be referred to Officeof Naval Research, 875 North RandolphStreet, Arlington, VA 22203.
AUTHORITY
ONR ltr dtd 4 May 1977
THIS PAGE IS UNCLASSIFIED

U NCLASSIFIED
AD -. JZJ 29
DEFENSE DOCUMENTATION CENTERFOR
SCIENTIFIC AND TECHNICAL INFORMATION
CAMERON STATION ALEXANDRIA. VfIRGINIA
UNCLASSI FIED

NMTICE: Tlien government or other drawings, speci-fications or other data are used for any purposeother than in connection with a definitely relatedgovernment procurement operation, the U. S.Government thereby incurs no responsibility, nor anyobligation whatsoever; and the fact that the Govern-ment may have foimilated, furnished, or in any wsysupplied the said drawings, specifications, or otherdata is not to be regarded by implication or other-wise as in any manner licensing the holder or anyother person or corporation, or conveying any rightsor permission to manufacture, use or sell anypatented invention that may in any way be relatedthereto.
MC61A-
NEAR FIELD INF EBACKGROUND NOISE, oIALLATION
'~Z ~r~jRICH~ARD) H. AD~AMS
INTERIM EfNI$INEERING3 REPORT
JANUARY 19635
D DC
w-ATFHRAS, ILNC.AE7"L~tH~MODt4AM~1, j

-S.
MITHRAS, IIC.701 Concord Avenue
Cambridge, Massachusetts02138
MC 61-5-R5
NEAR FIELD INFRARED
BACKGROUND NOISE SIMULATION
by
Richard H. Adams
Interim Engineering Report
Nonr Contract 3489(00)
January 1965

U
FOREWORD
This report was prepared by MITHRAS, Inc.,
for the Department of the Navy's Office of Naval Re-
search and Bureau of Naval Weapons under Contract
Nonr 3489(00). Scientific officers for ONR Air Pro-
grams have been Lt. Cmdr. S. D. Kearney and
Cmdr. M. Gussow, and for BuWeps Missile Division,
J. M. Lee.
The research reported here was begun in
February 1964 and completed in October 1964. It
was essentially a continuation of research performed
under Contract Nonr 3733(00).
ii MC 61-5-R5

ABSTRACT
Studies on the near field infrared background
noise problem have been directed towards the simula-
tion of the infrared noise emanating from a known
turbulent zone. A laboratory tool for simulating the
near field noise has been designed, utilizing a simple
heated round free subsonic jet as the infrared noise
generator. A review of the characteristics of the hot
free subsonic jet is presented and the design of the
near field infraredbackground simulator is described.
Preliminary measurements of the fluctuations in
radiant emittance from the jet have been made with
an AC radiometer. The data have been reduced to
normalized spectral density curves. The spectral
density curves exhibit a more rapid decrease in energy
level with increasing frequencythan do spectral density
curves obtained from hot wire measurements. Finally,
a brief literature survey has beenmade of the infrared
properties of CO 2 and H 0 in the 2. 7 [. region for
small optical path lengths and elevated temperatures.
The absorption data presented are especially applicable
to laboratory experiments.
iii MG 61-5-5 -

TABLE OF CONTCENTS
S ection Page
FOREWORD..................... . . .. . ....
ABSTRACT................. . . .. . ....
NOMENCLATURE ............ v
LIST OF FIGURES..............ix
1.0 INTRODUCTION AND BACKGROUND............
2.0 THE NEAR FIELD INFRARED BACKGROUND
SIMULATOR................2
2. 1 Diffusion and Spectra in the Hot Free SubsonicJet..................2
2. 2 The Free Jet Noise Experiment.........7
2. 3 Initial Calibration of the Near Field InfraredBackground Simulator............13
3.0 INFRARED PROPERTIES OF C02 AND H20 IN THE2. 7 REGION FOR SMALL OPTICAL PATH LENGTHSAND ELEVATED TEMPERATURES............17
4.0 CONCLUSIONS................21-
REFERENCES................23
FIGURES.......................5
DISTRIBUTION LIST..............48
v MC 61-5-R5
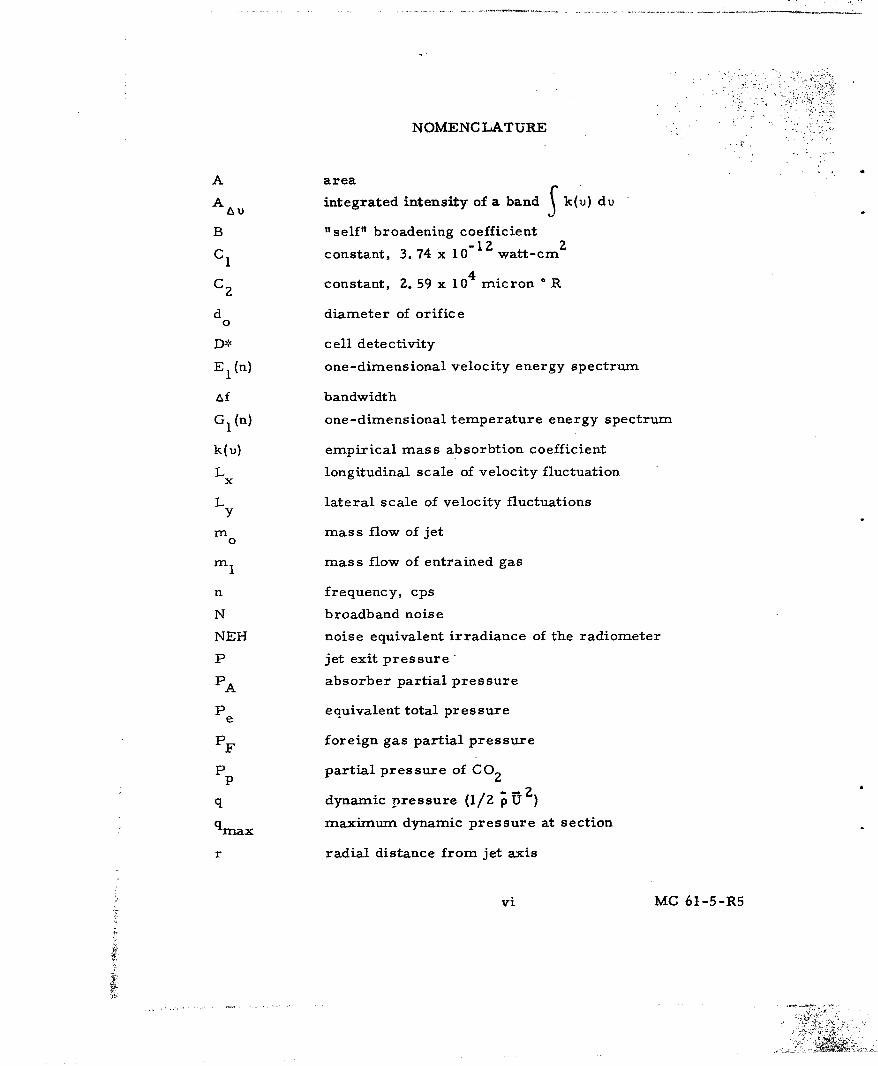
NOMENCIATURE
A area
A Au X)integrated intensity of a band k(u) du
B "self" broadening coefficient
C 1 constant, 3. 74 x 10 watt-cm
C 2 constant, 2. 59 x 104 micron R
d diameter of orifice
0
D* cell detectivity
E 1 (n) one-dimensional velocity energy spectrum
Af bandwidth
G1 (n) one-dimensional temperature energy spectrum
k(u) empirical mass absorbtion coefficient
L longitudinal scale of velocity fluctuationx
L lateral scale of velocity fluctuationsy
m mass flow of jet0
m I mass flow of entrained gas
n frequency, cps
N broadband noise
NEH noise equivalent irradiance of the radiometer
P jet exit pressure
PA absorber partial pressure
P equivalent total pressuree
PF foreign gas partial pressure
P partial pressure of CO 2
q dynamic pressure (1/ 2 P U)
qrmax maximum dynamic pressure at section
r -radial distance from jet axis
vi MC 61-5-R5
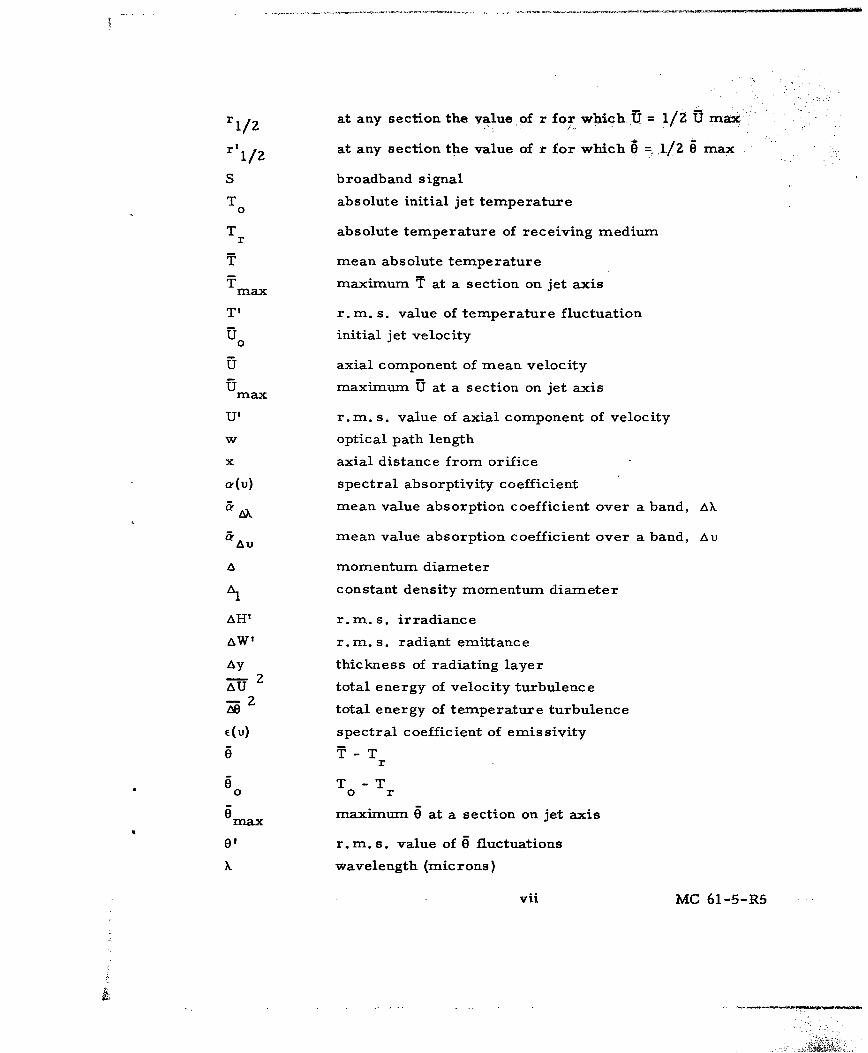
rl/ 2 at any section the value of r for which U = 1/2 U max-
r at any section the value of r for which 0 = -/0 max
S broadband signal
T absolute initial jet temperature0
T r absolute temperature of receiving medium
T mean absolute temperature
mmaximum T at a section on jet axismax
T' r. m. s. value of temperature fluctuation
U° 0initial jet velocity
U axial component of mean velocity
Umax maximum U at a section on jet axis
U' r. m. s. value of axial component of velocity
w optical path length
x axial distance from orifice
a0(u) spectral absorptivity coefficient
a AXk mean value absorption coefficient over a band, AX
a AU mean value absorption coefficient over a band, Au
A momentum diameter
A, constant density momentum diameter
AH' r.m. s. irradiance
AW' r.m. s. radiant emittance
Ay thickness of radiating layerX Ztotal energy of velocity turbulence
;2 total energy of temperature turbulence
E(u) spectral coefficient of emissivity
ST-Tr
9T -T0 0 r
9ax maximum 6 at a section on jet axis
) Ir. m. s. value of 6 fluctuations
X wavelength (microns)
vii MG 61-5-R5
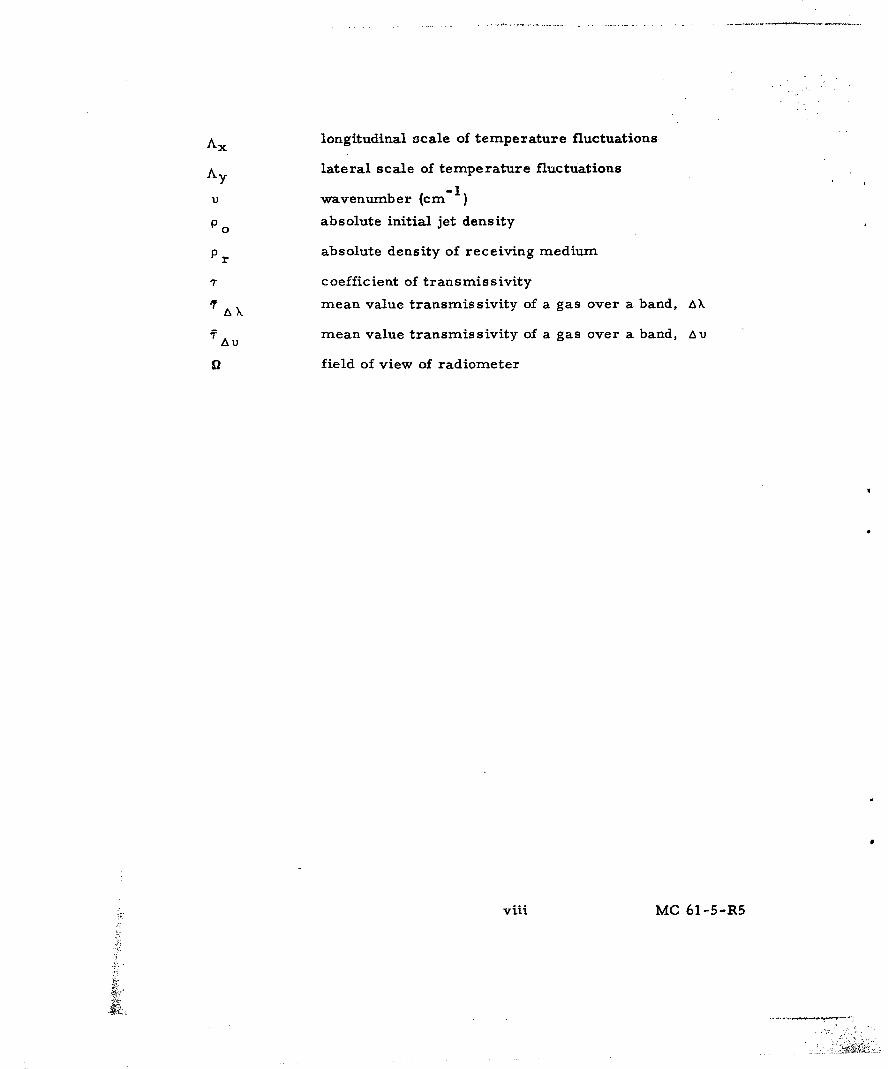
A x longitudinal scale of temperature fluctuations
Ay lateral scale of temperature fluctuations
u wavenumber (cm "1 )
PO absolute initial jet density
Pr absolute density of receiving medium
T coefficient of transmissivity
1 k mean value transmissivity of a gas over a band, AX
TA mean value transmissivity of a gas over a band, Au
0field of view of radiometer
viii MC 61-5-R5

LIST OF FIGURnES
Figure ...e
1 Schematic of the free subsonic jet ... .. ..... 25
2 Variation of momentum diameter ..... ..... 26
3 Axial velocity distributions ......... 27
4 Axial temperature distributions ....... 28
5 Axial spread of velocity .......... 29
6 Axial spread of temperature ........ 30
7 Velocity distribution and fluctuation levels in the jetcross section ............. 31
8 Temperature distribution and fluctuation levels in thejet cross section........... . 32
9 Longitudinal velocity scale of turbulence . . 33
10 Longitudinal temperature scale of turbulence 34
11 Power spectra of velocity fluctuations 35
12 Power spectra of temperature fluctuations . 36
13 Schematic of subsonic jet setup ....... 37
14 Schematic of hot jet calibration ....... 38
15 Axial velocity distributions.. ....... 39
16 Correlated axial velocity distribution 40
17 Axial temperature distributions ....... 41
18 Radiation spectra measured in hot jet. ..... 42
19 Total rms voltage.. ....... . ... 43
20 Normalized radiation spectra measured in hot jet 44
21 Total absorption vs optical path length for 2. 7 ±
region of CO 2 . . . . . . . . . . . . . 4522 Total absorption vs optical path length for 2. 7 p.
region of Hz0.. ...... ..... 46
23 Summary of integrated intensity of 2. 7 region ofCO 2 and H2 0 vs temperature ........ 47
ix MC 6r-s"-R5

1. 0 INTRODUCTION AND BACKGROUND
MITHRAS, Inc. has been actively engaged in a program directed
toward determining the infrared noise emanating from a hot turbulent
boundary layer. This noise resulting from small, random fluctuations
in temperature and density has been termed "near field" noise and can
severely limit the use of infrared sensors on board a missile or re-
entry vehicle.
Theory alone, or even theory coupled with currently available
experimental data, is not expected to yield near field noise predictions
of high accuracy. The limiting factor is the current mathematical de-
scription of the fluctuating quantities in a turbulent boundary layer. For
this reason experimental programs have been undertaken to obtain the
level and nature of this noise in known turbulent environments.
In the Fall of 1963 an experiment was conducted in the hypersonic
wind tunnel at the David Taylor Model Basin to measure the infrared noise
generated from the hypersonic turbulent boundary layer of the wind tunnel
nozzle, (Reference 1). This experiment was successful in that the RIIS
level of fluctuations measured were generally as predicted, but due todis-
crete spikes in the power spectra, questionable properties of the boundary
layer and of the free shear layer observed only partial success was achieved
in predicting the spectrum of the fluctuating radiation. This valuable infor-
mation obtained from the DTMB experiment pointed out the desirability of a
well controlled experiment for measuring the infrared noise in a well known
turbulent zone. It was felt that the hot free subsonic jet would lend itself to
such an experiment. Furthermore, the possibility of developing such an
experiment into a laboratory tool for testing infrared sensor systems in the
presence of the simulated near field background was foreseen.
Thus, efforts were directed towards developing a near field back-
ground simulator which could be employed in the MITHRAS laboratory
and towards determining the infrared properties of the emitting gases to
be used in the simulator over very small optical path lengths. A
summary of the ensuing studies, equipment design and initial calibra-
tion follow.1 MC 61-5-R5

2. 0 'THE NEAR FIELD INFRARED BACKGROUND SIMULATOR
The development of a near field infrared background simulator
has been undertaken, utilizing a simple heated round free subsonic jet
as the infrared noise generator. The free jet has been the subject of
many investigations. Some of these investigations are presented in
References 2 through 6, and Hinze (Reference. 7) presents a summary
of free jet theory and experiments.
The above investigations have yielded power spectra of velocity
and temperature fluctuation in heated and unheated jets. However, no
direct measurements of the fluctuating component of the infrared signal
has been measured heretofore. The development of a near field infrared
background simulator therefore requires an understanding of the velocity
and temperature turbulence of the hot free jet as well as direct measure-
ments of the infrared "turbulence".
2. 1 Diffusion and Spectra in the Hot Free Subsonic Jet
2. 1. 1 Basic Zones of the Free Jet
Figure 1 presents a schematic of the free subsonic jet.
The jet immediately downstream of the exit plane contains a uniform
velocity core surrounded by a turbulent mixing zone. This turbulent
mixing zone grows until it covers the entire jet. At some distance
further downstream the turbulent jet flow becomes fully developed and
the flow patterns remain similar in consecutive sections. The location
of the fully developed turbulent zone in which we are interested in
making observations is not too well defined. Hinze (Reference 7) infers
that although radial distributions of mean velocity and mean temperature
are similar beyond x/d ° = 10, self preservation of the distributions of
turbulent intensities is not quite fully attained at x/d ° = 20.
2 MC 61-5-R5
'4

2.1.2 Axial Distributions of Jet Properties
The mean velocity and temperature distributions along
the axis of the jet are important parameters in defining the jet. Accord-
ing to Hinze (Reference 5) the mean velocity distribution is given byd
6.4 0] x + .6d o
max
However Corrsin and Uberoi present data in Reference 2 which shows
that the hotter the jet, relative to its surroundings, the greater the jet
spreading and thus the more rapid the mean velocity decay. They pre-
sent evidence that the proper diameter to be used in hot jet calculations
is the momentum diameter defined as
T= Z q/q r dr
The ratio of the hot jet momentum diameter to the cold jet (constant
density) momentum diameter, 4/A1, is presented in Figure 2. Ricou
and Spalding, however present evidence that the ratio NFpr7 o or
NTo7T r may be used to make temperature corrections to the data
(Reference 6). This question of a scaling parameter will be further
resolved with the experimental results obtained from the current experi-
ment.
Figure 3 presents the mean velocity distribution along the axis
from the experiments of Corrsin and Uberoi (Reference 3) at 00= 270 F
and 0 = 54 0 ° F. The distribution as defined by Hinze is also included
for comparison.
Similar data for the mean temperature distribution along the jet
axis is shown in Figure 4.
3 MC 61-5-R5

2. 1. 3 Jet Cross Sections
The common way of defining the cross section of the
velocity and temperature profiles are in terms of their half-value radii.
Hinze defines the half velocity radius as
rl/2 = 0.08 (x.+ .6 do)
This curve has been plotted in Figure 5. Two points obtained from the
Corrsin and Uberoi data at an x/d = 15 and n= 27*F and 6.= 540-F
are also shown.
Corrsin and Uberoi presented the variation of the half-temperature
radius rl1/2' with x/d for 0= 27°F and 0 = 540'F. These data areshown in Figure 6.
The actual cross section distributions of the mean velocity ratio,
/-U max' and the R. M. S. velocity ratio of the fluctuating component,
U'/Umax , are presented in Figure 7 as obtained by Corrsin and Uberoi
at x/d ° = 15 and x/d ° = 20. Also shown is the unsteady component at two
radial stations and x/d ° = 20 for a later test by Corrsin and Uberoi. No
explanation was offered for the difference in the data, but considering the
nature of these measurements the agreement is considered fair.
Similar data has been plotted in Figure 8 for the mean temperature
ratio 0/0max and the R. M.S. temperature fluctuations 8'/0max .
2. 1. 4 Scales of Turbulence
In order to define the physical eddy size of turbulent struc-
ture a correlation length or integral scale of turbulence is used. The
interpretation of this scale as the mean eddy size is somewhat crude, how-
ever, it is a useful parameter for comparative purposes.
4 MC 61-5-R5
I

In terms of the normalized power spectrum of longitudinal-
velocity fluctuations the longitudinal velocity scale of turbulence is
defined as
L = -- E(0)x 4_U_
Similarly the longitudinal temperature scale of turbulence may be
defined as
Ax U 2G(0)
The longitudinal velocity scale of turbulence, Lx, was deter-
mined experimentally by Laurence (Reference 4) for the cold jet,
To/T r = 1.0, up to an x/d ° = 8. Since this is in the mixing zone, L x
is dependent upon the radial location in the jet. and thus was deter-
mined as a function of radial position as well as axial position. Corrsin
and Uberoi (Reference 3) found Lx for a cold jet at x/d ° = 20 to be
approximately constant at least up to a radial distance of 1. 6 nozzle
exit diameters. The above data have been normalized with respect
to the nozzle exit diameter, do , and are plotted in Figure 9. A straight
line has been drawn through the data and extrapolated by the writer to
x/d 0 30 for the cold jet case, To/T r = 1.0.
The experimental data for the longitudinal temperature scale of
turbulence is apparently limited to the data of Corrsin and Uberoi in
Reference 3, and this data was limited to one station at x/d ° = 20 and
To/Tr = 1. 6. It was determined that for this point thatA= 0. 58Lx
and was assumed that this relation would hold for the regions of our
interest. The results of these assumptions are presented in Figure 10.
The lateral scales of turbulence are also based upon the same
set of Corrsin and Uberoi data. Based upon these data it is found that
Ly 1/5Lx and ly 1/3Ax.
5 MC 61-5-R5

2.1. 5 Velocity and Temperature Spectra
The distribution of energy as a function of frequency in
turbi.ilent structure is termed a power spectrum. A mathematical
description of turbulence and the power spectrum is given in Reference
8 and thus will not be repeated here. It is pointed out however, that
the non-dimensional energy parameter is generally written as
U E 1 (n)
AU 2 L x
and the non-dimensional frequency parameter is
nLx
for the case of the one dimensional power spectrum of the x-velocity
fluctuations. Similar parameters are used for temperature spectra.
In Reference 3. Corrsin and Uberoi measured the longitudinal
velocity and temperature fluctuation in a free subsonic jet with a hot
wire anemometer and derived the corresponding power spectra. The
velocity spectra are presented in Figure 11 and the temperature spectra
in Figure 12 for the axial station of x/d 0 = 20. Also on these figures is
plotted the curve described by
U E 1 (n) 4
T T Z L n 2 (uL x 2x 1 + 4 -r -
This semi-empirical equation fits both the velocity and the temperature
spectra well.
6 MC 61-5-R5
&A
P
2. Z The Free Jet Noise Experiment
2. 2.1 Objectives
The objective of the free jet experiment is to measure the
infrared noise generated by the turbulent jet and to correlate these data
with theory based upon the existing data presented in section 2. 1. The
experimental setup may then be used as a near field infrared background
simulator to test infrared sensor systems, after slight modifications are
made based upon the experimental results.
2. 2. 2 Apparatus
2. 2. 2. 1 Jet and Supply
The jet is designed so as to provide a well control-
led turbulent zone which may be observed with a simple AC radiometer
system. A controlled amount of CO 2 may be mixed with the flow such
that a sufficient signal to noise ratio may be obtained by observing the
2. 7j± CO 2 and H 2 0 bands.
The following jet properties have been established as fulfilling
the above requirements:
d 1 inch0
.2A = 0. 785 in
0
P 14.7 lbs/in
T = 540 o Rr
T = 1460 0R0
Pp/P = 0.05
U = 125 ft/sec
m = 0. 019 #/sec
7 MG 61-5-R5
a hi

6 = T -T =920°FO 0 r
To/Tr l/po/p r - 2.7
In order that the jet characteristics of section 2. 1 may be valid, it is
necessary that the jet issue into an environment of the same gas com-
position as the jet itself, i. e. P p/P = 0. 05. The environment is con-
trolled by letting the jet issue into a chamber in which the mass flow
entrained by the jet will be replaced. Ricou and Spaulding (Reference
6) have empirically shown that the mass flow entrained by a jet issuing
into an environment of different density is given by the relation
m i= m ° [ 0.32x/d ° (pr/po)l/Z- 1]
Assuming that the total length of the jet we are interested in is 30
inches, then x/d0 = 30 and m 1 = 0.28 #/sec. If the jet is issued in
an upward direction the data of Ricou and Spaulding show that the effects
of buoyancy on the proposed jet experiment will introduce negligible flow
entrainment.
A schematic diagram of the test set-up is presented in Figure
13. Ricou and Spaulding have shown that the aperture angle subtended
by the diameter of the chamber outlet aperture, should be about 30° in
order to assure minimum interference with the jet and zero pressure
gradient between the chamber and the atmosphere. The pressure ratio
across the aperture, Pl/P 2, will be measured and balanced with valves
V1 and V Z '
Valves V 3 and V4 control the air - CO 2 mixture, part of which
is heated with a 7 kw heater.
The air supply is drawn from room air by a centrifugal blower
which has a one horse-power motor and provides a pressure rise of 6"
of water. The heater is a 7 kw. three stage unit utilizing GE calrods
as the heating elements.
8 MC 61-5-R5

2.2.2.2 Radiometer
For simplicity in estimating the irradiance of te.
jet, it will be assumed that the jet cross section being observed is of
constant mean temperature and may be treated as a body of gas of thick-
ness Ay and of uniformly fluctuating temperature. The absorptivity,
a(u), of this gas may be controlled by the CO? partial pressure and will
be limited to a (o) = 0. 25. This is the criterion assumed for optically
thin layers for which the Beer-Lambert law,
a(u) = 1 - ek(u)w
may be approximated as
a (u) = k(u) w
the total absorption of a band, A u, may be written as
a a(u)du = w k(v)dv =wAAV
and the mean value absorption over a given bandwidth isI wa a - Ca(u) dv k(i dv= wA
A&u AX u J7 AVj A V A v
Values of the total absorption of CO 2 and H 2 0 over the 2. 7 L band are
compiled in section 3. 0.
Due to the spectral shape of the absorption curve in the 2. 7p.
region, the mean value absorption must be limited to approximately-1 - 1
a Au = 0.15from a wavenumber of 3500 cm to 3800 cm (2. 85 t to
2. 63k) in order for the maximum a(u) to be limited to 0. 25.
According to Kirchoff's law the spectral absorptivity and emis-
sivity of the gases are equal,
9 MC 61-5-R5

An estimate of CO concentration in dry air to make a=0. 15 m.ay bemade from the total absorption data of Figure 21 which is discussed, in
section 3. 0. It is estimated that about a 5% O2 concentration would
yield a U = A =0.15 and the peak a( I = 0. 25. 'An accurate estimate
is complicated however by the fact that the temperature varies across
the jet and the Ay taken as 8 inches is somewhat ficticious. For these
reasons, the CO 2 concentration may be varied during the experiment.
The jet is observed through a layer of surrounding gas of the
same GO 2 concentration aad also of thickness Ay (8 inches). Therefore
the mean value transmissivity of the gas is taken as
-AX =/0.85
The equations for the R.M.S. intensity, AWl, of the fluctuation
in radiant emittance over a narrow bandwidth is given in Reference 1.
Rewriting these equations in the appropriate form yields
T C 1 + (C 2 / K T - 1) e G Z/ T a A
T T 5 (e2/r'T I2
The irradiance falling on the radiometer detector is
AH'= AW'- '-
7W -AX
this total irradiance will be solved for at an x/d ° = 20, a likely region
to look at in this experiment. At x/d 0 = 20 and for the jet properties
listed in section 2. 2. 2. 1 we find from section 2. 1,
10 MC 61-5-R5

max = .15
0
- .14
8max = 68ROn the jet centerline
-1T 19 0 F
Tv 028
'T
and
-. 16
max = 69RAtrr1 = 1. 0
or 2. 75 inches fromE)T Z2 0 F the jet centerline
T - . 036T
and
-. 106max At r/.-O /Z = 1.5
T 5760Ror 4. 1 inches from
6 -T 14 0 F the jet centerline
T - . 024
T
11 MC 61-5-R5

Average properties will be used in calculating the irradiance
and taken as T1! = 600°R and T'/7max = 0.031.
The radiometer will be assumed identical to the A. C. radio-
meter used in the experiments of Reference 1. This radiometer was
found in Reference 1 to have a field of view of 2 = 0. 076 steradians.
Using the above values we find
Awl = 5.66 x 10 - 7 watts/cm2
AH = 5.85 x 10 - 9 watts/cm2
In order to establish the possibility of obtaining good data from
the experiment proposed, the broad-band signal-to-noise ratio will be
computed. Conventionally the signal-to-noise ratio is equal to the
irradiance falling on the detector divided by the noise equivalent irra-
diance of the radiometer,
S/N AH'
where
NEH = (AD)1/Z(Af)/z
AcollectorD*
The detector used will be the Infrared Industries type BI detector
described in References 10 and 11. This detector has a time constant
less than 601± sec and the peak D* at 3000 cps is 1011 cm(cps)1/Z/watt at
room temperature. In the narrow bandwidth from which the radiation
comes from we may assume monochromatic radiation at Z. 73 . At this
wavelength D */D peak = 0.45.
12 MC 61-5-R5

The radiometer system used here has a detector area
AD = 0.4cm and a collector area AColl = 18 cm . The band-
width will be taken as 40, 000 cps such that (Af)I/2 = 2x 10Z(cps) I1/2
the noise equivalent irradiance is computed to be
NEH = 1.56 x 10 watt/cm2
.. S/N = 37.5
This is considered a good broad band signal to noise ratio for such
an experiment.
2. 2. 3 Instrumentation
The instrumentation consists of pressure and tempera-
ture instrumentation shown in the schematic of Figure 13 and electronics
and data readout equipment to record the data.
The pressure and temperature instrumentation is designed such
that a proper ratio of CO Z may be maintained and the jet flow conditions
such as velocity, pressure, and temperature may be well controlled.
The instrumentation for this phase is considered quite routine.
The total radiation signal will be received from the pre-amplifier
on the A. C. radiometer and analyzed on a Hewlett-Packard wave analyzer.
2. 3 Initial Calibration of the Near Field Infrared Background Simulator
A preliminary initial calibration of the jet noise experiment
described in section 2. 2 has been made. The purpose of this calibra-
tion was to confirm the aerodynamic predictions based upon the data of
section Z. 1 and to establish that an adequate signal for analysis could be
obtained from the A. C. radiometer.
The results from this initial calibration follow.
13 MC 61-5-R5
I]
Z. 3. 1 Aerodynamic Measurements
The hot jet was calibrated using an external pitot probe
and thermocouple probe as shown schematically in Figure 14. As a
result of this calibration it is estimated that during operation the jet
velocity will be known within .± 2 ft/sec and the stagnation temperature
will be accurate within + 10°F.
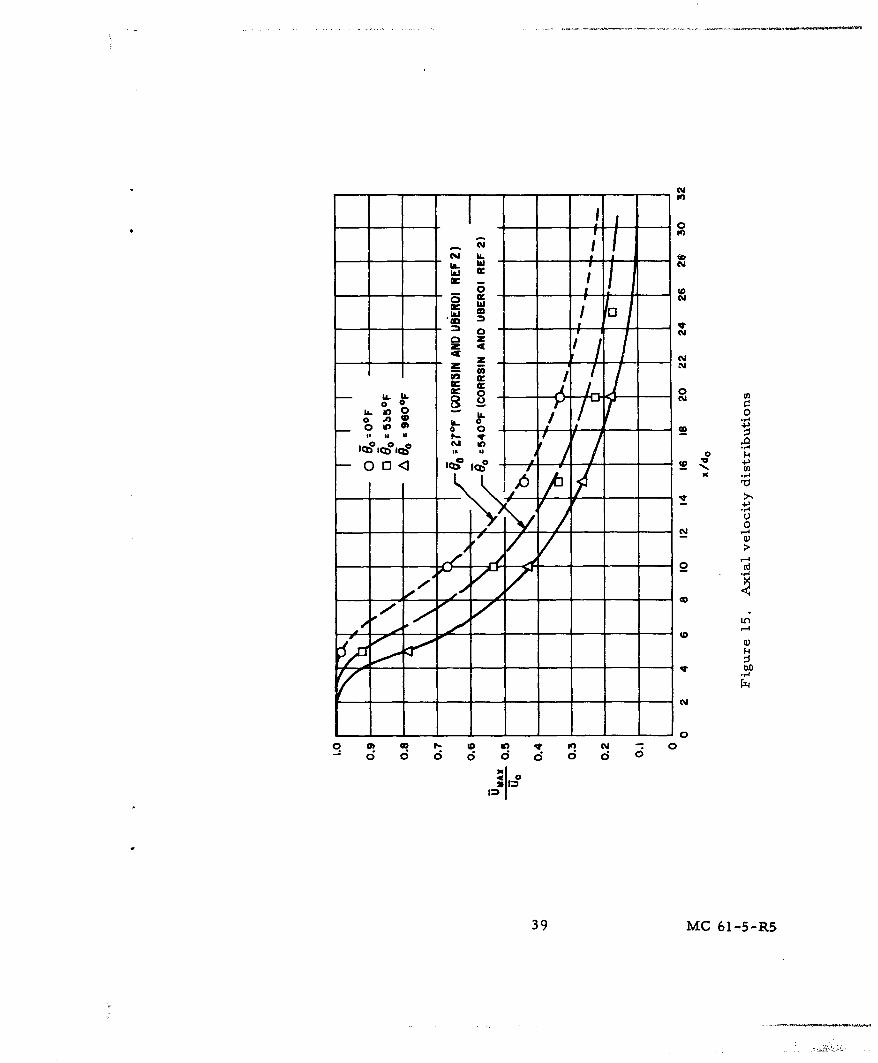
The results of a survey of the axial decay of the centerline velocity,
max' is presented in Figure 15 for the cold jet, 00 = O°F, and for two
elevated temperatures 0 = 535°F and e = 960°F. 6 is the temperature
difference between the initial jet -tagnation temperature and the surround-
ing environment, T -T . Note the excellent agreement with the data ofo r
Corrsin and Uberoi (Reference 2). This data may be collapsed into a
single curve by using X /d ° q.T7T as the ordinate as shown in Figure 16.
The results of the axial decay of the centerline temperature differ-
ence, emax' is presented in Figure 17 for eo = 535°F and eo = 960 0 F.
This data also shows good agreement with the data of Corrsin and Uberoi.
Z. 3.2 Radiometric Measurements
Radiometric measurements were made for the hot jet,
0 = 950°F, at distances from the nozzle exit of X /do = 5.5, 10, 15,0
and 20. The A. C. radiometer with a PbS cell was located approximately
6 1/2 inches from the jet centerline. A brief field of view survey showed
about a one inch field of view on the jet centerline. No foreign gas was
used in the jet so that the radiometric response was due primarily to the
2. 7 i H 0 band. At the time of the runs the H20 content of the air was
approximately 1. 9 percent.
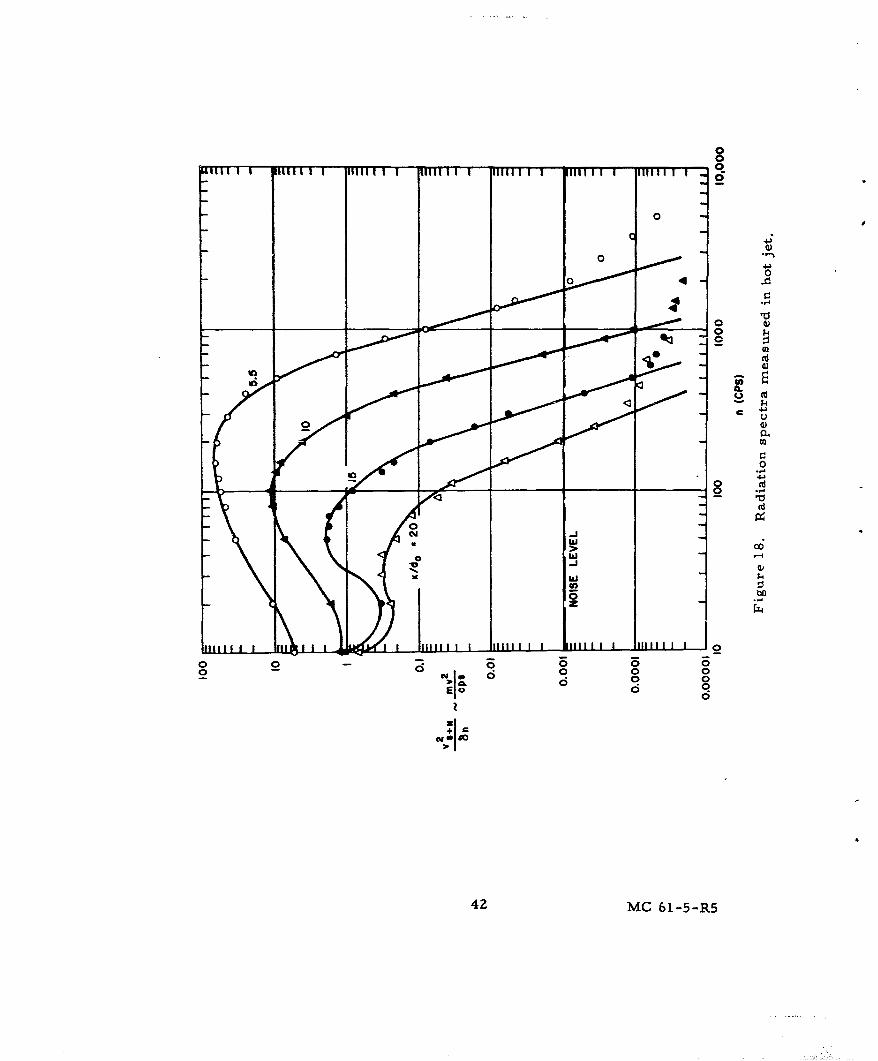
The total radiation signal received from the pre-amplifier on the
A. C. Radiometer was analyzed on a Hewlett-Packard wave analyzer with
a fixed bandwidth of 6n = 7 cps. This signal plus noise voltage, vS+N(n),
when squared and divided by the bandwidth represents approximately the
energy in the fluctuations of the radiation signal at a given frequency. The
data included herein was not corrected for the noise signal which was low
14 MC 61-5-R5

nor for the frequency response of the radiometer since it is flat to 3 db ..
below 3000 cps. The energy spectra of the radiation signals4 is plotted
in Figure 18.
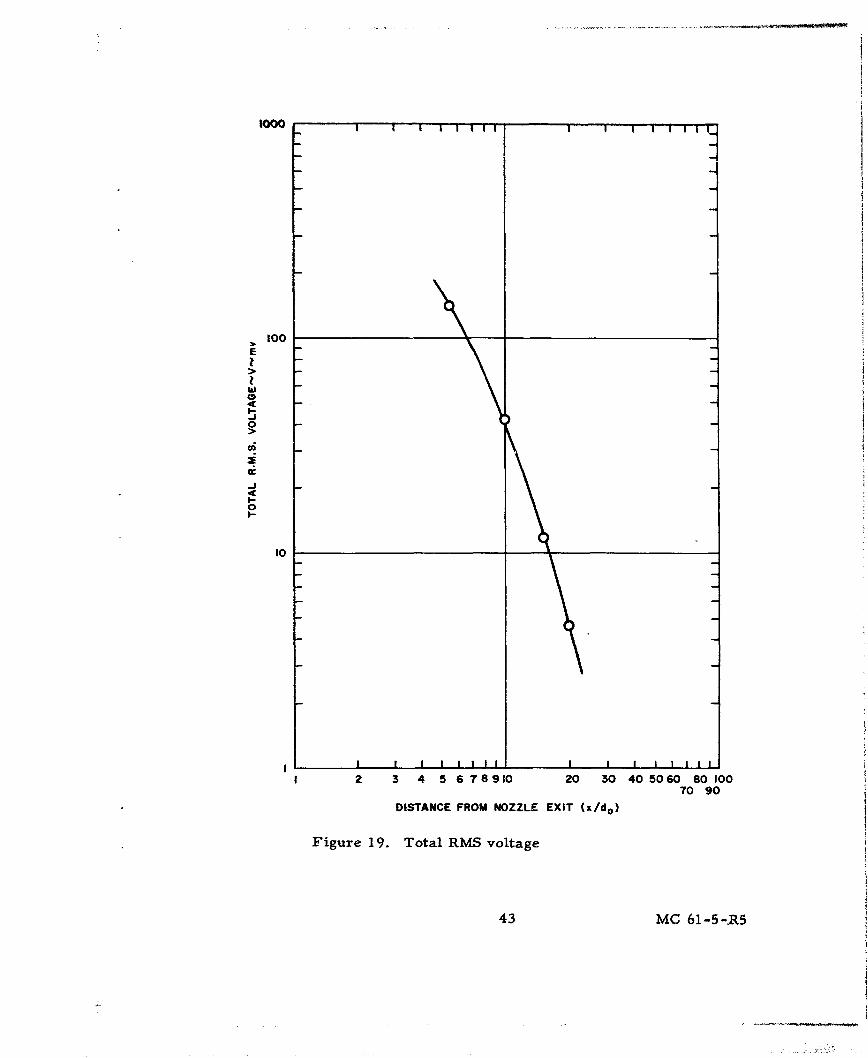
The total energy in the fluctuations of the radiation signal can be
computed from the total R MS voltage, V, of the pre-amplifier output
given by
V2 1 2 (n) dn= v S+Nn)d
n
Note that V is given by the total area under the curves in Figure 18.
The total RMS voltage is presented in Figure 19 as a function of
distance from the nozzle exit plane. Once this total has been obtained,
it may be used to normalize the power spectrum of the fluctuations and
to obtain the spectral energy density.
zv S+ N(n)
E(n) S +VN5 V
2
n
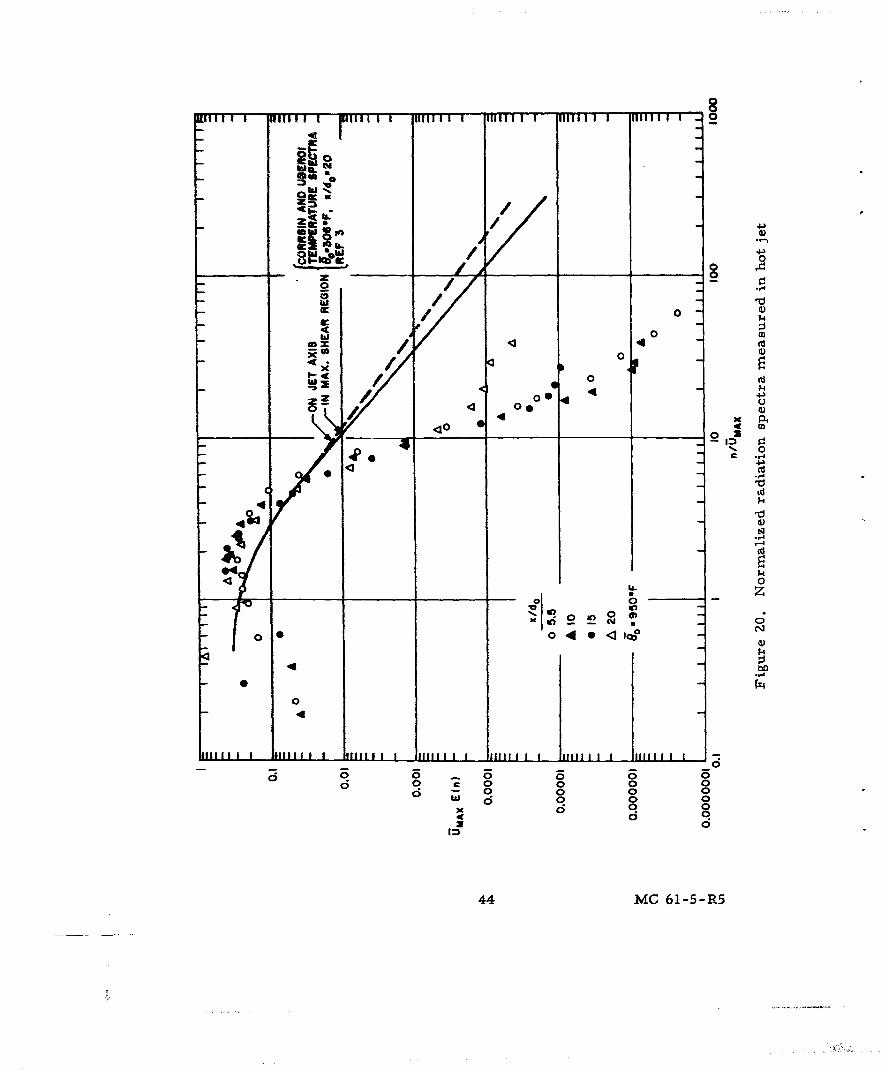
The data of Figure 18has been replotted in Figure 20 in a normalizedform as a function of a pseudo-wavenumber, nU
max"
The radiation energy spectra exhibit different characteristics
than the energy spectra of the temperature fluctuations of Corrsin
and Uberoi (Reference 3). The radiation energy falls off much more
rapidly at higher frequencies than the energy of the temperature
fluctuations. This phenomenon is believed to be due to the aperture-
signal interaction and will be investigated in the future in greater
detail.The longitudinal scale of turbulence is normally defined as
L = IE(o)x 4
and has always been considered a linear function of axial distance in the
case of a free subsonic jet. The data presented shows that although the
axial distance varies from X /do = 5.5 to X /do = 20.0, a factor of 3.6,
15 MC 61-5-R5

the scale of turbulence is nearly constant. If the value of UmaxE(n) at
= 1. 75 is used to define L we find that L x 1. 0 inches, then/max
approximate field of the radiometer. The scale of turbulence will be
further investigated in the future, in particular to ascertain if the field
of view significantly affects these results.
Z. 3. 3 Conclusions from Initial Calibration
The initial calibration of the near field simulator has
demonstrated the feasibility of obtaining a well controlled turbulent
environment in the laboratory to produce a near field A. C. signal.
The aerodynamic characteristics of the jet were essentially
as predicted from the data of Corrsin and Uberoi.
The radiometric measurements indicate two significant findings:
1) The radiation energy spectra exhibit significantlyless high frequency energy than the temperatureenergy spectra.
2) The longitudinal radiation scale of turbulence isnearly constant in the region of X /do = 5. 5 tox /do = 20.0.
These initial findings with respect to the characteristics of the infrared
signal point to the necessity for a rather thorough continued investigation
of the free jet radiation. The results also point up the inadequacy which
may be expected of theories developed at this time to predict the near
field infrared noise.
16 MC 61-5-R5

3.0 INFRARED PROPERTIES OF CO2 AND Hz0 IN THE
2.7 p. REGION FOR SMALL OPTICAL PATH LENGTHS
AND ELEVATED TEMPERATURES
Laboratory experiments in infrared technology frequently
require a knowledge of the infrared absorption of CO 2 and H 2 0 for
small optical path lengths where limited experimental data exists.
The noise simulator and the turbulent boundary layer encountered in
flight both emit over very small optical path lengths. For this reason
a brief survey has been made of available data on total absorption for
CO 2 and H 2 0 in the 2. 7 p. region for small optical path lengths, a large
range of total pressures and a large range of temperatures.
References 9 and 12 through 17 provide data on CO 2 absorption
and References 9, 15, and 17 through 19 are sources of H 2 O absorption
data.
3. 1 General
The simplest formula for describing the absorption of a gas is
the Beer-Lambert law,
a (U) = e -k(u) w
where a(u) is the spectral absorptivity, k (u) is the mass absorption co-
efficient and w is the optical path length generally expressed in standard
atmosphere-centimeters
w =PA
For a gas at small optical path lengths a (u) << 1, and we may write
a (u) = k(u) w
17 MC 61-5-R5

The total absorption of a band, Au, may now be written as
a(u) dv= w k(u) dv= wA AU
where A A or Sk (u) dv is generallytermedthe integratedband intensity.
The mean value absorption over a given bandwidth is a useful
parameter in laboratory work and may be written
for any optical path length. For small optical path lengths a AU may be
expressed in terms of the integrated intensity,
a A u = A w 'k(u)dv
3.2 CO 2 Absorption in the 2. 7p. Region
Howard, et. al. in Reference 12 present total absorption data
in the band Au = 3500 cm "I to 3800 cm I (AX = 2. 6 3 [L to 2. 85k) for
equivalent total pressures of 25 mm. to 1600 nn and optical path lengths
of w = 0. 08 atm. cm. tc 24 atm. cm. These data have been plotted in
Figure Zi on log-log paper and extrapolated to w = 0. 001 atm. cm.
The equivalent total pressure, Pe, is defined as
Pe =PF +BPA
where
PF = foreign gas partial pressure
P = absorber partial pressure
B = the "self-broadening coefficient"
18 MC 61-5-R5

The equivalent total pressure is used as a single variable to account
for the fact that a binary mixture is known to depend on the partial
pressure, PA' of the absorber as well as upon the total pressure of
the mixture. For the 2. 7t CO 2 band. Howard et. al. has determined
Btobe 1.30.
Note that the total absorption curves for different values of P e
are shown in Figure 21 to converge to a maximum slope of unity with
decreasing w. The asymptotic slope is shown as a dotted line and yields
the total intensity of 3 k(u) du = 90 atm cm . It should be noted that
the temperature of the samples for these data were all near room tem-
perature.
Limited data for high temperatures were recorded t y Tourin
and Henry (Reference 9) along with low temperature data. These data,
corrected to standard temperature are plotted on Figure 21. Note that
the data for T = 5400 R falls in agreement with the data of Howard, et. al.
Of major significance however, is the fact that the data for T = Z300°R
and P = 65 mm and P = 715 mm at w = 0. Z atm cm falls close to thee e
asymptotic slope of k(u) du. The other high temperature data point at
P = 910 mm and w = 3. 0 atm cm also falls closer to the asymptote thane
the low temperature data. It appears that, at least in this temperature
range the effect of increasing temperature is to delay the total absorption
"breakaway" from the asymptote which occures with increasing optical
path length. One would also conclude that the integrated intensity, S k(u) du,
is roughly constant in this temperature range.
Malkmus (Reference 13) and Breeze and Ferriso (Reference 14)
have compiled data for the integrated intensity in the temperature range
of 500*R to 5500*R. This compilation of data from Malkmus is shown in
Figure 23 and indicates that the integrated intensity is roughly constant
with increasing temperature up to about 1000°R but increases thereafter.
19 MC 61-5-R5

3.3 H 0 Absorption in the 2. 7p. Region
The total absorption data in the 2. 7 ± region for H 2 0 of Burch,
et. al. (Reference 15) have been plotted in Figure 22 in a manner similar
to the CO 2 plot. These data, covering a range of Pe from 20 mm to 760
mm and a range of optical path length w of 0.003 pr. cm to 1.0 pr. cm.
(4. 85 atm cm to 1613 atm cm) have been extrapolated to an optical path
length of 0. 0001 pr. cm. The equivalent total pressure P was previouslye
defined. However, Burch et. al. have determined B to be 5.0 for the 2. 7t
band of Hz0.
Figure ZZ also shows data from Ferriso and Ludwig (Reference 18)
and data from Goldstein (Reference 19). These data, although at high
temperatures, appear to be consistent with the data of Burch, et. al. It
was not possible to determine the asymptotic value of k(u) du from the
data of Burch, et. al. , however the data of Goldstein at very large equiv-
alent total pressures do provide an asymptote consistent with the other
data.
A summary of integrated intensity data in the 2. 7p. band of Hz 0
in the temperature range of 500°R to 4500'R is shown in Figure 23. Note
the wide scatter in the data compared to the CO data. Considering this
scatter, it is difficult to conclude whether the 5k(u) du really varies in
this temperature range, but it appears that it does not.
20 MC 61-5-R5

4.0 CONCLUSIONS
Studies on the near field infrared background noise problem have
been directedtowards the simulation of the infrared noise emanating from
a known turbulent zone.
A laboratory tool for simulating the near field noise has been de-
signed and demonstrated successfully. This simulator was designed around
the subsonic jet which is subsequently being studied for the purpose of
analyzing the infrared signal emanating from this known source of tur-
bulence. Two significant results followed from the initial studies of the
subsonic jet:
1) The radiation energy spectra exhibit differentcharacteristics than do the energy spectra ofthe temperature or velocity fluctuations. Theradiation energy falls off much more rapidlyat higher frequencies than the energy of thetemperature or velocity fluctuations obtainedpreviously in hot wire experiments.
2) The longitudinal scale of turbulence was nearlyconstant out to a distance of twenty nozzle exitdiameters from the jet exit plane. This resultis contrarytothe generally accepted theory thatthe longitudinal scale of turbulence variesdirectly with distance from the nozzle.
It is concluded from these initial studies on the subsonic jet that the jet
may be developed into a near field noise simulator to test infrared detector
systems. However, more extensive experimental investigations into the
infrared characteristics of the jet are required in order that a theory may
be developed to predict the equivalent noise emanating from other zones
of turbulence such as the hot turbulent boundary layer.
21 MC 61-5-R5

A brief literature survey of infrared properties of CO 2 and H 2 0
in the 2. 7 p. region for small optical path lengths and elevated tempera-
tures was conducted. The data on total absorption has been plotted versus
optical path length in a region such that it may be readily applied toward
laborato. y experiments or in flight boundary layers. As a result of this
survey it is concluded that limited but adequate data does exist for the
total absorption of CO 2 and H 2O in the 2. 7 p. region for the unusually small
optical path lengths encountered in laboratory or in flight near field infrared
noise problems.
22 MC 61-5-R5

REFERENCES
1. Lorah, Lawrence D., Hill, JacquesA.F., and Draper, James S.:"1 A Wind Tunnel Measurement of Fluctuations in Infrared Emission
from a Turbulent Mixing Layer (U)" MITHRAS Report MC 61-14-R2,September, 1964. (Confidential).
Z. Corrsin, Stanley and Uberoi, Mahinder S. : "Further Experimentson the Flow and Heat Transfer in a Heated Turbulent Air Jet"NACA Rept. 998, 1950.
3. Corrsin, Stanley and Uberoi, Mahinder S.: "Spectra and Diffusionin a Round Turbulent Jet", NACA Rept. 1040, 195 1.
4. Laurence, James C.: U Intensity, Scale, and Spectra of Turbulencein Mixing Region of Free Subsonic Jet", NACA Rept. 1292, 1956.
5. Hinze, J. 0. and Van Der Hegge Zijnen, B.G. :"Transfer of Heatand Matter in the Turbulent Mixing Zone of an Axially SymmetricalJet", Applied Science Research, 1A, 435, 1949.
6. Ricou, F. P. and Spalding, D. B.: "Measurements of Entrainment byAxisymmetrical Turbulent Jets", Journal of Fluid Mechanics 11, 21,August 1961.
7. Hinze, J. 0.: "Turbulence", McGraw Hill, New York 1959.
8. Hill, J. A. F. :'"Density and Temperature Fluctuations in TurbulentBoundary Layers", MITHRAS Memo 261, February 1963.
9. Tourin, R. and Henry, P. :" Infrared Spectral Emissivities andInternal Energy Distributions of Carbon Dioxide and Water Vaporat High Temperatures", Geophysics Research Directorate ReportAFCRC TR-60-203, December, 1959.
10. Wieting, Terrence J.:" Visible and Infrared Detectors: State of theArt", MITHRAS Memo 172, April 1962.
11. Infrared Industries. "Photoconductors", Technical Bulletin No. 7.
12. Howard, Burch, and Williams: " Near Infrared Transmissionthrough Synthetic Atmospheres", AFCRC-TR-55-213, November1955.
13. Malkmus,: 'Infrared Emissivity of Carbon Dioxide (2. 7 Band)",Journal Optical Soc. of Am. Vol. 54 No. 6, page 751, June 1964.
23 MC 61-5-R5

REFERENCES
14. Breeze and Ferriso, :" Shock-Wave Integrated Intensity Measure-ments of the 2. 7 1 Micron CO Band Between 1200 0 K and 3000*K,Journal of Chemical Physics, 2 Vol. 39, No. 10 Page 2619, 15 Nov.1963.
15. Burch, Gryvnak, Singleton, France, and Williams,: "InfraredAbsorption by Carbon Dioxide, Water Vapor, and Minor Atmos-pheric Constituents", AFCRL-62-698, July 1962.
16. Burch, Gryvnak, and Williams,: " Infrared Absorption by CarbonDioxide", Scientific Report II, Contract AF 19(604)-2633, Geo-physics Research Directorate, Air Research and DevelopmentCommand 1960.
17. Zachor,: "Near Infrared Transmission Over Atmospheric SlantPaths, MITHRAS, Reprinted from MIT Inst. Lab. Report-R-328,Vol. 2 July 1961.
18. Ferriso and Ludwid, :"Spectral Emissivities and IntegratedIntensities of the 2. 7 . H 2 O Band Between 530°K and 22000KJournal Quant. Spectrosc. Radiation Transfer page 215, Jan/Feb. 1964.
19. Goldstein, : "Measurement of Infrared Absorption by Water Vaporat Temperature to 1000°K", Journal Quant. Spectrosc. RadiationTransfer, Vol. and page 343, March/April 1964.
24 MC 61-5-R5

0-
l> ~
IL i-
00
00
Q)
00
z
0 '0
Inl
z 0r0
I.-
ILI
25 MC 61-5-R5

____ ___ ____ _______ ___ 0
w
z
U.N 3
_ _ _ _ _ _ 4J
614747
8 C0_ _ _ _ _-4
N 0 '4J
610
________
____ ___ ___ ___ ____ __
26 MC 61-5-R5

04
U)I
4 4-)
00
40 0NI
/2Y -4
-- 0
0. O~ 0 P- COFt I
o ~6 6 6 6 6 0
27 MC 61-5-R5

u0
~011.
U. 0In w
I1L.II
wI 0 Wi_-< cm 0
N z
0 ra
U 0
. U)
1, 0 0L
_ 0/ 0ini
-)
_ _ f_ - o
1I 2ii IOD
Z8 C 1--R

N
w o
In -
\ olILo 0n 0
- - - - -- 0,-
'4J
w N
00
S0 00 N >
- -. 0--o
0 0 0
P-I-
29 C --l 0 00
29 _ C 615R

I
' to
__M 00N
0 0 4-
o cC
z z
49 -C --
00
0 IL0 0-w 1o
o0 MC 61--R

dit)
Ct u
00C-4)
010
344
444
.4
00
00
060
0\I 615R
31

-II U,
- -
- 0
j I 0
..o o o 4*
0 I -l
Z " I
o ob
* _ N-
0 0 d- R
o I Ila:Ica I
32
0 0
61 5 R

U.U
00
ty
w 0 Rw PC
'i, m h 00 =
N. - 1Z 3 _ - _' 0t
. -4)
zo Zo
00
-3 MC 61--R

LIIn
00
ID00
00
400
00W
34 MC 0 15R

J111 I111 I 2
U)
0
0-4J
10 25
w4L 0;
~wwim N)
P4
;4
:I
-5 =
35 MC 61-5-R5

.j I I I 1 1 2T--T-
0
4JN
.
0)
xw d)
c 0
W 4
z ;4
CD)
i0
w P
00
V
z
IL a
w0b
- -3
36 MC 61-5-R5

L-
010
w 4
.44
(A 0 .
h0
Chi2
Sw 0
U282
'40
00 I
0 00 04h
z U)
hiin
zoot
- tinz ~ IN
hi9
37M 15R

0)OSCILLOSCOPE WVRADIOMETER
THERMOCOUPLE
DIG ITAL
C VALES ITOTCOL VOLTMETER
VALVE TAP THERMO ELECTRIC
DRAFT GAGE MANOMETER
HEATER
Figure 14. Schematic of hot jet calibration
38 MC 61-5-R5
-
0
=III
o oto
LsIa.
I0
|ll ||
-
z
/ 0
NN
00
3 --
C 1-5/
I 0 i n 0 0,
OD
qr- :3
It4
In0
0.
fz4
39
C 1--R

cm
U. LU
SIn.o * I
o 4A -
. -_ N. _ _
N. o t,.o
0
-~~ 0 0 14-1 -o C- '0 0o "
o00o0I '.o 0] '1 /-- - - - ~ W
/- 0
- N.
t -
/ - o
--- --- N
o0
o - - - ----
0)
- - o U
-4
- - 0
-a 0 0d 0 0
40 MC 61-5-R5

0--I-.toN
k.o
a 0
o0 0 0K) 0 -J
to 0) ODin < -4u .
ice l0
IL 4)
to 4)a 4J.
- - - Ice - -- _ _ 0 -A
4
f34
60 00 0 60 0
41 Mc 61-5-R5

N
U.n
00
---- 4-
00
41 MC 1-5-R
4-)00
0____ ___ _ __ __ 2
o31 ILIC00 w 00 0 0
6 010
EL 0 0E 0
42 MC 61-5-R5
tooE
>i
0
4
00
I I 1 1 I I I u ll
1 2 3 4 5 678910 20 30 40 50 60 80 10070 90
DISTANCE FROM NOZZLE EXIT (x/d 0 )
Figure 19. Total RMS voltage
43 MC 61-5-,R5
l I nt ,1 1__. 1 , ill1 T I I I 1 'I' 0 I I -
0
' ' , '00
6r 00 )
/4 0 0
0 / 4400 __ _ 0 4
*0
.- 4
04
4 0
44I MCI 615-R
- 0o o o o 0
d o o oi
6 -- 0 o 0 0
x 6 0 06 o.1 o
44 MC 61-5-R5

06 N
m 2
a w
E0
o o'
Iii
0 _ g - 0
". , . t-
loo
4-O
z Z
0
g j
14
L-- A A5m 1
45 M~C615R

00
I- U 0
In -it 0
IL b P
z~ = =0 L3.w 0--
Sw 0 4.
IL U)x 0 0IL
0 -ej%
t c d
-I- 0
0.0
01
0o r0cd
,*p (01) v f
46 MC 61-5-R5

0
o oo oo n
0
0 0In 0 0
2 0 -0
z 00 a >02- -0
,.0
OW 0o <C z 0z0 0 2 0 -0
- 0 0
0 wI Z 00
0O O ir 0
0 0
0 in
cc 0
00 4J0 ;
o1 b
0
o~ 0 0K) 0
o2 0
0 00
0 0 0cm 0 0 0 0 0
o 0
x0
I I 0
000 0 0 0 80 0 00 0
(U'SAJ v- ) (A) .- ,LSN34NI M3,LV 15RNI
47 MC 61-5-R5

DISTRIBUTION LIST
United States NavyAttention:
Chief, Bureau of Naval Weapons RMGA-8 (two copies)Department of the Navy RM-371 (one copy)Washington 25, D.C. RM-372 (one copy)
RRRE-3 (one copy)
DirectorNaval Research Laboratory Code 2020 (two copies)Washington 25, D.C.
Commanding OfficerNaval Ordnance Laboratory, White Oak The Library, Room 1-333Silver Spring, Maryland (one copy)
Commanding OfficerNaval Missile Center Technical LibraryPoint Mugu, California (one copy)
Commanding OfficerNaval Ordnance Test Station Technical LibraryChina Lake, California (one copy)
Chief of Naval Research Code 421 (one copy)Department of the Navy Code 461 (two copies)Washington 25, D.C. Code 463 (one copy)
Code 438 (one copy)
Commanding OfficerOffice of Naval Research Branch Office Mr. Thomas B. Dowd495 Summer Street (one copy)Boston 10, Massachusetts
Commanding OfficerOffice of Naval Research Branch Office LCDR R. W. AdlerBox 39, Navy No. 100, Fleet Post Office (one copy)New York, New York
CommanderDavid Taylor Model Basin Norman ZieglerWashington, D.C., 20007 Aerodynamics Laboratory
(three copies)
United States Air Force
Director of Development PlanningHeadquarters (one copy)United States Air ForceWashington 25, D.C.
48 MC 61-5-R5

CommanderAir Force SRGLOffice of Scientific Research (one copy)Washington 25. D.C.
CommanderAir Force Cambridge Research Laboratory LibraryL.G. Hanscom Field (one copy)Bedford, Massachusetts
Director of ResearchHeadquarters USAF AFRSTAWashington 25, D. C. (one copy)
Commander WCOSI, Library (one copy)Aeronautical Systems Division ASRNGE-2Wright-Patterson Air Force Base Mr. Wm. P. Kennedy(one copy)Dayton, Ohio WCIRW-5, Reports(one copy)
CommanderRome Air Development Center Research Library RCRES-4CGrIffiss Air Force Base (one copy)Rome, New York
Air University Library Mrs. Elizabeth C. PerkinsUnited States Air Force Chief, Document AcquisitionMaxwell Air Force Base, Alabama Branch (one copy)Commander
ir Force Research and Technology Division Library (one copy)Be-"ling Air Force BaseWashington, D. C., 20332
CommanderAir Force Systems Command Library (one copy)Andrews Air Force BaseWashington 25, D.C.
United States Army
Commanding GeneralUnited States Army SIG-EL RDRSignal Research and Development Agency (one copy)Fort Monmouth, New Jersey
CommanderArmy Missile Command ORDDW-MDRedstone Arsenal Air Defense LaboratoriesHuntsville, Alabama (one copy)
Commanding OfficerEngineering Research and Development Labs (one copy)Fort Belvoir, Virginia
49 MC 61-5-R5

National Aeronautics and Space Administration
DirectorNational Aeronautics and Space Administration Division Research Information
1520 H Street, N.W. (one copy)Washington 25. D.C.
Others
IRIA University of MichiganWillow Run Laboratories LibrarianYpsilanti, Michigan (one copy)
Advanced Research Projects AgencyWashington, D.C. Ralph Zirkind (one copy)
Aerospace CorporationEl Segundo, California Library (one copy)
Defense Documentation CenterCameron Station (twenty copies)Alexandria, Virginia
50 MC 61-5-R5

u~V 0
uI u
z be. N -z
zO' 0,1 1
0t Uu 0 N %
mm r k z z - UEw-
-a c x C:o: : f
:1 0 S.D k M U (t a 00 '0 a. v N o .0 0. 0
-. 0 t U 'l c to v cci 0, U. %UZ
0. V .- .u &.. -
-0 .0 0 00-. Z~~O~ v N U.O >'.O 0U..~
x r 0 V- X.Cc '0 0r... gUN11
E 2 u uzu k- 1 2
of- -0u0-u-00 " 00
0- go-
-* -- N o .0 M- d
z --:, c - 0
o 7 , - " E. . E -.0 x - o ~..
t > r-u0o02m c
E~- 00u U~ > CO :5
E3 7; zo E c1 0
S~~'.0> 00 0 0
'Cs
Z~ eSj:U. - E . ~. ~ ~ £.
- U1:
tn E 40Uat o
cc U1 l.4.4s*.20. : rS
~~~~~~ *I'. :tr4 '' s~
'0C~~U S ~ U ~ 4 '.-:; cs > ~V U . C a
-~u -'u C .. 4004 . z')E
~ ~.s.'00.4 I~s.U -
o O'2 0