to apply or not to apply fertilizers: mineral nutrient
TRANSCRIPT
To apply or not to apply fertilizers: Mineral nutrient uptake by grapevines and
interpretation of tissue analyses.
Larry E. Williams Department of Viticulture and Enology
Kearney Ag Center Parlier, CA

Topics for discussion at the 2012 Foothill Grape Day
“Because of our clay soils, I have not seen much N deficiency here. We typically see P, K and boron deficiency. Anything you can comment on K foliar sprays (do they work) would be appreciated.” Lynn Wunderlich Farm Advisor – Central Sierra

Basics of mineral nutrient uptake in grapevines and their relationship to fertilization of
vineyards.

Effects of time of year, location and cultivar on the
concentration of N in various organs of the grapevine.

The concentration of N within the leaves and stems decreases throughout the season.

The concentration of N within the cluster decreases throughout the season.
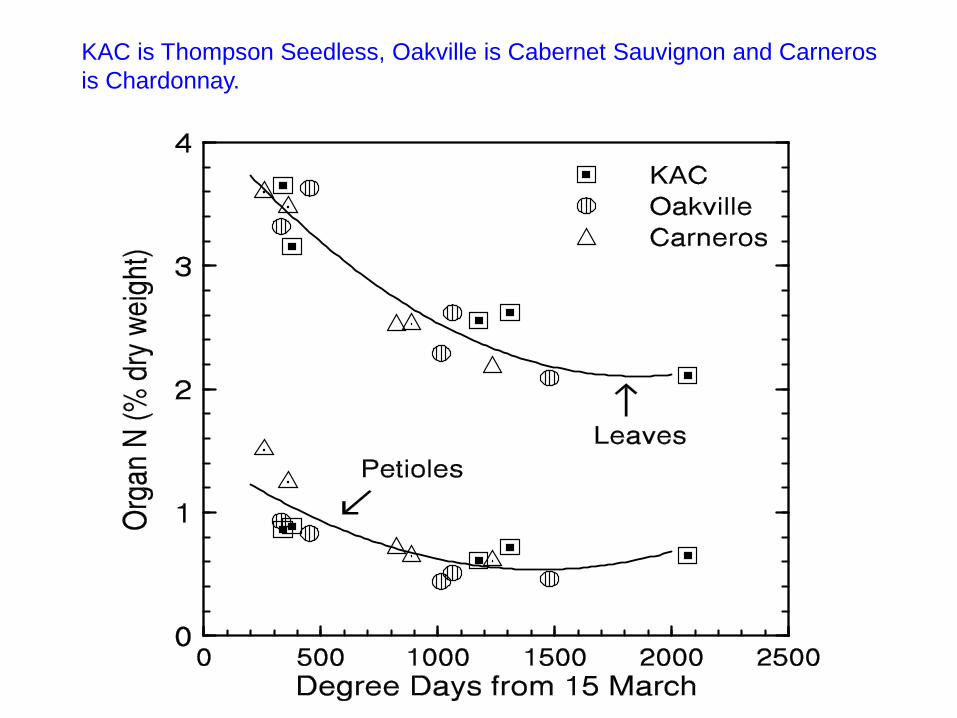
KAC is Thompson Seedless, Oakville is Cabernet Sauvignon and Carneros is Chardonnay.

KAC is Thompson Seedless, Oakville is Cabernet Sauvignon and Carneros is Chardonnay.

Conclusions: • The N concentration in the organs of grapevines
generally decreases as the season progresses probably due to a dilution effect (increase in biomass greater than that of N).
• The N concentration follows similar patterns across years, locations and cultivars when expressed as a function of degree days.
• Such patterns may be useful in a fertilization management program to assess vine nutrient status.
What drives the uptake of mineral nutrients in grapevines?

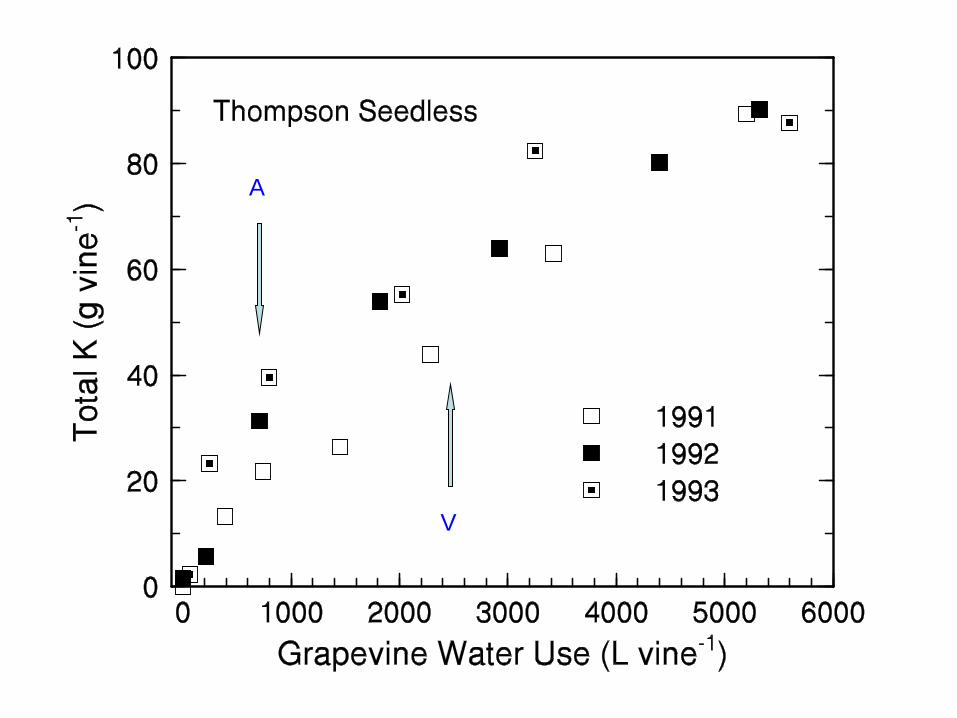
Background • Many have shown that there is a linear relationship
between transpiration of plants and dry biomass production on a seasonal basis.
• Several plant growth models have assumed that N uptake by plants is a linear function of transpiration. This would indicate that ion movement in the soil, ion uptake by the roots and distribution within the plant was due to mass flow.
• Others have assumed that N (and perhaps K) uptake by plants is driven by growth under non-stress conditions.

A
V
5,500 L = 728 mm or 28.6 inches of water

A
V
A
V


Summary: • Nitrogen and K uptake by the vines were
curvilinearly related to both seasonal vine water use and biomass accumulation of Thompson Seedless grapevines.
• The curvilinear relationship was due to the separation of vegetative and reproductive growth demands of N and K during the season.
• It is unknown whether the greater N and K uptake during the early portion of the growing season was due to an active uptake of both mineral nutrients or redistribution of N and K from the permanent structures of the vine.
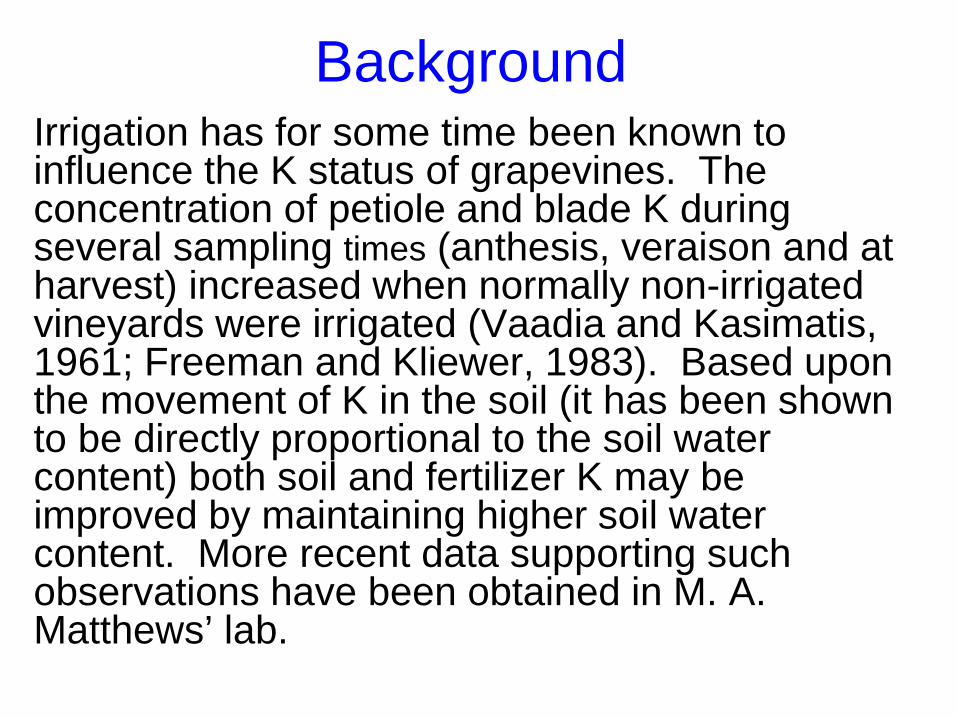
Background Irrigation has for some time been known to influence the K status of grapevines. The concentration of petiole and blade K during several sampling times (anthesis, veraison and at harvest) increased when normally non-irrigated vineyards were irrigated (Vaadia and Kasimatis, 1961; Freeman and Kliewer, 1983). Based upon the movement of K in the soil (it has been shown to be directly proportional to the soil water content) both soil and fertilizer K may be improved by maintaining higher soil water content. More recent data supporting such observations have been obtained in M. A. Matthews’ lab.

Effects of Irrigation treatment and time during the 3rd growing season on total N of clusters, leaves and stems
Irrigation --------------- N (% dry wt) ------------- Date Treatment Clusters Leaves Stems
August 12 0.2 0.58 2.07 0.80 0.6 0.48 2.02 0.57 1.0 0.51 2.08 0.61 1.4 0.54 2.28 0.45
Sept. 7 0.2 0.64 1.99 0.78 a 0.6 0.54 1.92 0.61 ab 1.0 0.61 1.94 0.47 b 1.4 0.58 1.93 0.47 b
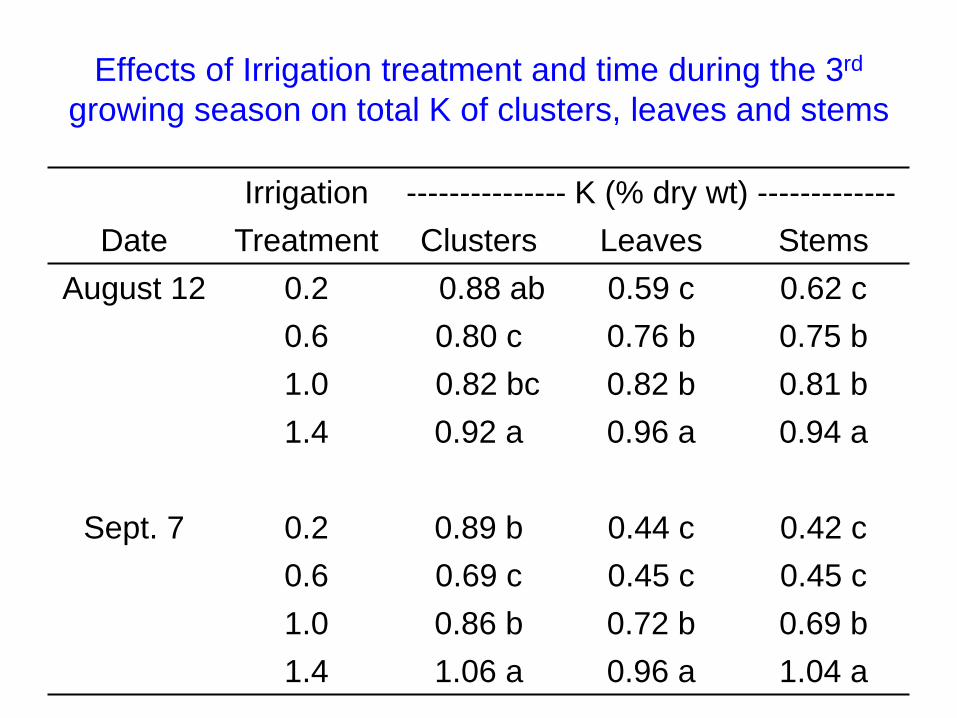
Effects of Irrigation treatment and time during the 3rd growing season on total K of clusters, leaves and stems
Irrigation --------------- K (% dry wt) ------------- Date Treatment Clusters Leaves Stems
August 12 0.2 0.88 ab 0.59 c 0.62 c 0.6 0.80 c 0.76 b 0.75 b 1.0 0.82 bc 0.82 b 0.81 b 1.4 0.92 a 0.96 a 0.94 a
Sept. 7 0.2 0.89 b 0.44 c 0.42 c 0.6 0.69 c 0.45 c 0.45 c 1.0 0.86 b 0.72 b 0.69 b 1.4 1.06 a 0.96 a 1.04 a

Effects of Irrigation treatment on total vine % N and K and the amounts of those two nutrients per
unit area at harvest the 3rd year of the study.
Irrigation treatment (fraction of applied H2O amts)
Total vine 0.2 0.6 1.0 1.4 N (% dry wt) 0.81 a 0.70 b 0.75 ab 0.73 ab K (% dry wt) 0.72 bc 0.63 c 0.82 b 0.95 a kg N ha-1 57.8 89.2 107.3 108.3 kg K ha-1 51.5 80.5 116.8 140.4
lbs. N/acre 52 79 95 97 lbs. K/acre 46 72 104 125
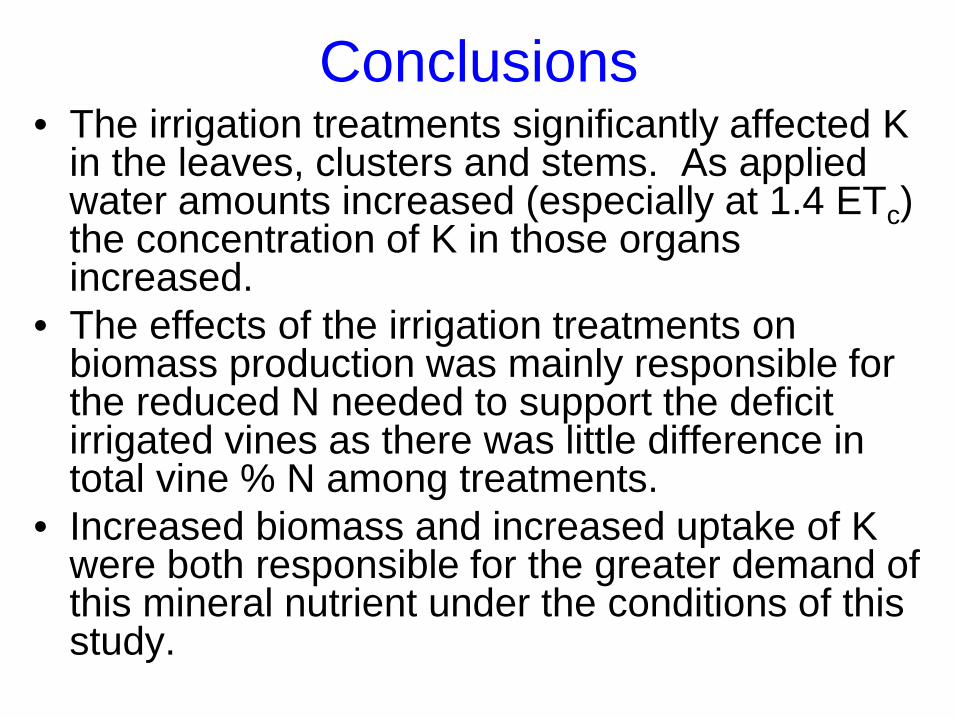
Conclusions • The irrigation treatments significantly affected K
in the leaves, clusters and stems. As applied water amounts increased (especially at 1.4 ETc) the concentration of K in those organs increased.
• The effects of the irrigation treatments on biomass production was mainly responsible for the reduced N needed to support the deficit irrigated vines as there was little difference in total vine % N among treatments.
• Increased biomass and increased uptake of K were both responsible for the greater demand of this mineral nutrient under the conditions of this study.

Dynamics of N reserves in the grapevine: implications for N
management practices

A V BB

The amount of N in the vine at harvest (9/5) and that at the end of the growing season (all leaves have fallen from the vine). The bottom row is the change in N from harvest to the end of the season. EOS stands for end of season.
Date
Clusters
Leaves
Stems
New Total
Fruiting canes
Trunk
Roots
---------------------------------------- (g N / vine) -------------------------------------- 9/5 32.0 30.0 11.1 73.1 2.2 7.0 18.8 EOS 31.1 15.6 12.1 2.5 11.1 31.7 Δ 9/5 --- -14.4 +1.0 +0.3 +4.1 +12.9
Values above are equivalent to lbs per acre.
The loss of N from the leaves between harvest and EOS account for 85% of the N accumulated in the trunk and roots after harvest.

A V BB

Utilization of Nitrogenous and Potassium Reserves
• N may be translocated from the permanent structures of the vine (the trunk early on and roots later) to the shoots early in the season. The reserves may supply 10 to 25% of the total N needed for shoot and fruit growth.
• The vine’s N reserves are primarily restored with N from the leaves as they senesce. This occurs from harvest through the end of leaf fall.
• Potassium is primarily derived from the soil with little coming from the permanent organs.

N BUDGET OF THOMPSON SEEDLESS GRAPEVINES
Growth Period Leaves ~35 g/vine Shoots ~10 g/vine Clusters ~30 g/vine
75 g/vine After Harvest Fallen leaves ~20 g/vine Prunings ~15 g/vine Remolilization ~15 g/vine
50 g/vine
g per vine are equivalent to lbs per acre with these vine and row spacings
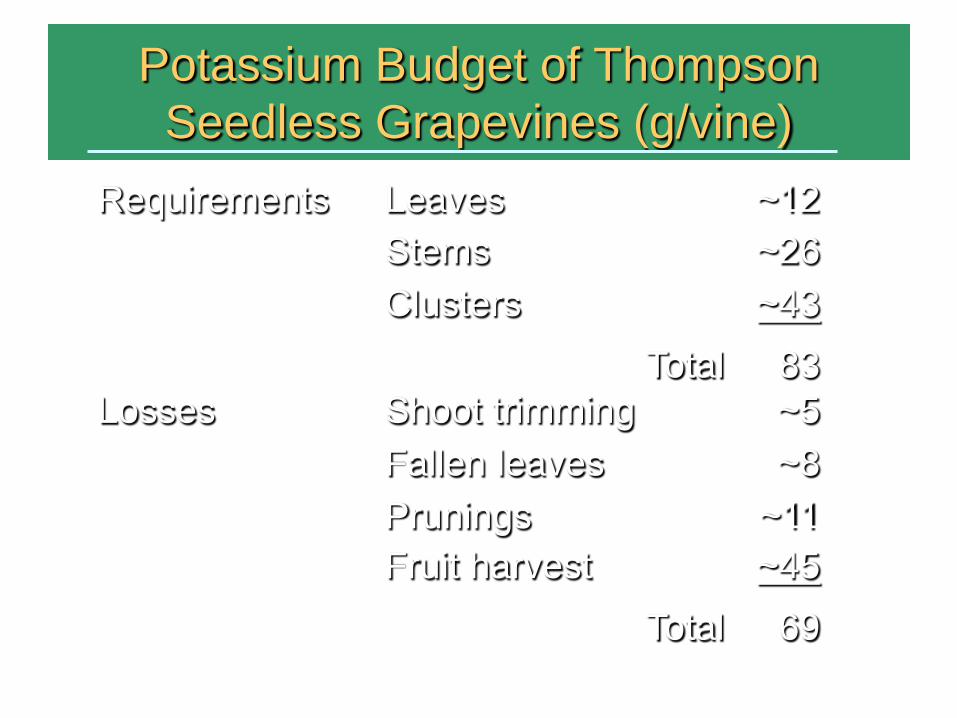
Potassium Budget of Thompson Seedless Grapevines (g/vine)
Requirements Leaves ~12 Stems ~26 Clusters ~43
Total 83 Losses Shoot trimming ~5
Fallen leaves ~8 Prunings ~11 Fruit harvest ~45
Total 69 g per vine are equivalent to lbs per acre with these vine and row spacings
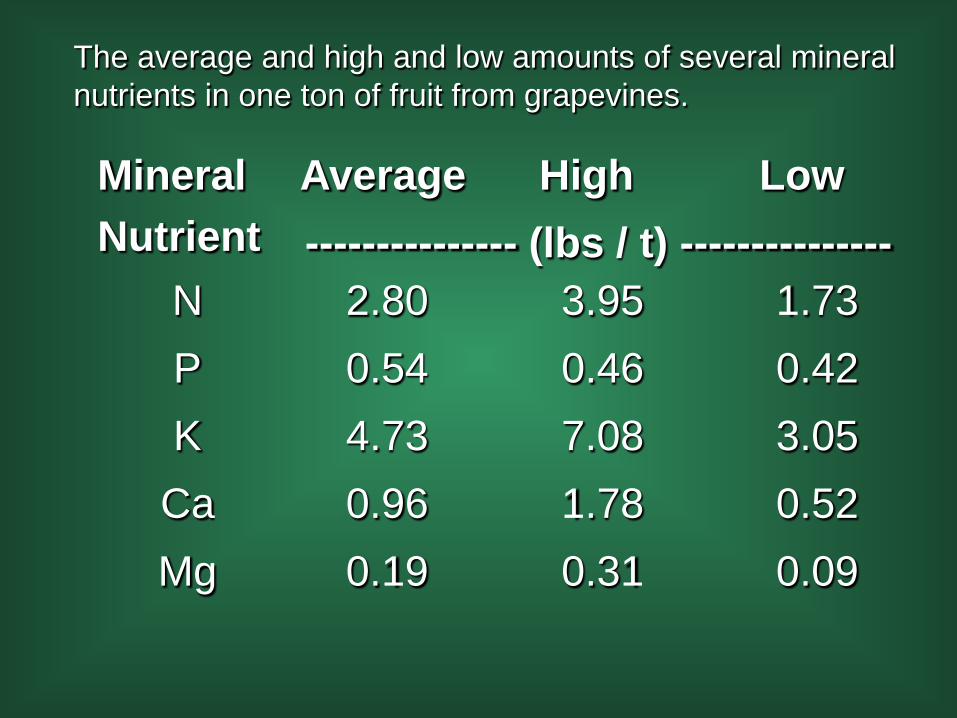
Mineral Nutrient
Average High Low --------------- (lbs / t) ---------------
N 2.80 3.95 1.73 P 0.54 0.46 0.42 K 4.73 7.08 3.05
Ca 0.96 1.78 0.52 Mg 0.19 0.31 0.09
The average and high and low amounts of several mineral nutrients in one ton of fruit from grapevines.
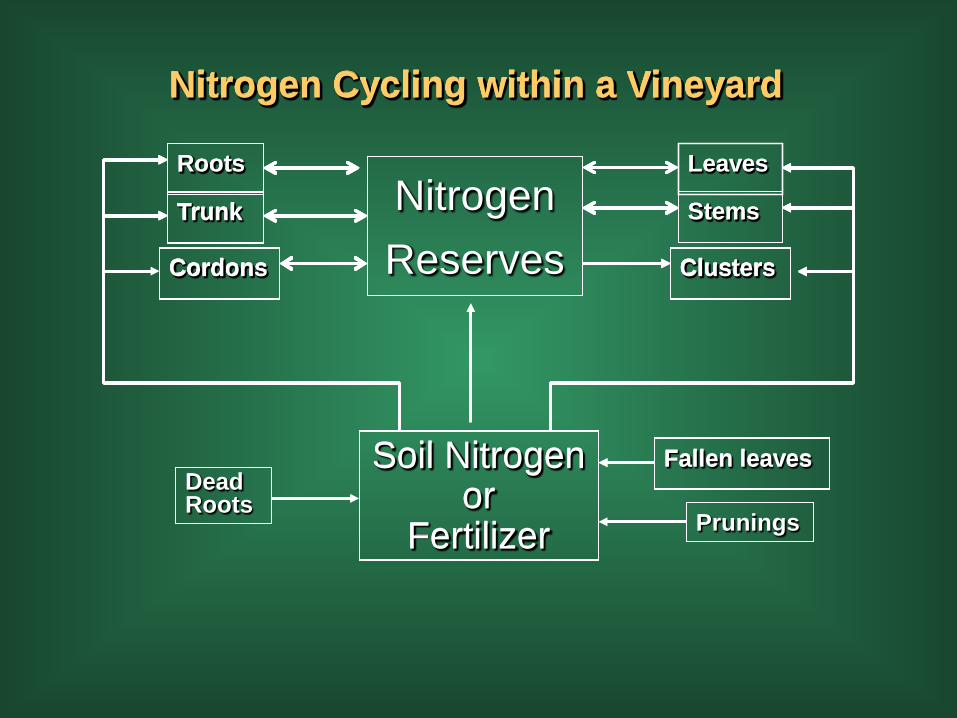
Soil Nitrogen or
Fertilizer
Roots
Trunk
Cordons
Leaves
Stems
Clusters
Fallen leaves
Prunings
Nitrogen Cycling within a Vineyard
Roots
Trunk
Cordons
Leaves
Stems
Clusters
Nitrogen Cycling within a Vineyard
Roots
Trunk
Cordons
Stems
Clusters
Nitrogen Cycling within a Vineyard
Soil Nitrogen or
Fertilizer
Fallen leaves
Trunk
Cordons Clusters
Nitrogen Cycling within a Vineyard
Cordons Clusters
Nitrogen Cycling within a Vineyard
Dead Roots
Nitrogen Reserves
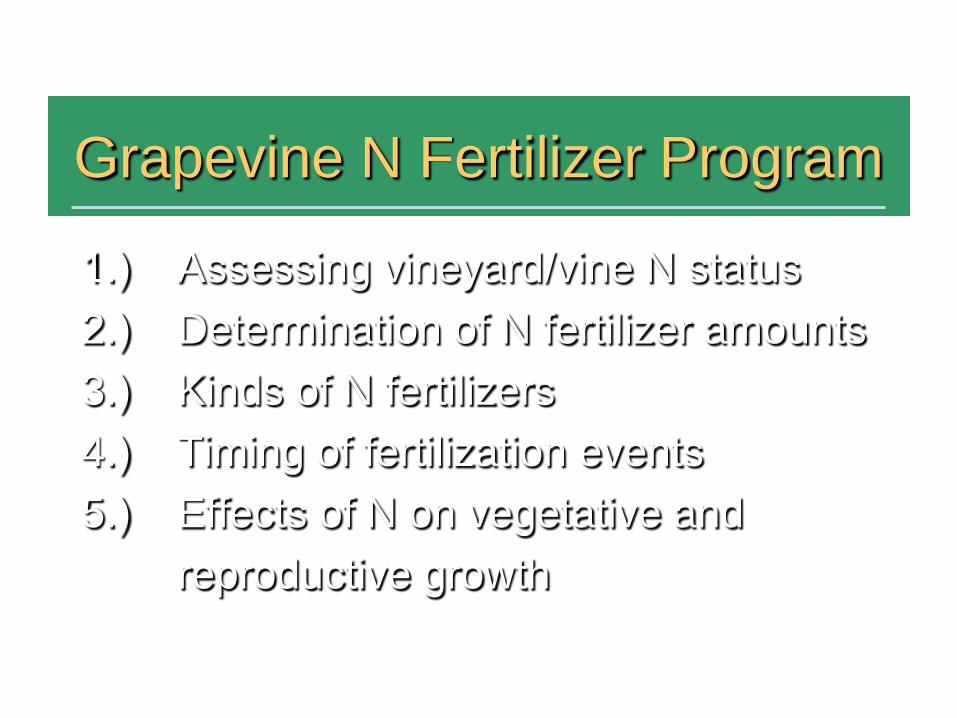
Grapevine N Fertilizer Program
1.) Assessing vineyard/vine N status 2.) Determination of N fertilizer amounts 3.) Kinds of N fertilizers 4.) Timing of fertilization events 5.) Effects of N on vegetative and reproductive growth
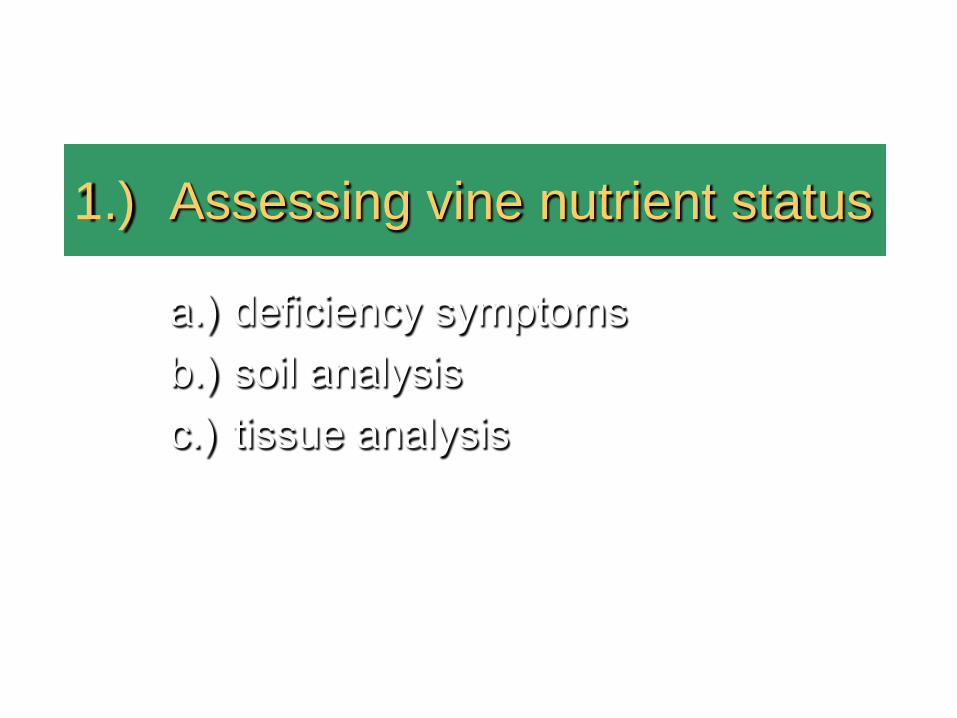
1.) Assessing vine nutrient status
a.) deficiency symptoms b.) soil analysis c.) tissue analysis

1.) Assessing vine nutrient status
a.) deficiency symptoms – by the time this is observed vine growth may already be adversely affected.

1.) Assessing vine nutrient status b) Soil analysis “Soil Analysis is of no value in
determining N needs. This is due to the transient nature of its main available form (NO3) in the soil profile and the unavailability of organic-N fraction until it is mineralized.”
L.P. Christensen, UCCE Specialist Raisin Production Manual

Boron toxicity symptoms on Crimson Seedless.
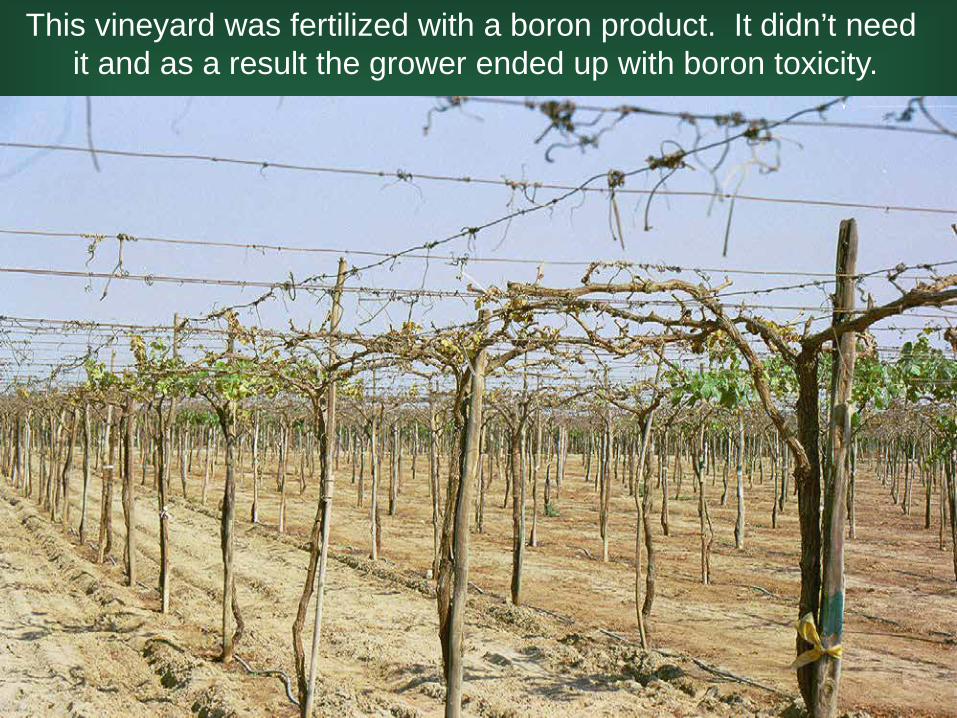
This vineyard was fertilized with a boron product. It didn’t need it and as a result the grower ended up with boron toxicity.
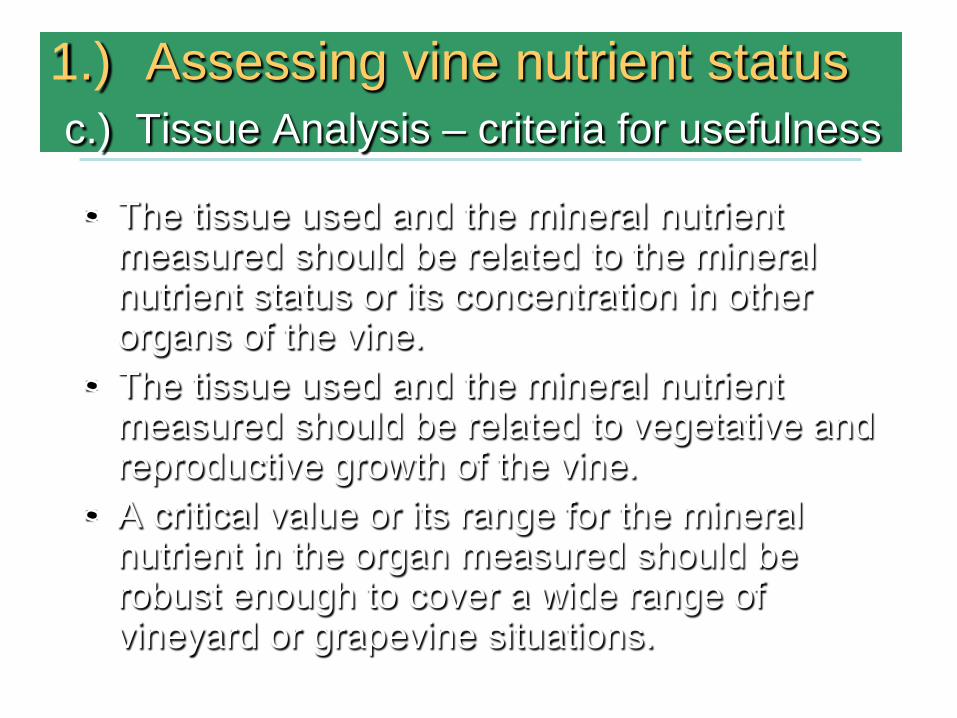
1.) Assessing vine nutrient status c.) Tissue Analysis – criteria for usefulness
§ The tissue used and the mineral nutrient measured should be related to the mineral nutrient status or its concentration in other organs of the vine. § The tissue used and the mineral nutrient
measured should be related to vegetative and reproductive growth of the vine. § A critical value or its range for the mineral
nutrient in the organ measured should be robust enough to cover a wide range of vineyard or grapevine situations.
1.) Assessing vine nutrient status c.) Tissue Analysis
§ Time of Sampling § Type of Tissue Sampled § Form of Nitrogen

Time of Sampling
Bloom and/or Veraison
§Definite Growth Stage §Repeatable §Convenient
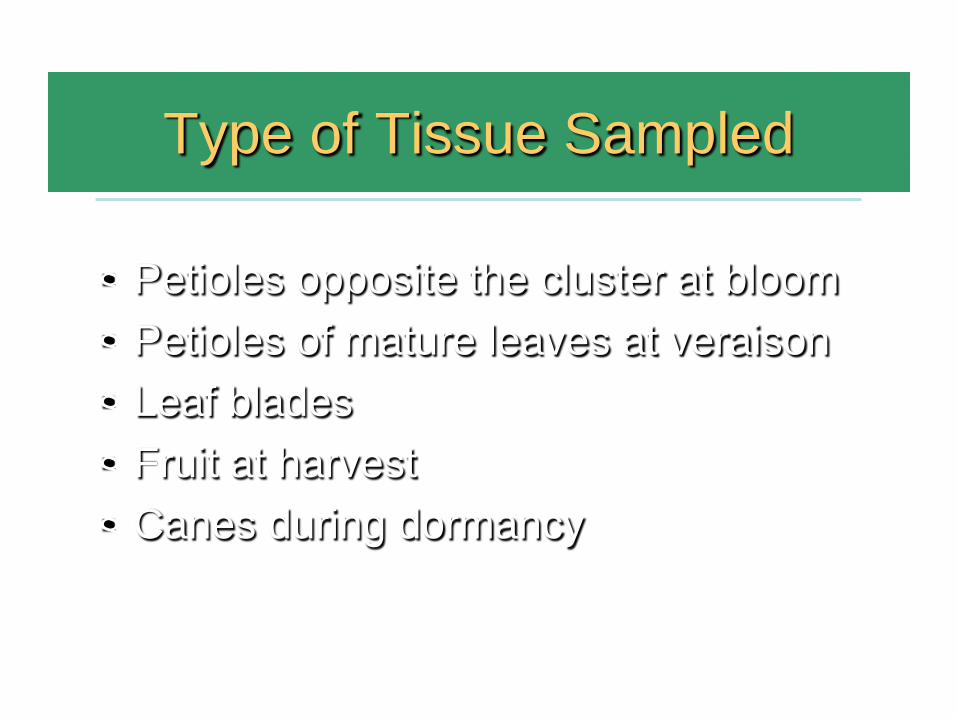
Type of Tissue Sampled
§ Petioles opposite the cluster at bloom § Petioles of mature leaves at veraison § Leaf blades § Fruit at harvest § Canes during dormancy

Form of Nitrogen
Petioles – NO3-N, NH4-N, total N
Leaf Blades – total N
Fruit – total N, arginine
Canes – total N, arginine
Must – ammonia, NOPA (amino acids) and YANC
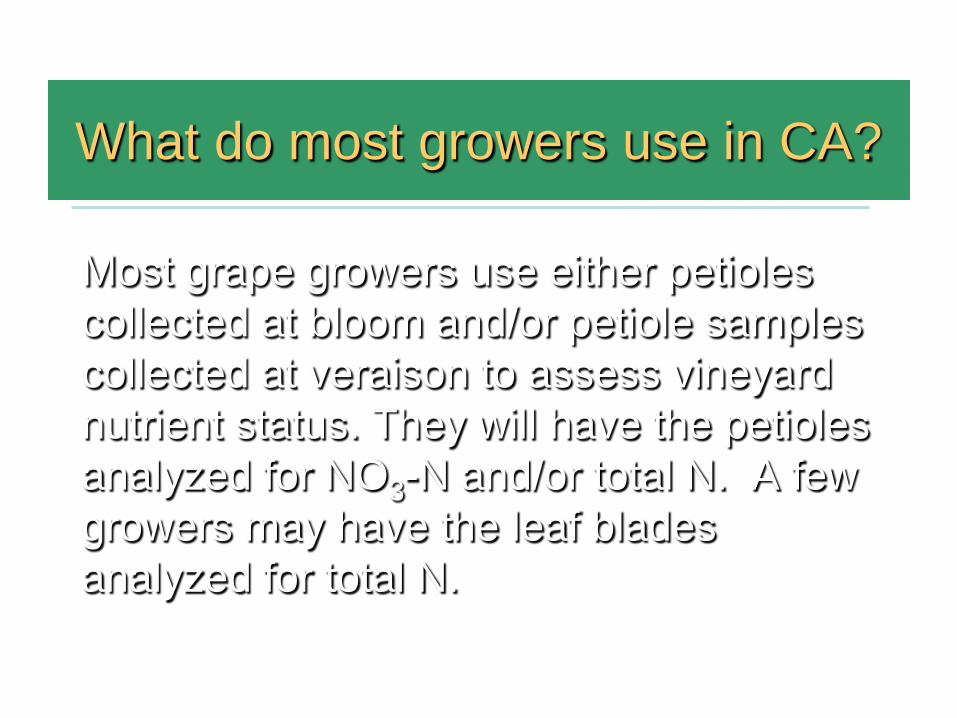
What do most growers use in CA?
Most grape growers use either petioles collected at bloom and/or petiole samples collected at veraison to assess vineyard nutrient status. They will have the petioles analyzed for NO3-N and/or total N. A few growers may have the leaf blades analyzed for total N.
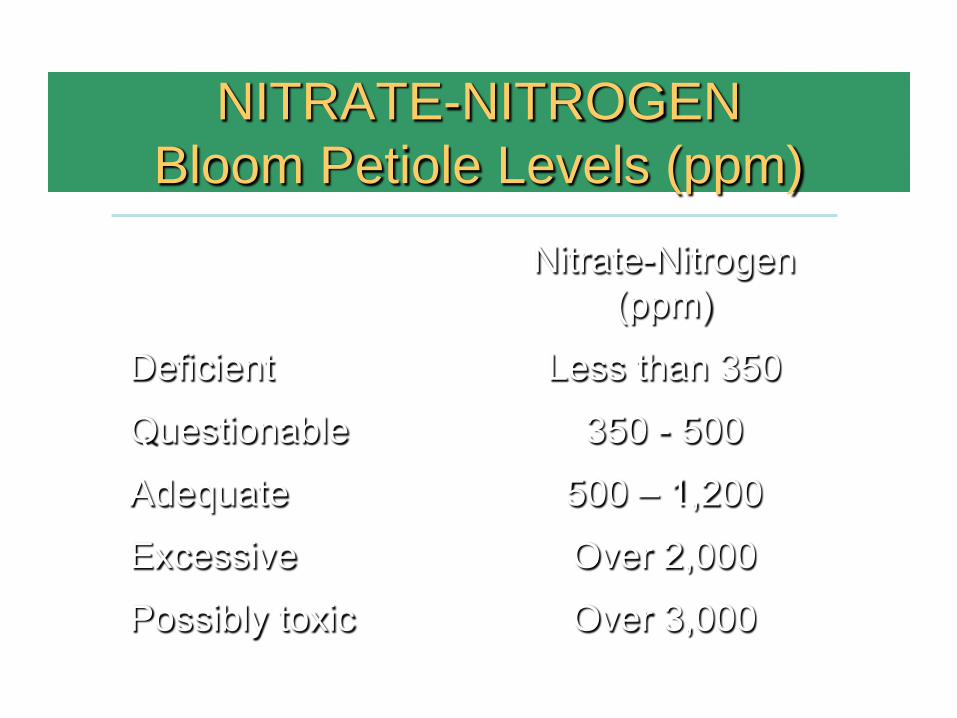
NITRATE-NITROGEN Bloom Petiole Levels (ppm)
Nitrate-Nitrogen (ppm)
Deficient Less than 350
Questionable 350 - 500
Adequate 500 – 1,200
Excessive Over 2,000
Possibly toxic Over 3,000

What factors may influence petiole values when analyzed for N or NO3?
A. Time of day petioles are sampled – I have found that time of day may influence the concentrations of NO3 and K in the petioles. I recommend that petioles should only be collected between 10 a.m. and 2 p.m. to minimize the effects of time of day on measured nutrient values.

What factors may influence petiole values when analyzed for N or NO3?
B. Location of the leaves where petioles are collected – I conducted a study where petioles were collected from leaves opposite a cluster, leaves in full sunlight and leaves growing in the shade. There were some minor differences, depending upon nutrient analyzed, among the leaf types selected. I am of the opinion that the leaf selected makes little difference as long as it is a mature, fully expanded leaf.

What factors may influence petiole values when analyzed for N or NO3?
A. Cultivar B. Rootstock C. Time petioles sampled (during
growing season) D. Irrigation/rainfall prior to sample E. Type of irrigation (flood or drip) F. Environment just prior to or the day of
sample collection G. When last fertilized or fertility of soil in
the vineyard
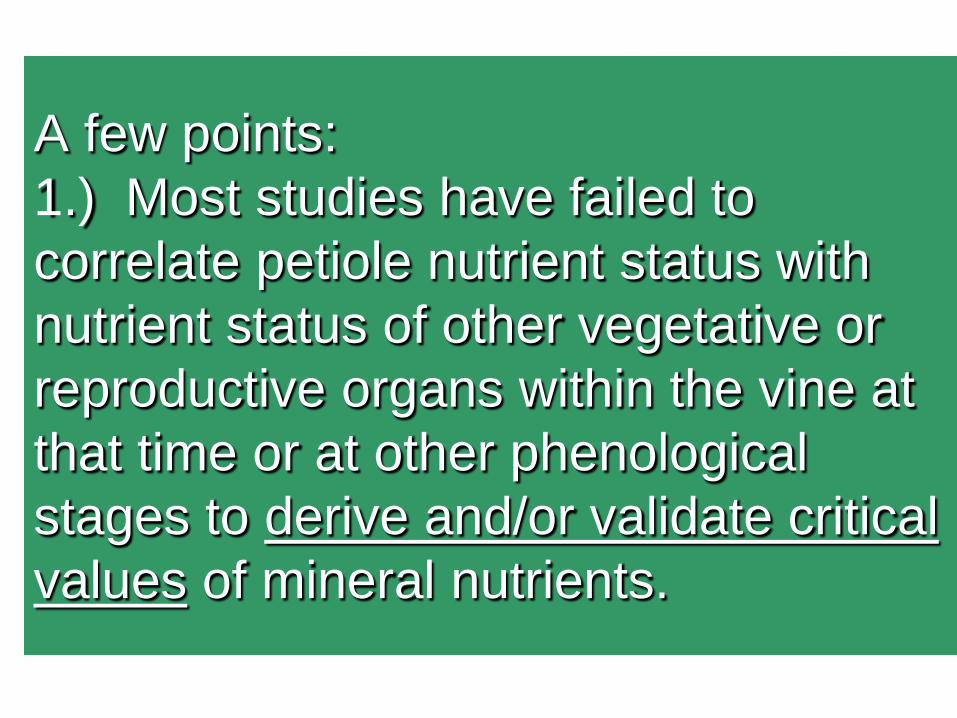
A few points: 1.) Most studies have failed to correlate petiole nutrient status with nutrient status of other vegetative or reproductive organs within the vine at that time or at other phenological stages to derive and/or validate critical values of mineral nutrients.

2.) It has always been assumed that rootstocks differ in their ability to take up mineral nutrients from the soil profile based solely upon petiole nutrient values. 3.) What does variability in petiole N (NO3) values from one year to the next indicate.

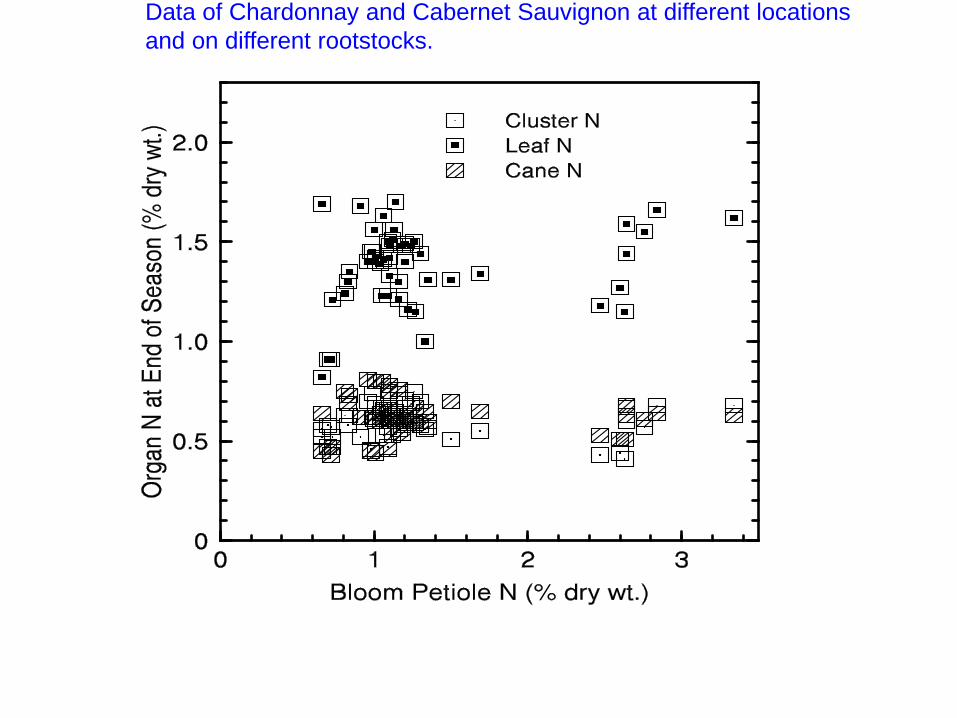
Data of Chardonnay and Cabernet Sauvignon at different locations and on different rootstocks.

Data of Chardonnay and Cabernet Sauvignon at different locations and on different rootstocks.


Data of numerous wine grape cultivars grown at different locations on many different rootstocks.

Data of White Riesling grown in Washington state..

Bloom-time petiole nitrate concentration at four locations and rootstock/scion combinations for three years.
----NO3 (ppm dry wt)---- Location Rootstock 1997 1998 1999 Carneros 5C 911 500 484
110R 718 340 396 Gonzalez 5C 768 486 650
110R 638 481 555 Freedom 587 695 599
Oakville 5C 68 1655 47 110R 56 1338 57
3309C 52 1586 55 P. Robles 5C 6191 1359 2754
110R 4042 964 1358 Freedom 9876 1486 1387
140Ru 7462 1518 1947 1103P 7878 1575 1562
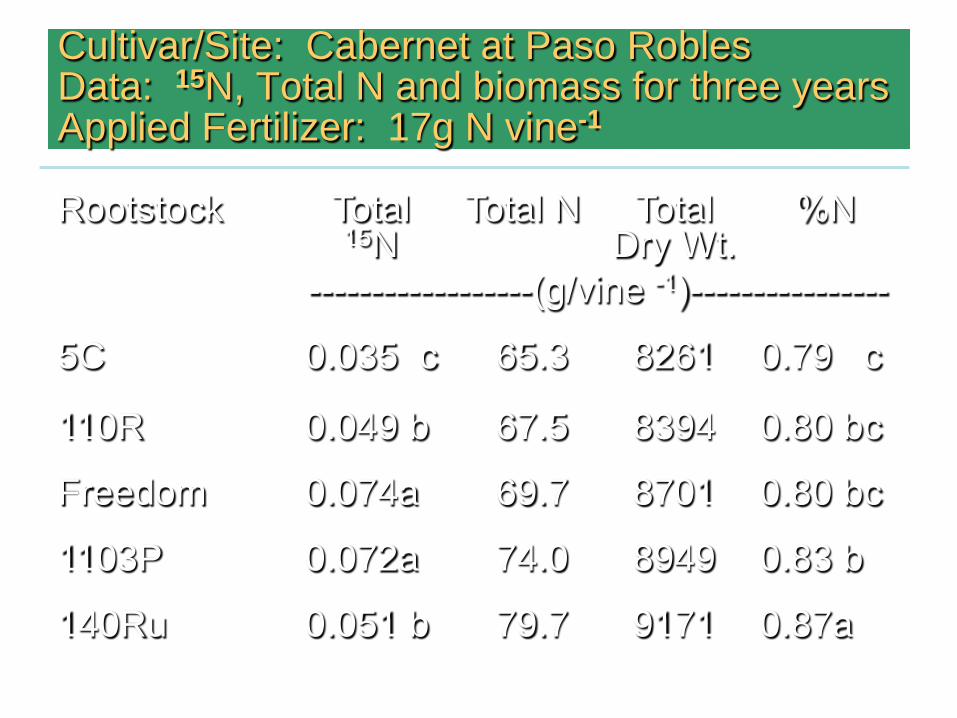
Cultivar/Site: Cabernet at Paso Robles Data: 15N, Total N and biomass for three years Applied Fertilizer: 17g N vine-1
Rootstock Total 15N
Total N Total Dry Wt.
%N
------------------(g/vine -1)----------------
5C 0.035 c 65.3 8261 0.79 c
110R 0.049 b 67.5 8394 0.80 bc
Freedom 0.074a 69.7 8701 0.80 bc
1103P 0.072a 74.0 8949 0.83 b
140Ru 0.051 b 79.7 9171 0.87a

Conclusions: § Bloom petiole analysis of N does not indicate
that one rootstock is more efficient at taking up N than another under the conditions of this study.
§ The relationship between petiole nitrate-nitrogen and N concentration in the leaves, fruit and canes in this study indicates that a bloom-time petiole value of 200 ppm NO3 would be “adequate.” Nitrate values in the petioles at bloom below 100 ppm decreased percent N in those organs only slightly.

Grapevine Fertilization Program
2.) Determination of fertilizer amounts
It will depend upon whether it is a maintenance program or one to correct a deficiency
a.) for a maintenance program one needs to determine how much of the mineral nutrient is removed from the vineyard (i.e. develop a N budget)
b.) determine the efficiency with which fertilizer is taken up.

Mineral Nutrient
Average High Low --------------- (lbs / t) ---------------
N 2.80 3.95 1.73 P 0.54 0.46 0.42 K 4.73 7.08 3.05
Ca 0.96 1.78 0.52 Mg 0.19 0.31 0.09
The average and high and low amounts of several mineral nutrients in one ton of fruit from grapevines.

Grapevine Fertilization Program
3.) Kinds of N fertilizers
“Generally the choice of the formulation of nitrogen can be based mostly upon cost.”
L.P. Christensen, UCCE Specialist
Grapevine Fertilization Program
4.) Timing of fertilization events
One must know when the N is being utilized by the vine to choose the appropriate date to apply the fertilizer.


When do vines require the most N during the growing season?
1.) Approximately two thirds of the current season’s above ground requirement goes to the leaves and stems (main axis of the shoot), the other third goes to the fruit.
2.) Approximately two thirds of the current season’s N requirement is taken up between budbreak and sometime between berry set and veraison.
3.) Some of the nitrogen required by the current season’s above ground growth may be obtained from N in the trunk (or cordons if present) and the root system

L.E. Williams’ recommendation for N fertilization application timing
Split applicationsa
1st application – one month after BB 2nd application – just after berry set. a apply one half the total fertilizer to be used each time.
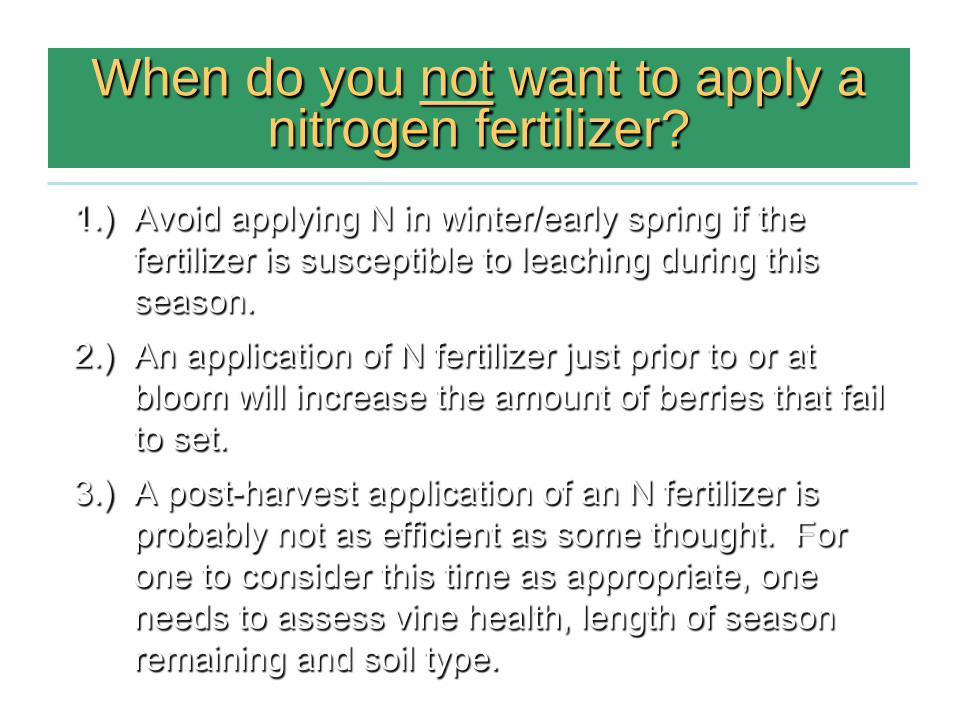
When do you not want to apply a nitrogen fertilizer?
1.) Avoid applying N in winter/early spring if the fertilizer is susceptible to leaching during this season.
2.) An application of N fertilizer just prior to or at bloom will increase the amount of berries that fail to set.
3.) A post-harvest application of an N fertilizer is probably not as efficient as some thought. For one to consider this time as appropriate, one needs to assess vine health, length of season remaining and soil type.

Effect of irrigation type and form of nitrogen of fertilizer use efficiency (FUE).
Treatment FUE 1
Drip NO3 42% Drip NH4
+ 37% Furrow (NO3) 14% Furrow (NH4
+) 10% Drip (cont) 38% 1 FUE = Total Fert. N on Vine/Total Fert. N Applied.

Distribution of fertilizer N in individual vine organs
--------------Vine organs--------------
Treat-ment
Year Harvested
Clusters
Leaves
Stems2
Trunk
Roots
Total
-------------(g N vine-1 )--------------- Drip (cont) 1989 3.23 1.81 0.86 1.14 2.47 9.51
Drip (cont) 1990 1.78 1.40 0.78 0.58 2.32 6.86
1 Vines fertilized with 15 N every two weeks during 1989 growing season for a total of 27.6 g N vine-1. 2 Stems include main axis of shoot and fruiting canes.

Inefficient use of nitrogen:
1.) Contributes to greater use of energy reserves 2.) Increased production cost 3.) Possible environmental pollution of nitrates in water

Grapevine Fertilization Program
5.) Effects of N on vegetative and reproductive growth
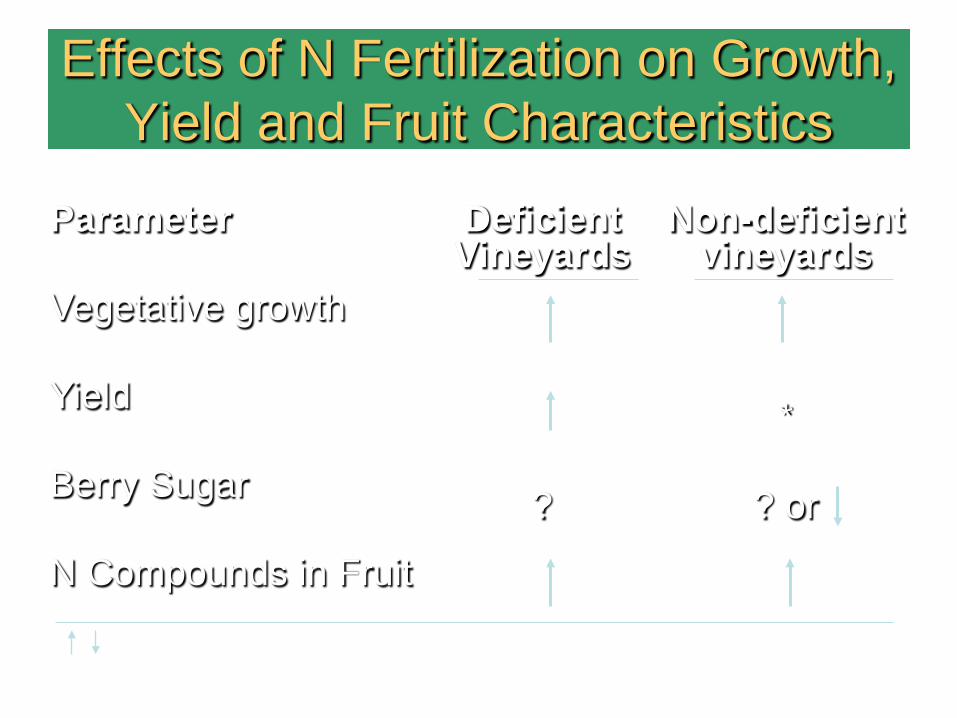
Effects of N Fertilization on Growth, Yield and Fruit Characteristics
Parameter Deficient Vineyards
Non-deficient vineyards
Vegetative growth
Yield *
Berry Sugar ? ? or
N Compounds in Fruit
- increase and decrease respectively; * - no effect; ? :- may or may not have effect

San Joaquin Valley N and K Fertilizer Study: Objectives
• Determine the correlations among the various means to assess vine N nutrient status with nitrogenous compounds found the the fruit at harvest of Merlot and Thompson Seedless grapevines grown in the San Joaquin Valley.
• The nitrogenous compounds measured in the fruit are those used by yeast during fermentation. They include ammonia and α-amino acids.
• Determine the effects of K fertilizer on juice characteristics and correlations with vine K nutrient status.

Critical values of YANC in grapes for wine production
Various studies have attempted to estimate the minimum concentration of juice N needed to achieve a satisfactory completion of fermentation as judged by low residual sugar, i.e. minimum concentration of N in juice at which the risk of slow or stuck fermentation is low. Estimates range from 70 – 267 mg/L YANC, with a value of ~ 140 mg N/L for clarified musts of moderate sugar concentration being considered a practical minimal limit.

N Soluble Solids
TA NH4+ NOPA YANC
Treatment (oBrix) pH (g L-1) ---------------- (mg L-1) ------------- 2004
N 0 25.5 3.66 5.35 a 50 c 98 b 144 b N 75 BS 26.0 3.67 5.32 a 67 b 123 a 181 ab N 150 BS 25.5 3.63 5.45 a 79 a 115 a 184 a N 75 V 25.3 3.71 4.65 b 63 b 118 a 188 a
2005 N 0 22.4 3.46 3.47 62 b 143 b 205 b N 75 BS 22.3 3.44 4.04 81 a 140 b 220 ab N 150 BS 21.9 3.45 3.85 82 a 156 a 238 a N 75 V 21.7 3.42 4.06 86 a 149 ab 235 a
Effects of applied N fertilizer at berry set (BS) or veraison (V) in 2004 on must characteristics of Merlot grapevines grown in Madera County.

N/K ----- Merlot Must ----- ---- Merlot Wine ---- Treatment NH4
+ NOPA YANC NH4+ NOPA YANC
2004 ---------------------------------- (mg L-1) ------------------------------- N 0 50 98 144 5.9 34 40 N 75 BS 67 123 181 4.5 40 44 N 150 BS 79 115 184 6.7 39 46 N 75 V 63 118 188 9.4 40 49
2004 K 0 59 108 166 7.1 36 43 K 75 BS 62 106 178 9.8 39 49 K 150 BS 57 87 141 6.8 35 42 K 75 V 53 92 149 6.4 34 40
Effects of applied N/K fertilizer at berry set (BS) or veraison (V) in 2004 on must/wine nitrogenous compounds of Merlot.
Grapevine K Fertilization Program
1.) Assessing vineyard/vine nutrient status 2.) Determination of fertilizer amounts 3.) Kinds of fertilizers 4.) Timing of fertilization events 5.) Effects of mineral nutrients on vegetative and reproductive growth.
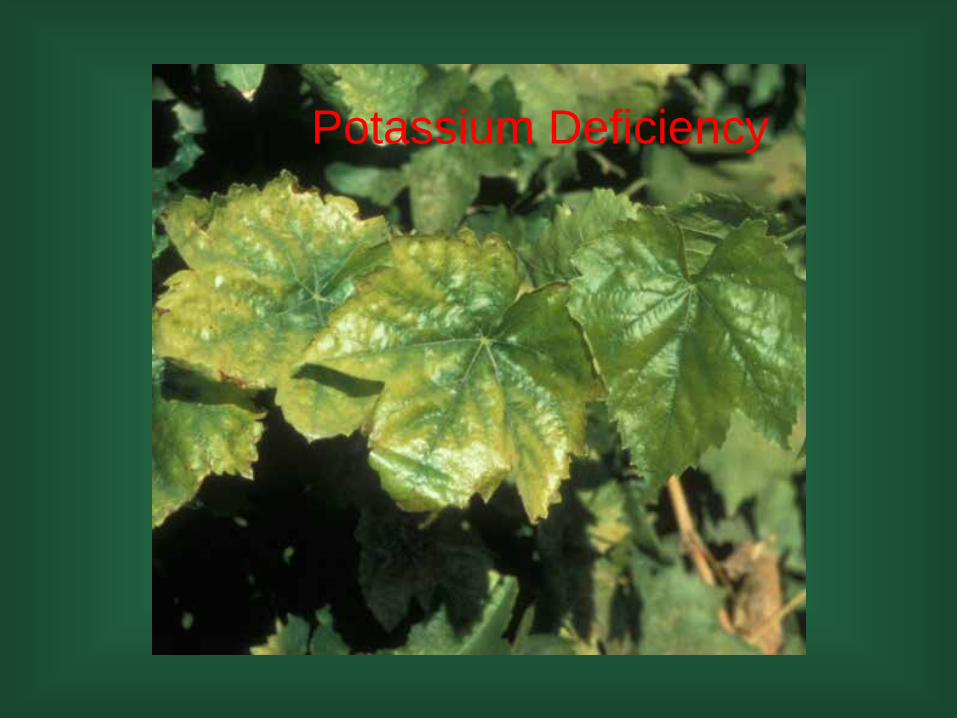
Potassium Deficiency
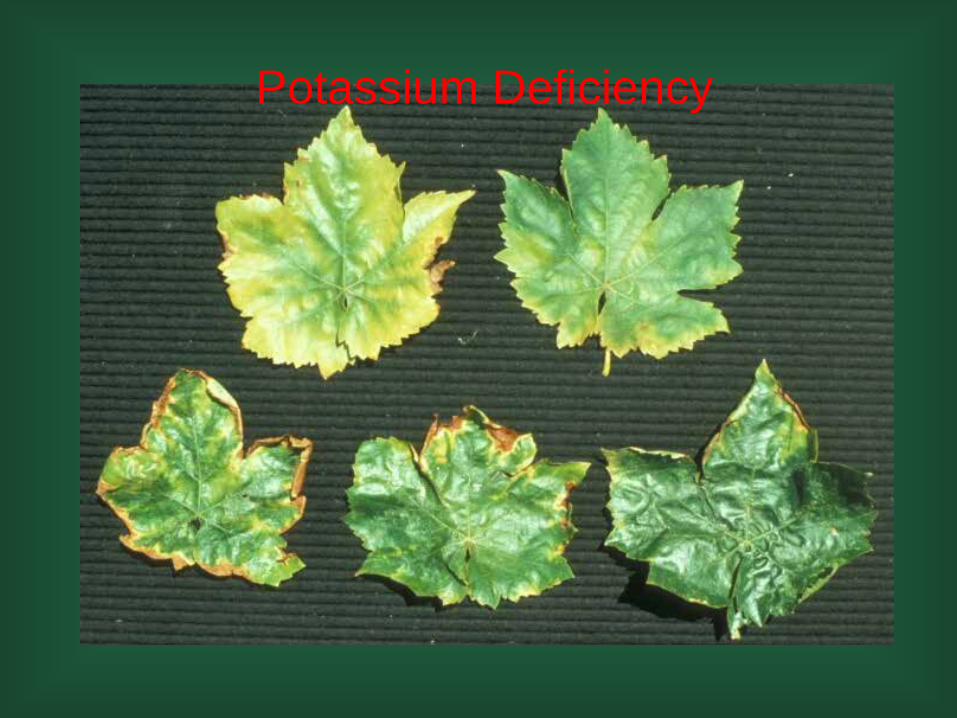
Potassium Deficiency
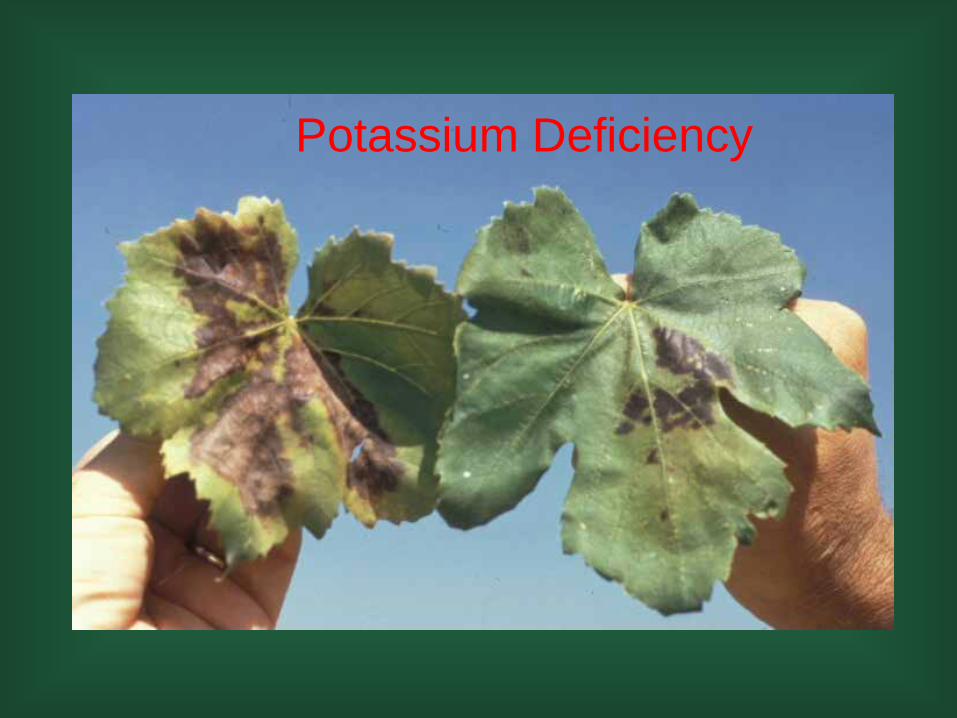
Potassium Deficiency

POTASSIUM
Potassium (%) Bloom Petiole Levels Deficient Less than 1.0 Questionable 1.0 to 1.5 Adequate Over 1.5 Midsummer Petiole Levels Deficient Below 0.5 Adequate Above 0.8


K Soluble Solids
TA NH4+ NOPA YANC
Treatment (oBrix) pH (g L-1) ---------------- (mg L-1) ------------- 2004
K 0 25.1 3.64 4.70 59 ab 108 a 166 K 75 BS 25.6 3.64 4.72 62 a 106 a 178 K 150 BS 25.3 3.68 4.87 57 ab 87 b 141 K 75 V 25.5 3.69 4.65 53 b 92 ab 149
2005 K 0 22.0 3.46 3.68 103 158 b 261 K 75 BS 22.1 3.44 3.74 108 157 b 264 K 150 BS 22.0 3.45 3.67 139 159 b 299 K 75 V 22.3 3.42 3.50 116 178 a 293
Effects of applied K fertilizer at berry set (BS) or veraison (V) in 2004 on must characteristics of Merlot grapevines grown in Madera County.

N/K Ethanol TA NH4+ NOPA YANC
Treatment (% v/v) pH (g L-1) ---------------- (mg L-1) ------------- 2004
N 0 14.1 3.98 b 5.63 a 5.9 b 34 b 40 N 75 BS 14.3 4.04 b 5.33 ab 4.5 b 40 a 44 N 150 BS 14.0 4.04 b 5.10 b 6.7 ab 39 a 46 N 75 V 13.9 4.11 a 4.93 b 9.4 a 40 a 49
2004 K 0 14.4 a 4.02 5.60 7.1 36 43 K 75 BS 14.0 ab 3.98 5.74 9.8 39 49 K 150 BS 14.3 ab 3.99 5.78 6.8 35 42 K 75 V 13.7 b 4.00 5.46 6.4 34 40
Effects of applied N/K fertilizer at berry set (BS) or veraison (V) in 2004 on wine characteristics of Merlot grapevines grown in Madera County.
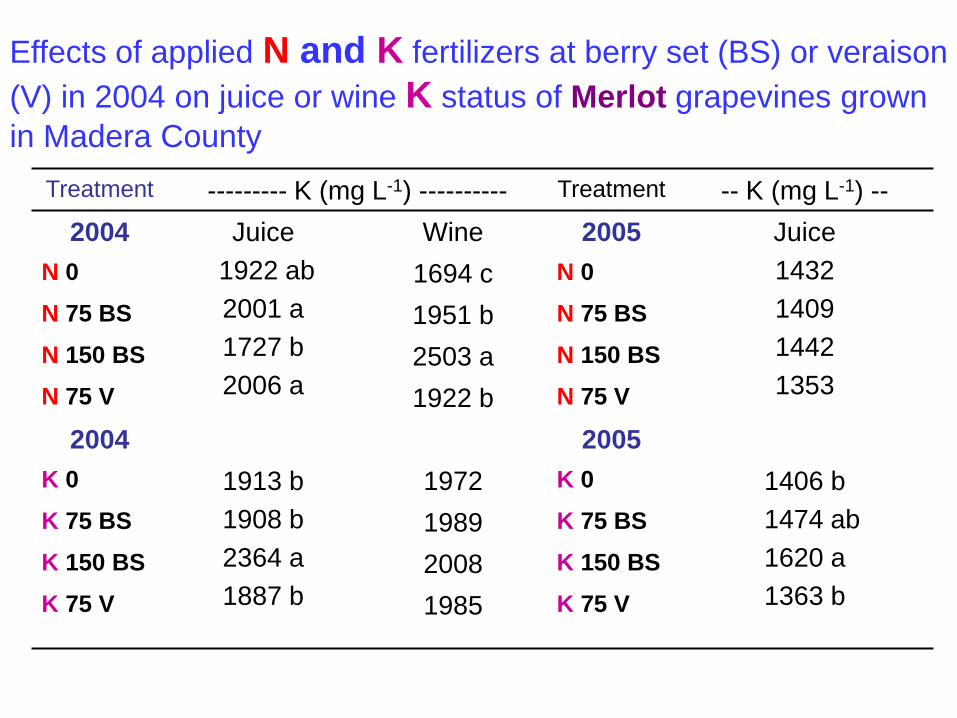
Treatment --------- K (mg L-1) ---------- Treatment -- K (mg L-1) -- 2004 Juice
1922 ab 2001 a 1727 b 2006 a
Wine 2005 Juice 1432 1409 1442 1353
N 0 1694 c N 0 N 75 BS 1951 b N 75 BS N 150 BS 2503 a N 150 BS N 75 V 1922 b N 75 V
2004 2005 K 0 1913 b
1908 b 2364 a 1887 b
1972 K 0 1406 b 1474 ab 1620 a 1363 b
K 75 BS 1989 K 75 BS K 150 BS 2008 K 150 BS K 75 V 1985 K 75 V
Effects of applied N and K fertilizers at berry set (BS) or veraison (V) in 2004 on juice or wine K status of Merlot grapevines grown in Madera County

Do potassium foliar/cluster sprays late in the growing
season hasten the ripening of berries?
Influence of cluster directed applications of calcium salts and other compounds before harvest on postharvest quality
and decay of table grapes. Dr. Joseph L. Smilanick
USDA-ARS San Joaquin Valley Agrcult. Sci. Center
Parlier, CA

Influence of potassium cluster directed sprays applied at the onset of veraision and later on enhancing sugar accumulation • Spray solution contained 1.3 g of K
metalosate per liter of water and sprayed to runoff. Also used 0.35 ml of B1956 surfactant per liter of water.
• Also used K sorbate and K bicarbonate in some trials.
• Small hand-held sprayer used with solution directed on clusters only.

Results: • The application of those compounds
enhanced the accumulation of sugar in the fruit of six different cultuvars (across 3 years).
• Change from control to experimental product ranged from +1.0 to +4.8 Brix.
• Most products increased color of the fruit. • In one trial sugar and color of the control
caught up with the experimental treatment when sugar reached 20 Brix.

Appearance of ‘Sweet Scarlet’ table grapes at harvest on Aug 5, 2009, after four applications of potassium metalosate. Soluble solids untreated were 16.0% and those potassium-treated were 19.5%.
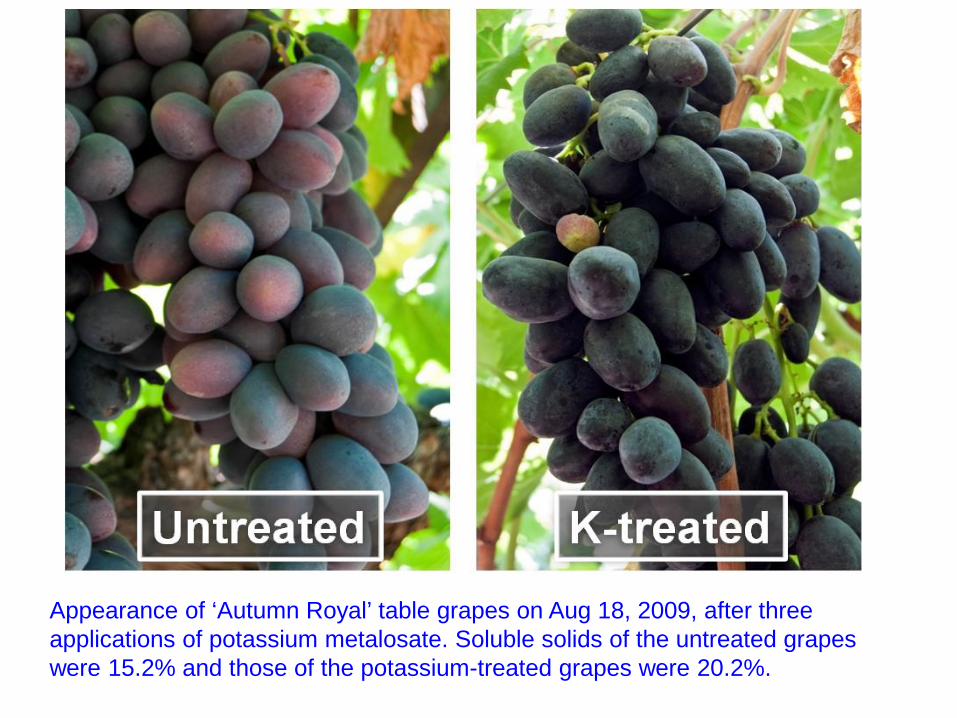
Appearance of ‘Autumn Royal’ table grapes on Aug 18, 2009, after three applications of potassium metalosate. Soluble solids of the untreated grapes were 15.2% and those of the potassium-treated grapes were 20.2%.
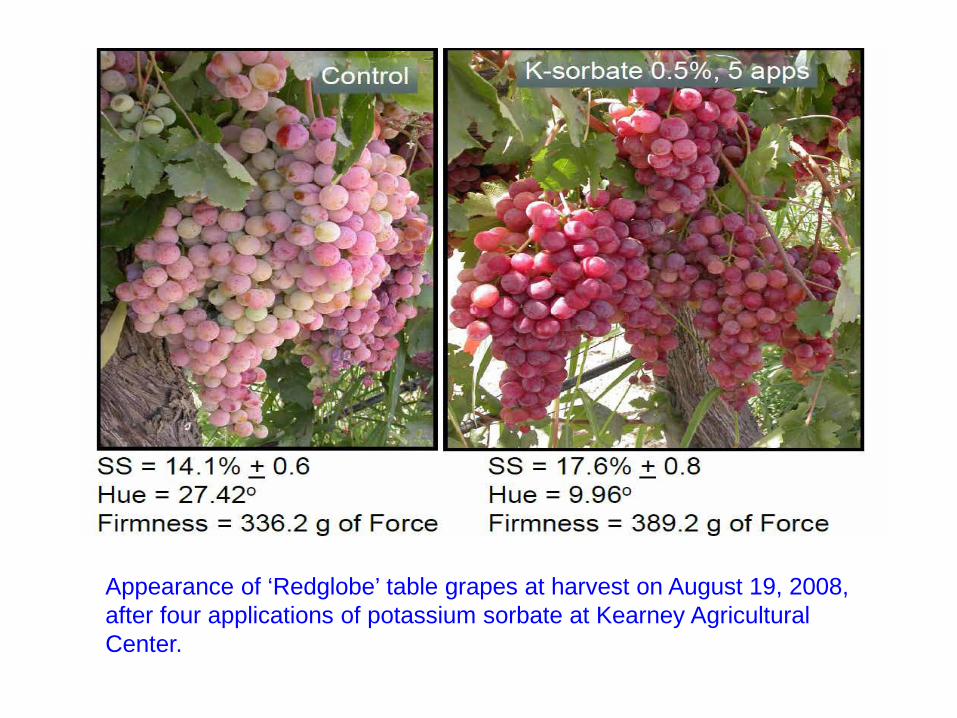
Appearance of ‘Redglobe’ table grapes at harvest on August 19, 2008, after four applications of potassium sorbate at Kearney Agricultural Center.

Soluble solids content of ‘Redglobe’ table grapes after the onset of veraison. Potassium sorbate (‘K-sorbate; 0.5% wt/vol) was sprayed into clusters on June 2, June 23, July 28, and August 19, 2009.
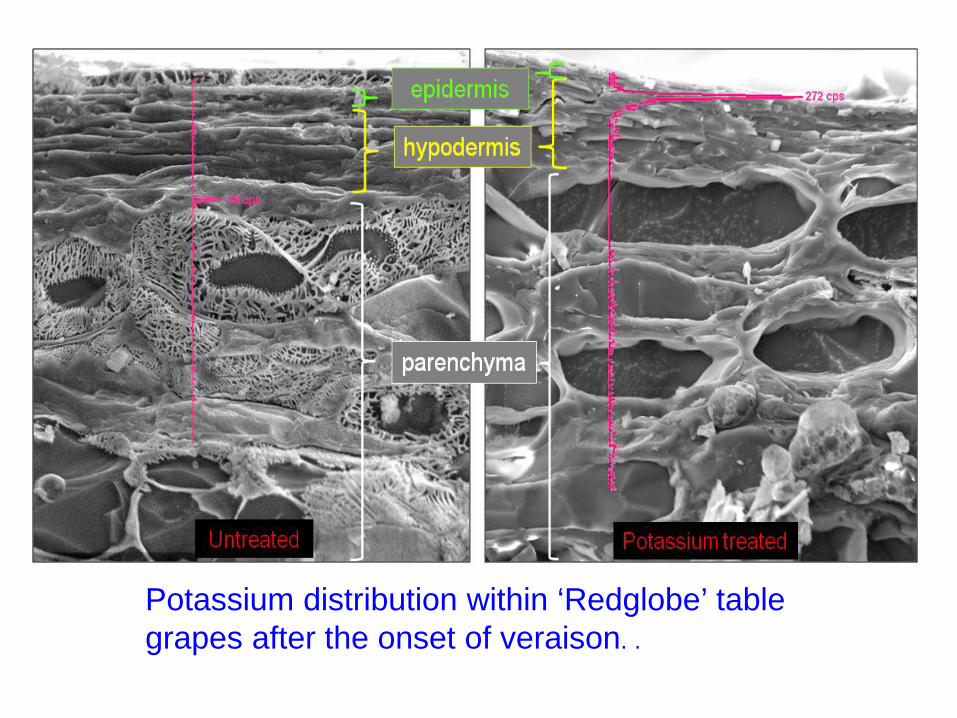
Potassium distribution within ‘Redglobe’ table grapes after the onset of veraison. .
Advancing maturity of raisin grapes (Thompson Seedless, Fiesta and Selma Pete) with
foliar potassium applied during fruit ripening.
Williams L. Peacock UC Cooperative Extension
Viticulture Farm Advisor, emeritus Tulare County, Visalia, CA

Bill Peacock’s trials
• Will foliar K applied during ripening advance fruit maturity?
• When should foliar K be applied to maximize repsonse.
• How much foliar K is needed? • Which material works best? • Can it be applied with both concentrate
and dilute sprays?

Results: • K was shown to advance maturity by 1 to 2 Brix
over the control. • Foliar K should be applied late during ripening
(from 14 to 18 Brix). • K sprays should be applied at 1 to 1.5 lbs per
acre. Applying less than 1 lb did not work, more than 1.5 lbs had no further effect.
• There were no differences in maturity between K metalosate, sorbate, phosphate or phosphite.
• Both concentrate and dilute spay rigs worked but it is important that clusters contact the material.
Possible effects on wine grapes: • It should be pointed out that maturity
standards are certainly different for table grapes (raisins?) as opposed to wine grapes.
• As far as I know, no such work has been done on wine grapes.
• Foliar K applications would be risky on wine grapes as the added K may increase insoluble K tartrate crystals in the juice which may cloud wine, reduce wine acid content and raise pH.

JUICE POTASSIUM (mg/L)
1000 1200 1400 1600 1800 2000 2200 2400 2600 2800
JUIC
E pH
3.38
3.40
3.42
3.44
3.46
3.48
3.50
3.52
3.54
3.56
3.58
005.042.0
5^6.336.32
<=
-+=
pr
xy
The relationship between juice potassium and juice pH
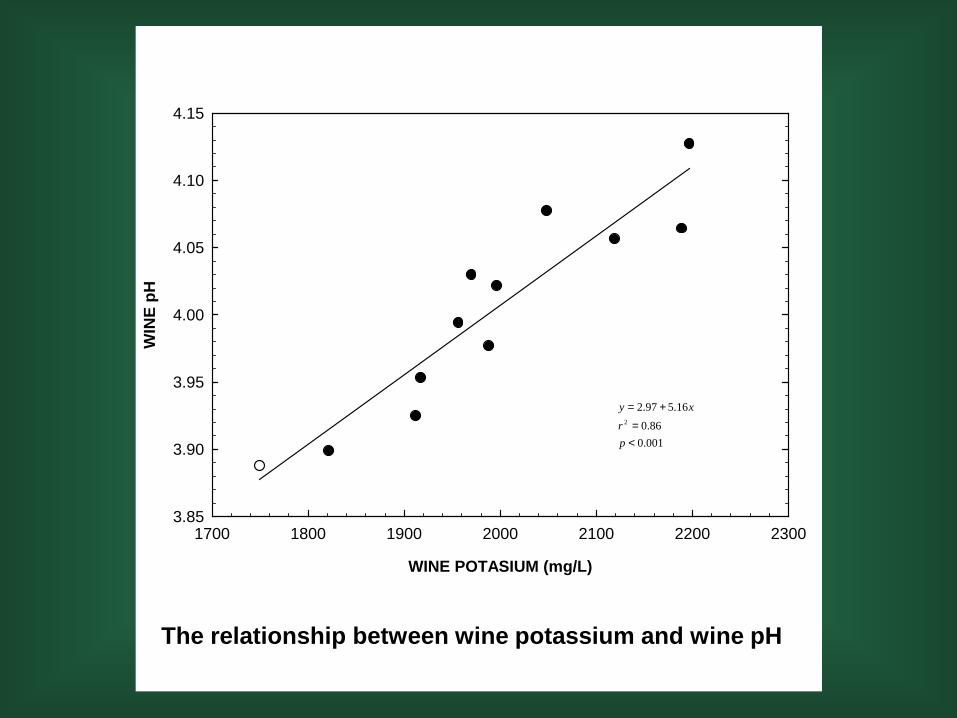
WINE POTASIUM (mg/L)
1700 1800 1900 2000 2100 2200 2300
WIN
E pH
3.85
3.90
3.95
4.00
4.05
4.10
4.15
001.086.0
16.597.22
<=
+=
pr
xy
The relationship between wine potassium and wine pH

Deficiencies in California Common Less Common Not Observed Nitrogen Iron Copper Potassium Magnesium Molybdenum Zinc Manganese Chlorine Boron Phosphorus Calcium
Sulfur
Excesses in California Nitrogen Chloride Boron

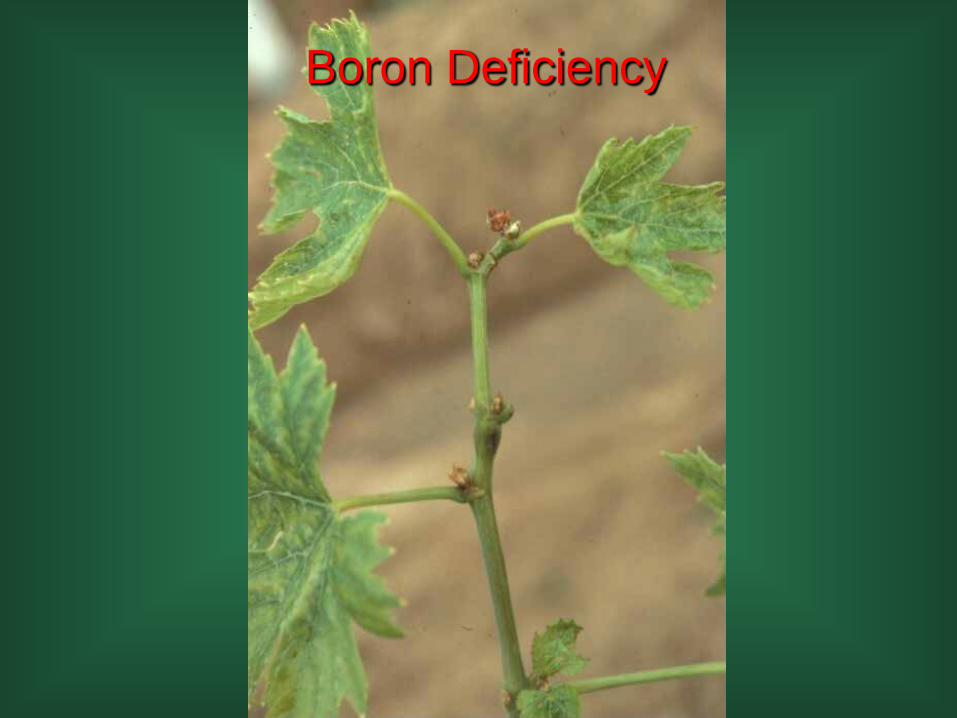
Boron Deficiency

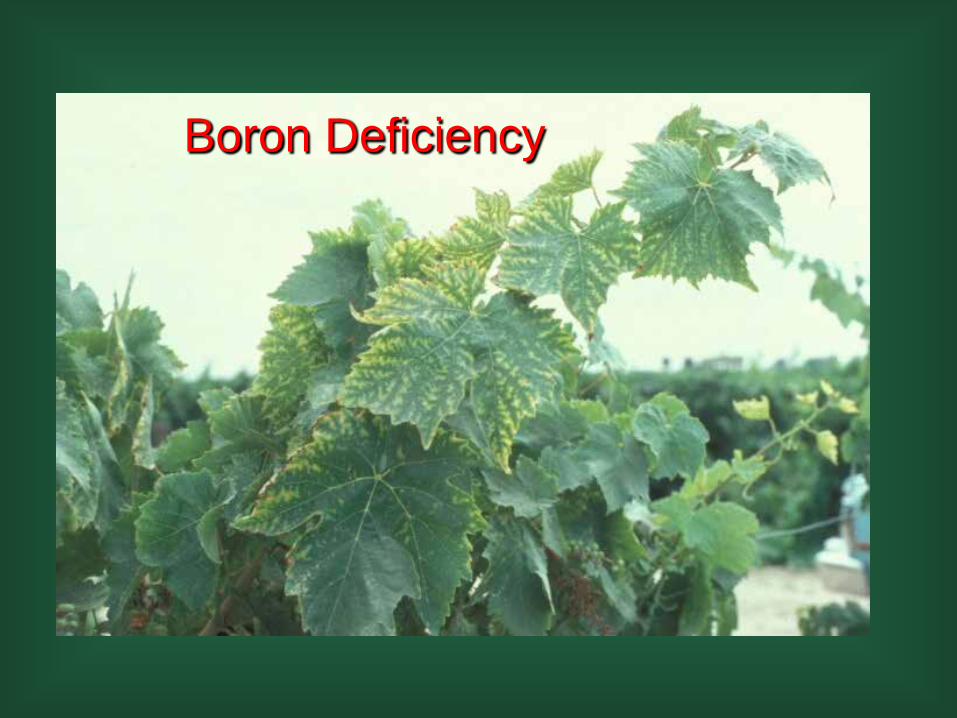
Boron Deficiency

Boron Deficiency
Boron Deficiency

Boron Deficiency

● Esca, Black Measles
External symptoms Shoot tips and tendrils dieback
Boron Deficiency
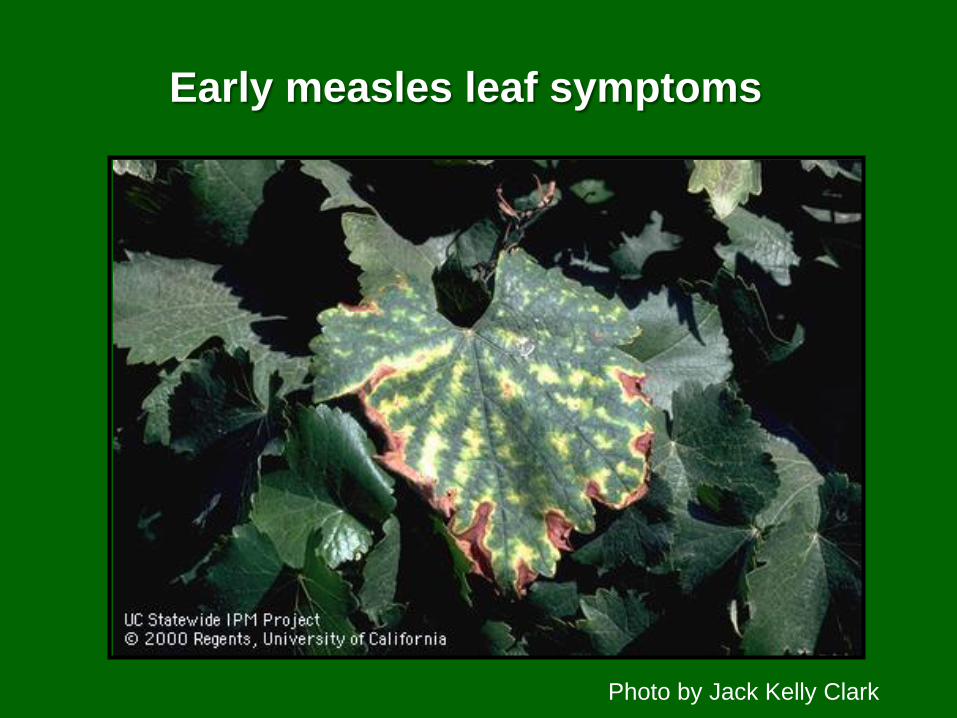
Early measles leaf symptoms
Photo by Jack Kelly Clark

Boron Deficiency

● Esca, Black Measles Leaf symptoms
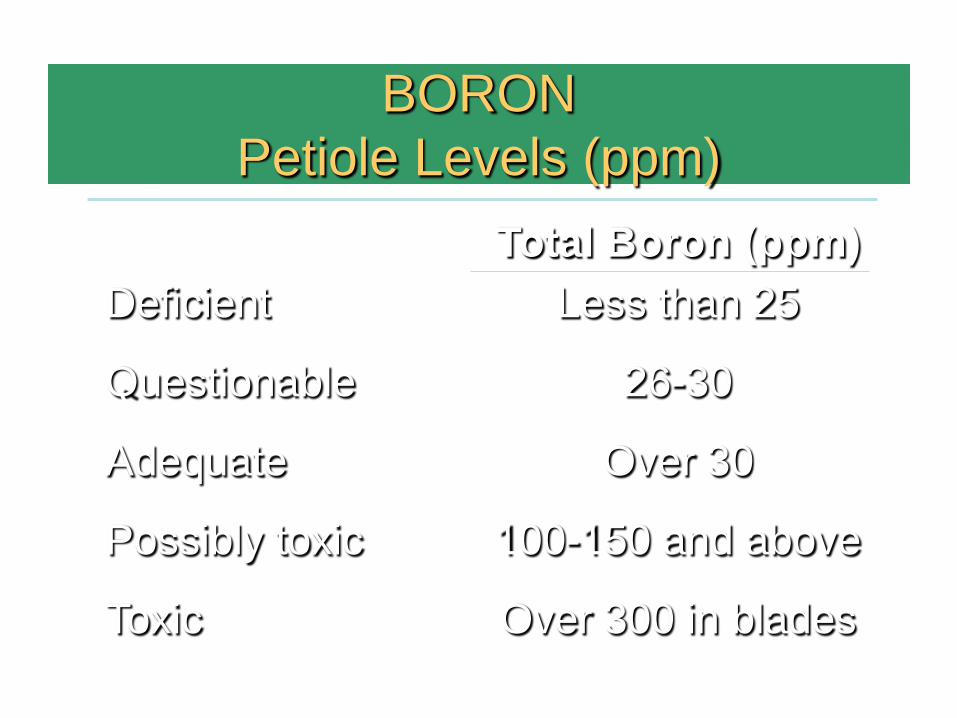
BORON Petiole Levels (ppm)
Total Boron (ppm) Deficient Less than 25
Questionable 26-30
Adequate Over 30
Possibly toxic 100-150 and above
Toxic Over 300 in blades

BORON FOLIAR SPRAY
2 – 3 lbs/acre (2.2 – 3.4 kg/ha) of
20% B spray product

Phosphorus Deficiency
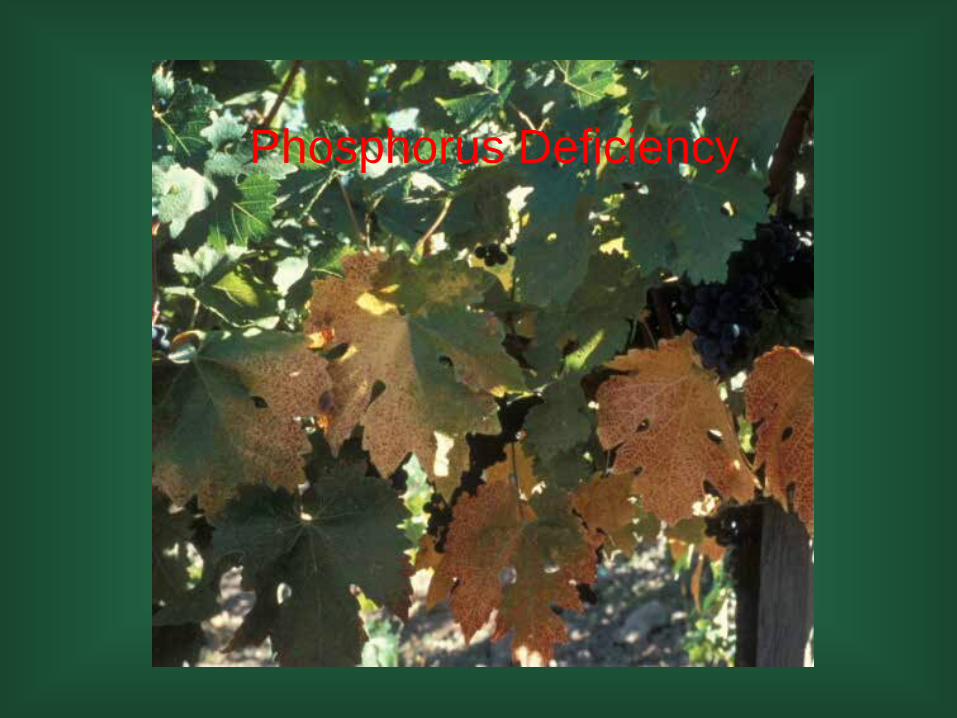
Phosphorus Deficiency
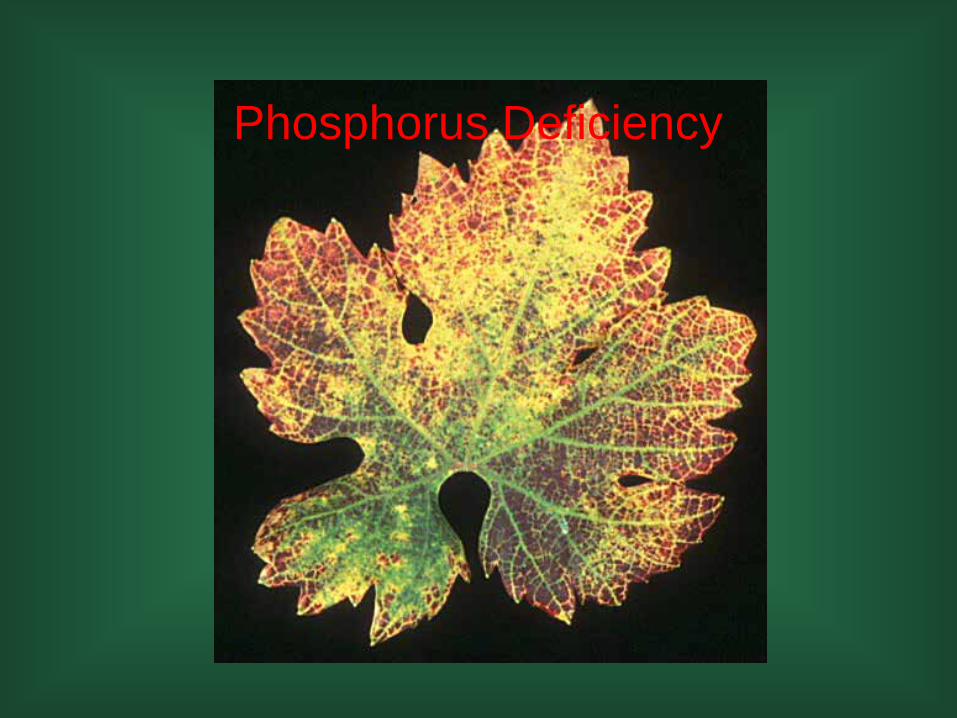
Phosphorus Deficiency

Phosphorus Deficiency

PHOSPHORUS Petiole Levels (%)
Total P (%) Bloom Petiole Levels Possibly deficient <0.10 Questionable 0.10 – 0.15 Adequate >0.15 Midsummer Petiole Levels Possibly deficient <0.08 Adequate >0.12