tm - testforce | test and measurement equipment … files/aim/pba-pro-afdx.pdfthe afdx/ arinc664...
TRANSCRIPT
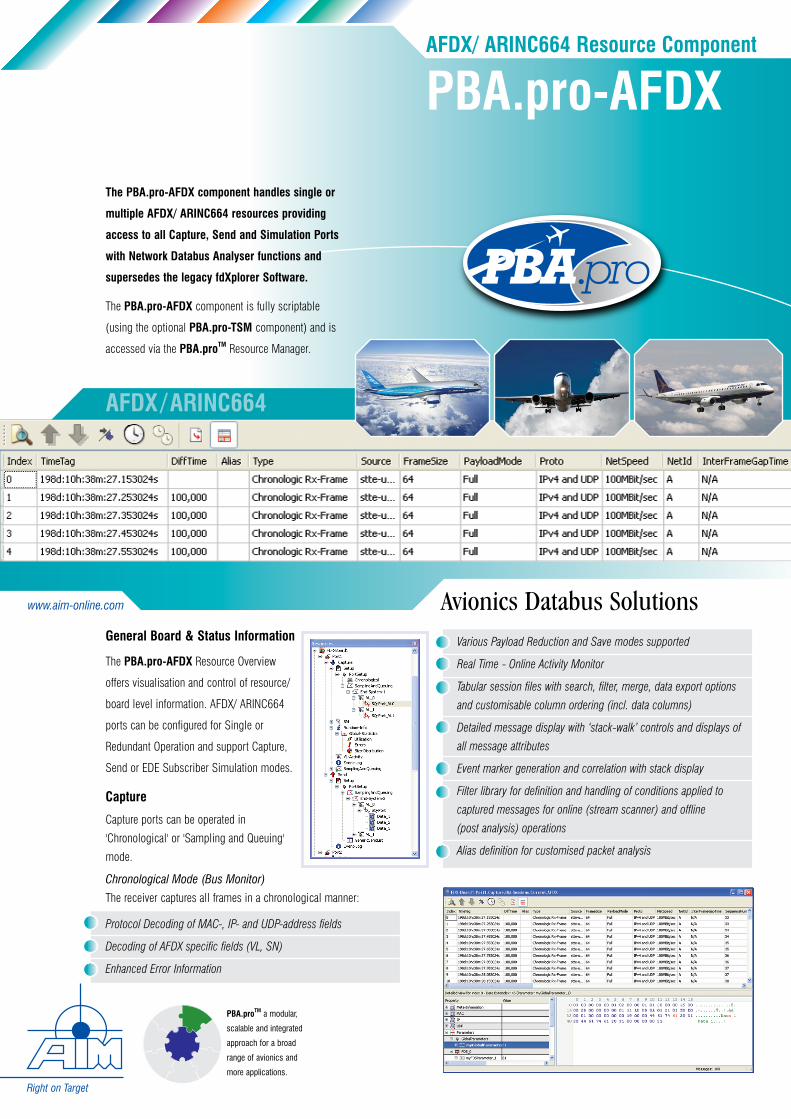
AFDX/ARINC664
Avionics Databus Solutions
Capture
Capture ports can be operated in
'Chronological' or 'Sampling and Queuing'
mode.
Right on Target
PBA.pro-AFDXAFDX/ ARINC664 Resource Component
DatabaseManager
Components
Test & ScriptManager
AIM ResourceComponents
CustomerComponents
3rd Party Resource
Components
RemoteControl
Components
Utility Resource
Components
Core Functionality
Framework & Designer
Components
AIM ResourceComponents
Core Functionality
Framework & Designer
Components
PBA.proTM a modular,
scalable and integrated
approach for a broad
range of avionics and
more applications.
The PBA.pro-AFDX component handles single or
multiple AFDX/ ARINC664 resources providing
access to all Capture, Send and Simulation Ports
with Network Databus Analyser functions and
supersedes the legacy fdXplorer Software.
The PBA.pro-AFDX component is fully scriptable
(using the optional PBA.pro-TSM component) and is
accessed via the PBA.proTM Resource Manager.
General Board & Status Information
The PBA.pro-AFDX Resource Overview
offers visualisation and control of resource/
board level information. AFDX/ ARINC664
ports can be configured for Single or
Redundant Operation and support Capture,
Send or EDE Subscriber Simulation modes.
www.aim-online.com
Chronological Mode (Bus Monitor)
The receiver captures all frames in a chronological manner:
Protocol Decoding of MAC-, IP- and UDP-address fields
Decoding of AFDX specific fields (VL, SN)
Enhanced Error Information
Various Payload Reduction and Save modes supported
Real Time - Online Activity Monitor
Tabular session files with search, filter, merge, data export options
and customisable column ordering (incl. data columns)
Detailed message display with ‘stack-walk’ controls and displays of
all message attributes
Event marker generation and correlation with stack display
Filter library for definition and handling of conditions applied to
captured messages for online (stream scanner) and offline
(post analysis) operations
Alias definition for customised packet analysis

© A
IM G
mbH
PBA
-pro
-AFD
X_14
Sep2
012
• S
peci
ficat
ions
are
subj
ect t
o ch
ange
with
out n
otic
e.
AIM Office Contacts:
AIM GmbH Sasbacher Str.279111 FreiburgGermany
Tel: +49 761 45 22 90 Fax: +49 761 45 22 93 3 email: [email protected]
AIM UK Cressex Enterprise CentreLincoln Road, High WycombeBucks, HP12 3RB UK
Tel: +44 1494 446844 Fax: +44 1494 449324 email: [email protected]
Runtime Info
The Runtime Info node provides global statistics, VL-Activity and
Event-Log information.
Send
Send ports can be operated in 'Sampling and Queuing', 'Generic
Send List' or 'Replay' mode.
Support of multiple End-Systems
Virtual Link (VL) definition
Integrity Checking, Redundancy Management and Traffic Policing
configurable per VL
Sampling/ Queuing port definition with configurable message history
Import of fdXplorer Capture setups supported
Sampling and Queuing Mode
The Send ports operate in a transmitting End-System simulation mode:
Support of multiple End-Systems
Virtual Link (VL) definition
Sampling/ Queuing port definition with message generation
and Traffic Shaping
Message Scenarios
Enable/ Disable VL’s or Sampling/ Queuing ports on the fly
Error Injection features
Import of fdXplorer
Send setups supported
Display parameters on resource node
Parameter information added to individual messages in the
chronological bus monitor
Use parameters to setup messages of a Sampling/ Queuing port or
packets of the Generic Send List
Assign displays to show dedicated properties of an object or
parameters with options to check and control parameter values
Export of parameters for off-line analysis via PBA.proTM (tabular and
graphically) or third party tools
Import of ParaView databases (.pdi format) supported
Sampling and Queuing Mode
The receiver operates in a receiving End-System simulation mode:
Generic Send List Mode
Traffic is generated using a list of data packets:
Programmable timing and sequencing of packets
Programmable Wire Speed Scenarios
Error Injection features like CRC, MAC, Alignment etc.
Payload Generation and Timetag insertion supported for Latency
Measurements
Automatic or User Defined control of Sequence Numbering
Support for synchronisation between multiple ports by means of strobe
inputs, outputs and IRIG-B time
Definable Skew of redundant frames
Import of fdXplorer Send setups supported
Replay
The Replay node supports replay
of previously recorded AFDX/
ARINC664 files physically to the
bus. Multiple AFDX/ ARINC664
ports can be selected for synchronous replay.
Simulation
Simulation operation for so called EDE Subscribers is available for
AFDX/ ARINC664 interfaces which include the Boeing specific EDE
(Error Detection Encoding) extensions. Detailed documentation is
available upon request.
Database Manager (using optional PBA.pro-AFDX/ ARINC664-DBM component)
The AFDX/ ARINC664 Database Manager component provides
Engineering Unit Conversion and several extensions:
Ordering Information
PBA.pro-AFDX-2 AFDX/ ARINC664 Resource Component for 2 Ports Based on API-FDX-2/ AMC-FDX-2/ APM-FDX-2/ APX-GNET Hardware
PBA.pro-AFDX-X2 AFDX/ ARINC664 Resource Component for additional 2 Ports; Based on API-FDX-2/ AMC-FDX-2/ APM-FDX-2/ APX-GNET Hardware
PBA.pro-AFDX-M4 AFDX/ ARINC664 Resource Component for 4 Receiver Ports (Monitoring Only) (for operation with fdXTap only)
PBA.pro-AFDX-DBM AFDX/ ARINC664 Database Manager Component, required for Engineering Unit Conversion
PBA.pro-LIGHT-AFDX Reduced function option to support simple application needs, based on PBA.pro-FD and PBA.pro-AFDX-2