tivoli manager for sybase** reference...
TRANSCRIPT
Tivoli Manager for Sybase** Reference Guide
Version 1.1


re. r
ay ter al, or
ur own rights t
, ase,
of
QL
gh
that se
other ad of
ction bility
this n send ue,
Tivoli Manager for Sybase** Reference Guide (March 1999)Copyright NoticeCopyright © 1999 by Tivoli Systems, an IBM Company, including this documentation and all softwaAll rights reserved. May only be used pursuant to a Tivoli Systems Software License Agreement oAddendum for Tivoli Products to IBM Customer or License Agreement. No part of this publication mbe reproduced, transmitted, transcribed, stored in a retrieval system, or translated into any compulanguage, in any form or by any means, electronic, mechanical, magnetic, optical, chemical, manuotherwise, without prior written permission of Tivoli Systems. Tivoli Systems grants you limited permission to make hardcopy or other reproductions of any machine-readable documentation for youse, provided that each such reproduction shall carry the Tivoli Systems copyright notice. No otherunder copyright are granted without prior written permission of Tivoli Systems. The document is nointended for production and is furnished “as is” without warranty of any kind. All warranties on this document are hereby disclaimed including the warranties of merchantability and fitness for a particular purpose.
Note to U.S. Government Users—Documentation related to restricted rights—Use, duplication or disclosure is subject to restrictions set forth in GSA ADP Schedule Contract with IBM Corporation.
TrademarksThe following product names are trademarks of Tivoli Systems or IBM Corporation: AIX, IBM, OS/2RS/6000, Tivoli Enterprise Console (TEC) Tivoli Management Environment, Tivoli Manager for SybTME 10, TME 10 Distributed Monitoring, and TME 10 Framework.
Microsoft, Windows, Windows NT, and the Windows logo are trademarks or registered trademarksMicrosoft Corporation.
Sybase, the Sybase logo, Adaptive Server, Adaptive Server Enterprise, Adaptive Server Monitor, SServer, and Transact-SQL are trademarks of Sybase, Inc.
UNIX is a registered trademark in the United States and other countries licensed exclusively throuX/Open Company Limited.
Other company, product, and service names mentioned in this document may be trademarks or servicemarks of others.
Notice
References in this publication to Tivoli Systems or IBM products, programs, or services do not implythey will be available in all countries in which Tivoli Systems or IBM operates. Any reference to theproducts, programs, or services is not intended to imply that only Tivoli Systems or IBM products, programs, or services can be used. Subject to Tivoli Systems’ or IBM’s valid intellectual property or legally protectable right, any functionally equivalent product, program, or service can be used instethe referenced product, program, or service. The evaluation and verification of operation in conjunwith other products, except those expressly designated by Tivoli Systems or IBM, are the responsiof the user.
Tivoli Systems or IBM may have patents or pending patent applications covering subject matter in document. The furnishing of this document does not give you any license to these patents. You calicense inquiries, in writing, to the IBM Director of Licensing, IBM Corporation, 500 Columbus AvenThornwood, New York 10594.

4
6
0
Tivoli Manager for Sybase Reference Guide
Preface.....................................................................................................................v
Chapter 1—IntroductionUsing the Reference Guide ................................................................................. 1-2
How this Manual is Organized................................................................... 1-2
Using the Tivoli Desktop or Command Line ............................................. 1-3
Understanding the Monitor Output..................................................................... 1-4
Chapter 2—The SybaseServer Monitoring CollectionList of SybaseServer Monitoring Sources by GUI and CLI Names................... 2-2
Backup Server Errors .......................................................................................... 2-4
Bad Processes.................................................................................................... 2-1
Blocked Processes............................................................................................. 2-17
Connections Available ...................................................................................... 2-22
Connections In Use ........................................................................................... 2-26
CPU By Process................................................................................................ 2-30
Currently Open Databases ................................................................................ 2-33
Database Status ................................................................................................. 2-3
Dataserver Errors .............................................................................................. 2-44
Dataserver Errors By Severity .......................................................................... 2-53
Device Mirror Status......................................................................................... 2-61
Engine CPU Busy ............................................................................................. 2-68
Engine Status .................................................................................................... 2-73
Free Form SQL Numeric .................................................................................. 2-79
Free Form SQL String ...................................................................................... 2-84
Infected Processes ............................................................................................. 2-9
Locks Available ................................................................................................ 2-94
Locks In Use ..................................................................................................... 2-98
Tivoli Manager for Sybase Reference Guide iii

8
3
0
5
6
Long Running Transactions............................................................................ 2-102
Memory Usage By Process............................................................................. 2-107
Packet Errors................................................................................................... 2-110
Packets Received ............................................................................................ 2-113
Packets Sent .................................................................................................... 2-117
Percent Connections Used .............................................................................. 2-121
Percent Locks Available ................................................................................. 2-125
Percent Locks Used ........................................................................................ 2-129
Percent Transaction Log Space Used By Server ............................................ 2-133
Physical IO By Process................................................................................... 2-137
SLD Free Space .............................................................................................. 2-141
SLD Free Space By Device ............................................................................ 2-145
SLD Space Used By Device ........................................................................... 2-149
SQL Server Status........................................................................................... 2-153
Stopped Processes........................................................................................... 2-15
User CPU Busy............................................................................................... 2-162
Chapter 3—The SybaseDatabase Monitoring CollectionList of SybaseDatabase Monitoring Sources by GUI and CLI Names .............. 3-2
Database State..................................................................................................... 3-
Free Form SQL Numeric .................................................................................... 3-9
Free Form SQL String ...................................................................................... 3-14
Free Segment Space By Segment ..................................................................... 3-2
Percent Free Segment Space............................................................................. 3-2
Percent Transaction Log Space Used ............................................................... 3-29
Transaction Log Free Space ............................................................................. 3-33
Used Segment Space By Segment .................................................................... 3-3
iv Version 1.1
Preface
his
t
ed, ses
IX
n.
ts
se ugh
PrefaceThe Tivoli Manager for Sybase Reference Guide provides detailed information about monitors for the Sybase Adaptive Server. Use tmanual in conjunction with the procedures in the Tivoli Manager for Sybase User’s Guide.
You will notice that both Tivoli and TME 10 are used in our producdocumentation. These terms are interchangeable. We will remove references to TME 10 in future product releases.
Also in our product documentation, the term Adaptive Server is usbut the information also pertains to Sybase SQL Server for releaprior to Sybase Adaptive Server, Version 11.5.
Who Should Read This GuideThis guide provides detailed information about the fields on the Tivoli desktop and the command line interface (CLI) for Tivoli Manager for Sybase monitors, their outputs, and usage notes.
Readers of this guide should have knowledge of Windows NT, UNor similar operating systems, Tivoli Manager (or TME 10), and Sybase Adaptive Server (or SQL Server) database administratio
Related DocumentsYou must be familiar with the information in the related documenbefore you install and use Tivoli Manager for Sybase and its monitoring collections.
■ Tivoli Manager for Sybase User’s Guide, Version 1.1
Describes how to install and use the Tivoli Manager for Sybasoftware to manage Sybase Adaptive Server resources throthe Tivoli Enterprise software.
■ TME 10 Distributed Monitoring User’s Guide
Explains how to set up and use the Tivoli Distributed Monitoring application. You must be familiar with Tivoli Distributed Monitoring before you can install and use a monitoring collection.
Tivoli Manager for Sybase Reference Guide v
Preface
nt,
to
rly
e
■ TME 10 Framework Reference Guide
Describes command line interface (CLI) commands and thedefault and validation policies for Framework components.
■ TME 10 Framework Planning and Installation Guide
Provides information on Tivoli Management Region (TMR) server and client hardware requirements.
■ TME 10 Framework User’s Guide
Contains more detailed information about profile managemeincluding profile managers, profile databases, and profiles.
■ TME 10 Enterprise Console User’s Guide
Contains information about setting up the Enterprise Consolereceive distributed monitoring events.
Also refer to the Sybase Adaptive Server documentation, particulathe following documents:
■ System Administration Guide
Describes how to administer security for the Sybase AdaptivServer Enterprise and provides information for specifying character conversion, international language, and sort-ordersettings.
■ Transact-SQL User’s Guide
Describes Transact-SQL, Sybase’s enhanced version of therelational database language, SQL.
What This Guide ContainsThe Tivoli Manager for Sybase Reference Guide contains the following chapters:
■ Chapter 1, “Introduction”
Contains information on how to use this reference manual.
■ Chapter 2, “The SybaseServer Monitoring Collection”
Describes each of the monitoring sources in the SybaseServer monitoring collection.
vi Version 1.1
Preface
in
ear
■ Chapter 3, “The SybaseDatabase Monitoring Collection”
Describes each of the monitoring sources in the SybaseDatabase monitoring collection.
Typeface ConventionsThis guide uses several typeface conventions for special terms and actions. These conventions have the following meaning:
Bold Commands, keywords, file names, authorization roles, or other information that you must use literally appear in bold. Names of windows, dialogs, and other controls also appear in bold.
<italics> Variables and values that you must provide appearitalics within ‘greater’ and ‘less’ brackets (< >). Words and phrases that are emphasized also appin italics.
Bold Italics New terms appear in bold italics when they are defined in the text.
Monospace Code examples appear in a monospace font.
Platform-specific InformationSee the Tivoli Manager for Sybase Release Notes for detailed and up-to-date information on supported platform versions, disk space, and memory requirements.
Contacting Customer SupportFor support inside the United States, for this or any other Tivoli product, contact Tivoli Customer Support in one of the following ways:
■ Send e-mail to [email protected]
■ Call 1-800-TIVOLI8
■ Navigate our Web site at http://www.support.t ivoli.com
For support outside the United States, refer to your Customer Support Handbook for phone numbers in your country. The Customer Support Handbook is available online at http://www.support.t ivoli.com.
Tivoli Manager for Sybase Reference Guide vii
Preface
e
ons
When you contact Tivoli Customer Support, be prepared to provide identification information for your company so that support personnel can assist you more readily.
We are very interested in hearing from you about your experiencwith Tivoli products and documentation. We welcome your suggestions for improvements. If you have comments or suggestiabout this documentation, please send e-mail to [email protected].
viii Version 1.1
Introduction
lity
e
us
ase
1Introduction
This manual is a reference manual to use with the procedures described in the Tivoli Manager for Sybase User’s Guide. It provides alphabetical listings and detailed descriptions of the following:
■ SybaseServer monitors in Chapter 2, “The SybaseServer Monitoring Collection,” provide Sybase Adaptive Server, Sybase Backup Server, and Sybase Monitor Server availabiand performance monitoring facilities.
■ SybaseDatabase monitors in Chapter 3, “The SybaseDatabasMonitoring Collection,” provide database availability and performance monitoring facilities.
A monitor captures and returns information about a resource or application in the Tivoli management environment, such as the statof a database or whether a server is available or not.
Tivoli Manager for Sybase provides the ability to manage and monitor Sybase Adaptive Servers by providing extensions to the Tivoli Framework, Distributed Monitoring, and Enterprise Console.The monitoring collections enable you to manage distributed SybAdaptive Server computing resources effectively and to the granularity that you need.
1
Tivoli Manager for Sybase Reference Guide 1–1

Using the Reference Guide
e
ore
ng
Using the Reference GuideThis section contains information on how to use this reference manual. It includes the following information:
■ How this manual is organized
■ How to use the graphic user interface (GUI) or command lininterface (CLI)
How this Manual is OrganizedThe manual is organized alphabetically within each monitoring collection. Each monitor contains the following information:
■ A brief description of the monitor.
■ The required authorization role.
■ The target endpoint.
■ Descriptions of each GUI field on the Tivoli desktop.
■ The CLI syntax, which includes definitions for each of the arguments, and an example.
■ Suggested monitor threshold values for severity levels. For minformation on triggering conditions and response levels, refer to the “Specifying Response Levels” section in Chapter 5, “SettiUp Monitoring Profiles,” of the Tivoli Manager for Sybase User’s Guide.
■ Example output for each monitor.
■ Usage notes that provide additional information about each monitor.
■ A list of related monitors.
1–2 Version 1.1

Using the Reference Guide
Introduction
ists the te ter
ath
s,”
g a
ld s
Using the Tivoli Desktop or Command LineYou can work with monitors from both the Tivoli desktop (GUI) or the command line (CLI). You might choose to use the Tivoli desktop to take advantage of visual input prompting, such as drop-down lof options, or the default options provided by components such asNotify TEC... button. Use the command line when you want to creascripts, respond to distributed monitoring monitors, and rapidly encommands.
Specifying Path Names
Depending on the platform on which you run Tivoli Manager for Sybase, you will use either forward (/) or backward slashes (\) in pnames. Examples in this documentation use both forward and backward slashes.
Using the Tivoli Desktop
You can set up monitors from the Tivoli desktop, using the procedures described in Chapter 5, “Setting Up Monitoring Profilein the Tivoli Manager for Sybase User’s Guide. You can run monitors using procedures described in Chapter 6, “Using Tivoli Manager for Sybase” of the same guide.
Each monitor description in this manual includes a section called“GUI Data Entry Fields.” This section has an illustration of the dialodisplayed when you select the monitor. Following the illustration isdetailed explanation of each field and button on the dialog.
Using the Command Line
To create a monitor, you can use the waddmon command. The documentation for this command does not provide information regarding specific sources or monitoring collections, such as SybaseServer or SybaseDatabase. Each monitor description in thismanual includes a section called “CLI Syntax” that supplies the arguments for the waddmon command. Also included is a section called “CLI Example,” which provides an example of how you wouactually enter the waddmon command and the monitoring argumentat the command line.
Tivoli Manager for Sybase Reference Guide 1–3
Understanding the Monitor Output
he in
e
d
er
For more information on the waddmon command, refer to the TME 10 Framework Reference Manual or its UNIX manual page.
Understanding the Monitor Output The Tivoli Manager for Sybase monitors can provide output information once they are run. Much of the output information for tmonitor is generic; output that is specific to a monitor is describedthe “Output” section of each monitor description.
Generic output from a Tivoli Manager for Sybase monitor is organized into the following parts:
Identification information The names of the profile, monitor, Sybase AdaptivServer, and host, plus the time and date when themonitor was run.
Trigger value The value returned by the monitor against which responses can be set.
Trigger information Extra information that might be useful, pertaining only to the trigger value and the entity that generatethe trigger value. For example, the trigger value might be 50% free space in the device and the trigginformation might be the name of that device.
Row results (optional) The row results of the SQL command that was executed on the server.
1–4 Version 1.1
Understanding the Monitor Output
Introduction
t.
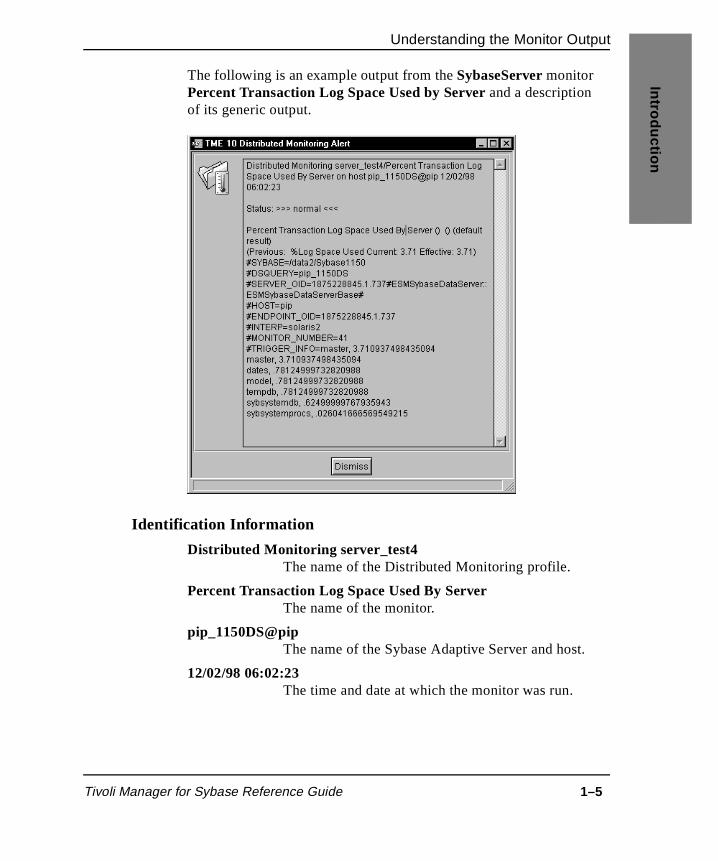
The following is an example output from the SybaseServer monitor Percent Transaction Log Space Used by Server and a description of its generic output.
Identification Information
Distributed Monitoring server_test4 The name of the Distributed Monitoring profile.
Percent Transaction Log Space Used By Server The name of the monitor.
pip_1150DS@pip The name of the Sybase Adaptive Server and hos
12/02/98 06:02:23 The time and date at which the monitor was run.
Tivoli Manager for Sybase Reference Guide 1–5

Understanding the Monitor Output
e ays
ity
e.
e.
he e
s
Trigger Value
Status The trigger value for this monitor, which indicates the success or failure of the monitor
Normal is returned only when no severity levels havbeen breached and the monitor has been set to alwreturn a value.
E.EXEC indicates a problem; an error occurred while running the monitor.
Warning , Severe, or Critical are returned when a severity threshold is broken, the appropriate severlevel is returned.
Trigger Information
Previous The value returned by the preceding monitor prob
For example, if the monitor is run at 5:56 p.m., 6 p.m., and 6.02 p.m., this value is for 6 p.m. The first time this monitor is run in any monitoring session, there is no value for this field.
Current The value returned by the most recent monitor prob
For example, if the monitor is run at 5:56 p.m., 6 p.m., and 6:02 p.m., this value is for 6:02 p.m.
Effective This value does not apply to any of the Tivoli Manager for Sybase monitors.
#SYBASE= The name of either the Sybase Adaptive Server (if tmonitor is distributed to a database), or the Sybasdirectory, $SYBASE (if the monitor is distributed to a server).
#DSQUERY The Sybase Adaptive Server identifier.
#DATABASE The name of the database to which the monitor wadistributed. The #DATABASE information will not appear in the output of a SybaseServer monitor.
1–6 Version 1.1
Understanding the Monitor Output
Introduction
rver.
#SERVER_OID=
The Tivoli SybaseDataServer object ID for the Sybase Adaptive Server.
This object ID is used internally by Tivoli, but you can also specify it in CLI commands and use it fortracing activities with this object.
#HOST= The managed node identifier.
#ENDPOINT_OID=
The Tivoli object ID for the endpoint to which the monitor was distributed.
This object ID is used internally by Tivoli, but you can also specify it in CLI commands and use it fortracing activities with this object.
#INTERP= The platform that the monitor runs on.
#MONITOR_NUMBER= An internal number that uniquely represents the monitor.
See the sections called “Monitor Number” in eachmonitor description in both Chapter 2, “The SybaseServer Monitoring Collection,” and Chapter 3, “The SybaseDatabase Monitoring Collection.”
#TRIGGER_INFO= Supplementary information for users beyond the result from the monitor.
Row Results (optional)
The row results of the SQL command that was executed on the se
Note: The monitor output from #SYBASE= to the end is truncatedat 1000 characters, so you might not see all the row results returned.
Tivoli Manager for Sybase Reference Guide 1–7

Understanding the Monitor Output
1–8 Version 1.1
The S
ybaseServer
Monitoring C
ollection
er
such
g
ase
2The SybaseServer Monitoring Collection
The SybaseServer monitoring collection provides a range of monitoring sources to manage distributed Sybase Adaptive ServEnterprise computing resources effectively. Each monitoring sourcemanages a different aspect of a Sybase Adaptive Server or its databases, a Sybase Backup Server, or a Sybase Monitor Server,as locks, I/O, and network statistics. You can also use the Free Form SQL Numeric and Free Form SQL String user-defined monitors to create your own Sybase Adaptive Server monitoring sources.
For server-level monitoring, you can distribute a profile containinSybaseServer monitors to a SybaseDataServer, SybaseBackupServer, or SybaseMonitorServer endpoint.
For database-specific monitoring, there is a SybaseDatabase monitoring collection, described in Chapter 3, “The SybaseDatabMonitoring Collection.”
Using monitors from both collections enables you to achieve the required range and granularity of monitoring.
2
Tivoli Manager for Sybase Reference Guide 2–1
List of SybaseServer Monitoring Sources by GUI and CLI Names
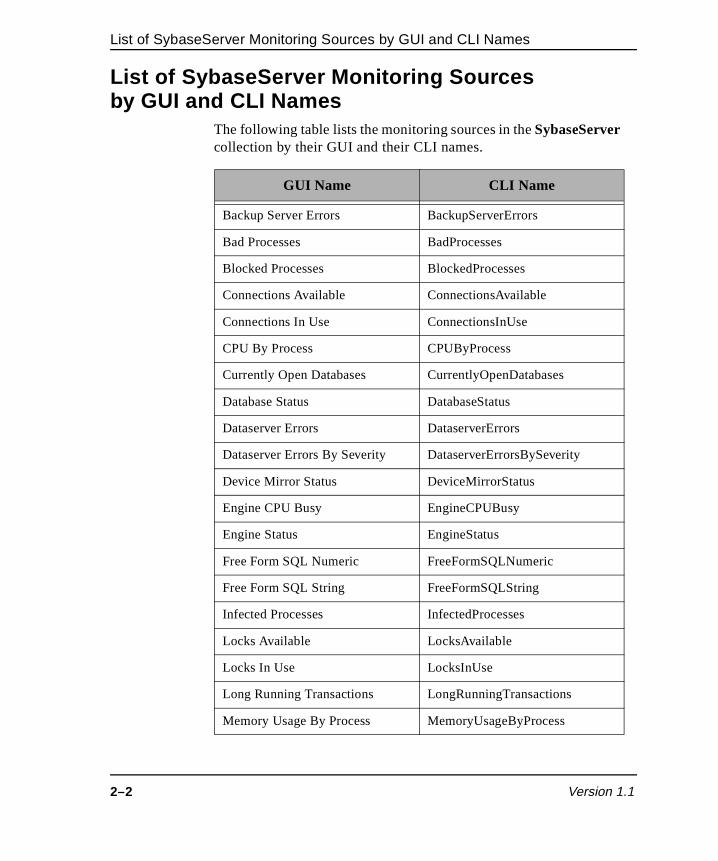
List of SybaseServer Monitoring Sources by GUI and CLI Names
The following table lists the monitoring sources in the SybaseServer collection by their GUI and their CLI names.
GUI Name CLI Name
Backup Server Errors BackupServerErrors
Bad Processes BadProcesses
Blocked Processes BlockedProcesses
Connections Available ConnectionsAvailable
Connections In Use ConnectionsInUse
CPU By Process CPUByProcess
Currently Open Databases CurrentlyOpenDatabases
Database Status DatabaseStatus
Dataserver Errors DataserverErrors
Dataserver Errors By Severity DataserverErrorsBySeverity
Device Mirror Status DeviceMirrorStatus
Engine CPU Busy EngineCPUBusy
Engine Status EngineStatus
Free Form SQL Numeric FreeFormSQLNumeric
Free Form SQL String FreeFormSQLString
Infected Processes InfectedProcesses
Locks Available LocksAvailable
Locks In Use LocksInUse
Long Running Transactions LongRunningTransactions
Memory Usage By Process MemoryUsageByProcess
2–2 Version 1.1

List of SybaseServer Monitoring Sources by GUI and CLI Names
The S
ybaseServer
Monitoring C
ollection
Packet Errors PacketErrors
Packets Received PacketsReceived
Packets Sent PacketsSent
Percent Connections Used PercentConnectionsUsed
Percent Locks Available PercentLocksAvailable
Percent Locks Used PercentLocksUsed
Percent Transaction Log Space Used By Server
PercentTransactionLogSpace-UsedByServer
Physical IO By Process PhysicalIOByProcess
SLD Free Space SLDFreeSpace
SLD Free Space By Device SLDFreeSpaceByDevice
SLD Space Used By Device SLDSpaceUsedByDevice
SQL Server Status SQLServerStatus
Stopped Processes StoppedProcesses
User CPU Busy UserCPUBusy
GUI Name CLI Name
Tivoli Manager for Sybase Reference Guide 2–3

Backup Server Errors
that e.
ged
rm
e
ted.
Backup Server Errors
DESCRIPTION
This monitor checks the Sybase Backup Server error log for messages and reports the severity of the last error in the log file is within a specified functional area and a specified severity rang
Since the Sybase Backup Server silently reports errors to its error log, using this monitor is a good way to be alerted when errors are logthere.
The Sybase Backup Server error message numbers are of the fo<major>.<minor>.<severity>.<state>. This monitor allows you to specify which <major> and <severity> numbers you wish to monitor.For details, see “USAGE NOTES” on page 2-11.
At the time of monitor startup, if the log file contains any existingerror messages that match the specified <major> and <severity> levels, the monitor reports the last error in its output. However, thmonitor returns a trigger value of zero. If the log file is truncated between invocations of the monitor, no error messages are reporFor more details, see “OUTPUT” on page 2-15.
MONITOR NUMBER
4
AUTHORIZATION ROLE
sybase_monitor
TARGET ENDPOINT
SybaseBackupServer
GUI DATA ENTRY FIELDS
The following shows the GUI fields on the Add Monitor to TME 10 Distributed Monitoring Profile dialog for the Backup Server Errors monitor. Descriptions of the monitor arguments follow.
2–4 Version 1.1

Backup Server Errors
The S
ybaseServer
Monitoring C
ollection
er r
for
Major Number Specifies the functional areas to monitor.
The range of major numbers is 1 to 7. You can entas many major numbers as you wish to monitor; foexample, entering 1 means the log will be searchedfor only errors with major number 1. If you enter 1 3 4, the log will be searched for errors with major number 1, 3, or 4.
You can use a hyphen to specify a range of values; example, 1-7 denotes major numbers 1 through 7, inclusive. Do not enter a space before or after the hyphen.
Tivoli Manager for Sybase Reference Guide 2–5

Backup Server Errors
le,
w
ter or
for ,
le,
w
s.
Spaces and hyphens can be combined; for examp1-4 7 denotes major numbers 1 through 4 and 7.
No spaces should precede the first number or follothe last number.
Severity Specifies the severity areas to monitor.
The range of severity numbers is 1 to 4. You can enas many severity numbers as you wish to monitor; fexample, entering 1 means the log will be searched for only errors with severity 1. If you enter 1 3, the log will be searched for errors with severity 1 or 3.
You can use a hyphen to specify a range of values; example, 1-3 denotes severity numbers 1 through 3inclusive. Do not enter a space before or after the hyphen.
Spaces and hyphens can be combined; for examp1-2 4 denotes major numbers 1, 2, and 4.
No spaces should precede the first number or follothe last number.
CLI SYNTAX
BackupServerErrors –a <major number> –a <severity>
where:
–a <major number>Specifies a functional area or range of functional areas.
–a <severity> Specifies a severity area or range of severity area
2–6 Version 1.1

Backup Server Errors
The S
ybaseServer
Monitoring C
ollection
last
h 4,
of y
When specifying the <major number> and <severity> arguments, enter a single number or multiple numbers separated by spaces, a consecutive range of numbers with a hyphen between the first andnumbers in the range, or a combination of both, as shown in the following examples:
1 Searches for value 1 only
1 3 4 Searches for values 1, 3, and 4
1-7 Searches for values 1, 2, 3, 4, 5, 6, and 7
1-4 7 Searches for values 1, 2, 3, 4, and 7
CLI EXAMPLEwaddmon ‘SybaseServer’ ‘BackupServerErrors’-a ‘1-4 6 7’ -a ‘1-4’ -t ‘20 minutes’ -c ‘critical’ -c ‘severe’ -c ‘warning’ -c ‘normal’ -c ‘always’ -f ‘pip:/data/Sybase/monitor_outputs/backup_errors.log’“< profile name >”
SUGGESTED RESPONSE LEVELS
Assuming the Backup Server Errors monitor has been set up withthe major numbers 1 through 7 and the severity numbers 1 througthen the following suggested response levels will raise a critical response if the monitor finds an error in the log file with a severity2, 3, or 4. If the monitor finds an error in the log file with a severitof 1, it will raise a warning.
For more information, refer to the “Specifying Response Levels” section in Chapter 5, “Setting Up Monitoring Profiles,” in the Tivoli Manager for Sybase User’s Guide.
Tivoli Manager for Sybase Reference Guide 2–7
Backup Server Errors
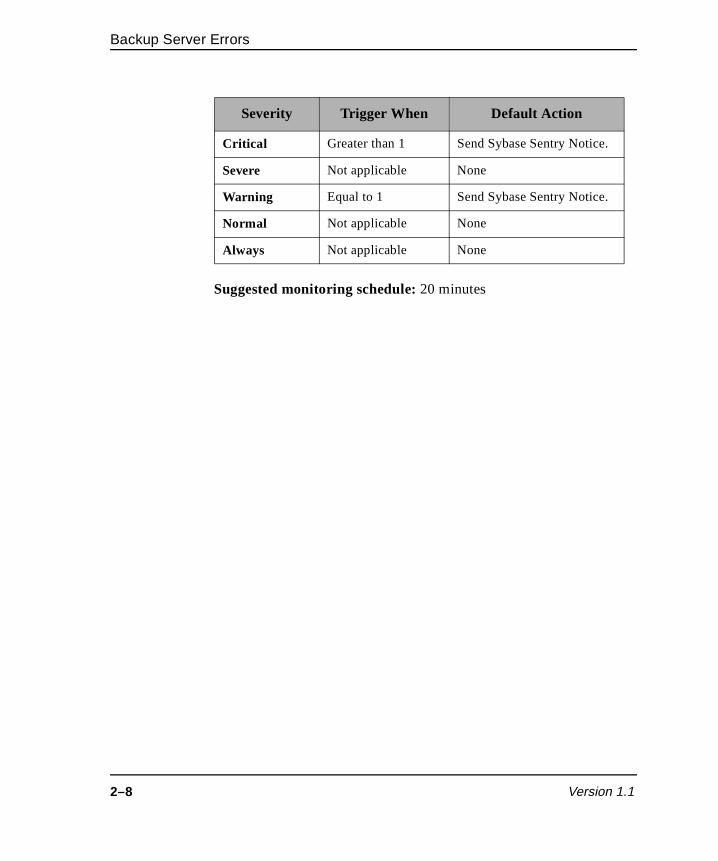
Suggested monitoring schedule: 20 minutes
Severity Trigger When Default Action
Critical Greater than 1 Send Sybase Sentry Notice.
Severe Not applicable None
Warning Equal to 1 Send Sybase Sentry Notice.
Normal Not applicable None
Always Not applicable None
2–8 Version 1.1

Backup Server Errors
The S
ybaseServer
Monitoring C
ollection
t’s the
OUTPUT
The following is an example output from the Backup Server Errors monitor:
The trigger value returned by the monitor is the severity level.
#TRIGGER_INFO=(none) means there is no trigger information.
Below #TRIGGER_INFO= are the latest error messages (or as many as will fit within the 1000-character restriction on the outpulength) taken from the log file. Only those error messages within specified <major number> and <severity> values are given.
For a general description of the monitor output, see “Understandingthe Monitor Output” on page 1-4.
There are two exceptions to the typical Backup Server Errors monitor output:
Tivoli Manager for Sybase Reference Guide 2–9

Backup Server Errors
■ The first time this monitor is run, it returns a trigger value of zero and includes the following message in its output:
!!!Running in startup-mode - No errors will be reported!!!
2–10 Version 1.1

Backup Server Errors
The S
ybaseServer
Monitoring C
ollection of
are
ith
■ If the monitor is run and the error log file has been truncatedsince the last time the monitor ran, it returns a trigger value zero and includes the following message in its output:
!!!Log file size mismatch due to possible truncation!!!
USAGE NOTES
The Backup Server Errors monitor searches the error log file for only those messages that have the <major number> and <severity> values specified as arguments to the monitor. All other messagesignored. Consequently, if you specify a <major number> of 1 and a <severity> of 1, then all messages with the number 1.x.1.y, for example, will be considered by the monitor. However, a message wthe number 2.x.1.y, for example, will be ignored by the monitor.
Tivoli Manager for Sybase Reference Guide 2–11
Backup Server Errors
:
al e
al e
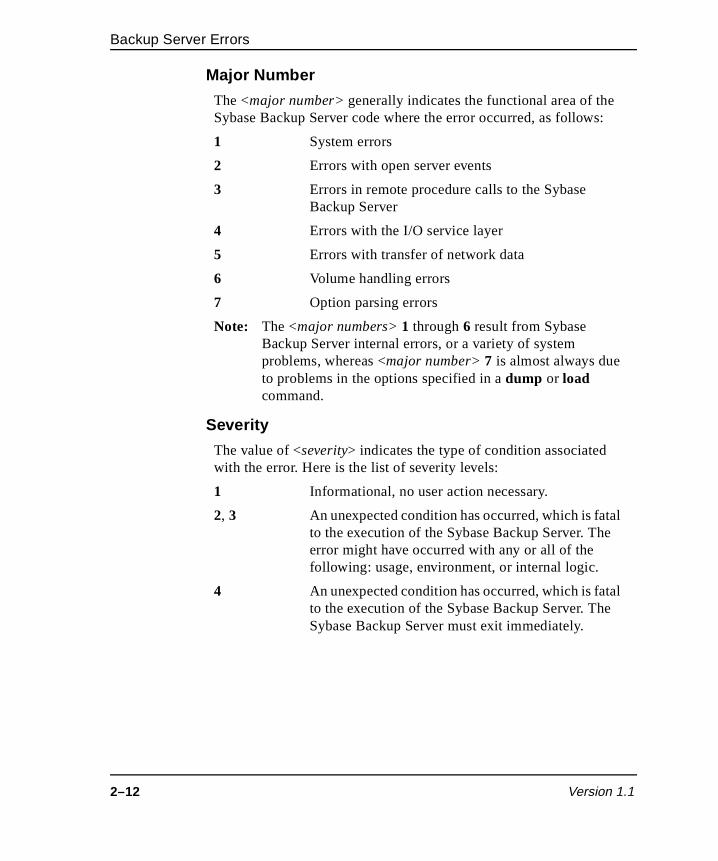
Major Number
The <major number> generally indicates the functional area of the Sybase Backup Server code where the error occurred, as follows
1 System errors
2 Errors with open server events
3 Errors in remote procedure calls to the Sybase Backup Server
4 Errors with the I/O service layer
5 Errors with transfer of network data
6 Volume handling errors
7 Option parsing errors
Note: The <major numbers> 1 through 6 result from Sybase Backup Server internal errors, or a variety of system problems, whereas <major number> 7 is almost always due to problems in the options specified in a dump or load command.
Severity
The value of <severity> indicates the type of condition associated with the error. Here is the list of severity levels:
1 Informational, no user action necessary.
2, 3 An unexpected condition has occurred, which is fatto the execution of the Sybase Backup Server. Therror might have occurred with any or all of the following: usage, environment, or internal logic.
4 An unexpected condition has occurred, which is fatto the execution of the Sybase Backup Server. ThSybase Backup Server must exit immediately.
2–12 Version 1.1
Backup Server Errors
The S
ybaseServer
Monitoring C
ollection en
Note: If you wish to allocate functional areas in which errors canoccur (such as network data transfer errors, or I/O servicelayer errors) to different database administrators (dbas), thset up the Backup Server Errors monitor a number of times with different <major numbers> and different monitor responses.
SEE ALSO
The following SybaseServer monitor: SQL Server Status
Tivoli Manager for Sybase Reference Guide 2–13

Bad Processes
atus.
Bad Processes
DESCRIPTION
This monitor reports processes with a current status of bad status. Such a status indicates that the process is not reporting a valid stThe monitor output gives the process ID (spid), and program name of the offending processes. If this situation occurs, the offending process should be investigated and the Adaptive Server error logchecked.
MONITOR NUMBER
5
AUTHORIZATION ROLE
sybase_monitor
TARGET ENDPOINT
SybaseDataServer
GUI DATA ENTRY FIELDS
None
CLI SYNTAX
BadProcesses
CLI EXAMPLEwaddmon ‘SybaseServer’ ‘BadProcesses’ -t ‘1 minutes’ -c ‘critical’ -c ‘severe’ -c ‘warning’ -c ‘normal’ -c ‘always’ -f ‘pip:/data/Sybase/logs/bad_processes.log’“<profilename>”
2–14 Version 1.1
Bad Processes
The S
ybaseServer
Monitoring C
ollection
y
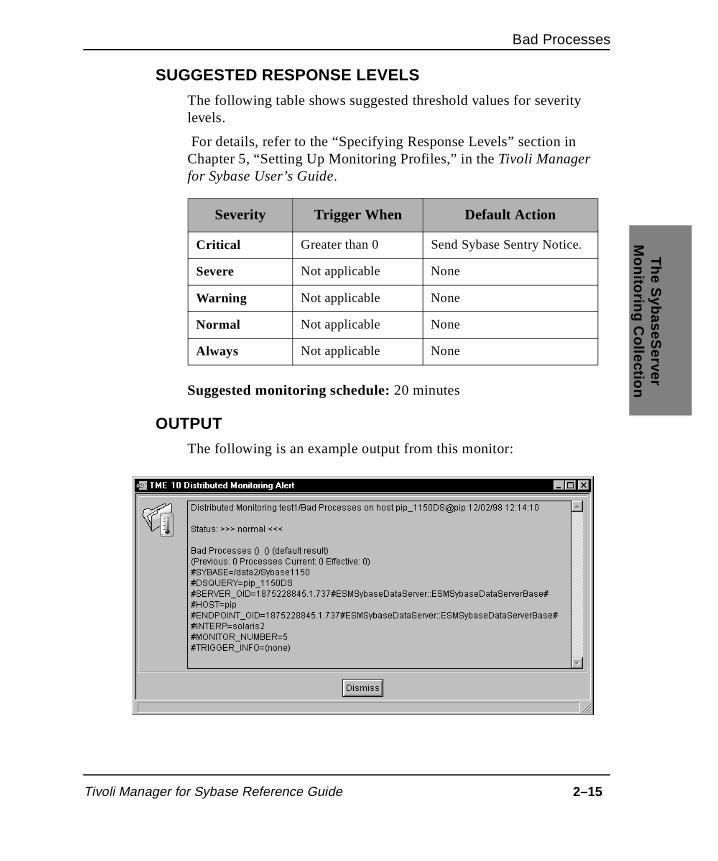
SUGGESTED RESPONSE LEVELS
The following table shows suggested threshold values for severitlevels.
For details, refer to the “Specifying Response Levels” section inChapter 5, “Setting Up Monitoring Profiles,” in the Tivoli Manager for Sybase User’s Guide.
Suggested monitoring schedule: 20 minutes
OUTPUT
The following is an example output from this monitor:
Severity Trigger When Default Action
Critical Greater than 0 Send Sybase Sentry Notice.
Severe Not applicable None
Warning Not applicable None
Normal Not applicable None
Always Not applicable None
Tivoli Manager for Sybase Reference Guide 2–15
Bad Processes
in
h
ing
ion se
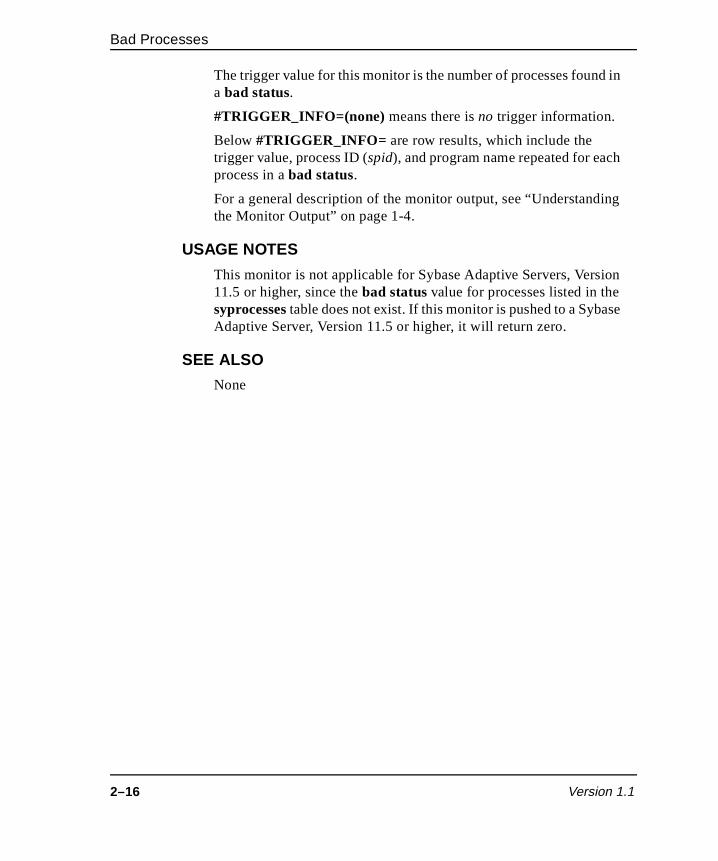
The trigger value for this monitor is the number of processes founda bad status.
#TRIGGER_INFO=(none) means there is no trigger information.
Below #TRIGGER_INFO= are row results, which include the trigger value, process ID (spid), and program name repeated for eacprocess in a bad status.
For a general description of the monitor output, see “Understandthe Monitor Output” on page 1-4.
USAGE NOTES
This monitor is not applicable for Sybase Adaptive Servers, Vers11.5 or higher, since the bad status value for processes listed in thesyprocesses table does not exist. If this monitor is pushed to a SybaAdaptive Server, Version 11.5 or higher, it will return zero.
SEE ALSO
None
2–16 Version 1.1

Blocked Processes
The S
ybaseServer
Monitoring C
ollection
h a
r
of
lue d
yed
ing
Blocked Processes
DESCRIPTION
This monitor reports processes with a current status of lock sleep that have been blocked for longer than the user-specified number of seconds. The monitor output gives the longest time for which sucprocess has been blocked.
Processes with a lock sleep status are those that have requested alock, but are waiting for a competing lock to be released by anotheprocess. For example, if the monitor is set up with 50 as the number of seconds that a process can be blocked before you are notifiedthe situation, then the monitor output will include a list of all processes blocked for 50 or more seconds. The monitor trigger vais the longest number of seconds that a process has been blocke(always 50 seconds or longer, in this case).
This monitor can be used to determine which processes are delaby lock contention rather than performance issues. Further information regarding blocked processes can be obtained by runnthe system-stored procedure sp_lock.
MONITOR NUMBER
6
AUTHORIZATION ROLE
sybase_monitor
TARGET ENDPOINT
SybaseDataServer
Tivoli Manager for Sybase Reference Guide 2–17

Blocked Processes
ss or.
GUI DATA ENTRY FIELDS
The following shows the GUI fields on the Add Monitor to TME 10 Distributed Monitoring Profile dialog for the Blocked Processes monitor. A description of the monitor argument follows.
Blocked For (seconds) Specifies the maximum number of seconds a procecan be blocked before being reported by the monit
The default is 50 seconds.
2–18 Version 1.1

Blocked Processes
The S
ybaseServer
Monitoring C
ollection
ss or.
y n
or
.
.
.
CLI SYNTAX
BlockedProcesses –a <blocked for (seconds)>
where:
–a <blocked for (seconds)>Specifies the maximum number of seconds a procecan be blocked before being reported by the monit
CLI EXAMPLEwaddmon ‘SybaseServer’ ‘BlockedProcesses’ -a ‘50’ -t ‘1 minutes’ -c ‘critical’ -c ‘severe’ -c ‘warning’ -c ‘normal’ -c ‘always’ -f ‘pip:/data/Sybase/logs/blocked_processes.log’ “<profilename>”
SUGGESTED RESPONSE LEVELS
The following table shows suggested threshold values for severitlevels. For details, refer to the “Specifying Response Levels” sectioin Chapter 5, “Setting Up Monitoring Profiles,” in the Tivoli Manager for Sybase User’s Guide.
The following suggested response levels are based on the monitbeing set up with the <blocked for (seconds)> argument set to 15 seconds. These suggested response levels set a critical response if a process is blocked for more than 30 seconds.
Severity Trigger When Default Action
Critical Greater than 30 seconds Send Sybase Sentry Notice
Severe Greater than 20 seconds Send Sybase Sentry Notice
Warning Greater than 15 seconds Send Sybase Sentry Notice
Normal Not applicable None
Always Not applicable None
Tivoli Manager for Sybase Reference Guide 2–19
Blocked Processes
ds
ing
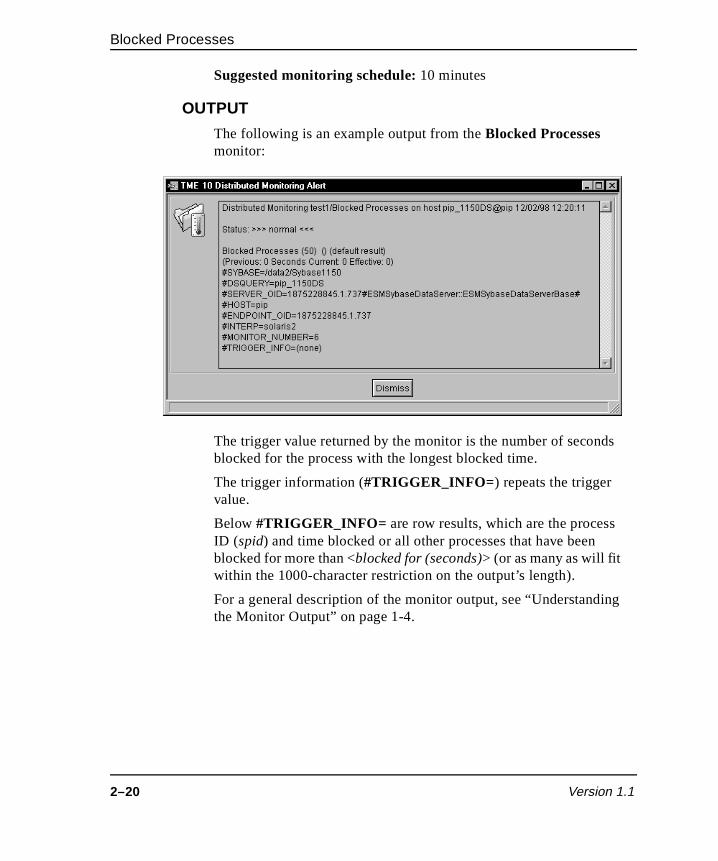
Suggested monitoring schedule: 10 minutes
OUTPUT
The following is an example output from the Blocked Processes monitor:
The trigger value returned by the monitor is the number of seconblocked for the process with the longest blocked time.
The trigger information (#TRIGGER_INFO= ) repeats the trigger value.
Below #TRIGGER_INFO= are row results, which are the processID (spid) and time blocked or all other processes that have been blocked for more than <blocked for (seconds)> (or as many as will fit within the 1000-character restriction on the output’s length).
For a general description of the monitor output, see “Understandthe Monitor Output” on page 1-4.
2–20 Version 1.1

Blocked Processes
The S
ybaseServer
Monitoring C
ollection
of fied. ber
e e
an
ey
de d of
.
USAGE NOTES
The Blocked Processes monitor takes as an argument a numberseconds that a process can be blocked before you wish to be notiYou can then set different severity levels based on the actual numof seconds that processes satisfying the notification argument arblocked. The real use of the argument to the monitor is to limit thoutput of the monitor so you can identify more readily those processes with a problem.
Lock contention can seriously affect transaction throughput. You cminimize lock contention by keeping transactions as small as possible. To avoid lock contention, you can do the following:
■ Stagger competing transactions, or alter the order in which thare run.
■ Avoid transactions holding locks that need to wait for user interaction.
■ When possible, avoid setting locks for transactions that inclunetwork traffic and are, therefore, dependent upon the speethe network.
■ Avoid hotspots within tables by creating a clustered index, or bypartitioning the table.
■ Decrease the number of rows on each page by adjusting the fillfactor or max_rows_per_page values of tables and indexes
SEE ALSO
The following SybaseServer monitors: Locks Available, Percent Locks Available, and Percent Locks in Use.
Tivoli Manager for Sybase Reference Guide 2–21

Connections Available
00 l be
r
Connections Available
DESCRIPTION
This monitor reports the number of user connections currently available on the target server. The maximum number of allowableconnections is controlled with the number of user connections configuration parameter. For example, if this parameter is set to 1and currently there are 30 user connections, the trigger value wil70.
The monitor output gives the value of the number of user connections parameter.
You can use this monitor to alert when you are running out of useconnections, which can result in server access problems. Also, this monitor is useful for tracking client access patterns. If the monitor alerts you that connections are running out, consider either removing some of the existing connections or increasing the value of the number of user connections parameter. For important considerations when extending the number of user connections parameter, refer to the Sybase Adaptive Server Enterprise SystemAdministration Guide.
MONITOR NUMBER
9
AUTHORIZATION ROLE
sybase_monitor
TARGET ENDPOINT
SybaseDataServer
GUI DATA ENTRY FIELDS
None
CLI SYNTAX
ConnectionsAvailable
2–22 Version 1.1
Connections Available
The S
ybaseServer
Monitoring C
ollection
y n
ption ld
CLI EXAMPLEwaddmon ’SybaseServer’ ’ConnectionsAvailable’ -t ’1 minutes’ -c ’critical’ -c ’severe’ -c ’warning’ -c ’normal’ -c ’always’ -f ’pip:/data/Sybase/logs/connections_available.log’ “<profilename>”
SUGGESTED RESPONSE LEVELS
The following table shows suggested threshold values for severitlevels. For details, refer to the “Specifying Response Levels” sectioin Chapter 5, “Setting Up Monitoring Profiles,” in the Tivoli Manager for Sybase User’s Guide.
The following suggested response levels are based on the assumthat the number of user connections configuration parameter is setto 100; if this parameter is set higher or lower than 100, you shoualter the Trigger When conditions below accordingly.
Suggested monitoring schedule: 30 minutes
Severity Trigger When Default Action
Critical Less than 10 Send Sybase Sentry Notice.
Severe Less than 20 Send Sybase Sentry Notice.
Warning Less than 30 Send Sybase Sentry Notice.
Normal Not applicable None
Always Not applicable None
Tivoli Manager for Sybase Reference Guide 2–23
Connections Available
e
ing
e
OUTPUT
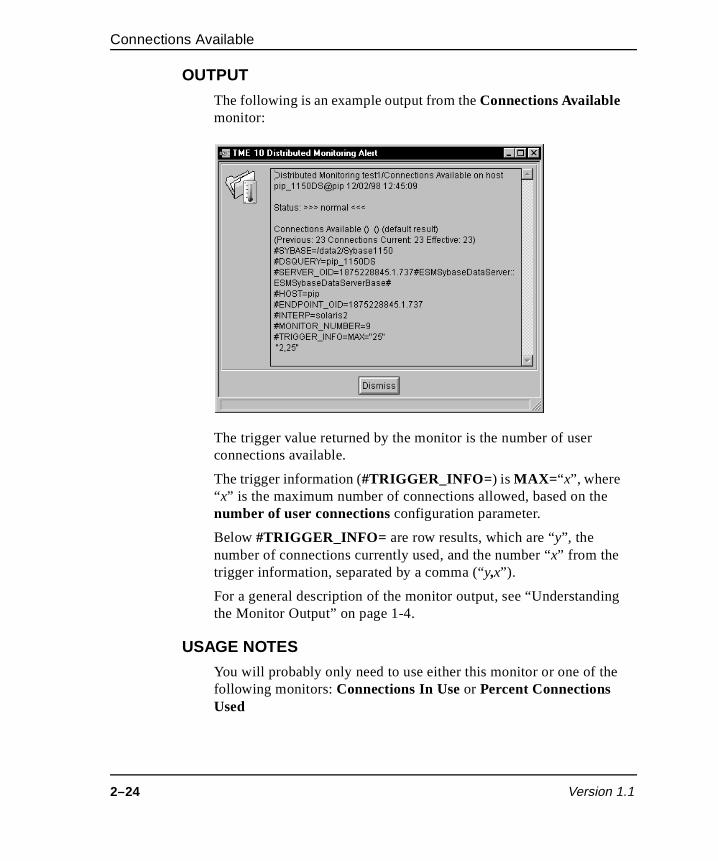
The following is an example output from the Connections Available monitor:
The trigger value returned by the monitor is the number of user connections available.
The trigger information (#TRIGGER_INFO= ) is MAX= “x”, where “x” is the maximum number of connections allowed, based on thnumber of user connections configuration parameter.
Below #TRIGGER_INFO= are row results, which are “y”, the number of connections currently used, and the number “x” from the trigger information, separated by a comma (“y,x”).
For a general description of the monitor output, see “Understandthe Monitor Output” on page 1-4.
USAGE NOTES
You will probably only need to use either this monitor or one of thfollowing monitors: Connections In Use or Percent Connections Used
2–24 Version 1.1

Connections Available
The S
ybaseServer
Monitoring C
ollection
SEE ALSOThe following SybaseServer monitors: Connections In Use and Percent Connections Used
Tivoli Manager for Sybase Reference Guide 2–25
Connections In Use
is
er of
Connections In Use
DESCRIPTION
This monitor reports the current number of user connections to thetarget server. The maximum number of user connections allowedspecified by the number of user connections configuration parameter.
Use this monitor to alert when you are running out of user connections, which can result in server access problems. This monitor is also useful for tracking client access patterns. If the monitor alerts you that connections are running out, consider eithclearing some of the existing connections or increasing the valuethe number of user connections configuration parameter. For important considerations when extending the number of user connections parameter, refer to the Sybase Adaptive Server Enterprise System Administration Guide.
MONITOR NUMBER
10
AUTHORIZATION ROLE
sybase_monitor
TARGET ENDPOINT
SybaseDataServer
GUI DATA ENTRY FIELDS
None
CLI SYNTAX
ConnectionsInUse
2–26 Version 1.1

Connections In Use
The S
ybaseServer
Monitoring C
ollection
y n
ption
CLI EXAMPLEwaddmon ‘SybaseServer’ ‘ConnectionsInUse’ -t ‘1 minutes’ -c ‘critical’ -c ‘severe’ -c ‘warning’ -c ‘normal’ -c ‘always’ -f ‘pip:/data/Sybase/logs/connections_in_use.log’ “<profilename>”
SUGGESTED RESPONSE LEVELS
The following table shows suggested threshold values for severitlevels. For details, refer to the “Specifying Response Levels” sectioin Chapter 5, “Setting Up Monitoring Profiles,” in the Tivoli Manager for Sybase User’s Guide.
The following suggested response levels are based on the assumthat the number of user connections configuration parameter is setto 100; if this parameter is set higher or lower than 100, alter theTrigger When conditions below accordingly.
Suggested monitoring schedule: 30 minutes
Severity Trigger When Default Action
Critical Greater than 90 Send Sybase Sentry Notice.
Severe Greater than 80 Send Sybase Sentry Notice.
Warning Greater than 70 Send Sybase Sentry Notice.
Normal Not applicable None
Always Not applicable None
Tivoli Manager for Sybase Reference Guide 2–27
Connections In Use
e
r
ing
e
OUTPUT
The following is an example output from the Connections in Use monitor:
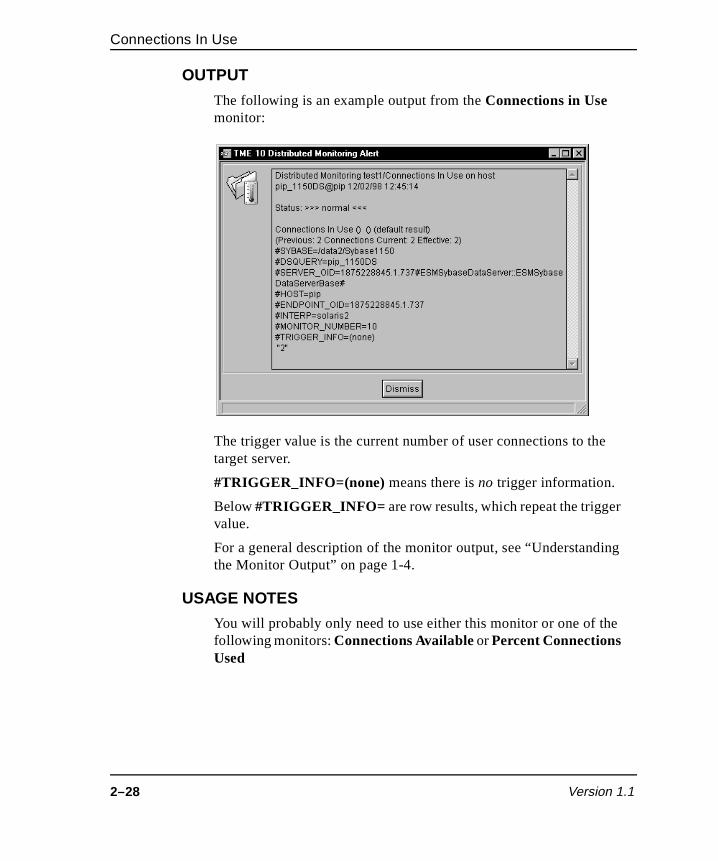
The trigger value is the current number of user connections to thtarget server.
#TRIGGER_INFO=(none) means there is no trigger information.
Below #TRIGGER_INFO= are row results, which repeat the triggevalue.
For a general description of the monitor output, see “Understandthe Monitor Output” on page 1-4.
USAGE NOTES
You will probably only need to use either this monitor or one of thfollowing monitors: Connections Available or Percent Connections Used
2–28 Version 1.1

Connections In Use
The S
ybaseServer
Monitoring C
ollection
SEE ALSOThe following SybaseServer monitors: Connections Available and Percent Connections Used
Tivoli Manager for Sybase Reference Guide 2–29

CPU By Process
tput me
f the
y, t of e
U
are
CPU By Process
DESCRIPTION
This monitor reports the user process with the largest cumulativeCPU time as measured by clock ticks on the target server. The ouof this monitor identifies the server process ID and user’s login nathat are dominating the CPU usage.
The CPU usage value is reset to zero when it reaches the value oserver configuration parameter cpu accounting flush interval (which is used to facilitate chargeback accounting). Consequentlthe value reported by this monitor might not represent the amounCPU used since the server was started. If you are not running thaccounting options, then setting cpu accounting flush interval to the highest possible value will result in a more accurate report of CPusage by this monitor.
This monitor allows you to identify those processes and users whodominating the CPU.
MONITOR NUMBER
7
AUTHORIZATION ROLE
sybase_monitor
TARGET ENDPOINT
SybaseDataServer
GUI DATA ENTRY FIELDS
None
CLI SYNTAX
CPUByProcess
2–30 Version 1.1
CPU By Process
The S
ybaseServer
Monitoring C
ollection
d on
e
CLI EXAMPLEwaddmon ‘SybaseServer’ ‘CPUByProcess’ -t ‘1 minutes’ -c ‘critical’ -c ‘severe’ -c ‘warning’ -c ‘normal’ -c ‘always’ -f ‘pip:/data/Sybase/logs/cpu_by_process.log’“<profilename>”
SUGGESTED RESPONSE LEVELS
No response levels are suggested because they must be specifiean individual site basis.
Suggested monitoring schedule: 10 minutes
OUTPUT
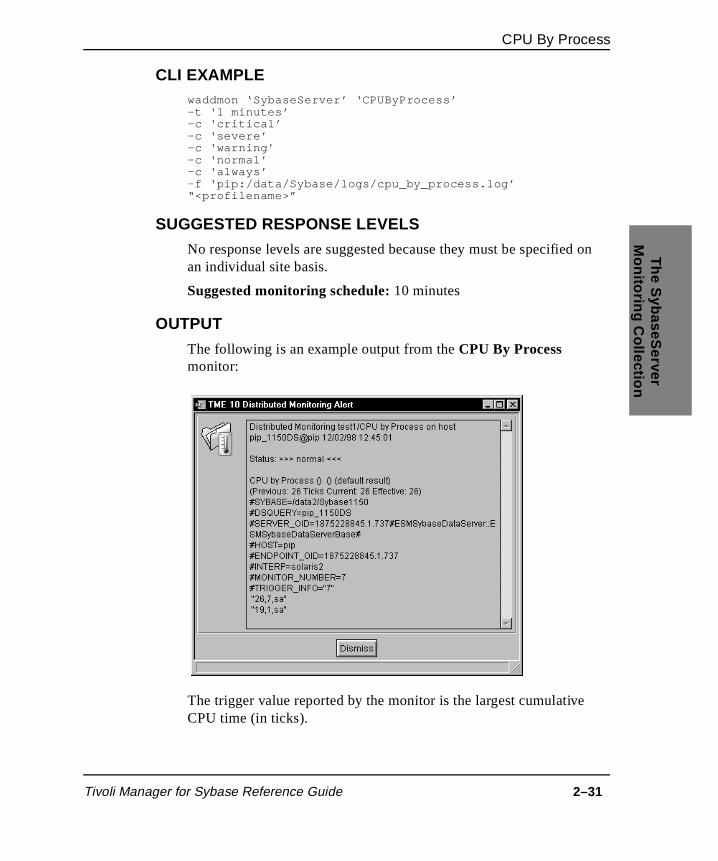
The following is an example output from the CPU By Process monitor:
The trigger value reported by the monitor is the largest cumulativCPU time (in ticks).
Tivoli Manager for Sybase Reference Guide 2–31
CPU By Process
each as
ing
n
The trigger information (#TRIGGER_INFO= ) is the ID of the process with the highest CPU usage.
Below #TRIGGER_INFO= are row results, which give the CPU usage, and login name of the user who issued the command, for process in ascending order, with the highest CPU usage first (formany as will fit within the 1000-character restriction on the output’slength).
For a general description of the monitor output, see “Understandthe Monitor Output” on page 1-4.
USAGE NOTES
This monitor reports CPU usage for each process. For informatioabout CPU usage for each engine or user, use the Engine CPU Busy or User CPU Busy monitors.
SEE ALSO
The following SybaseServer monitors: Engine CPU Busy and User CPU Busy
2–32 Version 1.1

Currently Open Databases
The S
ybaseServer
Monitoring C
ollection
ber used tor
large
Currently Open Databases
DESCRIPTION
This monitor reports the number of currently open databases. Opendatabases are defined as being in the system table sysdatabases with the offline control bit not set.
This monitor allows you to keep track of the number of open databases on different servers, or to check that the expected numof databases are indeed up and running. This monitor can also beto indicate shortfalls in backup strategies; for example, if this moniindicates that 10 databases are running, then any strategy you use should be capable of backing up at least those 10 databases. A number of databases becomes a concern because not only doeseach database take up disk space, but it also takes up valuable systemresources such as CPU and memory.
MONITOR NUMBER
11
AUTHORIZATION ROLE
sybase_monitor
TARGET ENDPOINT
SybaseDataServer
GUI DATA ENTRY FIELDS
None
CLI SYNTAX
CurrentlyOpenDatabases
Tivoli Manager for Sybase Reference Guide 2–33
Currently Open Databases
d on
CLI EXAMPLEwaddmon ‘SybaseServer’ ‘CurrentlyOpenDatabases’ -t ‘1 minutes’ -c ‘critical’ -c ‘severe’ -c ‘warning’ -c ‘normal’ -c ‘always’ -f ‘pip:/data/Sybase/logs/currently_open_databases.log’“<profilename>”
SUGGESTED RESPONSE LEVELS
No response levels are suggested because they must be specifiean individual site basis.
Suggested monitoring schedule: 30 minutes
OUTPUT
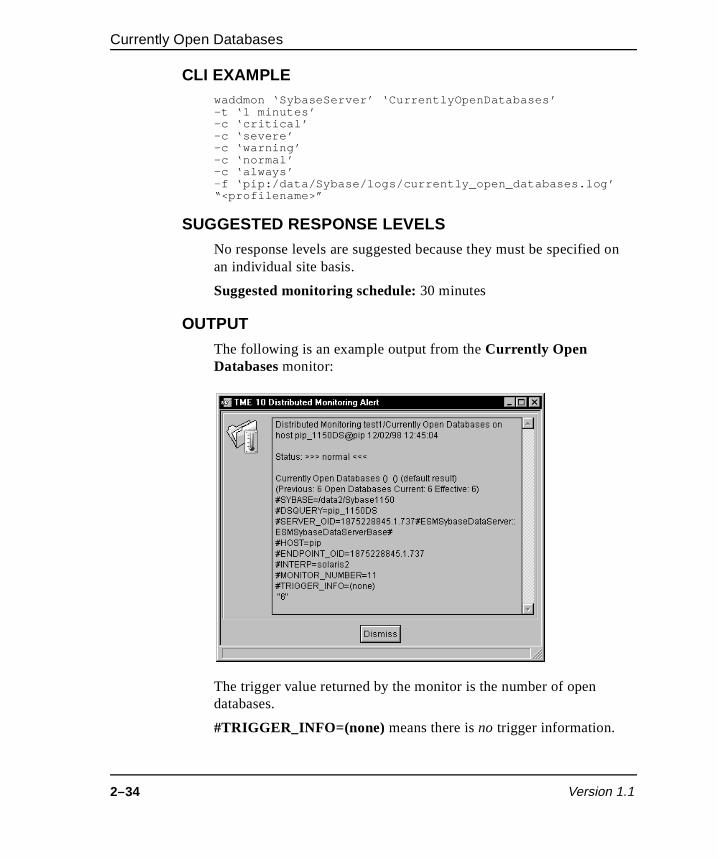
The following is an example output from the Currently Open Databases monitor:
The trigger value returned by the monitor is the number of open databases.
#TRIGGER_INFO=(none) means there is no trigger information.
2–34 Version 1.1

Currently Open Databases
The S
ybaseServer
Monitoring C
ollection
n the rted
Below #TRIGGER_INFO= are row results, which repeat the triggervalue.
For a general description of the monitor output, see “Understandingthe Monitor Output” on page 1-4.
USAGE NOTES
If a user drops a database and creates another database betweetimes this monitor is run, then the number of open databases repowill be the same as the previous time the monitor was run.
SEE ALSO
The SybaseServer monitor Database Status, and the SybaseDatabase monitor Database State
Tivoli Manager for Sybase Reference Guide 2–35
Database Status
able
nal
base
into.
Database Status
DESCRIPTION
This monitor identifies databases that are found to be in a state specified by the user as an argument to the monitor. The system tsysdatabases is searched, and the trigger value returned by the monitor is the name of the first database that is found to be in thespecified state. The trigger information lists the names of additiodatabases found to be in the user-specified state.
Note: This monitor does not affect or change the status of the representative database icon on the Tivoli desktop.
Use this monitor to ensure that changes made by users to the datasettings (using sp_dboption) are acceptable, or use the monitor to keep track of the states that the server itself might put databases
MONITOR NUMBER
12
AUTHORIZATION ROLE
sybase_monitor
TARGET ENDPOINT
SybaseDataServer
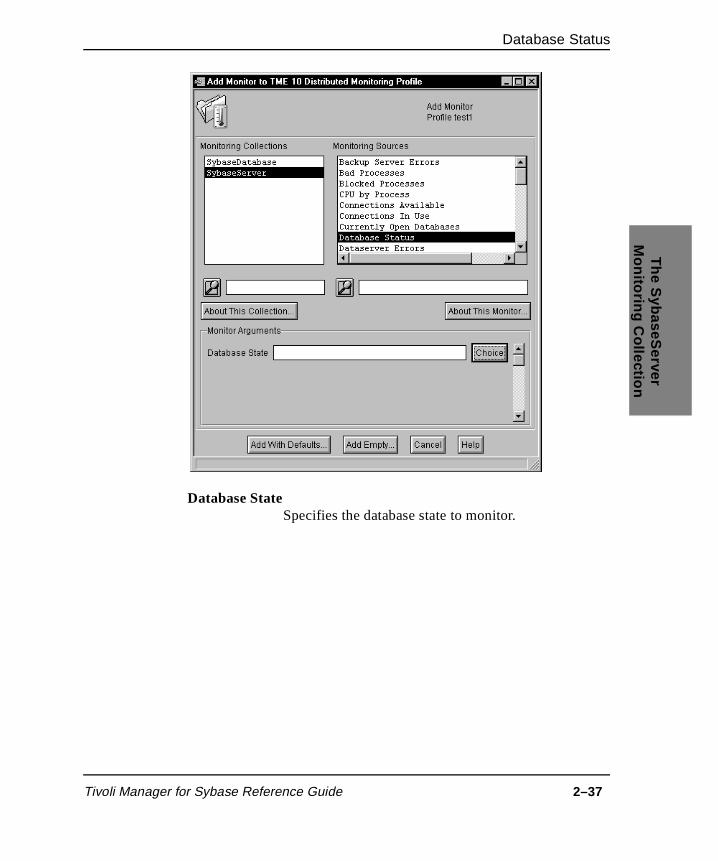
GUI DATA ENTRY FIELDS
The following shows the GUI fields on the Add Monitor to TME 10 Distributed Monitoring Profile dialog for the Database Status monitor. A description of the monitor argument follows.
2–36 Version 1.1
Database Status
The S
ybaseServer
Monitoring C
ollection
Database State Specifies the database state to monitor.
Tivoli Manager for Sybase Reference Guide 2–37

Database Status
nd
e
e
tate e d.
For a list of database states, click the Choice button to display the Database State dialog.
Do one of the following:
Select the state you want to monitor from the scrolling list aclick the Set & Close button. Tivoli Manager for Sybase automatically translates the text into a internal numeric valurepresenting this state (as in the following table) and places it in the Database State argument field on the Add Monitor to TME 10 Distributed Monitoring Profile dialog.
—OR—
Select a database state from the following table and type thnumber found in the column headed Internal Value into the Database State argument field on the Add Monitor to TME 10 Distributed Monitoring Profile dialog.
—OR—
When using a command line, once you have decided which syou want to monitor, consult the following table and include thcorresponding internal value as an argument to the comman
2–38 Version 1.1

Database Status
The S
ybaseServer
Monitoring C
ollection
Database StateUser Settable?
(using sp_dboption)Explanation
Internal Value
Select into/bulkcopy
True Non-logged operations are permitted on the database. They can be highly optimized, but are not recoverable.
4
Trunc log on chkpt
True The logs are truncated when a checkpoint activity occurs. It is recommended this state not be set for production databases where the logs might be needed for recovery, backup, or replication.
8
No chkpt on recovery
True A checkpoint will not occur after recovery of the database or the transaction log.
16
Don’t recover False The database was created with the for load option, or crashed while loading the database. Recovery will not proceed.
32
Not recovered False The database is suspect and cannot be opened or used.
256
Ddl in tran True A user can place Data Definition Language (DDL) commands, such as create table, inside an explicitly begun transaction.
512
Read only True Inserts, updates, and deletes are not permitted on the database.
1024
Dbo use only True Only the database owner can access the database.
2048
Single user True Only one user can connect to the database.
4096
Tivoli Manager for Sybase Reference Guide 2–39

Database Status
Allow nulls by default
True Null values are allowed in columns, whether or not null is specified in the create table or alter table definition.
8192
Abort tran on log full
True If the log fills while a long running transaction is in progress, then the transaction will be aborted and rolled back.
20001
No free space accounting
True The Sybase Adaptive Server does not attempt to calculate when space is running out, and no threshold actions are executed.
20002
Auto identity True A column, SYB_IDENTITY_COL , is added to each table created. This column can be used to uniquely identify each record in the table.
20004
Identity in non unique index
True A column, IDENTITY , is automatically included in a table’s index keys, so all indexes created on the table are unique. This state can drastically increase the size of indexes.
20008
Offline False The database is offline and cannot be accessed by any users.
20016
Offline until recovery
False The database is offline until recovery completes.
20032
Database StateUser Settable?
(using sp_dboption)Explanation
Internal Value
2–40 Version 1.1
Database Status
The S
ybaseServer
Monitoring C
ollection
y n
CLI SYNTAX
DatabaseStatus –a <internal value>
where:
–a <internal value>Specifies the internal value that represents the database status you want.
The numbers from the Internal Value column in the previous table are available for the <internal value> argument.
CLI EXAMPLEwaddmon ‘SybaseServer’ ‘DatabaseStatus’ -a ‘20016’ -t ‘1 minutes’ -c ‘critical’ -c ‘severe’ -c ‘warning’ -c ‘normal’ -c ‘always’ -f ‘pip:/data/Sybase/logs/database_status.log’ “<profilename>”
SUGGESTED RESPONSE LEVELS
The following table shows suggested threshold values for severitlevels. For details, refer to the “Specifying Response Levels” sectioin Chapter 5, “Setting Up Monitoring Profiles,” in the Tivoli Manager for Sybase User’s Guide.
No separate log device
False The database does not have a separate log device. It is strongly recommended that all databases have their logs separate from the data. In particular, separate logs help with recovery and log management.
52768
Database StateUser Settable?
(using sp_dboption)Explanation
Internal Value
Tivoli Manager for Sybase Reference Guide 2–41

Database Status
ver
The following suggested response levels cause a warning response if any databases are found to be in the user-specified state, whatethat state might be.Suggested monitoring schedule: 20 minutes
OUTPUT
The following is an example output from the Database Status monitor:
Severity Trigger When Default Action
Critical Not applicable None
Severe Not applicable None
Warning Not equal to “ ” Send Sybase Sentry Notice.
Normal Not applicable None
Always Not applicable None
2–42 Version 1.1

Database Status
The S
ybaseServer
Monitoring C
ollectionase
fit
as a hen
the e, a
a ed.
g. If nt
The trigger value returned by the monitor is the name of first databfound with the user-defined status.
#TRIGGER_INFO=(none) means there is no trigger information.
Below #TRIGGER_INFO= are row results, which list the names of any other databases with the specified status (or as many as willwithin the 1000-character restriction on the output’s length).
For a general description of the monitor output, see “Understandingthe Monitor Output” on page 1-4.
USAGE NOTES
When setting up this monitor, you can provide a database name threshold value. For example, you can set up the monitor so that wit returns a database name equal to the threshold value, master, then it triggers a critical response such as sending a Tivoli notice. However, when the monitor returns a database name of pubs2, it triggers only a warning response.
Alternatively, no database name need be specified when setting upmonitor. In this case, when the monitor returns any database namresponse is triggered, such as sending a Tivoli notice. In this way, for example, you might use this monitor to trigger a critical response if any database falls into an offline state. This can be done by settingthe monitor to trigger when Not equal to the trigger value “ ” (with a blank space between the quotes). Since the threshold value is blank, the monitor will trigger whenever a database name is return
To monitor multiple states, set up this monitor multiple times; for example, once to monitor if any databases fall into an offline state, and once to monitor if any database does not have a dedicated loyou need to monitor a particular database for a number of differestates, consider using the Database State monitor. See “Database State” on page 3-3.
SEE ALSO
The following SybaseServer monitors: Database State
Tivoli Manager for Sybase Reference Guide 2–43

Dataserver Errors
r
ific
t the itive) on
Dataserver Errors
DESCRIPTION
This monitor allows you to select those Sybase Adaptive Server errors of particular interest, prioritize them into categories of youchoice, and set up different responses for each category.
This monitor checks the Sybase Adaptive Server error log for specerrors. All error messages written to the error log are categorized andthe worst new error message is the monitor trigger. Individual errors are graded on classes of error categorization that are unique within the Tivoli Management Region (TMR). A Tivoli administrator can define any number of new categorization classes—you then selecname of a class and provide the class name (which is case-sensas an argument to this monitor. For details, see “USAGE NOTES”page 2-51.
All installations have a DEFAULT class that categorizes the errorslisted below such that each monitor response value is 1. All other errors will be ignored.
Error Category Error Message
Infected with 10 1
Infected with 11 1
Error 1601 1 Not enough user connections available to start a new process.
Error 1605 1 Failed to open virtual socket for new connections.
Error 7733 1 Unable to locate the base procedure header (Pss->phdr) that had been switched earlier.
Error 2620 1 The offset of the row number at offset %d does not match the entry in the offset table of the following page: %S_PAGE.
2–44 Version 1.1

Dataserver Errors
The S
ybaseServer
Monitoring C
ollection
Error 2503 1 Table Corrupt: Page linkage is not consistent; check the following pages: (current page#=%ld; page# point to this page=%ld; previous page# indicated in this page=%ld).
Error 625 1 Could not retrieve row from logical page %ld with RID because the entry in the offset table for that RID is less than or equal to zero. Attempt to retrieve row from page with RID failed because the requested RID has a higher numberthan the last RID on the page. %S_RID.%S_PAGE.
Error 624 1 Attempt to retrieve row from page with RID failed because the requested RID has a higher numberthan the last RID on the page. %S_RID.%S_PAGE.
Error 806 1 Could not find virtual page for logical page %ld in database %S_DBID.
Error 813 1 Logical page %ld in database %S_DBID, cache %.*s, is already hashed.
Error 605 1 An attempt was made to fetch logical page %ld in database %.*s from cache %.*s. Page belongs to object with ID %ld , not to object %.*s .
Error Category Error Message
Tivoli Manager for Sybase Reference Guide 2–45

Dataserver Errors
run he it
The first time the Dataserver Errors monitor is run, any existing errors satisfying the monitor criteria will be reported in the triggerinformation. However, the monitor output returns a value of zero.From then on, only those errors raised since the monitor was lastwill be reported. If the log file is truncated between invocations of tmonitor, then the first time the monitor is run after the truncation,will return zero.
MONITOR NUMBER
13
AUTHORIZATION ROLE
sybase_monitor
TARGET ENDPOINT
SybaseDataServer
2–46 Version 1.1

Dataserver Errors
The S
ybaseServer
Monitoring C
ollection
to
n
GUI DATA ENTRY FIELDS
The following shows the GUI fields on the Add Monitor to TME 10 Distributed Monitoring Profile dialog for the Dataserver Errors monitor. A description of the monitor argument follows.
Custom Category Name Specifies the name of the error categorization classbe used by the monitor.
DEFAULT is the name of the default error categorization class that is provided with the monitor.
For details on defining your own error categorizatioclass, see “USAGE NOTES” on page 2-51.
Tivoli Manager for Sybase Reference Guide 2–47

Dataserver Errors
y
se a
CLI SYNTAX
DataserverErrors –a <custom category>
where:
–a <custom category>Specifies the name of the custom error category.
CLI EXAMPLEwaddmon ‘SybaseServer’ ‘DataserverErrors’ -a ‘DEFAULT’ -t ‘20 minutes’ -c ‘critical’ -R “==” “1” -c ‘severe’ -c ‘warning’ -c ‘normal’ -c ‘always’ -f ‘pip:/data/Sybase/monitor_outputs/ds_errors.log’ “<profile name>”
SUGGESTED RESPONSE LEVELS
The following table shows suggested threshold values for severitlevels. For details, refer to the “Specifying Response Levels” section in Chapter 5, “Setting Up Monitoring Profiles,” in the Tivoli Manager for Sybase User’s Guide.
Assuming that the default categorization class DEFAULT is passed to the monitor, then the following suggested response levels caucritical response if any error listed in category 1 is raised.
Suggested monitoring schedule: 20 minutes
Severity Trigger When Default Action
Critical Equal to 1 Send Sybase Sentry Notice.
Severe Not applicable None
Warning Not applicable None
Normal Not applicable None
Always Not applicable None
2–48 Version 1.1

Dataserver Errors
The S
ybaseServer
Monitoring C
ollection
of orst.
r st he
OUTPUT
The following is an example output from the Dataserver Errors monitor:
The trigger value returned by the monitor is the category numberthe worst error found. Category 1 errors are always deemed the wIf no errors are located in the error log, this monitor returns zero.
#TRIGGER_INFO=(none) means there is no trigger information.
Below #TRIGGER_INFO= are row results, which include the errotext of all the errors written to the log file since the monitor was larun (or as many as will fit within the 1000-character restriction on toutput’s length). The included errors are only those specified in theerror categorization class input to the monitor.
For a general description of the monitor output, see “Understandingthe Monitor Output” on page 1-4.
Tivoli Manager for Sybase Reference Guide 2–49

Dataserver Errors
There are two exceptions to the typical Dataserver Errors monitor output:
■ The first time this monitor is run, it returns a trigger value of zero and includes the following message in its output:
!!!Running in startup-mode - No errors will be reported!!!
2–50 Version 1.1

Dataserver Errors
The S
ybaseServer
Monitoring C
ollection of
r
■ If the monitor is run and the error log file has been truncatedsince the last time the monitor ran, it returns a trigger value zero and includes the following message in its output:
!!!Log file size mismatch due to possible truncation!!!
USAGE NOTES
To monitor errors in a different way than that provided with the errocategory class DEFAULT , write your own error category classes using the SetErrorCategory utility. This utility allows you to define and manipulate error categorizations for use with this monitor.
To define and manipulate your own category classes, go to the directory <tivoli installation>/bin/generic/SybaseSentry and run one of the following scripts. All of the following scripts are interactive, prompting you for the required information.
Tivoli Manager for Sybase Reference Guide 2–51
Dataserver Errors
e
es.
SetErrorCategory.sh -a Enables you to create a new category class.
Using this script, you can create a class named class1, for example, and add pairs to this class in thfollowing form:
<error number>:<category number>
For example: 1601:1
The special pair OTHERS:x can be added to a customized class. This means that all other errors not listed in the class will be given category number x. This allows all otherwise undefined errors to be collected into a single category. The name class1 can then be provided as the monitor argument.
SetErrorCategory.sh -h Displays online help about the SetErrorCategory utility.
SetErrorCategory.sh -r Resets category definitions to the default.
SetErrorCategory.sh -l Lists the currently defined category classes.
SetErrorCategory.sh -d Enables you to delete one or more category class
SEE ALSO
The following SybaseServer monitor: Dataserver Errors By Severity
2–52 Version 1.1

Dataserver Errors By Severity
The S
ybaseServer
Monitoring C
ollection
se
itor er
th a S” is r so
Dataserver Errors By Severity
DESCRIPTION
This monitor checks the Sybase Adaptive Server error log for error messages of specified severity levels.
The Sybase Adaptive Server writes errors silently to the log file. Uthis monitor to be notified when errors have occurred.
On monitor start up, any error messages found in the error log that match the specified severity levels are reported. However, the monoutput returns a value of zero. If the log file is truncated betweeninvocations of the monitor, then the first time the monitor is run aftthe truncation, it will return zero.
Sybase Adaptive Server errors are each given a severity level, widifferent meaning for each level. For details, see “USAGE NOTEon page 2-59. Because the severity level of the errors to monitorpassed as an argument to the monitor, you can set up the monitothat only the most serious errors are monitored.
MONITOR NUMBER
14
AUTHORIZATION ROLE
sybase_monitor
TARGET ENDPOINT
SybaseDataServer
GUI DATA ENTRY FIELDS
The following shows the GUI fields on the Add Monitor to TME 10 Distributed Monitoring Profile dialog for the Dataserver Errors monitor. A description of the monitor argument follows.
Tivoli Manager for Sybase Reference Guide 2–53

Dataserver Errors By Severity
h
4.
ty
Severity Specifies the severity levels of errors the monitor should search for in the log.
The range of default numbers is 19 to 24, all of whicindicate fatal errors.
You can enter numbers, spaces, and hyphens (to specify ranges). For example, entering 24 means the log will be searched for only errors with severity level 24. If you enter 19 23 24, the log will be searched for errors with severity levels 19, 23, or 2
You can use a hyphen to specify a range of severilevels; for example, 19-24 denotes severity levels 19through 24, inclusive. Do not enter a space before orafter the hyphen.
2–54 Version 1.1

Dataserver Errors By Severity
The S
ybaseServer
Monitoring C
ollectionle,
w
s.
r
les:
24
y n
Spaces and hyphens can be combined; for examp1-4 13 searches for errors with severity levels 1 through 4 and 13.
No spaces should precede the first number, or follothe last number.
CLI SYNTAX
DataserverErrorsBySeverity –a <severity>
where:
–a <severity> Specifies a severity level or range of severity level
When specifying the <severity> argument, enter a single number omultiple numbers separated by spaces, a consecutive range of numbers with a hyphen between the first and last numbers in therange, or a combination of both, as shown in the following examp
24 Searches for severity level 24 only
19 23 24 Searches for severity levels 19, 23, and 24
19-24 Searches for severity levels 19, 20, 21, 22, 23, and
19-22 24 Searches for severity levels 19, 20, 21, 22, and 24
CLI EXAMPLEwaddmon ‘SybaseServer’ ‘DataserverErrorsBySeverity’ -a ‘19 20 21 22 23 24’ -t ‘20 minutes’ -c ‘critical’ -R “>” “18” -p Root_pip-region -c ‘severe’ -c ‘warning’ -c ‘normal’ -c ‘always’ -f ‘pip:/data/monitor_outputs/sybase/dserrors_bys.log’ “<profile name>”
SUGGESTED RESPONSE LEVELS
The following table shows suggested threshold values for severitlevels. For details, refer to the “Specifying Response Levels” sectioin Chapter 5, “Setting Up Monitoring Profiles,” in the Tivoli Manager for Sybase User’s Guide.
Tivoli Manager for Sybase Reference Guide 2–55

Dataserver Errors By Severity
de vels d,
Assuming the monitor was set up with the severity range to inclulevel 17 and all those above, the following suggested response lecause a critical response if a fatal error 19 or higher is encountereand a severe response if an error of severity level 17 or 18 is encountered.
Suggested monitoring schedule: 20 minutes
Severity Trigger When Default Action
Critical Greater than 18 Send Sybase Sentry Notice.
Severe Greater than 16 Send Sybase Sentry Notice.
Warning Not applicable None
Normal Not applicable None
Always Not applicable None
2–56 Version 1.1
Dataserver Errors By Severity
The S
ybaseServer
Monitoring C
ollection
ror tor)
un
OUTPUT
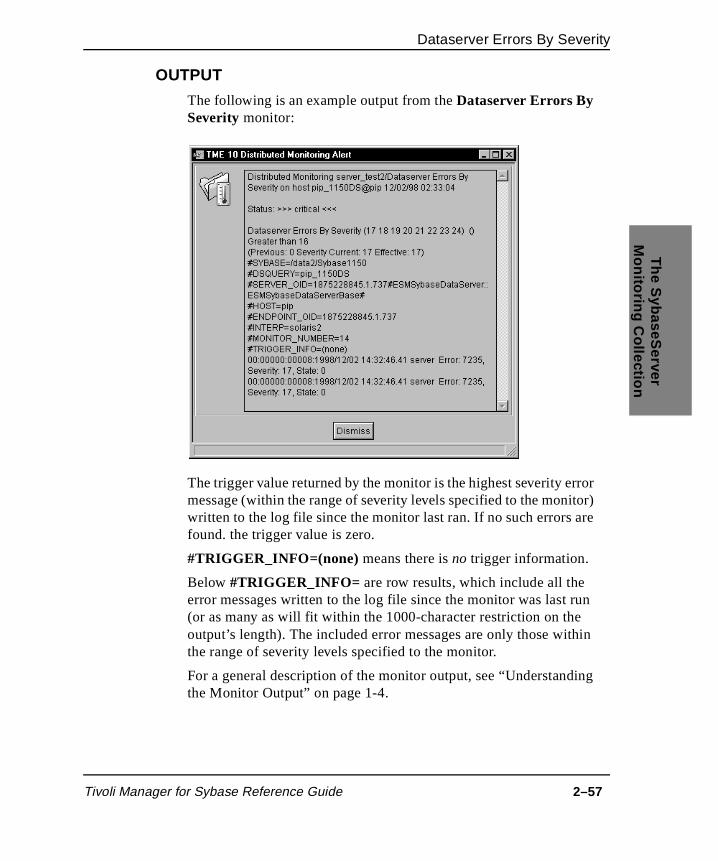
The following is an example output from the Dataserver Errors By Severity monitor:
The trigger value returned by the monitor is the highest severity ermessage (within the range of severity levels specified to the moniwritten to the log file since the monitor last ran. If no such errors are found. the trigger value is zero.
#TRIGGER_INFO=(none) means there is no trigger information.
Below #TRIGGER_INFO= are row results, which include all the error messages written to the log file since the monitor was last r(or as many as will fit within the 1000-character restriction on the output’s length). The included error messages are only those within the range of severity levels specified to the monitor.
For a general description of the monitor output, see “Understandingthe Monitor Output” on page 1-4.
Tivoli Manager for Sybase Reference Guide 2–57
Dataserver Errors By Severity
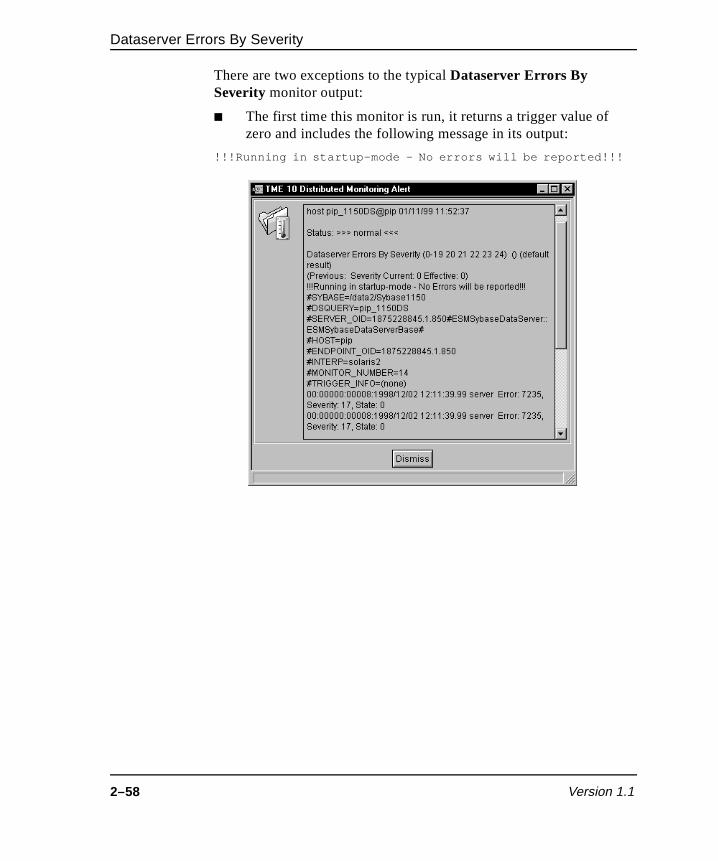
There are two exceptions to the typical Dataserver Errors By Severity monitor output:
■ The first time this monitor is run, it returns a trigger value of zero and includes the following message in its output:
!!!Running in startup-mode - No errors will be reported!!!
2–58 Version 1.1

Dataserver Errors By Severity
The S
ybaseServer
Monitoring C
ollection of
have e
ds
ges
res ls.
■ If the monitor is run and the error log file has been truncatedsince the last time the monitor ran, it returns a trigger value zero and includes the following message in its output:
!!!Log file size mismatch due to possible truncation!!!
USAGE NOTES
The Dataserver Errors By Severity monitor searches the error logfile for only those messages that have severity levels specified asarguments to the monitor. All other messages are ignored. The monitor reports those error messages in the specified range that occurred since the monitor last ran. Messages that occurred beforthe monitor was last run are not reported again.
For maximum integrity, when the Sybase Adaptive Server responto error conditions, it displays messages from sysmessages, but takes action according to an internal table. A few corresponding messadiffer in severity levels, so you might occasionally notice a difference in expected behavior if you are developing applications or proceduthat refer to Sybase Adaptive Server messages and severity leve
Tivoli Manager for Sybase Reference Guide 2–59

Dataserver Errors By Severity
n
e
ht me ase. ver. its
y
The Dataserver Errors By Severity monitor’s output indicates the severity level associated with the error, which provides informatioabout the kind of problem the Sybase Adaptive Server has encountered. Here is the list of reported severity levels and their meanings:
1 through 15 Indicate problems caused by mistakes in what theuser entered.
16 and higher Indicate software or hardware errors.
17 or 18 Indicate that you can continue with the work you ardoing, although you might not be able to execute aparticular command.
19 and higher Indicate fatal errors, meaning the process is no longer running.
The process freezes its state before it stops, recording information about what has happened. The serverthen kills the process.
Note: Fatal errors break the user’s connection to the Sybase Adaptive Server. Depending upon the problem, users migor might not be able to reconnect and resume working. Soproblems with fatal severity levels affect only one processand one user; others affect all the processes in the databIn some cases, you must restart the Sybase Adaptive SerSuch problems do not necessarily damage a database orobjects, but they can. They might result from earlier damage to a database or its objects. Other problems are caused bhardware malfunctions.
SEE ALSO
The following SybaseServer monitor: Dataserver Errors
2–60 Version 1.1
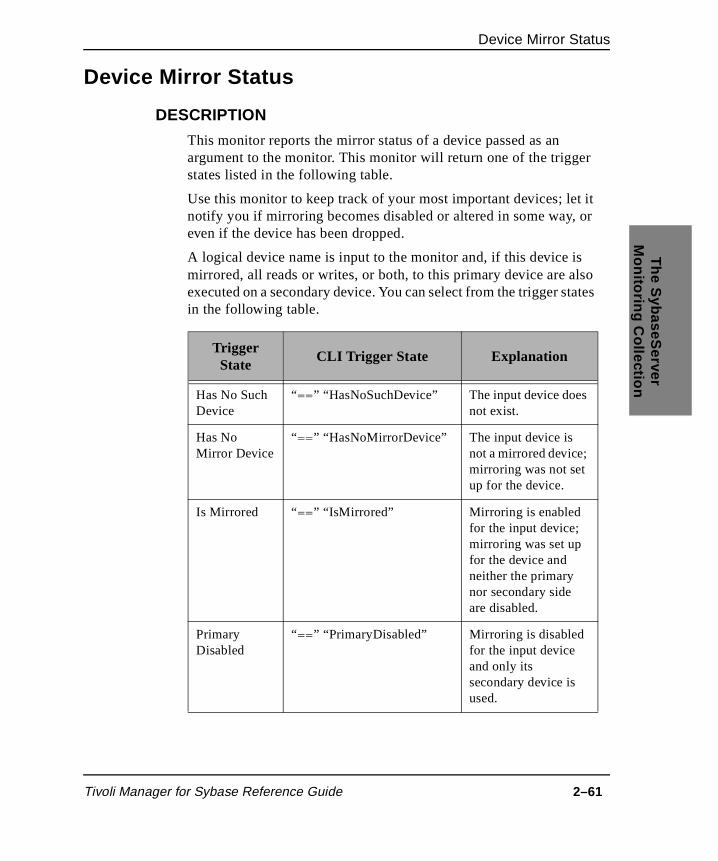
Device Mirror Status
The S
ybaseServer
Monitoring C
ollection
r
t it or
tates
Device Mirror Status
DESCRIPTION
This monitor reports the mirror status of a device passed as an argument to the monitor. This monitor will return one of the triggestates listed in the following table.
Use this monitor to keep track of your most important devices; lenotify you if mirroring becomes disabled or altered in some way, even if the device has been dropped.
A logical device name is input to the monitor and, if this device ismirrored, all reads or writes, or both, to this primary device are also executed on a secondary device. You can select from the trigger sin the following table.
Trigger State
CLI Trigger State Explanation
Has No Such Device
“==” “HasNoSuchDevice” The input device does not exist.
Has No Mirror Device
“==” “HasNoMirrorDevice” The input device is not a mirrored device; mirroring was not set up for the device.
Is Mirrored “==” “IsMirrored” Mirroring is enabled for the input device; mirroring was set up for the device and neither the primary nor secondary side are disabled.
Primary Disabled
“==” “PrimaryDisabled” Mirroring is disabled for the input device and only its secondary device is used.
Tivoli Manager for Sybase Reference Guide 2–61

Device Mirror Status
Secondary Disabled
“==” “SecondaryDisabled” Mirroring is disabled for the input device and only the primary (input) device is used.
Becomes No Such Device
“->” “HasNoSuchDevice” The monitor returns Has No Such Device, but when the monitor was run previously, the returned status was one other than Has No Such Device.
Becomes Not Mirrored
“->” “HasNoMirrorDevice” The monitor returns Has No Mirror Device, but when the monitor was run previously, the returned status was one other than Has No Mirror Device .
Becomes Mirrored
“->” “IsMirrored” The monitor returns Is Mirrored , but when the monitor was run previously, the returned status was one other than Is Mirrored .
Primary Becomes Disabled
“->” “PrimaryDisabled” The monitor returns Primary Disabled, but when the monitor was run previously, the returned status was one other then Primary Disabled.
Trigger State
CLI Trigger State Explanation
2–62 Version 1.1

Device Mirror Status
The S
ybaseServer
Monitoring C
ollection
MONITOR NUMBER
15
AUTHORIZATION ROLE
sybase_monitor
TARGET ENDPOINT
SybaseDataServer
Secondary Becomes Disabled
“->” “SecondaryDisabled” The monitor returns Secondary Disabled, but when the monitor was run previously, the returned status was one other than Secondary Disabled.
Trigger State
CLI Trigger State Explanation
Tivoli Manager for Sybase Reference Guide 2–63

Device Mirror Status
r.
GUI DATA ENTRY FIELDS
The following shows the GUI fields on the Add Monitor to TME 10 Distributed Monitoring Profile dialog for the Device Mirror Status monitor. A description of the monitor argument follows.
Logical Device Name Specifies the logical name of the device to monito
The default is master for the master device.
2–64 Version 1.1
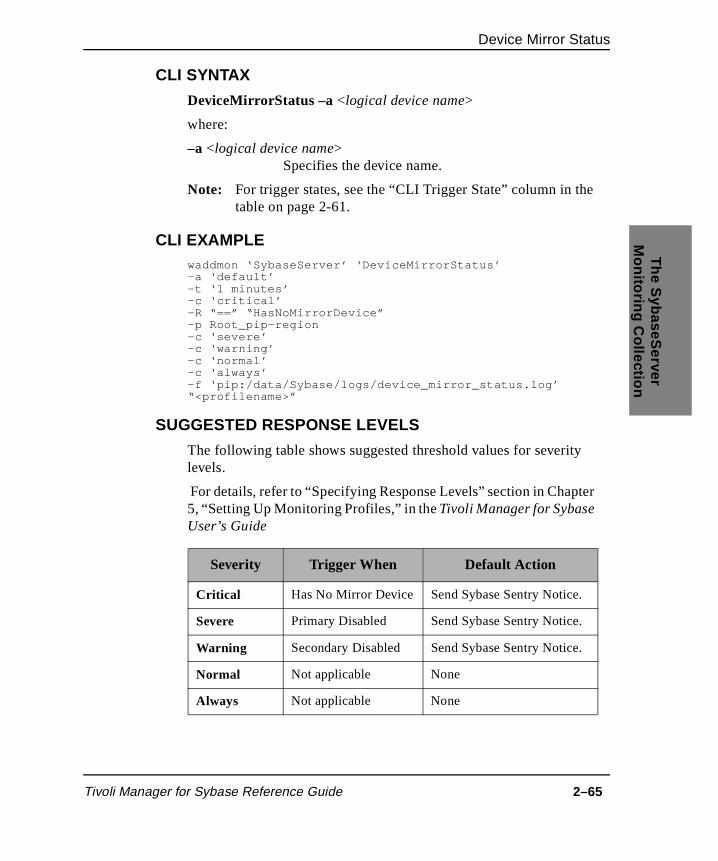
Device Mirror Status
The S
ybaseServer
Monitoring C
ollection
e
y
ter
CLI SYNTAX
DeviceMirrorStatus –a <logical device name>
where:
–a <logical device name> Specifies the device name.
Note: For trigger states, see the “CLI Trigger State” column in thtable on page 2-61.
CLI EXAMPLEwaddmon ‘SybaseServer’ ‘DeviceMirrorStatus’-a ‘default’-t ‘1 minutes’-c ‘critical’-R “==” “HasNoMirrorDevice”-p Root_pip-region-c ‘severe’-c ‘warning’-c ‘normal’-c ‘always’-f ‘pip:/data/Sybase/logs/device_mirror_status.log’“<profilename>”
SUGGESTED RESPONSE LEVELS
The following table shows suggested threshold values for severitlevels.
For details, refer to “Specifying Response Levels” section in Chap5, “Setting Up Monitoring Profiles,” in the Tivoli Manager for Sybase User’s Guide
Severity Trigger When Default Action
Critical Has No Mirror Device Send Sybase Sentry Notice.
Severe Primary Disabled Send Sybase Sentry Notice.
Warning Secondary Disabled Send Sybase Sentry Notice.
Normal Not applicable None
Always Not applicable None
Tivoli Manager for Sybase Reference Guide 2–65

Device Mirror Status
tes
r
ing
Suggested monitoring schedule: 15 minutes
OUTPUT
The following is an example output from the Device Mirror Status monitor:
The trigger value returned by the monitor is one of the trigger stalisted in the table on page 2-61.
#TRIGGER_INFO=(none) means there is no trigger information.
Below #TRIGGER_INFO= are row results, which repeat the triggevalue information.
For a general description of the monitor output, see “Understandthe Monitor Output” on page 1-4.
2–66 Version 1.1
Device Mirror Status
The S
ybaseServer
Monitoring C
ollection
te to
e the itor
g
ive
USAGE NOTES
With regard to the five becomes trigger states (Becomes No Such Device, Becomes Not Mirrored, Becomes Mirrored, Primary Becomes Disabled, and Secondary Becomes Disabled) listed in the table on page 2-61, the first time the monitor is run none of thesestates can be returned because there was no previous mirror stacompare to the current mirror state.
In addition, none of the becomes trigger states can be returned twicin succession; in other words, if one of these states is returned bymonitor, then it cannot possibly be returned the next time the monis run.
The mirror status of the input device is determined in the followinorder:
■ Has No Such Device
■ Has No Mirror Device
■ Primary Disabled
■ Secondary Disabled
■ Is Mirrored
For example, if a device that does not exist on the Sybase AdaptServer is input as an argument, the monitor returns Has No Such Device.
SEE ALSO
The following SybaseServer monitors: SLD Free Space, SLD Free Space By Device, and SLD Space Used By Device
Tivoli Manager for Sybase Reference Guide 2–67

Engine CPU Busy
rtup ent
s, d ost lly the
Engine CPU Busy
DESCRIPTION
This monitor reports the percentage of the server’s time since stathat is used by the engine for CPU activity and passed as an argumto the monitor. If you specify that the monitor is to check all enginethe monitor returns the highest percentage of CPU activity it founalong with the engine number, which is the engine causing the mactivity. The Sybase Adaptive Server can be configured (with themax online engines parameter) to use more than one engine. Usuathe maximum number of engines equals the number of CPUs in server, minus one.
This monitor allows you to track the activity of one engine, or examine the spread of activity across all engines.
MONITOR NUMBER
16
AUTHORIZATION ROLE
sybase_monitor
TARGET ENDPOINT
SybaseDataServer
2–68 Version 1.1

Engine CPU Busy
The S
ybaseServer
Monitoring C
ollection
GUI DATA ENTRY FIELDSThe following shows the GUI fields on the Add Monitor to TME 10 Distributed Monitoring Profile dialog for the Engine CPU Busy monitor. A description of the monitor argument follows.
Engine Number Specifies the number of the engine to monitor.
The default is ALL , for all engines.
Tivoli Manager for Sybase Reference Guide 2–69

Engine CPU Busy
d on
CLI SYNTAX
EngineCPUBusy –a <engine number>
where:
–a <engine number>Enter a valid engine number, or ALL for all engines.
CLI EXAMPLEwaddmon ‘SybaseServer’ ‘EngineCPUBusy’ -a ‘all’ -t ‘1 minutes’ -c ‘critical’ -c ‘severe’ -c ‘warning’ -c ‘normal’ -c ‘always’ -f ‘pip:/data/Sybase/logs/engine_CPU_busy.log’ “<profilename>”
SUGGESTED RESPONSE LEVELS
No response levels are suggested because they must be specifiean individual site basis.
Suggested monitoring schedule: 25 minutes
2–70 Version 1.1
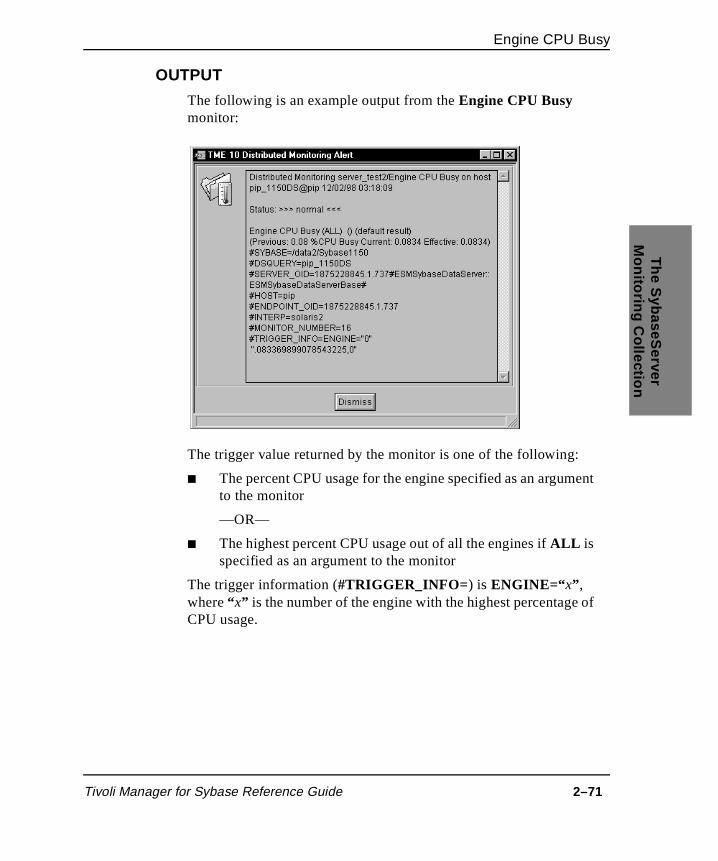
Engine CPU Busy
The S
ybaseServer
Monitoring C
ollection
t
of
OUTPUT
The following is an example output from the Engine CPU Busy monitor:
The trigger value returned by the monitor is one of the following:
■ The percent CPU usage for the engine specified as an argumento the monitor
—OR—
■ The highest percent CPU usage out of all the engines if ALL is specified as an argument to the monitor
The trigger information (#TRIGGER_INFO= ) is ENGINE=“ x” , where “ x” is the number of the engine with the highest percentageCPU usage.
Tivoli Manager for Sybase Reference Guide 2–71

Engine CPU Busy
an
ing
an
nd
le.
er igh e
ble
Below #TRIGGER_INFO= are row results, which provide one or the other of the following extra information:
■ If ALL is selected, the percentage CPU usage and engine number for all the engines are given.
—OR—
■ If ALL is not selected and one engine number is supplied asargument to the monitor, the trigger value and the trigger information are repeated.
For a general description of the monitor output, see “Understandthe Monitor Output” on page 1-4.
USAGE NOTES
When multiple CPUs are available, the Sybase Adaptive Server cbe configured with the max online engines parameter to have multiple engines. The distribution of tasks between the engines athe choice of CPU used by an engine is handled by the Sybase Adaptive Server (transparently to the user) and is not configurab
This monitor gives an indication of how the Sybase Adaptive Servis balancing the work load between the engines. A consistently hpercentage of CPU activity reported by the monitor might indicatthe need for an additional engine to be brought on line. Increasing the number of engines should only be done if there are enough availaCPUs to support them. For important considerations when determining the optimum number of engines, refer to the Sybase Adaptive Server Enterprise System Administration Guide.
SEE ALSO
The following SybaseServer monitors: CPU By Process and User CPU Busy
2–72 Version 1.1

Engine Status
The S
ybaseServer
Monitoring C
ollection
Engine StatusDESCRIPTION
The monitor reports the number of engines found in the state specified, as an argument to the monitor. Available states are as follows:
■ online
■ offline
■ in create
■ in destroy
■ debug
MONITOR NUMBER
18
AUTHORIZATION ROLE
sybase_monitor
TARGET ENDPOINT
SybaseDataServer
Tivoli Manager for Sybase Reference Guide 2–73

Engine Status
le
is
.
GUI DATA ENTRY FIELDS
The following shows the GUI fields on the Add Monitor to TME 10 Distributed Monitoring Profile dialog for the Engine Status monitor. A description of the monitor argument follows.
State You can use this field to specify one of the availabstates as an argument to the monitor.
Enter the engine state in the text field exactly as it listed on page 2-73 (lower case with the same spacing).
—OR—
Click the Choice button next to the text field to display the State dialog. See the following example
2–74 Version 1.1

Engine Status
The S
ybaseServer
Monitoring C
ollection
k
is
Select an entry from the scrolling list of available states, then clicthe Set & Close button.
CLI SYNTAX
EngineStatus –a <engine state>
where:
–a <engine state>Specifies the state you want to check.
Note: Enter the engine state on the command line exactly as it listed on page 2-73 (lower case with the same spacing).
CLI EXAMPLEwaddmon ‘SybaseServer’ ‘EngineStatus’ -a ‘offline’ -t ‘1 minutes’ -c ‘critical’ -c ‘severe’ -c ‘warning’ -c ‘normal’ -c ‘always’ -f ‘pip:/data/Sybase/logs/engine_status.log’ “<profilename>”
Tivoli Manager for Sybase Reference Guide 2–75
Engine Status
y
SUGGESTED RESPONSE LEVELS
The following table shows suggested threshold values for severitlevels. For details, refer to the “Specifying Response Levels” section in Chapter 5, “Setting Up Monitoring Profiles,” in the Tivoli Manager for Sybase User’s Guide.
Assuming the argument offline was passed to the monitor, the following suggested response levels cause a critical response if one or more engines are found to be in an offline state.
Suggested monitoring schedule: 20 minutes
Severity Trigger When Default Action
Critical Greater than 0 Send Sybase Sentry Notice.
Severe Not applicable None
Warning Not applicable None
Normal Not applicable None
Always Not applicable None
2–76 Version 1.1
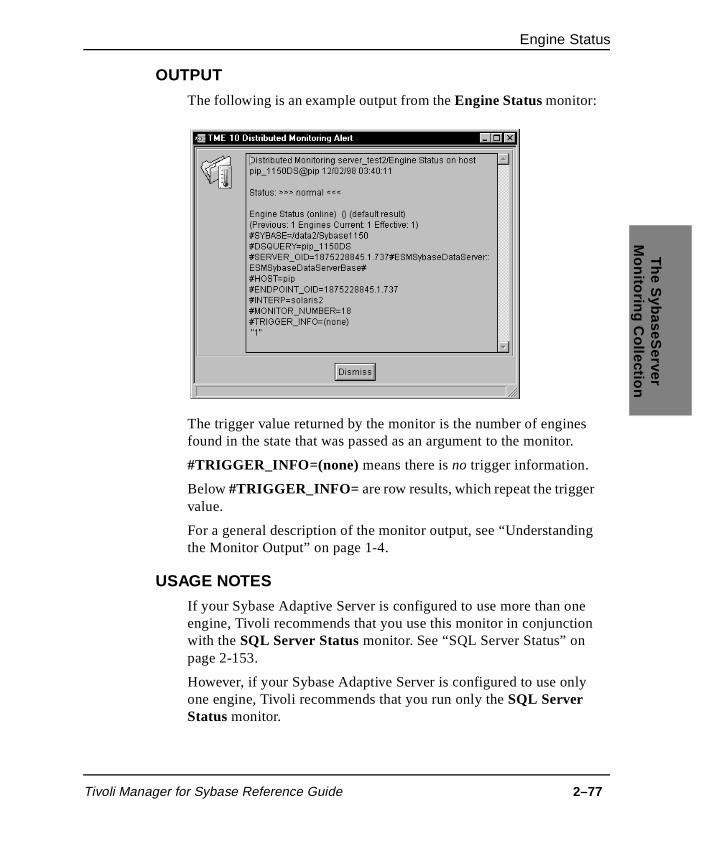
Engine Status
The S
ybaseServer
Monitoring C
ollection
s r.
ne
ly
OUTPUT
The following is an example output from the Engine Status monitor:
The trigger value returned by the monitor is the number of enginefound in the state that was passed as an argument to the monito
#TRIGGER_INFO=(none) means there is no trigger information.
Below #TRIGGER_INFO= are row results, which repeat the triggervalue.
For a general description of the monitor output, see “Understandingthe Monitor Output” on page 1-4.
USAGE NOTES
If your Sybase Adaptive Server is configured to use more than oengine, Tivoli recommends that you use this monitor in conjunction with the SQL Server Status monitor. See “SQL Server Status” on page 2-153.
However, if your Sybase Adaptive Server is configured to use onone engine, Tivoli recommends that you run only the SQL Server Status monitor.
Tivoli Manager for Sybase Reference Guide 2–77

Engine Status
SEE ALSO
The following SybaseServer monitor: SQL Server Status
2–78 Version 1.1

Free Form SQL Numeric
The S
ybaseServer
Monitoring C
ollection
’s L
g
Free Form SQL Numeric
DESCRIPTION
You can use this monitor to define a monitor that meets your sitespecific needs. This monitor runs a user-defined TRANSACT-SQselect statement that returns a numeric value.
You can define multiple monitors and run them concurrently usinthe Free Form SQL Numeric monitor. The only limitation on the number of monitors you can create is your system resources.
MONITOR NUMBER
44
AUTHORIZATION ROLE
sybase_monitor
TARGET ENDPOINT
SybaseDataServer
GUI DATA ENTRY FIELDS
The following shows the GUI fields on the Add Monitor to TME 10 Distributed Monitoring Profile dialog for the Free Form SQL Numeric monitor. Descriptions of the monitor arguments follow.
Tivoli Manager for Sybase Reference Guide 2–79
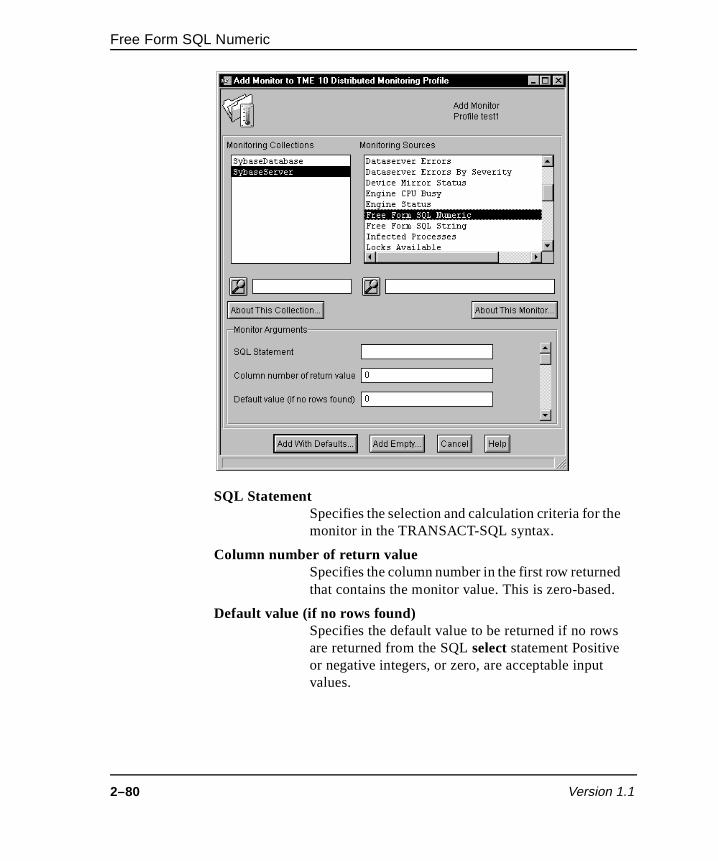
Free Form SQL Numeric
e
d .
s
SQL Statement Specifies the selection and calculation criteria for thmonitor in the TRANSACT-SQL syntax.
Column number of return value Specifies the column number in the first row returnethat contains the monitor value. This is zero-based
Default value (if no rows found) Specifies the default value to be returned if no roware returned from the SQL select statement Positive or negative integers, or zero, are acceptable input values.
2–80 Version 1.1
Free Form SQL Numeric
The S
ybaseServer
Monitoring C
ollection
e
d
of
e
CLI SYNTAX
FreeFormSQLNumeric –a <SQL_selectstatement> –a <column> –a <default>
where:
–a <SQL_selectstatement> Specifies the selection and calculation criteria in thTRANSACT-SQL syntax for the monitor.
–a <column> Specifies the column number in the first row returnethat contains the monitor value. This is zero-based.
–a <default> Specifies the value to be returned if no rows are returned from the SQL statement. Positive or negative integers, or zero, are acceptable input values.
CLI EXAMPLE
The following example creates a monitor that checks the numberdevices on the Sybase Adaptive Server to which the monitor is distributed.
waddmon ‘SybaseServer’ ‘FreeFormSQLNumeric’-a ‘select count(*) from master.dbo.sysdevices’-a ‘0’ -a ‘0’-t ‘40 minutes’-c ‘critical’-R ‘>’ ‘200’-p ‘Root_pip-region’-n ‘Sybase Sentry’-c ‘severe’-c ‘warning’-c ‘normal’-c ‘always’-f ‘pip:/database/Sybase/logs/freeform_numeric.log’"<profilename>"
In this example, the number of devices in the system table sysdevices is returned as the trigger value of the monitor. If there are more than 200 devices in the table, a critical response is generated with a pop-up window sent to Root_pip-region and a notice sent to the Sybase Sentry group. If fewer than 200 devices are in the table, thmonitor output will always be recorded in the log file defined.
No severe, warning , or normal responses are set.
Tivoli Manager for Sybase Reference Guide 2–81

Free Form SQL Numeric
pon
of
nt).
In this example, the SQL query provided to the monitor always returns a value of zero, or upwards. Therefore, in this example, the default value of zero provided to the monitor is never used.
SUGGESTED RESPONSE LEVELS
No response levels are suggested because they are dependent uthe select statement used.
Suggested monitoring schedule: None suggested.
OUTPUT
The following is an example output from the Free Form SQL Numeric monitor:
The trigger value returned by the monitor is the specified columnthe first row that is returned.
#TRIGGER_INFO=(none) means there is no trigger information.
Below #TRIGGER_INFO= are row results, which give all of the output of the SQL select statement passed as an argument to the monitor (that is, all the rows and columns returned by the stateme
2–82 Version 1.1

Free Form SQL Numeric
The S
ybaseServer
Monitoring C
ollection
of
s
is in
rride
For a general description of the monitor output, see “Understandingthe Monitor Output” on page 1-4.
USAGE NOTES
You can use the Free Form SQL Numeric monitor to define an SQL select statement (using the TRANSACT-SQL syntax) as the basisa monitor. Do not terminate the SQL statement with a semicolon (;) or forward slash (/). The select statement can return multiple columnand multiple rows.
The monitor value (the value against which the monitoring criteriaevaluated) must be a numeric value that is in one of the columnsthe first row returned by the select statement. The Column number of return value defines which column in the first row contains themonitor value (zero-based).
An SQL select statement might return no rows. By default, Tivoli Manager for Sybase treats this as an error. However, you can ovethis default behavior by providing a Default value (if no rows found) value; in which case, the monitor returns the value specified.
The SQL select statement you provide to the monitor will (unless specified otherwise) be executed on the master database. For example, “select count(*) from sysusers” will use the table master.dbo.sysusers, whereas “select count(*) from database1.dbo.sysusers” will obviously use the table database1.dbo.sysusers.
SEE ALSO
The SybaseSever monitors Free Form SQL String, and the SybaseDatabase monitors Free Form SQL Numeric and Free Form SQL String
Tivoli Manager for Sybase Reference Guide 2–83

Free Form SQL String
’s L
g
Free Form SQL String
DESCRIPTION
You can use this monitor to define a monitor that meets your sitespecific needs. This monitor runs a user-defined TRANSACT-SQselect statement that returns a string value.
You can define multiple monitors and run them concurrently usinthe Free Form SQL String monitor. The only limitation on the number of monitors you can create is your system resources.
MONITOR NUMBER
45
AUTHORIZATION ROLE
sybase_monitor
TARGET ENDPOINT
SybaseDataServer
GUI DATA ENTRY FIELDS
The following shows the GUI fields on the Add Monitor to TME 10 Distributed Monitoring Profile dialog for the Free Form SQL String monitor. Descriptions of the monitor arguments follow.
2–84 Version 1.1

Free Form SQL String
The S
ybaseServer
Monitoring C
ollection
e
d
s
SQL Statement Specifies the selection and calculation criteria for thmonitor in the TRANSACT-SQL syntax.
Column number of return value Specifies the column number in the first row returnethat contains the monitor value. This is zero-based.
Default value (if no rows found) Specifies the default value to be returned if no roware returned from the SQL select statement. Any text string is an acceptable input.
Tivoli Manager for Sybase Reference Guide 2–85

Free Form SQL String
e
is
s
ster
et the
the
CLI SYNTAX
FreeFormSQLString –a <SQL_selectstatement> –a <column> –a <default>
where:
–a <SQL_selectstatement> Specifies the selection and calculation criteria in thTRANSACT-SQL syntax for the monitor.
–a <column> Specifies the column number (zero-based), whichto contain the trigger value for the monitor, within the first row returned.
–a <default> Specifies the value to be returned if no rows are returned from the SQL statement. Any text string ian acceptable input.
CLI EXAMPLE
The following example creates a monitor that checks that the madatabase has a database identifier (dbid) of 1.
waddmon ‘SybaseServer’ ‘FreeFormSQLString’-a ‘select name, dbid from master.dbo.sysdatabases \where dbid=1’-a ‘0’-a ‘FATAL’-t ‘15 minutes’-c ‘critical’-R ‘==’ ‘FATAL’-p ‘Root_pip-region’-n ‘Sybase Sentry’-c ‘severe’-R ‘!=’ ‘master’-p ‘Root_pip-region’-n ‘Sybase Sentry’-c ‘warning’-c ‘normal’-c ‘always’-f ‘pip:/data/Sybase/logs/freeform_string_server.log’“<profilename>”
The value in the first column is the monitor value. The monitor is sto run every 15 minutes. It takes the value from the first column of first row returned by the SQL query.
In this example, the monitor returns the name of the database withID of 1.
2–86 Version 1.1

Free Form SQL String
The S
ybaseServer
Monitoring C
ollection
pon
If the database name is master, there is no problem. The name is returned as the monitor value. If the name is not master, it triggers a severe response level and sends a pop-up window to the root administrators group. It also sends a notice to the Sybase-Sentry notice group.
If no value is returned by the SQL query, the value is defaulted toFATAL . This triggers a critical response level and sends a pop-upwindow to the root administrators group. It also sends a notice to the Sybase-Sentry notice group.
No warning response level is set.
SUGGESTED RESPONSE LEVELS
No response levels are suggested because they are dependent uthe select statement used.
Suggested monitoring schedule: None suggested.
Tivoli Manager for Sybase Reference Guide 2–87
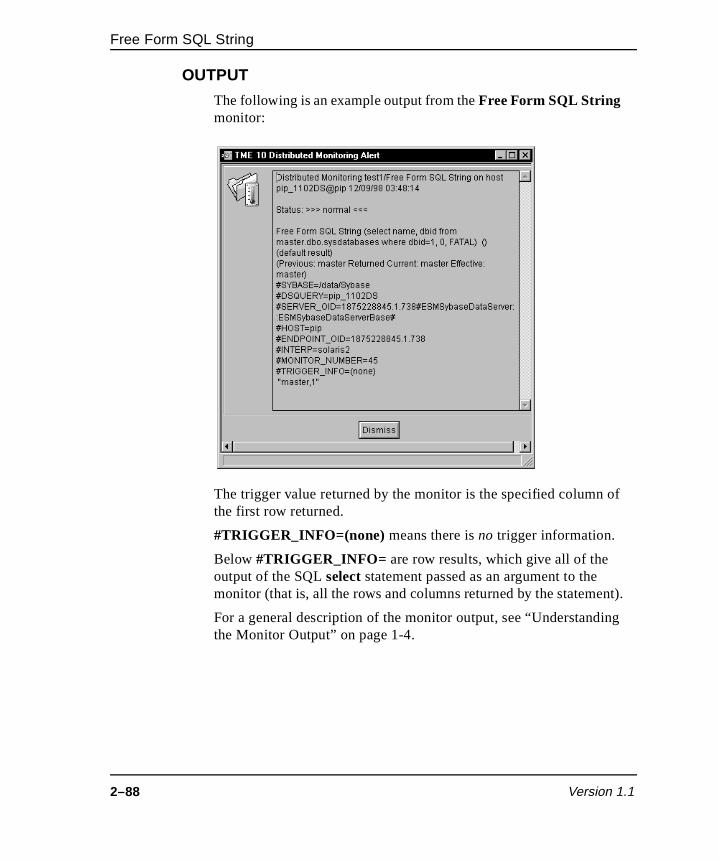
Free Form SQL String
of
nt).
ing
OUTPUT
The following is an example output from the Free Form SQL String monitor:
The trigger value returned by the monitor is the specified columnthe first row returned.
#TRIGGER_INFO=(none) means there is no trigger information.
Below #TRIGGER_INFO= are row results, which give all of the output of the SQL select statement passed as an argument to the monitor (that is, all the rows and columns returned by the stateme
For a general description of the monitor output, see “Understandthe Monitor Output” on page 1-4.
2–88 Version 1.1

Free Form SQL String
The S
ybaseServer
Monitoring C
ollection
of
s
is the
rride
USAGE NOTES
You can use the Free Form SQL String monitor to define an SQL select statement (using the TRANSACT-SQL syntax) as the basisa monitor. Do not terminate the SQL statement with a semicolon (;) or forward slash (/). The select statement can return multiple columnand multiple rows.
The monitor value (the value against which the monitoring criteriaevaluated) must be a string value that is in one of the columns infirst row returned by the select statement. The Column number of return value defines which column in the first row contains the monitor value (zero-based).
An SQL select statement might return no rows. By default, Tivoli Manager for Sybase treats this as an error. However, you can ovethis default behavior by providing a Default value (if no rows found) value; in which case, the monitor returns the value specified.
The SQL select statement you provide to the monitor will (unless specified otherwise) be executed on the master database. For example, “select name from sysusers” will use the table master.dbo.sysusers, whereas “select name from database1.dbo.sysusers” will obviously use the table database1.dbo.sysusers.
SEE ALSO
The SybaseSever monitors Free Form SQL Numeric, and the SybaseDatabase monitors Free Form SQL Numeric and Free Form SQL String
Tivoli Manager for Sybase Reference Guide 2–89

Infected Processes
from
e
Infected Processes
DESCRIPTION
This monitor reports on those processes marked as infected in the system table sysprocesses. A process is marked as infected when the server detects a serious error condition, prints a stack trace, andterminates the process. On termination, the process disappears the sysprocesses table and is not reported by the monitor. The monitor output identifies the infected process that was killed by thserver.
MONITOR NUMBER
19
AUTHORIZATION ROLE
sybase_monitor
TARGET ENDPOINT
SybaseDataServer
GUI DATA ENTRY FIELDS
None
CLI SYNTAX
InfectedProcesses
CLI EXAMPLEwaddmon ‘SybaseServer’ ‘InfectedProcesses’-t ‘1 minutes’-c ‘critical’-c ‘severe’-c ‘warning’-c ‘normal’-c ‘always’-f ‘pip:/data/Sybase/logs/infected_processes.log’“<profilename>”
2–90 Version 1.1

Infected Processes
The S
ybaseServer
Monitoring C
ollection
y n
SUGGESTED RESPONSE LEVELS
The following table shows suggested threshold values for severitlevels. For details, refer to the “Specifying Response Levels” sectioin Chapter 5, “Setting Up Monitoring Profiles,” in the Tivoli Manager for Sybase User’s Guide.
The following suggested response levels cause a critical response if any process is found to be in an infected state.
Suggested monitoring schedule: 20 minutes
Severity Trigger When Default Action
Critical Greater than 0 Send Sybase Sentry Notice.
Severe Not applicable None
Warning Not applicable None
Normal Not applicable None
Always Not applicable None
Tivoli Manager for Sybase Reference Guide 2–91

Infected Processes
ses
r r
ing
y a om
OUTPUT
The following is an example output from the Infected Processes monitor:
The trigger value returned by the monitor is the number of procesfound in an infected state.
#TRIGGER_INFO=(none) means there is no trigger information.
Below #TRIGGER_INFO= are row results, which repeat the triggevalue and give the process ID (spid) and associated program name foeach process found to be in an infected state.
For a general description of the monitor output, see “Understandthe Monitor Output” on page 1-4.
USAGE NOTES
Only rarely do processes become infected and usually this is onltransient state. The server quickly kills the process, removing it frthe system table sysprocesses. On very rare occasions, a process ismarked as infected and remains in the sysprocesses table long enough for this monitor to detect it.
2–92 Version 1.1

Infected Processes
The S
ybaseServer
Monitoring C
ollection
SEE ALSONone
Tivoli Manager for Sybase Reference Guide 2–93

Locks Available
he get r
or
ays s.
eby his
Locks Available
DESCRIPTION
This monitor allows you to track the use and availability of locks. Tmonitor reports the number of locks currently available on the tarserver. For example, if the server is configured with the parametenumber of locks to have at most 5000 locks and, when the monitis run, 3000 locks are currently in use, then this monitor will return the value 2000.
If the system runs out of locks, the Sybase Adaptive Server displa server-level error message and the users experience lock error
When a lock is in use, it blocks access to a database object, therincreasing the chances of contention for objects and deadlocks. Tpotentially decreases the performance of the server by reducing throughput of the server and lengthening response times.
MONITOR NUMBER
21
AUTHORIZATION ROLE
sybase_monitor
TARGET ENDPOINT
SybaseDataServer
GUI DATA ENTRY FIELDS
None
CLI SYNTAX
LocksAvailable
2–94 Version 1.1

Locks Available
The S
ybaseServer
Monitoring C
ollection
y n
ption
CLI EXAMPLEwaddmon ‘SybaseServer’ ‘LocksAvailable’-t ‘1 minutes’-c ‘critical’-c ‘severe’-c ‘warning’-c ‘normal’-c ‘always’-f ‘pip:/data/Sybase/logs/locks_available.log’“<profilename>”
SUGGESTED RESPONSE LEVELS
The following table shows suggested threshold values for severitlevels. For details, refer to the “Specifying Response Levels” sectioin Chapter 5, “Setting Up Monitoring Profiles,” in the Tivoli Manager for Sybase User’s Guide.
The following suggested response levels are based on the assumthat the number of locks configuration parameter is set to 5000.
Suggested monitoring schedule: 10 minutes
Severity Trigger When Default Action
Critical Less than 500 Send Sybase Sentry Notice.
Severe Less than 1000 Send Sybase Sentry Notice.
Warning Less than 1500 Send Sybase Sentry Notice.
Normal Not applicable None
Always Not applicable None
Tivoli Manager for Sybase Reference Guide 2–95
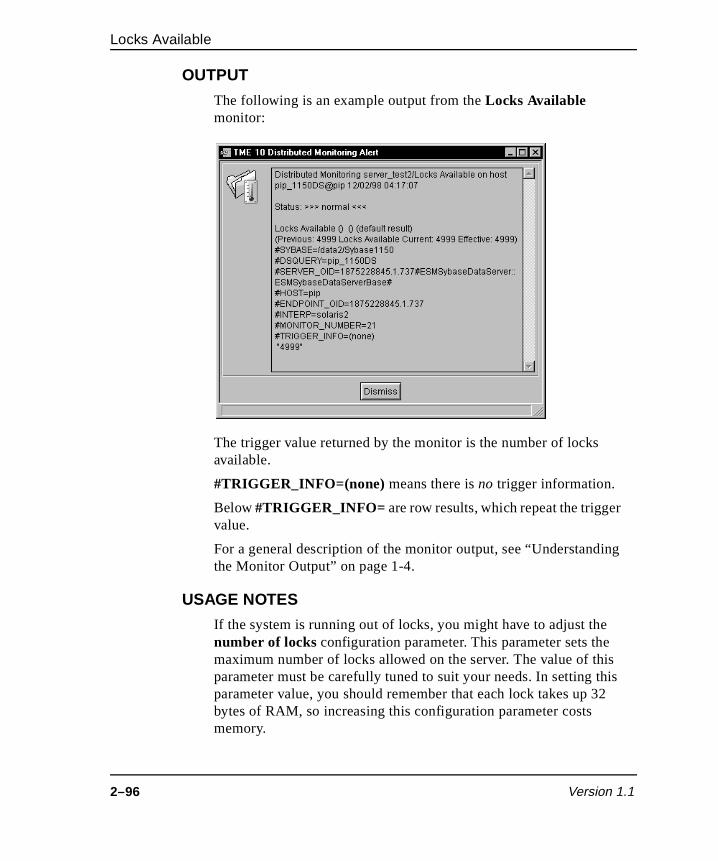
Locks Available
r
ing
is 2
OUTPUT
The following is an example output from the Locks Available monitor:
The trigger value returned by the monitor is the number of locks available.
#TRIGGER_INFO=(none) means there is no trigger information.
Below #TRIGGER_INFO= are row results, which repeat the triggevalue.
For a general description of the monitor output, see “Understandthe Monitor Output” on page 1-4.
USAGE NOTES
If the system is running out of locks, you might have to adjust thenumber of locks configuration parameter. This parameter sets themaximum number of locks allowed on the server. The value of thparameter must be carefully tuned to suit your needs. In setting thisparameter value, you should remember that each lock takes up 3bytes of RAM, so increasing this configuration parameter costs memory.
2–96 Version 1.1

Locks Available
The S
ybaseServer
Monitoring C
ollectiontions ect
ored ns
Locks block access to database objects, preventing other transacfrom accessing the data. This is called lock contention. If you suspthis is a problem on your system, then you can use the system-stprocedures sp_sysmon and sp_lock to gain further details regardingthe locks. Lock contention can be reduced by keeping transactioshort, avoiding hot spots in tables, decreasing the number of rows on each page, and tuning the lock promotion thresholds.
For most monitoring purposes, you only need to use either this monitor or one of the following: Locks In Use, Percent Locks Available, or Percent Locks Used.
SEE ALSO
The following SybaseServer monitors: Blocked Processes, Locks In Use, Percent Locks Available, and Percent Locks Used
Tivoli Manager for Sybase Reference Guide 2–97

Locks In Use
f of
eby his
Locks In Use
DESCRIPTION
This monitor allows you to track the use of locks and the number oactive locks during server activity. The monitor reports the numberlocks currently in use on the target server.
If the system runs out of locks, the Sybase Adaptive Server will display a server-level error message and the users will experience lock errors.
When a lock is in use, it blocks access to a database object, therincreasing the chances of contention for objects and deadlocks. Tpotentially decreases the performance of the server by reducing throughput of the server and lengthening response times.
MONITOR NUMBER
20
AUTHORIZATION ROLE
sybase_monitor
TARGET ENDPOINT
SybaseDataServer
GUI DATA ENTRY FIELDS
None
CLI SYNTAX
LocksInUse
2–98 Version 1.1
Locks In Use
The S
ybaseServer
Monitoring C
ollection
y n
ption
CLI EXAMPLEwaddmon ‘SybaseServer’ ‘LocksInUse’ -t ‘1 minutes’ -c ‘critical’ -c ‘severe’ -c ‘warning’ -c ‘normal’ -c ‘always’ -f ‘pip:/data/Sybase/logs/locks_in_use.log’ “<profilename>”
SUGGESTED RESPONSE LEVELS
The following table shows suggested threshold values for severitlevels. For details, refer to the “Specifying Response Levels” sectioin Chapter 5, “Setting Up Monitoring Profiles,” in the Tivoli Manager for Sybase User’s Guide.
The following suggested response levels are based on the assumthat the number of locks configuration parameter is set to 5000.
Suggested monitoring schedule: 10 minutes
Severity Trigger When Default Action
Critical Greater than 4500 Send Sybase Sentry Notice.
Severe Greater than 4000 Send Sybase Sentry Notice.
Warning Greater than 3500 Send Sybase Sentry Notice.
Normal Not applicable None
Always Not applicable None
Tivoli Manager for Sybase Reference Guide 2–99
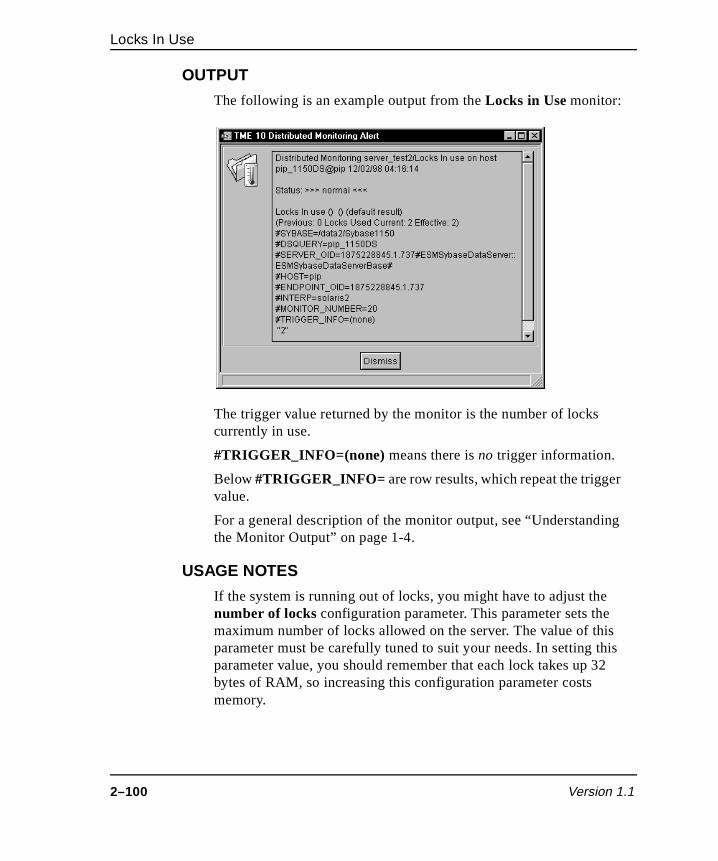
Locks In Use
r
ing
is 2
OUTPUT
The following is an example output from the Locks in Use monitor:
The trigger value returned by the monitor is the number of locks currently in use.
#TRIGGER_INFO=(none) means there is no trigger information.
Below #TRIGGER_INFO= are row results, which repeat the triggevalue.
For a general description of the monitor output, see “Understandthe Monitor Output” on page 1-4.
USAGE NOTES
If the system is running out of locks, you might have to adjust thenumber of locks configuration parameter. This parameter sets themaximum number of locks allowed on the server. The value of thparameter must be carefully tuned to suit your needs. In setting thisparameter value, you should remember that each lock takes up 3bytes of RAM, so increasing this configuration parameter costs memory.
2–100 Version 1.1

Locks In Use
The S
ybaseServer
Monitoring C
ollectiontions ect
ored ns
Locks block access to database objects, preventing other transacfrom accessing the data. This is called lock contention. If you suspthis is a problem on your system, then you can use the system-stprocedures sp_sysmon and sp_lock to gain further details regardingthe locks. Lock contention can be reduced by keeping transactioshort, avoiding hot spots in tables, decreasing the number of rows on each page, and tuning the lock promotion thresholds.
For most monitoring purposes, you only need to use either this monitor or one of the following: Locks Available, Percent Locks Available, or Percent Locks Used.
SEE ALSO
The following SybaseServer monitors: Blocked Processes, Locks Available, Percent Locks Available, and Percent Locks Used
Tivoli Manager for Sybase Reference Guide 2–101

Long Running Transactions
itor
ng Y
e
T”
. In
Long Running Transactions
DESCRIPTION
This monitor tracks processes that have been idle since the monwas last run. A process is deemed idle if in the sysprocesses system table, the following have not changed:
■ The kernel process ID
■ The amount of CPU used
■ The amount of memory allocated to the process
■ The number of disk reads and writes
You can exclude certain processes from consideration by providitheir names as arguments to this monitor. See “GUI DATA ENTRFIELDS” below or “CLI SYNTAX” on page 2-104.
This monitor returns the program name that is associated with thfirst idle process listed in sysprocesses. The monitor output also contains a list of all other processes found to be idle. See “OUTPUon page 2-105.
Use this monitor to track programs that become unexpectedly idleparticular, you can use this monitor to detect users who are occupying connections to the server, but not actually using them.
MONITOR NUMBER
22
AUTHORIZATION ROLE
sybase_monitor
TARGET ENDPOINT
SybaseDataServer
2–102 Version 1.1

Long Running Transactions
The S
ybaseServer
Monitoring C
ollection
s
s
GUI DATA ENTRY FIELDS
The following shows the GUI fields on the Add Monitor to TME 10 Distributed Monitoring Profile dialog for the Long Running Transactions monitor. A description of the monitor argument follows.
Exclude program_name(s) You can use this field to list the names of programto be excluded by the monitor.
Enter the program names in the text field exactly athey appear in the program_name column of the sysprocesses system table. For multiple program names, separate them by spaces.
Tivoli Manager for Sybase Reference Guide 2–103

Long Running Transactions
s
y
For example, to exclude all ctisql connections, enter ctisql in the field. The SQL wildcard % is supported. For example, to exclude all ctisql connections and all programs with names starting with Tiv, enter ctisql Tiv% in the field.
CLI SYNTAX
LongRunningTransactions –a <exclude program_name(s)>
where:
–a <exclude program_name(s)>
Specifies a list of program_name values to be excluded from this check.
Notes:
• Enter the program names on the command line exactly athey appear in the program_name column of the sysprocesses system table. For multiple program names, separate them by spaces.
• The SQL wildcard % is supported. To exclude all programswith names starting with Tiv, for example, enter Tiv% into the field.
CLI EXAMPLEwaddmon ‘SybaseServer’ ‘LongRunningTransactions’ -a ‘ctisql Tiv%’ -t ‘1 minutes’ -c ‘critical’ -c ‘severe’ -c ‘warning’ -c ‘normal’ -c ‘always’ -f ‘pip:/data/Sybase/logs/long_running_transactions.log’“<profilename>”
SUGGESTED RESPONSE LEVELS
The following table shows suggested threshold values for severitlevels. For details, refer to the “Specifying Response Levels” section in Chapter 5, “Setting Up Monitoring Profiles,” in the Tivoli Manager for Sybase User’s Guide.
2–104 Version 1.1

Long Running Transactions
The S
ybaseServer
Monitoring C
ollectionote
The following suggested response levels cause a warning response if any program is found to be idle since the monitor was last run. Nthat the trigger value is a blank space. No quotation marks are required.
Suggested monitoring schedule: 30 minutes
OUTPUT
The following is an example output from the Long Running Transactions monitor:
Severity Trigger When Default Action
Critical Not applicable None
Severe Not applicable None
Warning Not equal to “ ” Send Sybase Sentry Notice.
Normal Not applicable None
Always Not applicable None
Tivoli Manager for Sybase Reference Guide 2–105
Long Running Transactions
), to r the
ing
can e
se less
is
The trigger value returned by this monitor is the program name associated with the first idle process listed in the sysprocesses system table.
The trigger information (#TRIGGER_INFO= ) is the kernel process ID (kpid) of the first idle process listed in the sysprocesses system table.
Below #TRIGGER_INFO= are row results, which list the kpid, process ID (spid), name of the front-end module (program_namecumulative CPU time in clicks (cpu), amount of memory allocatedthe process (memusage), and number of disk reads and writes focurrent command (physical_io) for each idle process.
For a general description of the monitor output, see “Understandthe Monitor Output” on page 1-4.
USAGE NOTES
By setting the trigger value to be a particular program name, you monitor if that program becomes unexpectedly idle. By setting thtrigger value to be a blank space, and setting the trigger to be Not equal to, the monitor can alert you if any program (apart from thoprograms excluded by the argument to the monitor) is idle, regardof its name.
Note that the monitoring schedule is significant, since a process considered idle if certain statistics have not changed since the monitor was last run.
SEE ALSO
None
2–106 Version 1.1

Memory Usage By Process
The S
ybaseServer
Monitoring C
ollection
by t who
tify
e
f
Memory Usage By Process
DESCRIPTION
This monitor checks the amount of memory in pages being usedeach process running on the server, and returns the largest amounbeing used. The output also indicates the login name of the user initiated the process, plus the process ID.
Use this monitor to track memory usage by processes and to identhose process that are using excessive memory.
When the CPU usage value of a process reaches the value of thserver configuration parameter cpu accounting flush interval (which is used for chargeback accounting), the sysprocesses system table, including memusage values, is re-initialized. Consequently, the figures reported by this monitor might not be representative omemory usage since the server was started.
If you are not running the accounting options, setting cpu accounting flush interval to the highest possible value will result in a more accurate memory usage report by the monitor.
MONITOR NUMBER
24
AUTHORIZATION ROLE
sybase_monitor
TARGET ENDPOINT
SybaseDataServer
GUI DATA ENTRY FIELDS
None
CLI SYNTAX
MemoryUsageByProcess
Tivoli Manager for Sybase Reference Guide 2–107

Memory Usage By Process
d on
CLI EXAMPLEwaddmon ‘SybaseServer’ ‘MemoryUsageByProcess’ -t ‘1 minutes’ -c ‘critical’ -c ‘severe’ -c ‘warning’ -c ‘normal’ -c ‘always’ -f ‘pip:/data/Sybase/logs/memory_usage_by_process.log’ “<profilename>”
SUGGESTED RESPONSE LEVELS
No response levels are suggested because they must be specifiean individual site basis.
Suggested monitoring schedule: 20 minutes
OUTPUT
The following is an example output from the Memory Usage By Process monitor:
2–108 Version 1.1
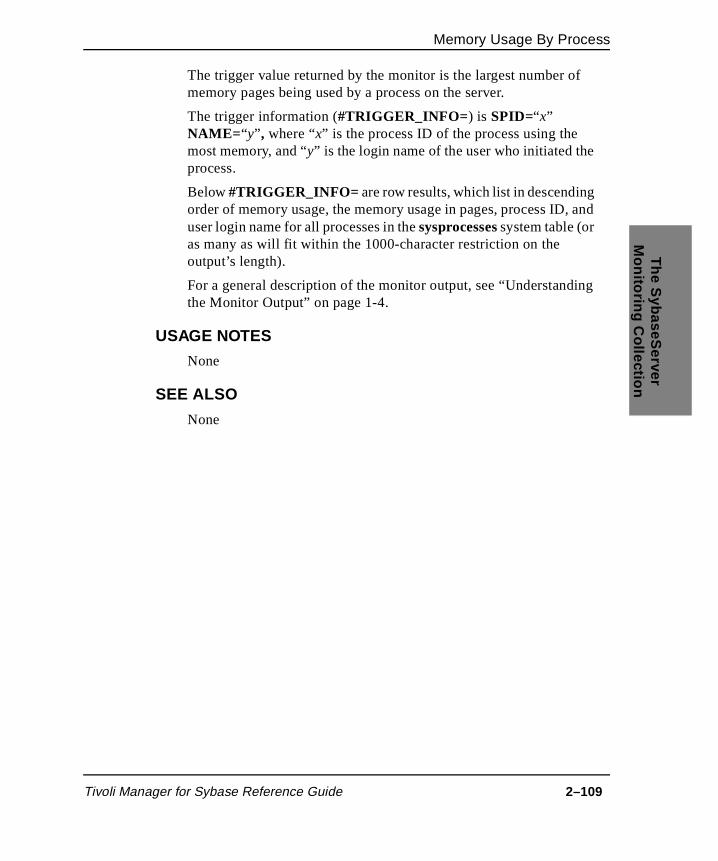
Memory Usage By Process
The S
ybaseServer
Monitoring C
ollectionf
e
and
The trigger value returned by the monitor is the largest number omemory pages being used by a process on the server.
The trigger information (#TRIGGER_INFO= ) is SPID=“x” NAME= “y” , where “x” is the process ID of the process using the most memory, and “y” is the login name of the user who initiated thprocess.
Below #TRIGGER_INFO= are row results, which list in descendingorder of memory usage, the memory usage in pages, process ID,user login name for all processes in the sysprocesses system table (or as many as will fit within the 1000-character restriction on the output’s length).
For a general description of the monitor output, see “Understandingthe Monitor Output” on page 1-4.
USAGE NOTES
None
SEE ALSO
None
Tivoli Manager for Sybase Reference Guide 2–109

Packet Errors
red kets
s m
r
Packet Errors
DESCRIPTION
This monitor returns the number of network errors that have occurwhile the Sybase Adaptive Server was sending and receiving pacsince server startup. On the average network, occasional errors are tobe expected; busier networks might experience regular errors.
Use this monitor to detect increases in the error rate. When erroroccur, the Sybase Adaptive Server will be temporarily blocked froreading or writing to the network. Therefore, a high error rate will slow the server’s access to the network and users will see sloweperformance.
MONITOR NUMBER
25
AUTHORIZATION ROLE
sybase_monitor
TARGET ENDPOINT
SybaseDataServer
GUI DATA ENTRY FIELDS
None
CLI SYNTAX
PacketErrors
CLI EXAMPLEwaddmon ‘SybaseServer’ ‘PacketErrors’ -t ‘1 minutes’ -c ‘critical’ -c ‘severe’ -c ‘warning’ -c ‘normal’ -c ‘always’ -f ‘pip:/data/Sybase/logs/packet_errors.log’“<profilename>”
2–110 Version 1.1
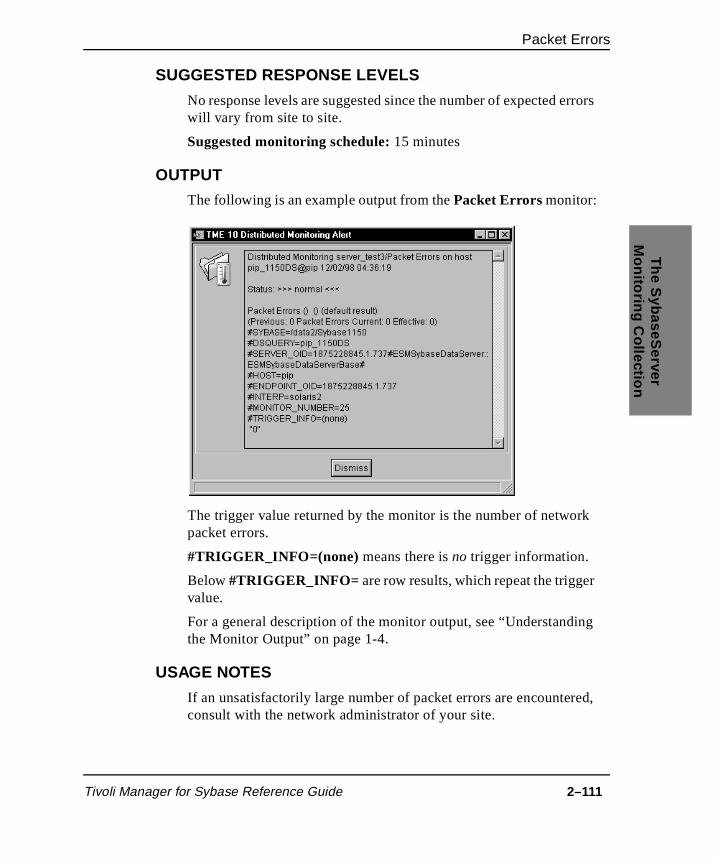
Packet Errors
The S
ybaseServer
Monitoring C
ollection
rrors
rk
ed,
SUGGESTED RESPONSE LEVELS
No response levels are suggested since the number of expected ewill vary from site to site.
Suggested monitoring schedule: 15 minutes
OUTPUT
The following is an example output from the Packet Errors monitor:
The trigger value returned by the monitor is the number of netwopacket errors.
#TRIGGER_INFO=(none) means there is no trigger information.
Below #TRIGGER_INFO= are row results, which repeat the triggervalue.
For a general description of the monitor output, see “Understandingthe Monitor Output” on page 1-4.
USAGE NOTES
If an unsatisfactorily large number of packet errors are encounterconsult with the network administrator of your site.
Tivoli Manager for Sybase Reference Guide 2–111
Packet Errors
SEE ALSO
The following SybaseServer monitors: Packets Received and Packets Sent
2–112 Version 1.1

Packets Received
The S
ybaseServer
Monitoring C
ollection
the
e
the ed ys
se any
uch
Packets Received
DESCRIPTION
This monitor returns the total number of network packets read by server since its startup. The result of this monitor indicates the amount of network traffic being generated by the server. Take thesresults in conjunction with the output of the Packets Sent monitor to gain a much clearer picture of the total network traffic related to the server. For details, see “USAGE NOTES” on page 2-115.
You can determine the total number of network packets read sincemonitor was last run by comparing the total with the value returnby the monitor when it ran previously. The previous value is alwaincluded in the monitor’s output.
Large amounts of network traffic obviously slow down the respontimes experienced by users connected to the server. Among the mways you can reduce the network traffic generated by users are the following:
■ Alter the network packet size with the configuration parameter default network packet size, which reduces the number of packets being transferred
■ Use stored procedures
■ Carefully design applications and queries
■ Circumspectly use cursors and perform backups (or other snetwork traffic generating tasks) at off-peak times
MONITOR NUMBER
26
AUTHORIZATION ROLE
sybase_monitor
TARGET ENDPOINT
SybaseDataServer
Tivoli Manager for Sybase Reference Guide 2–113

Packets Received
d on
GUI DATA ENTRY FIELDS
None
CLI SYNTAX
PacketsReceived
CLI EXAMPLEwaddmon ‘SybaseServer’ ‘PacketsReceived’ -t ‘1 minutes’ -c ‘critical’ -c ‘severe’ -c ‘warning’ -c ‘normal’ -c ‘always’ -f ‘pip:/data/Sybase/logs/packets_received.log’ “<profilename>”
SUGGESTED RESPONSE LEVELS
No response levels are suggested because they must be specifiean individual site basis.
Suggested monitoring schedule: 10 minutes
2–114 Version 1.1
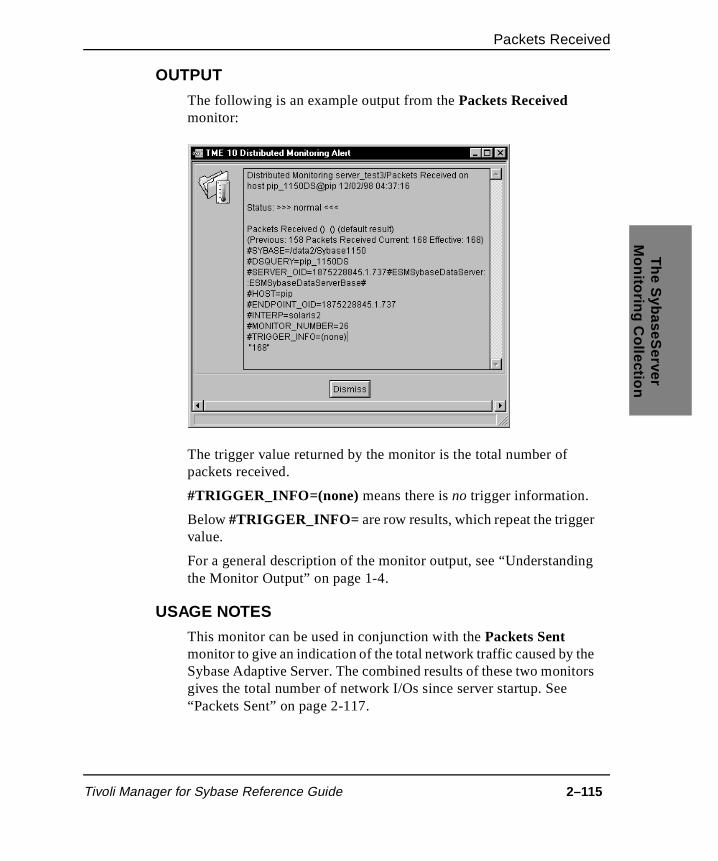
Packets Received
The S
ybaseServer
Monitoring C
ollection
tors
OUTPUT
The following is an example output from the Packets Received monitor:
The trigger value returned by the monitor is the total number of packets received.
#TRIGGER_INFO=(none) means there is no trigger information.
Below #TRIGGER_INFO= are row results, which repeat the triggervalue.
For a general description of the monitor output, see “Understandingthe Monitor Output” on page 1-4.
USAGE NOTES
This monitor can be used in conjunction with the Packets Sent monitor to give an indication of the total network traffic caused by the Sybase Adaptive Server. The combined results of these two monigives the total number of network I/Os since server startup. See “Packets Sent” on page 2-117.
Tivoli Manager for Sybase Reference Guide 2–115

Packets Received
u
er ou
ter lly
By using the Previous value provided in these monitor outputs, yocan determine the total network I/O that occurred during the last monitoring interval. You can then compare this figure to the numbof packets per second that the network can handle. In this way, ycan determine if the Sybase Adaptive Server is challenging the network bandwidth.
By altering the network packet size with the configuration paramedefault network packet size, you can reduce the actual number ofpackets being transferred. The number of packets sent is generamore important than their sizes; it is the processing time per packet that is the performance overhead.
SEE ALSO
The following SybaseServer monitors: Packet Errors and Packets Sent
2–116 Version 1.1

Packets Sent
The S
ybaseServer
Monitoring C
ollection
by or .
rk
ce
is
se any
uch
Packets Sent
DESCRIPTION
This monitor returns the total number of network packets written the Adaptive Server since server startup. The result of this monitindicates the amount of network traffic being generated by the serverTake these results in conjunction with the output of the Packets Received monitor to gain a much clearer picture of the total netwotraffic related to the server. For details, see “USAGE NOTES” onpage 2-119.
You can determine the total number of network packets written sinthe monitor was last run by comparing the total with the value returned by the monitor when it ran previously. The previous valuealways included in the monitor’s output.
Large amounts of network traffic obviously slow down the respontimes experienced by users connected to the server. Among the mways you can reduce the network traffic generated by users are the following:
■ Alter the network packet size with the configuration parameter default network packet size, which reduces the number of packets being transferred
■ Use stored procedures
■ Carefully design applications and queries
■ Circumspectly use cursors and perform backups (or other snetwork traffic generating tasks) at off-peak times
MONITOR NUMBER
27
AUTHORIZATION ROLE
sybase_monitor
TARGET ENDPOINT
SybaseDataServer
Tivoli Manager for Sybase Reference Guide 2–117
Packets Sent
d on
GUI DATA ENTRY FIELDS
None
CLI SYNTAX
PacketsSent
CLI EXAMPLEwaddmon ‘SybaseServer’ ‘PacketsSent’ -t ‘1 minutes’ -c ‘critical’ -c ‘severe’ -c ‘warning’ -c ‘normal’ -c ‘always’ -f ‘pip:/data/Sybase/logs/packets_sent.log’ “<profilename>”
SUGGESTED RESPONSE LEVELS
No response levels are suggested because they must be specifiean individual site basis.
Suggested monitoring schedule: 10 minutes
2–118 Version 1.1
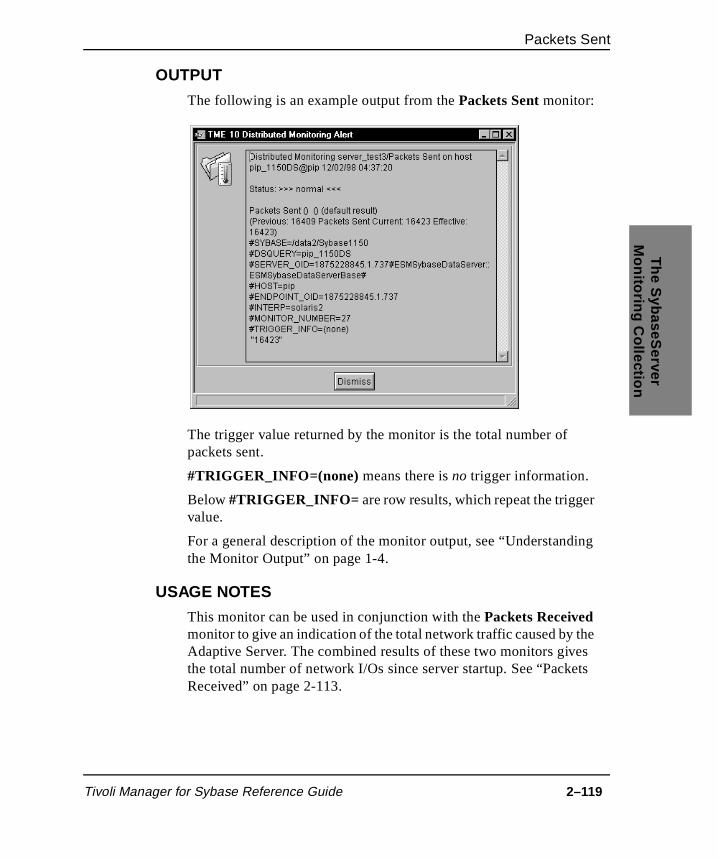
Packets Sent
The S
ybaseServer
Monitoring C
ollection
es ets
OUTPUT
The following is an example output from the Packets Sent monitor:
The trigger value returned by the monitor is the total number of packets sent.
#TRIGGER_INFO=(none) means there is no trigger information.
Below #TRIGGER_INFO= are row results, which repeat the triggervalue.
For a general description of the monitor output, see “Understandingthe Monitor Output” on page 1-4.
USAGE NOTES
This monitor can be used in conjunction with the Packets Received monitor to give an indication of the total network traffic caused by the Adaptive Server. The combined results of these two monitors givthe total number of network I/Os since server startup. See “PackReceived” on page 2-113.
Tivoli Manager for Sybase Reference Guide 2–119

Packets Sent
u
er ou
ter lly
By using the Previous value, provided in these monitor outputs, yocan determine the total network I/O that occurred during the last monitoring interval. You can then compare this figure to the numbof packets per second that the network can handle. In this way, ycan determine if the Sybase Adaptive Server is challenging the network bandwidth.
By altering the network packet size with the configuration paramedefault network packet size, you can reduce the actual number ofpackets being transferred. The number of packets sent is generamore important than their size; it is the processing time per packet that is the performance overhead.
SEE ALSO
The following SybaseServer monitors: Packet Errors and Packets Received
2–120 Version 1.1

Percent Connections Used
The S
ybaseServer
Monitoring C
ollection
e urns
of
er
er
Percent Connections Used
DESCRIPTION
This monitor returns the current number of user connections to thtarget server as a percentage of the allowable connections. It retthe percentage of connections that are used.
You use the number of user connections configuration parameter to control the maximum number of allowable connections. The valuethis parameter is included in this monitor’s output. For example, if this parameter is set to 100 and there are currently 30 user connections, this monitor will return the value 30%.
Use this monitor to alert you when the server is running out of usconnections, which can result in server access problems. This monitor is also useful for tracking client access patterns. If the monitor alerts you that connections are running out, consider eithclearing out some of the existing connections, or increasing the setting of the number of user connections parameter. For important considerations when extending the number of user connections parameter, refer to the Sybase Adaptive Server Enterprise SystemAdministration Guide.
MONITOR NUMBER
28
AUTHORIZATION ROLE
sybase_monitor
TARGET ENDPOINT
SybaseDataServer
GUI DATA ENTRY FIELDS
None
CLI SYNTAX
PercentConnectionsUsed
Tivoli Manager for Sybase Reference Guide 2–121

Percent Connections Used
y
CLI EXAMPLEwaddmon ‘SybaseServer’ ‘PercentConnectionsUsed’ -t ‘1 minutes’ -c ‘critical’ -c ‘severe’ -c ‘warning’ -c ‘normal’ -c ‘always’ -f ‘pip:/data/Sybase/logs/percent_connections_used.log’“<profilename>”
SUGGESTED RESPONSE LEVELS
The following table shows suggested threshold values for severitlevels.
For details, refer to the “Specifying Response Levels” section inChapter 5, “Setting Up Monitoring Profiles,” in the Tivoli Manager for Sybase User’s Guide.
Suggested monitoring schedule: 30 minutes
Severity Trigger When Default Action
Critical Greater than 90% Send Sybase Sentry Notice.
Severe Greater than 80% Send Sybase Sentry Notice.
Warning Greater than 70% Send Sybase Sentry Notice.
Normal Not applicable None
Always Not applicable None
2–122 Version 1.1

Percent Connections Used
The S
ybaseServer
Monitoring C
ollection
ons
,
e
OUTPUT
The following is an example output from the Percent Connections Used monitor:
The trigger value returned by the monitor is the percent connectiused.
The trigger information (#TRIGGER_INFO= ) is CURRENT=“x” MAX= “y”, where “x” is the number of connections currently in useand “y” is the maximum number of connections allowed.
Below #TRIGGER_INFO= are row results, which repeat the numbers “x” and “y”, separated by a comma (“x,y”).
For a general description of the monitor output, see “Understandingthe Monitor Output” on page 1-4.
USAGE NOTES
You will probably only need to use either this monitor or one of thfollowing monitors: Connections Available or Connections In Use
Tivoli Manager for Sybase Reference Guide 2–123

Percent Connections Used
SEE ALSO
The following SybaseServer monitors: Connections Available and Connections In Use
2–124 Version 1.1

Percent Locks Available
The S
ybaseServer
Monitoring C
ollection
e
r is set ill
ers
his
Percent Locks Available
DESCRIPTION
This monitor returns the number of locks currently available on thtarget server as a percentage of the maximum number of locks allowable.
You use the number of locks configuration parameter to control the maximum number of locks allowable. The value of this parameteincluded in this monitor’s output. For example, if this parameter is to 5000 and there are currently 3000 locks in use, this monitor wreturn the value 40%. That is, 40% of the locks are not in use and are available.
This monitor allows you to track the use of locks and monitor theavailability of locks. If the system runs out of locks, the Sybase Adaptive Server will display a server-level error message and uswill experience lock errors.
Each lock in use blocks access to a database object, thereby increasing the chances of contention for objects and deadlocks. Tpotentially decreases performance of the server by reducing throughput and lengthening response times.
MONITOR NUMBER
31
AUTHORIZATION ROLE
sybase_monitor
TARGET ENDPOINT
SybaseDataServer
GUI DATA ENTRY FIELDS
None
CLI SYNTAX
PercentLocksAvailable
Tivoli Manager for Sybase Reference Guide 2–125
Percent Locks Available
y
CLI EXAMPLEwaddmon ‘SybaseServer’ ‘PercentLocksAvailable’ -t ‘1 minutes’-c ‘critical’ -c ‘severe’ -c ‘warning’ -c ‘normal’ -c ‘always’ -f ‘pip:/data/Sybase/logs/percent_locks_available.log’ “<profilename>”
SUGGESTED RESPONSE LEVELS
The following table shows suggested threshold values for severitlevels.
For details, refer to the “Specifying Response Levels” section inChapter 5, “Setting Up Monitoring Profiles,” in the Tivoli Manager for Sybase User’s Guide.
Suggested monitoring schedule: 10 minutes
Severity Trigger When Default Action
Critical Less than 10% Send Sybase Sentry Notice.
Severe Less than 20% Send Sybase Sentry Notice.
Warning Less than 30% Send Sybase Sentry Notice.
Normal Not applicable None
Always Not applicable None
2–126 Version 1.1
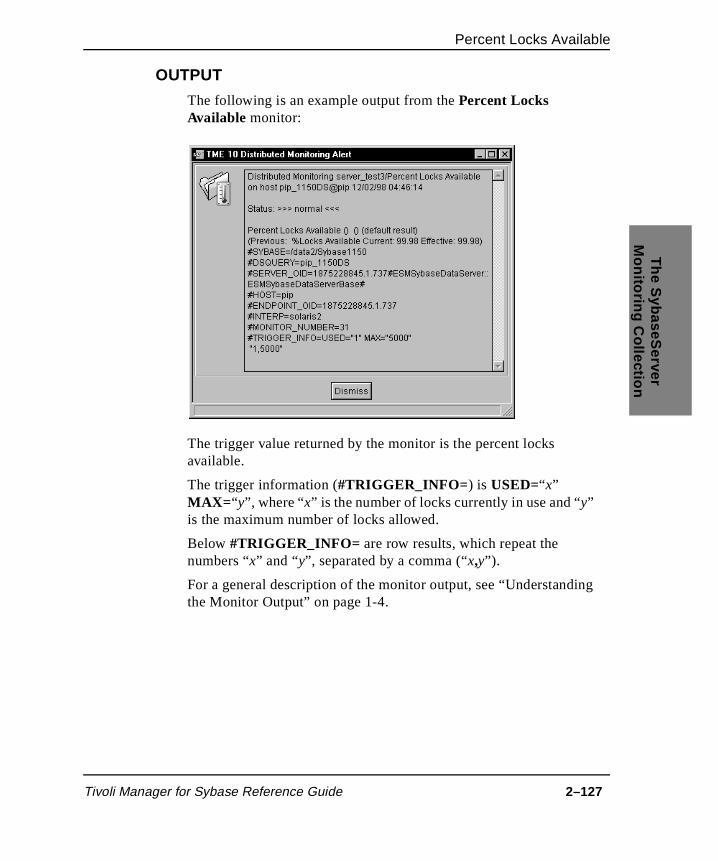
Percent Locks Available
The S
ybaseServer
Monitoring C
ollection
OUTPUT
The following is an example output from the Percent Locks Available monitor:
The trigger value returned by the monitor is the percent locks available.
The trigger information (#TRIGGER_INFO= ) is USED=“x” MAX= “y”, where “x” is the number of locks currently in use and “y” is the maximum number of locks allowed.
Below #TRIGGER_INFO= are row results, which repeat the numbers “x” and “y”, separated by a comma (“x,y”).
For a general description of the monitor output, see “Understandingthe Monitor Output” on page 1-4.
Tivoli Manager for Sybase Reference Guide 2–127

Percent Locks Available
is 2
tions ect
ored ns per
USAGE NOTES
If the system is running out of locks, you might have to adjust thenumber of locks configuration parameter. This parameter sets themaximum number of locks allowed on the server. The value of thparameter must be carefully tuned to suit your needs. In setting thisparameter value, you should remember that each lock takes up 3bytes of RAM, so increasing this configuration parameter costs memory.
Locks block access to database objects, preventing other transacfrom accessing the data. This is called lock contention. If you suspthis is a problem on your system, then you can use the system-stprocedures sp_sysmon and sp_lock to gain further details regardingthe locks. Lock contention can be reduced by keeping transactioshort, avoiding hot spots in tables, decreasing the number of rowspage, and tuning the lock promotion thresholds.
For most monitoring purposes, you only need to use either this monitor or one of the following: Locks Available, Locks In Use, or Percent Locks Used.
SEE ALSO
The following SybaseServer monitors: Blocked Processes, Locks Available, Locks In Use, and Percent Locks Used
2–128 Version 1.1

Percent Locks Used
The S
ybaseServer
Monitoring C
ollection
r is set ill
ns el
his
Percent Locks Used
DESCRIPTION
This monitor returns the number of locks currently in use on the target server as a percentage of the maximum number of locks allowable.
You use the number of locks configuration parameter to control the maximum number of locks allowable. The value of this parameteincluded in this monitor’s output. For example, if this parameter is to 5000 and there are currently 3000 locks in use, this monitor wreturn the value 60%. That is, 60% of the locks are in use and arenot available.
This monitor allows you to track the use of locks and monitor thepercentage of locks active during server activity. If the system ruout of locks, the Sybase Adaptive Server will display a server-leverror message and users will experience lock errors.
Each lock in use blocks access to a database object, thereby increasing the chances of contention for objects and deadlocks. Tpotentially decreases performance of the server by reducing throughput and slowing down response times.
MONITOR NUMBER
29
AUTHORIZATION ROLE
sybase_monitor
TARGET ENDPOINT
SybaseDataServer
GUI DATA ENTRY FIELDS
None
CLI SYNTAX
PercentLocksUsed
Tivoli Manager for Sybase Reference Guide 2–129
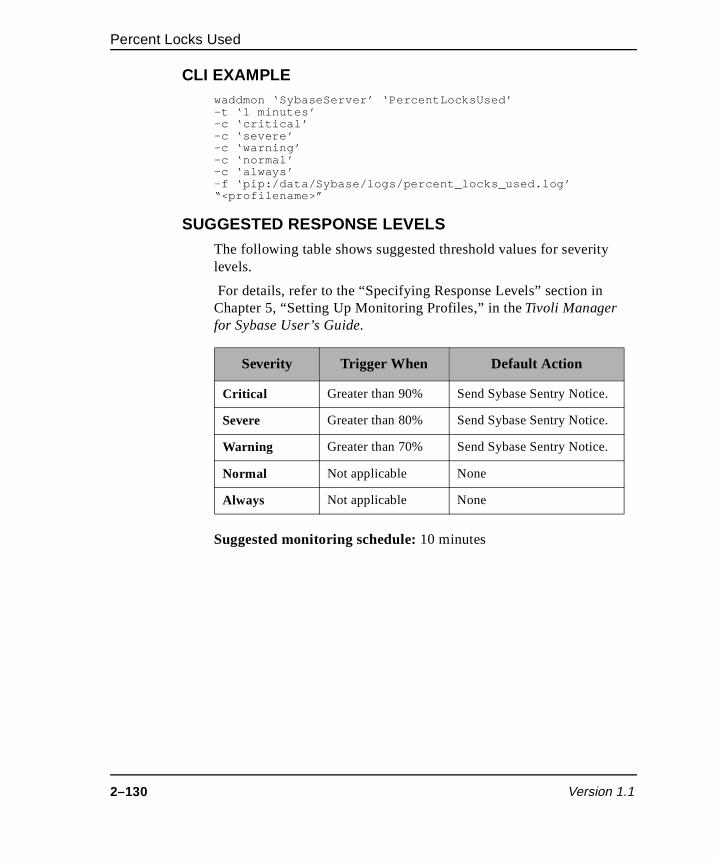
Percent Locks Used
y
CLI EXAMPLEwaddmon ‘SybaseServer’ ‘PercentLocksUsed’ -t ‘1 minutes’ -c ‘critical’ -c ‘severe’ -c ‘warning’ -c ‘normal’ -c ‘always’ -f ‘pip:/data/Sybase/logs/percent_locks_used.log’ “<profilename>”
SUGGESTED RESPONSE LEVELS
The following table shows suggested threshold values for severitlevels.
For details, refer to the “Specifying Response Levels” section inChapter 5, “Setting Up Monitoring Profiles,” in the Tivoli Manager for Sybase User’s Guide.
Suggested monitoring schedule: 10 minutes
Severity Trigger When Default Action
Critical Greater than 90% Send Sybase Sentry Notice.
Severe Greater than 80% Send Sybase Sentry Notice.
Warning Greater than 70% Send Sybase Sentry Notice.
Normal Not applicable None
Always Not applicable None
2–130 Version 1.1

Percent Locks Used
The S
ybaseServer
Monitoring C
ollection
ed.
OUTPUT
The following is an example output from the Percent Locks Used monitor:
The trigger value returned by the monitor is the percent locks us
The trigger information (#TRIGGER_INFO= ) is USED=“x” MAX= “y”, where “x” is the number of locks currently in use, and “y” is the maximum number of locks allowed.
Below #TRIGGER_INFO= are row results, which repeat the numbers “x” and “y”, separated by a comma (“x,y”).
For a general description of the monitor output, see “Understandingthe Monitor Output” on page 1-4.
Tivoli Manager for Sybase Reference Guide 2–131

Percent Locks Used
is 2
tions ect
ored ns per
USAGE NOTES
If the system is running out of locks, you might have to adjust thenumber of locks configuration parameter. This parameter sets themaximum number of locks allowed on the server. The value of thparameter must be carefully tuned to suit your needs. In setting thisparameter value, you should remember that each lock takes up 3bytes of RAM, so increasing this configuration parameter costs memory.
Locks block access to database objects, preventing other transacfrom accessing the data. This is called lock contention. If you suspthis is a problem on your system, then you can use the system-stprocedures sp_sysmon and sp_lock to gain further details regardingthe locks. Lock contention can be reduced by keeping transactioshort, avoiding hot spots in tables, decreasing the number of rowspage, and tuning the lock promotion thresholds.
For most monitoring purposes, you only need to use either this monitor or one of the following: Locks Available, Locks In Use, or Percent Locks Available.
SEE ALSO
The following SybaseServer monitors: Blocked Processes, Locks Available, Locks In Use, and Percent Locks Available
2–132 Version 1.1

Percent Transaction Log Space Used By Server
The S
ybaseServer
Monitoring C
ollection
tive
base
it
to
ue
Percent Transaction Log Space Used By Server
DESCRIPTION
This monitor evaluates each database managed by a Sybase AdapServer in turn, determining the total space available for the transaction log, then calculating the percentage of log space currentlyin use by the log.
This monitor returns the name and the percent used for the datawith the highest percentage used found, alerting you to the transaction log possibly nearest to running out of space. The rest of this monitor’s output lists the percentage of transaction log spaceused for every other database on the server (or as many as will fwithin the 1000-character restriction on the output’s length).
For example, if 10240 KB of disk space in a database is permittedhave log information (that is, sp_helpdb dbname lists this space as being log only or data and log) and the transaction log currently contains 4096 KB of information, then this monitor returns the val40% (meaning the log is 40% used).
You can use this monitor to alert you to transaction logs that are dangerously close to running out of space. Such an event would suspend the database’s operations until the log is dumped. Additionally, you can use this monitor to help you determine the optimum log size, select the optimum thresholds for the log and schedule timing of transaction log dumps.
MONITOR NUMBER
41
AUTHORIZATION ROLE
sybase_monitor
TARGET ENDPOINT
SybaseDataServer
Tivoli Manager for Sybase Reference Guide 2–133

Percent Transaction Log Space Used By Server
y
GUI DATA ENTRY FIELDS
None
CLI SYNTAX
TransactionLogSpaceUsed
CLI EXAMPLEwaddmon ‘SybaseServer’ ‘TransactionLogSpaceUsed’ -t ‘1 minutes’ -c ‘critical’ -c ‘severe’ -c ‘warning’ -c ‘normal’ -c ‘always’ -f ‘pip:/data/Sybase/logs \/transaction_log_space_used.log’ “<profilename>”
SUGGESTED RESPONSE LEVELS
The following table shows suggested threshold values for severitlevels.
For details, refer to the “Specifying Response Levels” section inChapter 5, “Setting Up Monitoring Profiles,” in the Tivoli Manager for Sybase User’s Guide.
Suggested monitoring schedule: 20 minutes
Severity Trigger When Default Action
Critical Greater than 85% Send Sybase Sentry Notice.
Severe Greater than 75% Send Sybase Sentry Notice.
Warning Greater than 65% Send Sybase Sentry Notice.
Normal Not applicable None
Always Not applicable None
2–134 Version 1.1
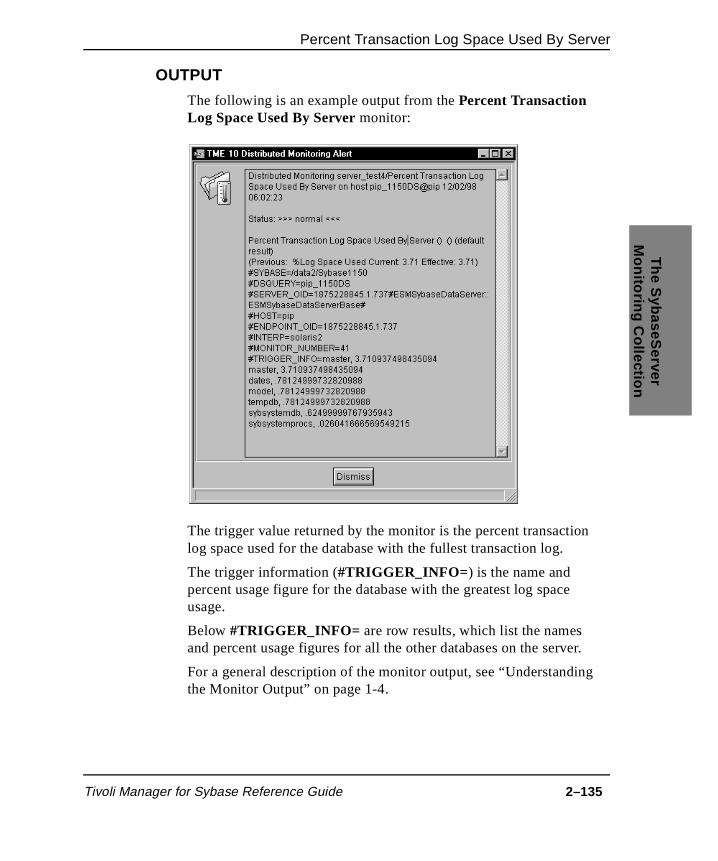
Percent Transaction Log Space Used By Server
The S
ybaseServer
Monitoring C
ollection
on
er.
OUTPUT
The following is an example output from the Percent Transaction Log Space Used By Server monitor:
The trigger value returned by the monitor is the percent transactilog space used for the database with the fullest transaction log.
The trigger information (#TRIGGER_INFO= ) is the name and percent usage figure for the database with the greatest log spaceusage.
Below #TRIGGER_INFO= are row results, which list the names and percent usage figures for all the other databases on the serv
For a general description of the monitor output, see “Understandingthe Monitor Output” on page 1-4.
Tivoli Manager for Sybase Reference Guide 2–135
Percent Transaction Log Space Used By Server
t of
the ot log
one
n the
USAGE NOTES
A high percentage returned by the monitor is not necessarily a causefor alarm. If the database is static, the remaining space might beadequate. However, a volatile database with only a small amounroom for log expansion might soon run out of space.
When the transaction log usage is determined for a database, if database is found to be in one of the following states, then it is npossible to connect to that database. Therefore, the transaction percent usage returned by the monitor for that database will be zero. The states are as follows:
■ database offline
■ database offline until recovery completes
■ database is being recovered
■ database suspect
■ database created with for load
To be alerted of the log space used by a particular database, useof the following SybaseDatabase monitors: Percent Transaction Log Space Used or Transaction Log Free Space. These monitors are applied to a particular database rather than to all databases oserver.
SEE ALSO
The following SybaseDatabase monitors: Percent Transaction Log Space Used and Transaction Log Free Space
2–136 Version 1.1
Physical IO By Process
The S
ybaseServer
Monitoring C
ollection
the e .
far, r
ho
eir
ake f
e
e
ght t
Physical IO By Process
DESCRIPTION
This monitor examines the number of disk reads and writes for all user processes on the server. For each process, it determines thamount of physical I/O so far performed by the current command
The monitor output returns the highest physical I/O found for a process. It does not report the total I/O executed by the process soonly the I/O of the current command of that process. The monitooutput gives the process ID (spid) and the login name of the user winitiated the process. Only users connected to the server are considered by this monitor—system processes with a set user ID (suid) value of zero are ignored. The remaining processes and thI/O statistics are listed in the monitor’s output.
You can use this monitor to identify processes that consistently ma high number of disk reads and writes, indicating a large amount odata access and possibly a large number of insert, update, or deleteactivities. You can also use this monitor to get an indication of thgeneral disk access patterns of the users on the server.
The sysprocesses system table is re-initialized when the CPU usagvalue reaches the value of the server configuration parameter cpu accounting flush interval (which is used to facilitate chargeback accounting). Consequently, the value reported by this monitor minot represent physical I/O of the current command. If you are norunning the accounting options, then setting cpu accounting flush interval to the highest possible value will result in a more accurate CPU usage report by this monitor.
MONITOR NUMBER
32
AUTHORIZATION ROLE
sybase_monitor
Tivoli Manager for Sybase Reference Guide 2–137

Physical IO By Process
d on
TARGET ENDPOINT
SybaseDataServer
GUI DATA ENTRY FIELDS
None
CLI SYNTAX
PhysicalIOByProcess
CLI EXAMPLEwaddmon ‘SybaseServer’ ‘PhysicalIOByProcess’ -t ‘1 minutes’ -c ‘critical’ -c ‘severe’ -c ‘warning’ -c ‘normal’ -c ‘always’ -f ‘pip:/data/Sybase/logs/physical_io_by_process.log’ “<profilename>”
SUGGESTED RESPONSE LEVELS
No response levels are suggested because they must be specifiean individual site basis.
Suggested monitoring schedule: 10 minutes
2–138 Version 1.1
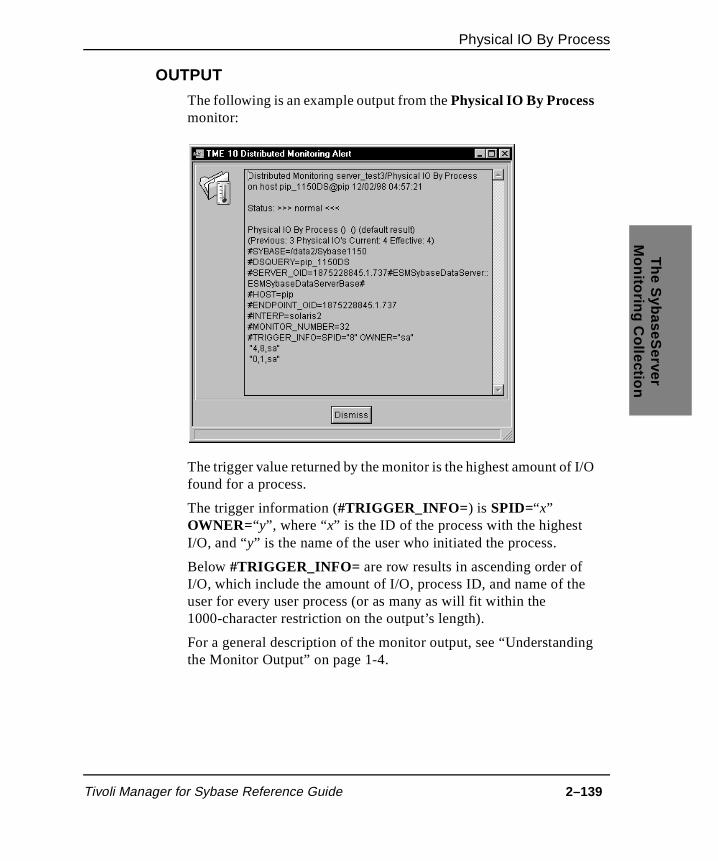
Physical IO By Process
The S
ybaseServer
Monitoring C
ollection
I/O
e
OUTPUT
The following is an example output from the Physical IO By Process monitor:
The trigger value returned by the monitor is the highest amount of found for a process.
The trigger information (#TRIGGER_INFO= ) is SPID=“x” OWNER=“y”, where “x” is the ID of the process with the highest I/O, and “y” is the name of the user who initiated the process.
Below #TRIGGER_INFO= are row results in ascending order of I/O, which include the amount of I/O, process ID, and name of thuser for every user process (or as many as will fit within the 1000-character restriction on the output’s length).
For a general description of the monitor output, see “Understandingthe Monitor Output” on page 1-4.
Tivoli Manager for Sybase Reference Guide 2–139

Physical IO By Process
r of
n o
ase be r
that
USAGE NOTES
You might want to streamline processes that make a high numbeI/Os. Examine their queries to ensure they are not reading more information than required. For example, you might need to add aindex to a table, which would prevent table scans. Another way tincrease performance might be to stagger update and insert activities to better balance the write load.
If the I/O subsystem handles queued I/O efficiently, you can increthe maximum number of asynchronous disk I/O requests that canoutstanding at one time by increasing the configuration parametemax asyn i/os per server or max async i/os per engine, or both. Setting these configuration parameters too high can overload the disksubsystem with writes. If an engine issues an asynchronous I/O would exceed max async i/os per server or max async i/os per engine, the I/O is delayed until enough outstanding I/Os have completed to fall below the limit that was exceeded.
SEE ALSO
None
2–140 Version 1.1
SLD Free Space
The S
ybaseServer
Monitoring C
ollection
t f free is
r, a t the reated e on
rver
SLD Free Space
DESCRIPTION
This monitor checks the percentage of free space on all the devices athe target server. The monitor returns the name and percentage ospace for the device with the least space available. The rest of thmonitor’s output lists percentage of free space for all other devices at the server, along with their device sizes and amount used.
Assuming the device size is constant between runs of the monitodecrease in the amount of free space on the device indicates thasize of a database has increased, or that another database was con the device. Conversely, an increase in the amount of free spaca device indicates that a database has been dropped.
You can use this monitor to track the use of all the devices at a seand to be warned when free device space is getting critically low. Such a warning might indicate the need for additional devices.
MONITOR NUMBER
33
AUTHORIZATION ROLE
sybase_monitor
TARGET ENDPOINT
SybaseDataServer
GUI DATA ENTRY FIELDS
None
CLI SYNTAX
SLDFreeSpace
Tivoli Manager for Sybase Reference Guide 2–141
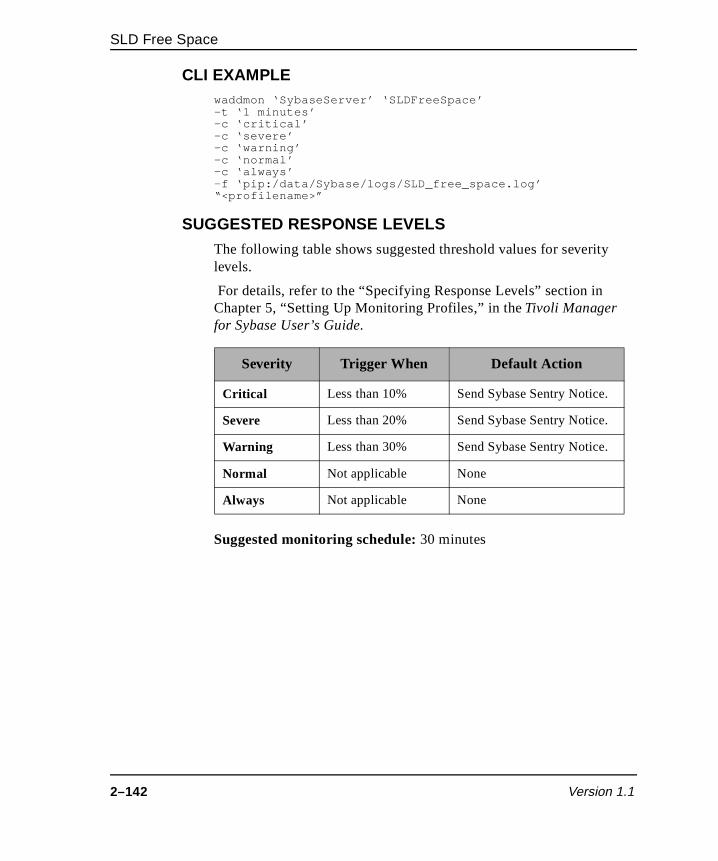
SLD Free Space
y
CLI EXAMPLEwaddmon ‘SybaseServer’ ‘SLDFreeSpace’ -t ‘1 minutes’ -c ‘critical’ -c ‘severe’ -c ‘warning’ -c ‘normal’ -c ‘always’ -f ‘pip:/data/Sybase/logs/SLD_free_space.log’ “<profilename>”
SUGGESTED RESPONSE LEVELS
The following table shows suggested threshold values for severitlevels.
For details, refer to the “Specifying Response Levels” section inChapter 5, “Setting Up Monitoring Profiles,” in the Tivoli Manager for Sybase User’s Guide.
Suggested monitoring schedule: 30 minutes
Severity Trigger When Default Action
Critical Less than 10% Send Sybase Sentry Notice.
Severe Less than 20% Send Sybase Sentry Notice.
Warning Less than 30% Send Sybase Sentry Notice.
Normal Not applicable None
Always Not applicable None
2–142 Version 1.1

SLD Free Space
The S
ybaseServer
Monitoring C
ollection
it
OUTPUT
The following is an example output from the SLD Free Space monitor:
The trigger value returned by the monitor is the percentage of free space on the device with the least free space available.
The trigger information (#TRIGGER_INFO= ) is USED=“y” SIZE=“z” NAME= “my_device”, where “y” is the space in kilobytes (KB) on the device allocated to databases (that is, used), “z” is the total size of that device (in KB), and “my_device” is the logical name of the device.
Below #TRIGGER_INFO= are row results, which include “x”, the percentage of free space on the device, and repeat “y”, “ z”, and “my_device” from the trigger information, separated by commas (“x,y,z,my_device”) for all devices at the server (or as many as will fwithin the 1000-character restriction on the output’s length).
Tivoli Manager for Sybase Reference Guide 2–143
SLD Free Space
ing
the
ver,
ing
For a general description of the monitor output, see “Understandthe Monitor Output” on page 1-4.
USAGE NOTES
This monitor enables you to keep track of all devices at one time,output giving a full breakdown of space used and free for every device. To use the monitor to report on all device usage at the serset up the monitor as response level: always. However, if there is a crucial device that you want to monitor closely, then consider settup an additional monitor: SLD Free Space By Device or SLD Space Used By Device.
SEE ALSO
The following SybaseServer monitors: SLD Free Space By Device and SLD Space Used By Device
2–144 Version 1.1
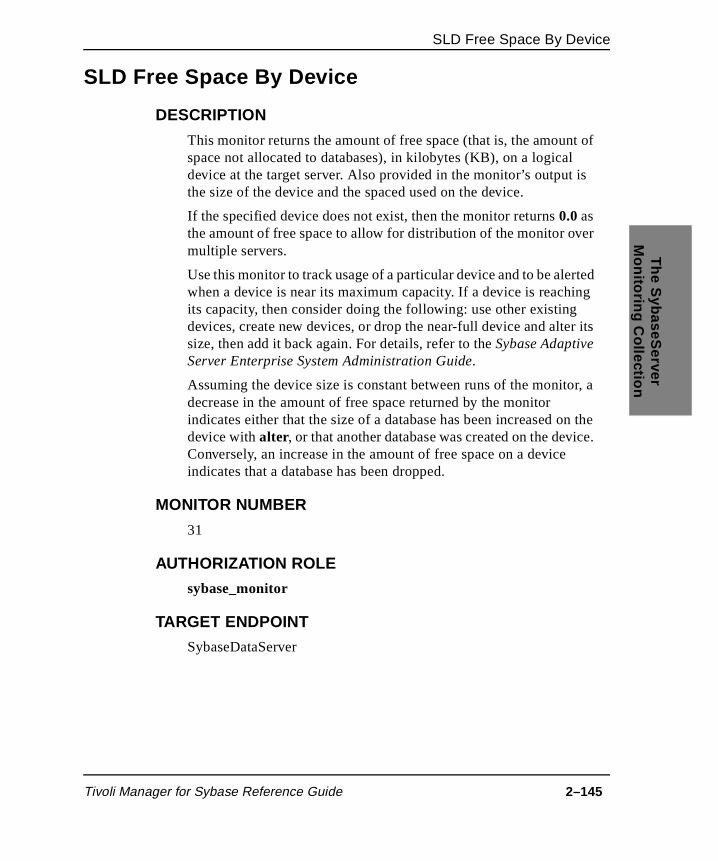
SLD Free Space By Device
The S
ybaseServer
Monitoring C
ollection
t of is
ed ing
r, a
n the ice.
SLD Free Space By Device
DESCRIPTION
This monitor returns the amount of free space (that is, the amounspace not allocated to databases), in kilobytes (KB), on a logicaldevice at the target server. Also provided in the monitor’s output the size of the device and the spaced used on the device.
If the specified device does not exist, then the monitor returns 0.0 as the amount of free space to allow for distribution of the monitor over multiple servers.
Use this monitor to track usage of a particular device and to be alertwhen a device is near its maximum capacity. If a device is reachits capacity, then consider doing the following: use other existingdevices, create new devices, or drop the near-full device and alter its size, then add it back again. For details, refer to the Sybase Adaptive Server Enterprise System Administration Guide.
Assuming the device size is constant between runs of the monitodecrease in the amount of free space returned by the monitor indicates either that the size of a database has been increased odevice with alter, or that another database was created on the devConversely, an increase in the amount of free space on a deviceindicates that a database has been dropped.
MONITOR NUMBER
31
AUTHORIZATION ROLE
sybase_monitor
TARGET ENDPOINT
SybaseDataServer
Tivoli Manager for Sybase Reference Guide 2–145

SLD Free Space By Device
e
GUI DATA ENTRY FIELDS
The following shows the GUI fields on the Add Monitor to TME 10 Distributed Monitoring Profile dialog for the SLD Free Space By Device monitor. A description of the monitor argument follows.
SLD Name You can use this field to enter the logical device namof the device you wish to monitor
The default is master, indicating the master device.
CLI SYNTAX
SLDFreeSpaceByDevice –a <logical_device_name>
–a <logical_device_name>Specifies the logical device name.
2–146 Version 1.1
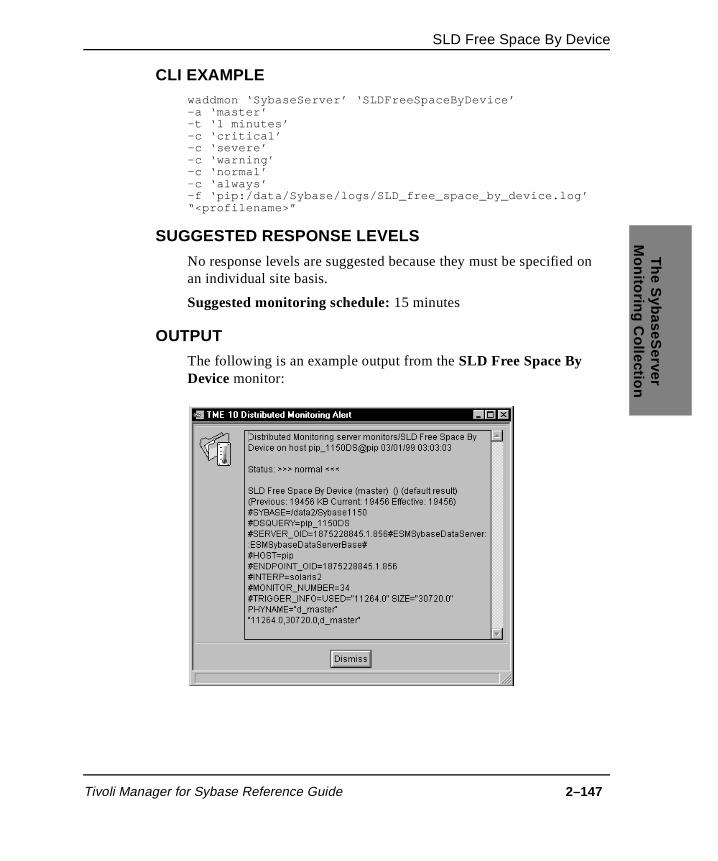
SLD Free Space By Device
The S
ybaseServer
Monitoring C
ollection
d on
CLI EXAMPLEwaddmon ‘SybaseServer’ ‘SLDFreeSpaceByDevice’ -a ‘master’ -t ‘1 minutes’ -c ‘critical’ -c ‘severe’ -c ‘warning’ -c ‘normal’ -c ‘always’ -f ‘pip:/data/Sybase/logs/SLD_free_space_by_device.log’ “<profilename>”
SUGGESTED RESPONSE LEVELS
No response levels are suggested because they must be specifiean individual site basis.
Suggested monitoring schedule: 15 minutes
OUTPUT
The following is an example output from the SLD Free Space By Device monitor:
Tivoli Manager for Sybase Reference Guide 2–147

SLD Free Space By Device
ing
ice,
ure re,
or
The trigger value returned by the monitor is the amount of free space (in KB) of the input device.
The trigger information (#TRIGGER_INFO= ) is USED=“x” SIZE=“y” PHYNAME= “z”, where “x” is the space (in KB) on the device allocated to databases, “y” is the size of that device (in KB), and “z” is the physical name of the device.
Below #TRIGGER_INFO= are row results, which repeat the numbers “x” and “y”, plus the physical name “z” from the trigger information, separated by commas (“x,y,z”).
For a general description of the monitor output, see “Understandthe Monitor Output” on page 1-4.
USAGE NOTES
If you simply want to monitor changes in the space used on a devthen you might set up the monitor to generate a critical response when the trigger value changes by 1024 KB used. This would ensthat if the device usage goes up or down by 1024 KB (1 MB) or mothen a critical response is generated.
For one device, you probably only need to use either this monitorthe SLD Space Used By Device monitor. For a broader view of device usage, you can use SLD Free Space, which monitors all the devices at the server.
SEE ALSO
The following SybaseServer monitors: SLD Free Space and SLD Space Used By Device
2–148 Version 1.1

SLD Space Used By Device
The S
ybaseServer
Monitoring C
ollection
r’s
e
the
ction e has
SLD Space Used By Device
DESCRIPTION
This monitor returns the space, in kilobytes (KB), allocated to databases on a specified device on the target server. The monitooutput also includes the size of the device, which allows you to determine the available free space on the device. However, if frespace on the device is of utmost concern, consider using the SLD Free Space By Device monitor.
If the specified device does not exist, the monitor returns 0.0; this allows for distribution of the monitor across multiple servers.
You can use this monitor to track usage of a device. Assuming the device size is constant between runs of the monitor, an increase inamount of space used returned by the monitor indicates that either thesize of a database has been increased on the device with alter, or another database was created on the device. Conversely, a reduin the amount of space used on a device indicates that a databasbeen dropped.
MONITOR NUMBER
30
AUTHORIZATION ROLE
sybase_monitor
TARGET ENDPOINT
SybaseDataServer
Tivoli Manager for Sybase Reference Guide 2–149

SLD Space Used By Device
e
GUI DATA ENTRY FIELDS
The following shows the GUI fields on the Add Monitor to TME 10 Distributed Monitoring Profile dialog for the SLD Space Used By Device monitor. A description of the monitor argument follows.
SLD Name You can use this field to enter the logical device namof the device you wish to monitor
The default is master, indicating the master device.
CLI SYNTAX
SLDSpaceUsedByDevice –a <logical_device_name>
–a <logical_device_name>Specifies the logical device name.
2–150 Version 1.1

SLD Space Used By Device
The S
ybaseServer
Monitoring C
ollection
d on
CLI EXAMPLEwaddmon ‘SybaseServer’ ‘SLDSpaceUsedByDevice’ -a ‘master’ -t ‘1 minutes’ -c ‘critical’ -c ‘severe’ -c ‘warning’ -c ‘normal’ -c ‘always’ -f ‘pip:/data/Sybase/logs/SLD_space_used_by_device.log’“<profilename>”
SUGGESTED RESPONSE LEVELS
No response levels are suggested because they must be specifiean individual site basis.
Suggested monitoring schedule: 15 minutes
OUTPUT
The following is an example output from the SLD Space Used By Device monitor:
The trigger value returned by the monitor is “x”, which is the amount of space (in KB) used on the input device.
Tivoli Manager for Sybase Reference Guide 2–151

SLD Space Used By Device
ing
nitor
r
or
The trigger information (#TRIGGER_INFO= ) is SIZE=“y” PHYNAME= “name”, where “y” is the total size of the device (in KB), and “name” is the physical name of the device.
Below #TRIGGER_INFO= are row results, which repeat “x” from the trigger value, and “y” and “name” from the trigger information, separated by commas (“x,y,name”).
For a general description of the monitor output, see “Understandthe Monitor Output” on page 1-4.
USAGE NOTES
To monitor changes in the space used on a device, set up the moto generate a critical response when the trigger value changes by 1024 KB used. This ensures that if the device usage increases odecreases by 1024 KB (1 MB) or more, a critical response is generated.
For one device, you probably only need to use either this monitorthe SLD Free Space By Device monitor. For a broader view of deviceusage, you can use SLD Free Space, which monitors all the devicesat the server.
SEE ALSO
The following SybaseServer monitors: SLD Free Space and SLD Free Space By Device
2–152 Version 1.1

SQL Server Status
The S
ybaseServer
Monitoring C
ollection
ver). nd ent ble.)
SQL Server Status
DESCRIPTION
This monitor checks the availability of the target server (SybaseDataServer, SybaseBackupServer, or SybaseMonitorSerThe monitor checks the target server to see which state it is in, areturns one of the states listed in the following table. (The equivalstate names to use in the command line are also included in the ta
State CLI State Explanation
Is Available “==” “AVAILABLE” Tivoli Manager for Sybase can connect to the server.
Is Suspect “==” “SUSPECT” Tivoli Manager for Sybase cannot connect to the server, but the server is not shut down.
Is Shutdown “==” “SHUTDOWN” The server was shut down by one of the following:• The Sybase services
manager (if server runs on NT)
• A user-issued shutdown TSQL statement
• The control panel (if server runs on NT)
• A third-party utility
Is Unavailable “!=” “AVAILABLE” The server is shut down or suspect.
Becomes Available
“->” “AVAILABLE” Last time the monitor was run the server was suspect or shut down, but is now available.
Tivoli Manager for Sybase Reference Guide 2–153

SQL Server Status
d ing
The states in this table map to the AVAILABLE, SHUTDOWN, anSUSPECT icon states for the servers described in Chapter 6, “UsTivoli Manager for Sybase,” in the Tivoli Manager for Sybase User’sGuide.
This availability check tests Tivoli's ability to connect to the server. Therefore, it does not ensure the connection and availability to all users over all configured access paths.
MONITOR NUMBER
35
AUTHORIZATION ROLE
sybase_monitor
TARGET ENDPOINT
SybaseDataServer, SybaseBackupServer, SybaseMonitorServer
GUI DATA ENTRY FIELDS
None
Becomes Suspect
“->” “SUSPECT” Last time the monitor was run the server was available or shut down, but is now suspect.
Becomes Shutdown
“->” “SHUTDOWN” Last time the monitor was run the server was suspect or available, but is now shut down.
Becomes Unavailable
“-<” “AVAILABLE” Last time the monitor was run the server was available, but is now shut down or suspect.
State CLI State Explanation
2–154 Version 1.1

SQL Server Status
The S
ybaseServer
Monitoring C
ollection
y n
own
CLI SYNTAX
SQLServerStatus
CLI EXAMPLEwaddmon ‘SybaseServer’ ‘SQLServerStatus’ -t ‘15 minutes’ -c ‘critical’ -R “==” “SUSPECT” -p Root_pip-region -c ‘severe’ -c ‘warning’ \-R “==” “SHUTDOWN” -p Root_pip-region -c ‘normal’ -c ‘always’ -f ‘pip:/data/Sybase/monitor_logs/sql_server_status.log’“<profile name>”
SUGGESTED RESPONSE LEVELS
The following table shows suggested threshold values for severitlevels. For details, refer to the “Specifying Response Levels” sectioin Chapter 5, “Setting Up Monitoring Profiles,” in the Tivoli Manager for Sybase User’s Guide.
The following suggested response levels cause a critical response when the server is in a suspect state, and cause a warning response the first time the monitor detects that the server has been shut dby an administrator.
Suggested monitoring schedule: 15 minutes
Severity Trigger When Default Action
Critical Is Suspect Send Sybase Sentry Notice.
Severe Not applicable None
Warning Becomes Shutdown Send Sybase Sentry Notice.
Normal Not applicable None
Always Not applicable None
Tivoli Manager for Sybase Reference Guide 2–155

SQL Server Status
d in
ing
nitor
OUTPUT
The following is an example output from the SQL Server Status monitor:
The trigger value returned by the monitor is one of the states listethe table on page 2-153.
#TRIGGER_INFO=(none) means there is no trigger information.
No row results follow #TRIGGER_INFO= .
For a general description of the monitor output, see “Understandthe Monitor Output” on page 1-4.
USAGE NOTES
With regard to the four becomes states listed in the table on page 2-153 (Becomes Available, Becomes Suspect, Becomes Shutdown, and Becomes Unavailable), the first time the monitor is run none ofthese states can be returned because there was no previous moreturn value to compare to the current value.
2–156 Version 1.1
SQL Server Status
The S
ybaseServer
Monitoring C
ollectionhe n.
In addition, none of the becomes states can be returned twice in succession; in other words, if one of these states is returned by tmonitor, then it cannot be returned the next time the monitor is ru
SEE ALSO
The following SybaseServer monitors: Backup Server Errors, Dataserver Errors, and Dataserver Errors By Severity
Tivoli Manager for Sybase Reference Guide 2–157
Stopped Processes
s of
ves any ted D
Stopped Processes
DESCRIPTION
This monitor returns the number of processes with a current statustopped in the sysprocesses system table. A stopped status generally occurs when a client process is terminated while the server beliethe process still exists. If a process remains in a stopped state forlength of time, the client and Adaptive Server should be investigaand, possibly, the kill command should be applied to the process I(spid) of the stopped process.
MONITOR NUMBER
36
AUTHORIZATION ROLE
sybase_monitor
TARGET ENDPOINT
SybaseDataServer
GUI DATA ENTRY FIELDS
None
CLI SYNTAX
StoppedProcesses
CLI EXAMPLEwaddmon ‘SybaseServer’ ‘StoppedProcesses’ -t ‘1 minutes’ -c ‘critical’ -c ‘severe’ -c ‘warning’ -c ‘normal’ -c ‘always’ -f ‘pip:/data/Sybase/logs/stopped_processes.log’ “<profilename>”
2–158 Version 1.1
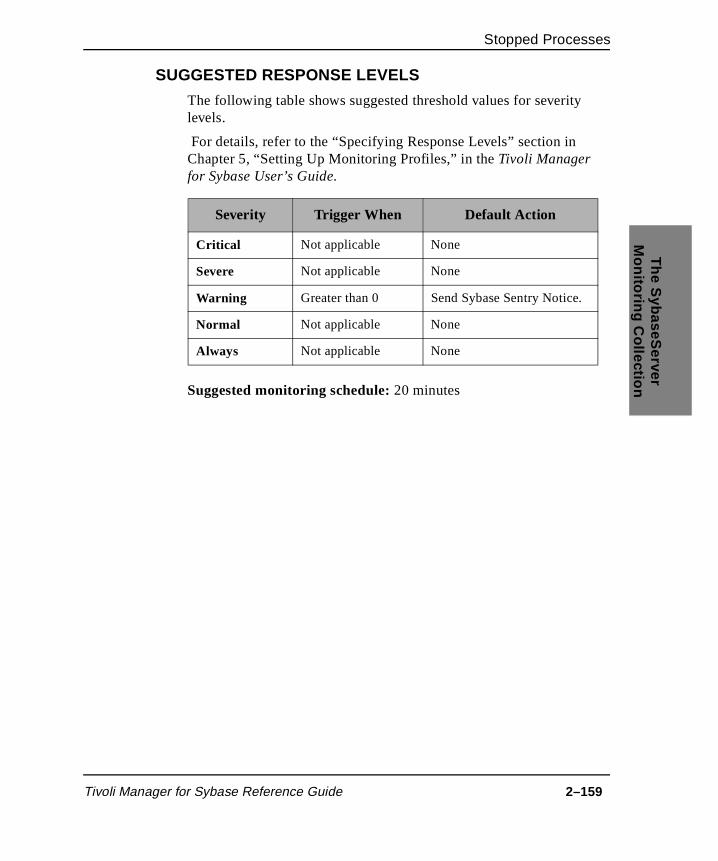
Stopped Processes
The S
ybaseServer
Monitoring C
ollection
y
SUGGESTED RESPONSE LEVELS
The following table shows suggested threshold values for severitlevels.
For details, refer to the “Specifying Response Levels” section inChapter 5, “Setting Up Monitoring Profiles,” in the Tivoli Manager for Sybase User’s Guide.
Suggested monitoring schedule: 20 minutes
Severity Trigger When Default Action
Critical Not applicable None
Severe Not applicable None
Warning Greater than 0 Send Sybase Sentry Notice.
Normal Not applicable None
Always Not applicable None
Tivoli Manager for Sybase Reference Guide 2–159

Stopped Processes
ses
or er
ing
OUTPUT
The following is an example output from the Stopped Processes monitor:
The trigger value returned by the monitor is the number of procesfound to be stopped.
#TRIGGER_INFO=(none) means there is no trigger information.
Below #TRIGGER_INFO= are row results, which are the trigger value, process ID (spid), and associated program name repeated feach stopped process (or as many as will fit within the 1000-charactrestriction on the output’s length).
For a general description of the monitor output, see “Understandthe Monitor Output” on page 1-4.
USAGE NOTES
If a process is marked as stopped, the Sybase Adaptive Server upondetecting it, usually internally issues a kill command, which removesthe process from the sysprocesses system table. Therefore, it is unusual for a process to remain in the stopped state for any length of time.
2–160 Version 1.1

Stopped Processes
The S
ybaseServer
Monitoring C
ollection
SEE ALSONone
Tivoli Manager for Sybase Reference Guide 2–161
User CPU Busy
r , the e es). eir
U
ble
00
e tem
User CPU Busy
DESCRIPTION
This monitor analyzes the amount of CPU time used by each useconnected to the server. For the user who used the most CPU timemonitor returns the CPU time as a percentage of the server’s timsince startup (averaged across all the currently configured enginThe monitor’s output also includes all the other CPU times with thassociated user IDs.
Consider the example of a user who has used one minute of CPtime, the server has been up for 50 minutes, and two engines areconfigured. The user actually had 100 minutes of CPU time availabecause there are two engines, with two CPUs. Therefore, since the user has used 1% of the available CPU time (one minute out of 1minutes available), the monitor returns the value of one.
This monitor allows you to track the percentage of CPU time eachuser is taking, enabling you to identify those who are dominating the CPU. If these users are affecting the system’s performance, then thsolution might be to reschedule their work to off-peak times. Onlyusers connected to the server are considered by this monitor—sysprocesses with a set user ID (suid) value of zero are ignored.
MONITOR NUMBER
42
AUTHORIZATION ROLE
sybase_monitor
TARGET ENDPOINT
SybaseDataServer
GUI DATA ENTRY FIELDS
None
2–162 Version 1.1

User CPU Busy
The S
ybaseServer
Monitoring C
ollection
d on
CLI SYNTAX
UserCPUBusy
CLI EXAMPLEwaddmon ‘SybaseServer’ ‘UserCPUBusy’ -t ‘1 minutes’ -c ‘critical’ -c ‘severe’ -c ‘warning’ -c ‘normal’ -c ‘always’ -f ‘pip:/data/Sybase/logs/user_CPU_busy.log’ “<profilename>”
SUGGESTED RESPONSE LEVELS
No response levels are suggested because they must be specifiean individual site basis.
Suggested monitoring schedule: 30 minutes
Tivoli Manager for Sybase Reference Guide 2–163

User CPU Busy
r
ing
ess
OUTPUT
The following is an example output from the User CPU Busy monitor:
The trigger value returned by the monitor is the percentage of CPU time.
The trigger information (#TRIGGER_INFO= ) is SUID=“x”, where “x” is the ID of the user who has used the most CPU time.
Below #TRIGGER_INFO= are row results, which include the useID and percentage of CPU time used by that user for each user connected to the server (or as many as will fit within the 1000-character restriction on the output’s length).
For a general description of the monitor output, see “Understandthe Monitor Output” on page 1-4.
USAGE NOTES
This monitor returns the percentage of CPU time used by the procsince the server started, not since the process started.
2–164 Version 1.1

User CPU Busy
The S
ybaseServer
Monitoring C
ollection, the e ly ly d, so ely
t
he
If the process and server started at approximately the same timeprocess had the opportunity to use the CPU for approximately thwhole time the server was up, so the percentage returned by themonitor tells you what percent of the CPU time the process actualused. If the process started significantly after the server, obviousthe process could not use the CPU before the process itself startethe percent returned by the monitor for that process will be relativsmall.
To track the CPU usage of later starting processes, compare thecurrent monitor output values for the process with previous outpuvalues, and track the rate of change. Alternatively, you can use tCPU By Process monitor to track these processes.
SEE ALSO
The following SybaseServer monitors: CPU By Process and Engine CPU Busy
Tivoli Manager for Sybase Reference Guide 2–165

User CPU Busy
2–166 Version 1.1

The S
ybaseDatabase
Monitoring C
ollection
e ely.
d
3The SybaseDatabase Monitoring Collection
The SybaseDatabase monitoring collection provides a range of monitoring sources for using Tivoli Manager for Sybase to managdistributed Sybase Adaptive Server computing resources effectivEach monitoring source enables you to manage a different aspect of a Sybase Adaptive Server database, such as database status antransaction log space. You can also use the Free Form SQL Numeric and Free Form SQL String user-defined monitors to create your own Sybase Adaptive Server monitoring sources.
For database-specific monitoring, you can distribute a profile containing SybaseDatabase monitors to a SybaseDatabase endpoint.
For server-specific monitoring, use this collection in conjunction with the SybaseServer monitoring collection, described in Chapter2, “The SybaseServer Monitoring Collection.”
Using monitors from both collections enables you to achieve the required range and granularity of monitoring.
3
Tivoli Manager for Sybase Reference Guide 3–1
List of SybaseDatabase Monitoring Sources by GUI and CLI Names
t
List of SybaseDatabase Monitoring Sources by GUI and CLI Names
The following table lists the SybaseDatabase monitoring sources by both their GUI and CLI names.
GUI Name CLI Name
DataBase State DataBaseState
Free Form SQL Numeric FreeFormSQLNumeric
Free Form SQL String FreeFormSQLString
Free Segment Space by Segment FreeSegmentSpaceBySegment
Percent Free Segment Space PercentFreeSegmentSpace
Percent Transaction Log Space Used
PercentTransactionLogSpaceUsed
Transaction Log Free Space TransactionLogFreeSpace
Used Segment Space by Segment UsedSegmentSpaceBySegmen
3–2 Version 1.1
Database State
The S
ybaseDatabase
Monitoring C
ollection
he the ”
Database State
DESCRIPTION
This monitor checks the status of the target database and reflects a summary of the database states on the desktop icons. The Database State monitor is designed for use on mission-critical databases that require frequent availability and status checking.
The monitor returns one of the states listed in the following table. TCLI name of the state is used when setting up the monitor, usingcommand line rather than the Tivoli desktop. See “CLI EXAMPLEon page 3-6.
State Description CLI Name
DataServer Is Unavailable
The Sybase Adaptive Server in which the database is held is unavailable (that is, shut down or suspect).
“==” “DATABASE_DS_UNAVAILABLE”
Is Suspect Database suspect; not recovered; cannot be opened or used; can be dropped only with dbcc or dbrepair.
“==” “DATABASE_SUSPECT”
Is Offline Database is offline. “==” “DATABASE_OFFLINE”
Is Read Only Inserts, deletes, and updates are not permitted on the database. Users can set this with sp_dboption.
“==” “DATABASE_READ_ONLY”
Is Single User Only one user can connect to the database. Users can set this with sp_dboption.
“==” “DATABASE_SINGLE_USER”
Tivoli Manager for Sybase Reference Guide 3–3
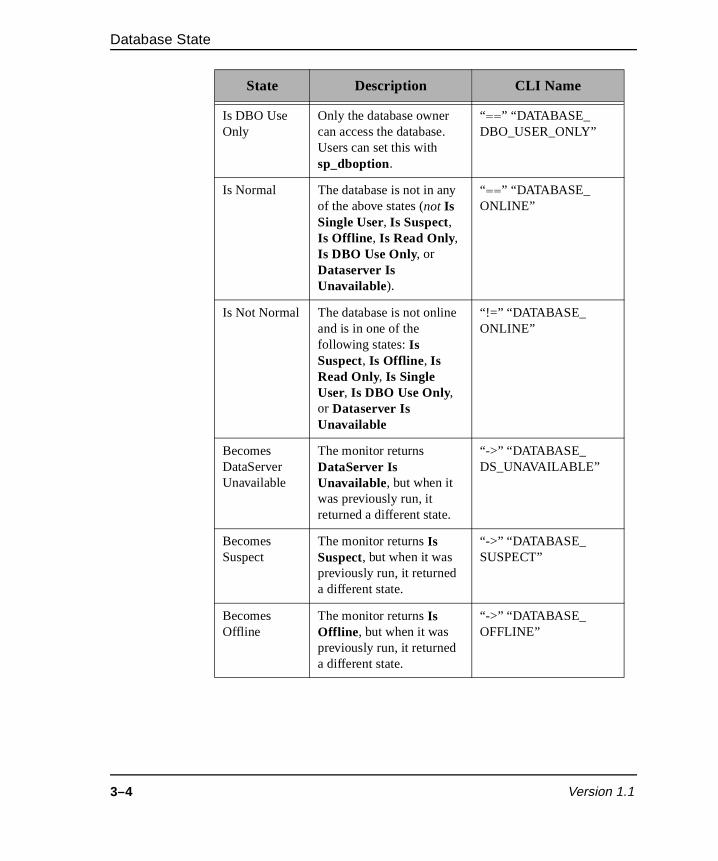
Database State
Is DBO Use Only
Only the database owner can access the database. Users can set this with sp_dboption.
“==” “DATABASE_DBO_USER_ONLY”
Is Normal The database is not in any of the above states (not Is Single User, Is Suspect, Is Offline , Is Read Only, Is DBO Use Only, or Dataserver Is Unavailable).
“==” “DATABASE_ONLINE”
Is Not Normal The database is not online and is in one of the following states: Is Suspect, Is Offline , Is Read Only, Is Single User, Is DBO Use Only, or Dataserver Is Unavailable
“!=” “DATABASE_ONLINE”
Becomes DataServer Unavailable
The monitor returns DataServer Is Unavailable, but when it was previously run, it returned a different state.
“->” “DATABASE_DS_UNAVAILABLE”
Becomes Suspect
The monitor returns Is Suspect, but when it was previously run, it returned a different state.
“->” “DATABASE_SUSPECT”
Becomes Offline
The monitor returns Is Offline , but when it was previously run, it returned a different state.
“->” “DATABASE_OFFLINE”
State Description CLI Name
3–4 Version 1.1

Database State
The S
ybaseDatabase
Monitoring C
ollection
est
Notes:
• The state of the database is determined in the sameorder as the states in the previous table, with the highpriority first. Consequently, if a database is both read only and in single-user mode, the monitor returns Is Read Only.
• These states are identical to those described for theSybaseDatabase endpoint in Chapter 6, “Using Tivoli Manager for Sybase,” in the Tivoli Manager for Sybase User’s Guide.
MONITOR NUMBER
49
Becomes Read Only
The monitor returns Is Read Only, but when it was previously run, it returned a different state.
“->” “DATABASE_READ_ONLY”
Becomes Single User
The monitor returns Is Single User, but when it was previously run, it returned a different state.
“->” “DATABASE_SINGLE_USER”
Becomes DBO Use Only
The monitor returns Is DBO Use Only, but when it was previously run, it returned a different state.
“->” “DATABASE_DBO_USER_ONLY”
Becomes Normal
The monitor returns Is Normal, but when it was previously run, it returned a different state.
“->” “DATABASE_ONLINE”
Becomes Not Normal
The monitor returns Is Not Normal, but when it was previously run, it returned Is Normal.
“-<” “DATABASE_ONLINE”
State Description CLI Name
Tivoli Manager for Sybase Reference Guide 3–5

Database State
y 5,
AUTHORIZATION ROLE
sybase_monitor
TARGET ENDPOINT
SybaseDatabase
GUI DATA ENTRY FIELDS
None
CLI SYNTAX
DatabaseState
CLI EXAMPLE
waddmon ‘SybaseDatabase’ ‘DatabaseState’-t ‘20 minutes’-c ‘critical’-R “==” “DATABASE_SUSPECT”-p Root_pip-region-c ‘severe’-c ‘warning’-R “==” “DATABASE_OFFLINE”-p Root_pip-region-c ‘normal’-c ‘always’-f ‘pip:/data/Sybase/monitor_logs/database_state.log’“Availability”
SUGGESTED RESPONSE LEVELS
The following table shows suggested threshold values for severitlevels. See the “Specifying Response Levels” section in Chapter“Setting Up Monitoring Profiles,” in the Tivoli Manager for Sybase User’s Guide.
The following suggested response levels send a critical response if the target database is found to be suspect, and a warning if the database is found to be offline.
3–6 Version 1.1

Database State
The S
ybaseDatabase
Monitoring C
ollection
Suggested monitoring schedule: 20 minutes
OUTPUT
The following is an example output from the Database State monitor:
Severity Trigger When Default Action
Critical Is Suspect Send Sybase Sentry Notice
Severe Not applicable None
Warning Is Offline Send Sybase Sentry Notice
Normal Not applicable None
Always Not applicable None
Tivoli Manager for Sybase Reference Guide 3–7

Database State
ates e he
ing
se re
ause
he n.
ase
The trigger value returned by the monitor is one of the database stlisted in the table on page 3-3. Note that the monitor will return thstate name as listed in the “CLI Name” column of that table, not t“State” column.
#TRIGGER_INFO=(none) means there is no trigger information.
There are no row results below #TRIGGER_INFO= for this monitor.
For a general description of the monitor output, see “Understandthe Monitor Output” on page 1-4.
USAGE NOTES
This monitor allows monitoring of the states of the SybaseDatabaicon on the Tivoli desktop. If additional states of the database requimonitoring (such as DDL in tran ), use the Database Status monitor, which allows further states of a database to be monitored.
With regard to the eight becomes states listed in the table on page 3-3(Becomes DataServer Unavailable, Becomes Suspect, Becomes Offline , Becomes Read Only, Becomes Single User, Becomes DBO Use Only, Becomes Normal, and Becomes Not Normal), the first time the monitor is run none of these states can be returned becthere was no previous monitor value to compare against.
In addition, none of the becomes states can be returned twice in succession; in other words, if one of these states is returned by tmonitor, then it cannot be returned the next time the monitor is ru
It is probably not necessary to set up this monitor to detect the DataServer Is Unavailable state if the SQL Server Status monitor is distributed to the Sybase Adaptive Server which holds the databyou wish to monitor.
SEE ALSO
The following SybaseServer monitor: Database Status
3–8 Version 1.1

Free Form SQL Numeric
The S
ybaseDatabase
Monitoring C
ollection
’s L
g
Free Form SQL Numeric
DESCRIPTION
You can use this monitor to define a monitor that meets your sitespecific needs. This monitor runs a user-defined TRANSACT-SQselect statement that returns a numeric value.
You can define multiple monitors and run them concurrently usinthe Free Form SQL Numeric monitor. The only limitation on the number of monitors you can create is your system resources.
MONITOR NUMBER
44
AUTHORIZATION ROLE
sybase_monitor
TARGET ENDPOINT
SybaseDatabase
GUI DATA ENTRY FIELDS
The following shows the GUI fields on the Add Monitor to TME 10 Distributed Monitoring Profile dialog for the Free Form SQL Numeric monitor. Descriptions of the monitor arguments follow.
Tivoli Manager for Sybase Reference Guide 3–9

Free Form SQL Numeric
e
d .
s
SQL Statement Specifies the selection and calculation criteria in thTRANSACT-SQL syntax for the monitor.
Column number of return value Specifies the column number in the first row returnethat contains the monitor value. This is zero-based
Default value (if no rows found) Specifies the default value to be returned if no roware returned from the SQL select statement. Positive or negative integers, or zero, are acceptable input values.
3–10 Version 1.1
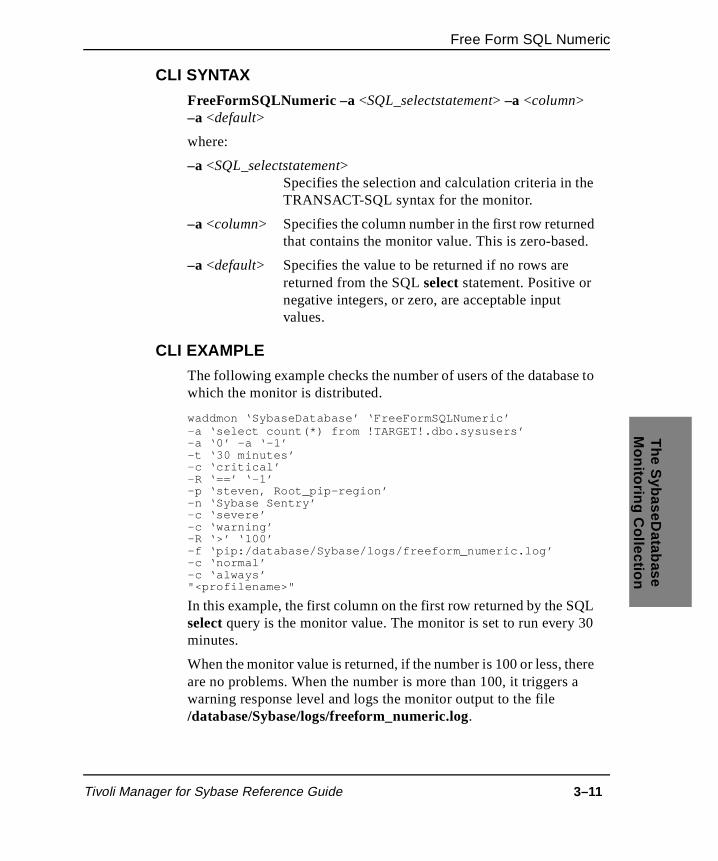
Free Form SQL Numeric
The S
ybaseDatabase
Monitoring C
ollection
e
d
e to
L 30
ere a
CLI SYNTAX
FreeFormSQLNumeric –a <SQL_selectstatement> –a <column> –a <default>
where:
–a <SQL_selectstatement> Specifies the selection and calculation criteria in thTRANSACT-SQL syntax for the monitor.
–a <column> Specifies the column number in the first row returnethat contains the monitor value. This is zero-based.
–a <default> Specifies the value to be returned if no rows are returned from the SQL select statement. Positive or negative integers, or zero, are acceptable input values.
CLI EXAMPLE
The following example checks the number of users of the databaswhich the monitor is distributed.
waddmon ‘SybaseDatabase’ ‘FreeFormSQLNumeric’-a ‘select count(*) from !TARGET!.dbo.sysusers’-a ‘0’ -a ‘-1’-t ‘30 minutes’-c ‘critical’-R ‘==’ ‘-1’-p ‘steven, Root_pip-region’-n ‘Sybase Sentry’-c ‘severe’-c ‘warning’-R ‘>’ ‘100’-f ‘pip:/database/Sybase/logs/freeform_numeric.log’-c ‘normal’-c ‘always’"<profilename>"
In this example, the first column on the first row returned by the SQselect query is the monitor value. The monitor is set to run every minutes.
When the monitor value is returned, if the number is 100 or less, thare no problems. When the number is more than 100, it triggers warning response level and logs the monitor output to the file /database/Sybase/logs/freeform_numeric.log.
Tivoli Manager for Sybase Reference Guide 3–11
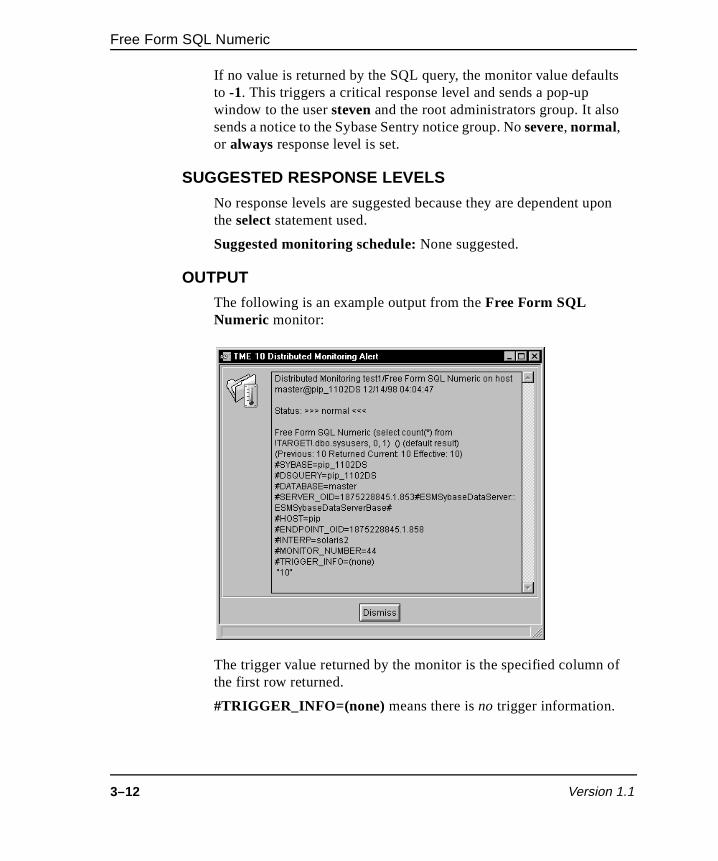
Free Form SQL Numeric
lts
pon
of
If no value is returned by the SQL query, the monitor value defauto -1. This triggers a critical response level and sends a pop-up window to the user steven and the root administrators group. It alsosends a notice to the Sybase Sentry notice group. No severe, normal, or always response level is set.
SUGGESTED RESPONSE LEVELS
No response levels are suggested because they are dependent uthe select statement used.
Suggested monitoring schedule: None suggested.
OUTPUT
The following is an example output from the Free Form SQL Numeric monitor:
The trigger value returned by the monitor is the specified columnthe first row returned.
#TRIGGER_INFO=(none) means there is no trigger information.
3–12 Version 1.1
Free Form SQL Numeric
The S
ybaseDatabase
Monitoring C
ollection
nt).
of
s
is first
rride
To e the ;
Below #TRIGGER_INFO= are row results, which give all of the output of the SQL select statement passed as an argument to the monitor (that is, all the rows and columns returned by the stateme
For a general description of the monitor output, see “Understandingthe Monitor Output” on page 1-4.
USAGE NOTES
You can use the Free Form SQL Numeric monitor to define a SQL select statement (using the TRANSACT-SQL syntax) as the basisa monitor. Do not terminate the SQL statement with a semicolon (;) or forward slash (/). The select statement can return multiple columnand multiple rows.
The monitor value (the value against which the monitoring criteriaevaluated) must be a numeric value in one of the columns in the row returned by the select statement. The Column number of return value defines which column in the first row contains the monitor value (zero-based).
A SQL select statement might return no rows. By default, Tivoli Manager for Sybase treats this as an error. However, you can ovethis default behavior by providing a Default value (if no rows found) value; in which case, the monitor returns the value specified.
The SQL select statement you provide to the monitor will be executed on the master database unless you specify otherwise. qualify an object name based upon the target database name, usreserved keyword !TARGET! . The exclamation marks are requiredsee “CLI EXAMPLE” on page 3-11. For example, select count(*) from sysusers uses the table master.dbo.sysusers, whereas select count(*) from !TARGET!.dbo. sysusers uses the sysusers table in the target database (that is, the database to which the monitor isdistributed).
SEE ALSO
The SybaseDatabase monitor Free Form SQL String, and SybaseSever monitors Free Form SQL Numeric and Free Form SQL String
Tivoli Manager for Sybase Reference Guide 3–13
Free Form SQL String
’s L
g
Free Form SQL String
DESCRIPTION
You can use this monitor to define a monitor that meets your sitespecific needs. This monitor runs a user-defined TRANSACT-SQselect statement that returns a string value.
You can define multiple monitors and run them concurrently usinthe Free Form SQL String monitor. The only limitation on the number of monitors you can create is your system resources.
MONITOR NUMBER
45
AUTHORIZATION ROLE
sybase_monitor
TARGET ENDPOINT
SybaseDatabase
GUI DATA ENTRY FIELDS
The following shows the GUI fields on the Add Monitor to TME 10 Distributed Monitoring Profile dialog for the Free Form SQL String monitor. Descriptions of the monitor arguments follow.
3–14 Version 1.1

Free Form SQL String
The S
ybaseDatabase
Monitoring C
ollection
e
d
s
SQL Statement Specifies the selection and calculation criteria in thTRANSACT-SQL syntax for the monitor.
Column number of return value Specifies the column number in the first row returnethat contains the monitor value. This is zero-based.
Default value (if no rows found) Specifies the default value to be returned if no roware returned from the SQL select statement. Any text string is an acceptable input.
Tivoli Manager for Sybase Reference Guide 3–15
Free Form SQL String
e
is
s
ry
CLI SYNTAX
FreeFormSQLString –a <SQL_selectstatement> –a <column> –a <default>
where:
–a <SQL_selectstatement> Specifies the selection and calculation criteria in thTRANSACT-SQL syntax for the monitor.
–a <column> Specifies the column number (zero-based), whichto contain the trigger value for the monitor, within the first row returned.
–a <default> Specifies the value to be returned if no rows are returned from the SQL statement. Any text string ian acceptable input.
CLI EXAMPLE
The following example creates a monitor that checks whether the target database has a guest user or not.
waddmon ‘SybaseDatabase’ ‘FreeFormSQLString’-a ‘select * from !TARGET!.dbo.sysusers where name=“guest”’-a ‘3’-a ‘no_guest’-t ‘30 minutes’-c ‘critical’-c ‘severe’-c ‘warning’-R ‘==’ ‘guest’-f ‘pip:/data/Sybase/logs/freeform_string.log’-c ‘normal’-c ‘always’“<profilename>”
In this example, the fourth column on the first row returned by theSQL select query is the monitor value. The monitor is set to run eve30 minutes.
In this example, the monitor returns the name guest, if guest is a user of the database; otherwise, the monitor returns no_guest.
3–16 Version 1.1
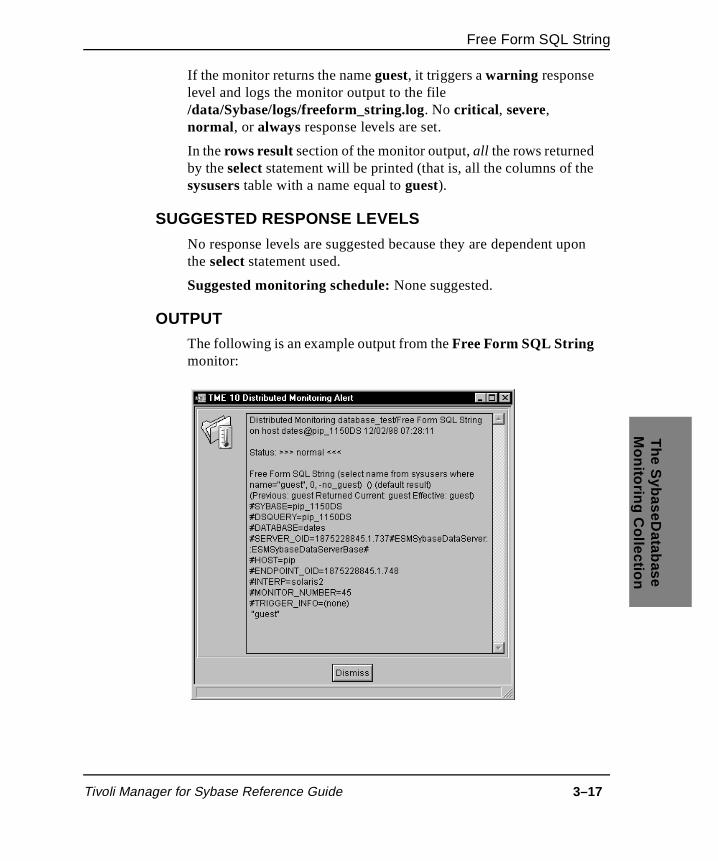
Free Form SQL String
The S
ybaseDatabase
Monitoring C
ollection
e
pon
If the monitor returns the name guest, it triggers a warning response level and logs the monitor output to the file /data/Sybase/logs/freeform_string.log. No critical , severe, normal , or always response levels are set.
In the rows result section of the monitor output, all the rows returned by the select statement will be printed (that is, all the columns of thsysusers table with a name equal to guest).
SUGGESTED RESPONSE LEVELS
No response levels are suggested because they are dependent uthe select statement used.
Suggested monitoring schedule: None suggested.
OUTPUT
The following is an example output from the Free Form SQL String monitor:
Tivoli Manager for Sybase Reference Guide 3–17
Free Form SQL String
of
nt).
ing
of
s
is row
rride
To e the ;
d).
The trigger value returned by the monitor is the specified columnthe first row returned.
#TRIGGER_INFO=(none) means there is no trigger information.
Below #TRIGGER_INFO= are row results, which give all of the output of the SQL select statement passed as an argument to the monitor (that is, all the rows and columns returned by the stateme
For a general description of the monitor output, see “Understandthe Monitor Output” on page 1-4.
USAGE NOTES
You can use the Free Form SQL String monitor to define a SQL select statement (using the TRANSACT-SQL syntax) as the basisa monitor. Do not terminate the SQL statement with a semicolon (;) or forward slash (/). The select statement can return multiple columnand multiple rows.
The monitor value (the value against which the monitoring criteriaevaluated) must be a string value in one of the columns in the first returned by the select statement. The Column number of return value defines which column in the first row contains the monitor value (zero-based).
A SQL select statement might return no rows. By default, Tivoli Manager for Sybase treats this as an error. However, you can ovethis default behavior by providing a Default value (if no rows found) value; in which case, the monitor returns the value specified.
The SQL select statement you provide to the monitor will be executed on the master database unless you specify otherwise. qualify an object name based upon the target database name, usreserved keyword !TARGET! . The exclamation marks are requiredsee “CLI EXAMPLE” on page 3-16. For example, select name from sysusers uses the table master.dbo.sysusers, whereas select name from !TARGET!.dbo.sysusers uses the sysusers table in the target database (that is, the database to which the monitor is distribute
3–18 Version 1.1

Free Form SQL String
The S
ybaseDatabase
Monitoring C
ollection
SEE ALSOThe SybaseDatabase monitor Free Form SQL Numeric, and the SybaseServer monitors Free Form SQL Numeric and Free Form SQL String
Tivoli Manager for Sybase Reference Guide 3–19

Free Segment Space By Segment
xes total ,
his
he
Free Segment Space By Segment
DESCRIPTION
This monitor checks the space currently used by data and by indein a user-specified segment on the target database and returns theunused space, in kilobytes (KB). Space allocated to data or indexesbut as yet not used, is included in the total of free space returned by the monitor. In other words, this monitor reports the space that isavailable for expansion on the specified segment.
For example, if the segment size is 10240 KB, and 1024 KB is currently in use by indexes and 5120 KB is currently in use by data, then the monitor returns 4096 KB, regardless of whether any of tfree space is part of an allocated extent.
You can use this monitor to track the free space on a segment or tomonitor its usage. If space is becoming low, consider extending tsegment with the system-stored procedure sp_extendsegment, using the alter database option to automatically extend segments, or adding new segments.
MONITOR NUMBER
46
AUTHORIZATION ROLE
sybase_monitor
TARGET ENDPOINT
SybaseDatabase
3–20 Version 1.1

Free Segment Space By Segment
The S
ybaseDatabase
Monitoring C
ollection
.
GUI DATA ENTRY FIELDS
The following shows the GUI fields on the Add Monitor to TME 10 Distributed Monitoring Profile dialog for the Free Segment Space By Segment monitor. Descriptions of the monitor arguments follow
Segment Name The name of the segment to be checked by the monitor.
The default value for this argument is default, which is the segment on which all objects (other than system tables and the transaction log) are placed,unless they are explicitly placed elsewhere.
Tivoli Manager for Sybase Reference Guide 3–21

Free Segment Space By Segment
upon
CLI SYNTAX
FreeSegmentSpaceBySegment –a <segment name>
where:
–a <segment name> Specifies the segment to check.
CLI EXAMPLE
waddmon ‘SybaseDatabase’ ‘FreeSegmentSpaceBySegment’ -a ‘default’ -t ‘1 minutes’ -c ‘critical’ -c ‘severe’ -c ‘warning’ -c ‘normal’ -c ‘always’ -f ‘pip:/data/Sybase/logs/free_segment_space.log’ "<profilename>"
SUGGESTED RESPONSE LEVELS
No response levels are suggested because they are dependent the customer’s environment.
Suggested monitoring schedule: 30 minutes
3–22 Version 1.1

Free Segment Space By Segment
The S
ybaseDatabase
Monitoring C
ollection
the
.
OUTPUT
The following is an example output from the Free Segment Space By Segment monitor:
The trigger value returned by the monitor is the unused space onsegment, in KB.
The trigger information (#TRIGGER_INFO= ) includes SIZE=“x” DATA= “y” INDEX= “z”, where “x” is the size of the segment, “y” is the amount of data currently on the segment, and “z” is the amount of space currently being used by indexes on the segment, all in KB
Below #TRIGGER_INFO= are row results, which repeat the numbers “x”, “ y”, and “z”.
For a general description of the monitor output, see “Understandingthe Monitor Output” on page 1-4.
Tivoli Manager for Sybase Reference Guide 3–23
Free Segment Space By Segment
nt, .
the at
t of
s the nces hose
then
ices, ted the
USAGE NOTES
You can set up this monitor to check either a user-defined segment or a system-defined segment. To monitor a system-defined segmeenter default, system, or logsegment as an argument to the monitorThis allows the monitor to be meaningfully distributed to any database.
However, if a specific segment name is passed as an argument tomonitor, it has relevance only on a database with a segment of thname. If the monitor is distributed to a database with no segmenthat name, then the monitor will always return zero.
This monitor checks only one segment. If you need to check all segments of a database, consider using the Percent Free Segment Space monitor.
When calculating the used space on a segment, the monitor usesegment column of the sysindexes table to determine which objectsare on the segment. So, if you enter a segment name that referethe same device as another segment, the monitor considers only tobjects assigned to the segment you entered.
For example, suppose a default segment is mapped to device dev1 and a user-defined segment seg1 is also mapped to device dev1. If you input seg1 to the monitor, it will consider the space occupied by only those objects assigned to seg1. Any objects assigned to default will not be considered, regardless of whether they are on device dev1.
In other words, if a segment shares devices with other segments, that segment’s free space reported by the monitor might not represent the free space on the devices associated with that segment. Objects might have been placed on the other segments sharing those devand those objects might be occupying space on a device associawith the first segment. If a segment does not share a device withanother segment, then that segment’s free space reported by themonitor represents the free space on the devices associated withsegment.
SEE ALSO
The following SybaseDatabase monitors: Percent Free Segment Space and Used Segment Space By Segment
3–24 Version 1.1
Percent Free Segment Space
The S
ybaseDatabase
Monitoring C
ollection
xes ates r ee
ta, y of no
s
Percent Free Segment Space
DESCRIPTION
This monitor checks the space currently used by data and by indeon all the segments defined for the target database. It then calculthe total unused space as a percentage of the segment’s total size foeach segment. The monitor returns the smallest percentage of frsegment space found. When determining the total free space on a segment, the space allocated but not used is counted as free space. The rest of this monitor’s output lists the percentage of free segmentspace for all the other segments.
For example, if the segment size is 10240 KB, and 1024 KB is currently in use by indexes and 5120 KB is currently in use by dathen the segment has 40% free space (regardless of whether anthis space is allocated). The monitor will return a value of 40% if lower percentage is found for another segment.
You can use this monitor to track the free space on all the segmentof a database. If space is becoming low on a segment, consider extending the segment with the system-stored procedure sp_extendsegment, using the alter database option to automatically extend segments, or adding new segments.
MONITOR NUMBER
48
AUTHORIZATION ROLE
sybase_monitor
TARGET ENDPOINT
SybaseDatabase
GUI DATA ENTRY FIELDS
None
Tivoli Manager for Sybase Reference Guide 3–25

Percent Free Segment Space
y
ting
CLI SYNTAX
PercentFreeSegmentSpace
CLI EXAMPLE
waddmon ‘SybaseDatabase’ ‘PercentFreeSegmentSpace’ -t ‘1 minutes’ -c ‘critical’ -c ‘severe’ -c ‘warning’ -c ‘normal’ -c ‘always’ -f ‘pip:/data/Sybase/logs/percent_free_segment_space.log’ “<profilename>”
SUGGESTED RESPONSE LEVELS
The following table shows suggested threshold values for severitlevels.
See the “Specifying Response Levels” section in Chapter 5, “SetUp Monitoring Profiles,” in the Tivoli Manager for Sybase User’s Guide.
Suggested monitoring schedule: 30 minutes
Severity Trigger When Default Action
Critical Less than 10% Send Sybase Sentry Notice
Severe Less than 20% Send Sybase Sentry Notice
Warning Less than 30% Send Sybase Sentry Notice
Normal Not applicable None
Always Not applicable None
3–26 Version 1.1
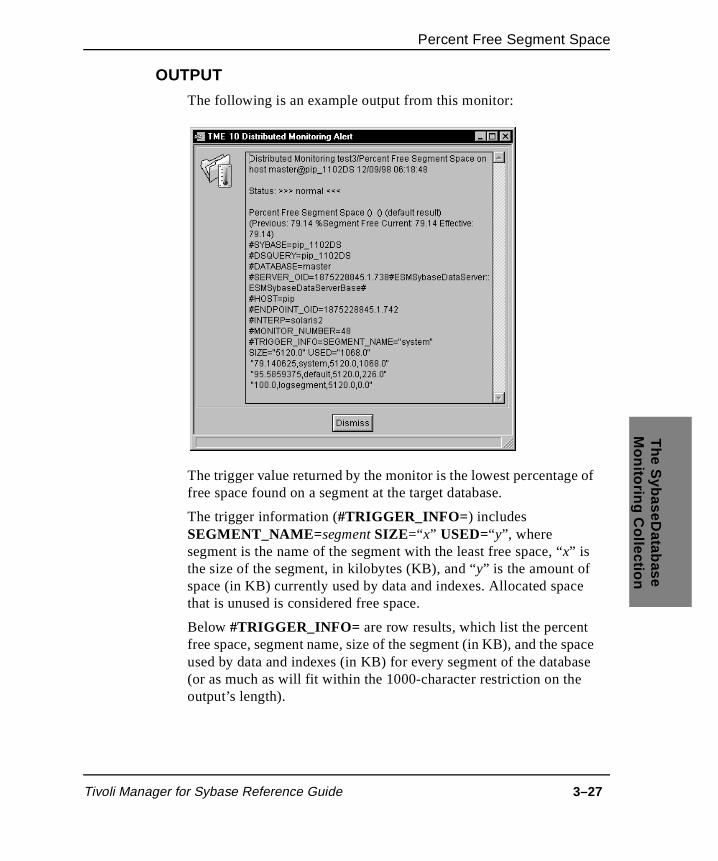
Percent Free Segment Space
The S
ybaseDatabase
Monitoring C
ollection
e of
pace ase
OUTPUT
The following is an example output from this monitor:
The trigger value returned by the monitor is the lowest percentagfree space found on a segment at the target database.
The trigger information (#TRIGGER_INFO= ) includes SEGMENT_NAME= segment SIZE=“x” USED=“y”, where segment is the name of the segment with the least free space, “x” is the size of the segment, in kilobytes (KB), and “y” is the amount of space (in KB) currently used by data and indexes. Allocated space that is unused is considered free space.
Below #TRIGGER_INFO= are row results, which list the percent free space, segment name, size of the segment (in KB), and the sused by data and indexes (in KB) for every segment of the datab(or as much as will fit within the 1000-character restriction on theoutput’s length).
Tivoli Manager for Sybase Reference Guide 3–27

Percent Free Segment Space
ing
the
s the nces hose
then
ices, ted the
For a general description of the monitor output, see “Understandthe Monitor Output” on page 1-4.
USAGE NOTES
This monitor checks the free space on all the segments of the database. If only one segment is of interest, consider using eitherUsed Segment Space By Segment or the Free Segment Space By Segment monitor.
When calculating the used space on a segment, the monitor usesegment column of the sysindexes table to determine which objectsare on the segment. So, if you input a segment name that referethe same device as another segment, the monitor considers only tobjects assigned to the input segment.
For example, suppose a default segment is mapped to device dev1 and a user-defined segment seg1 is also mapped to device dev1. If you input seg1 to the monitor, it will only consider the space occupied by those objects assigned to seg1. Any objects assigned to default will not be considered, regardless of whether they are on device dev1.
In other words, if a segment shares devices with other segments, that segment’s free space reported by the monitor might not represent the free space on the devices associated with the segment. Objects might have been placed on the other segments sharing those devand those objects might be occupying space on a device associawith the first segment. If a segment does not share a device withanother segment, then that segment’s free space reported by themonitor represents the free space on the devices associated withsegment.
SEE ALSO
The following SybaseDatabase monitors: Free Segment Space By Segment and Used Segment Space By Segment
3–28 Version 1.1
Percent Transaction Log Space Used
The S
ybaseDatabase
Monitoring C
ollection
tion used
that
s
Percent Transaction Log Space Used
DESCRIPTION
This monitor determines the total space available for the transaclog of the target database, and reports the percentage currently by that log. The monitor’s output also includes the space used in the log and the log size.
For example, if a database has 10240 KB of disk space availableis permitted to have log information (that is, sp_helpdb dbname lists this space as being log only or data and log) and the transaction logcurrently contains 4096 KB of information, then this monitor returna value of 40% (meaning the log is 40% used).
You can use this monitor to alert you to transaction logs that are dangerously close to running out of space. Such an event would suspend the database’s operations until the log is dumped. Additionally, you can use this monitor to help you determine the optimum log size, select the optimum thresholds for the log, or schedule timing of transaction log dumps.
MONITOR NUMBER
47
AUTHORIZATION ROLE
sybase_monitor
TARGET ENDPOINT
SybaseDatabase
GUI DATA ENTRY FIELDS
None
CLI SYNTAX
PercentTransactionLogSpaceUsed
Tivoli Manager for Sybase Reference Guide 3–29

Percent Transaction Log Space Used
y
ing
CLI EXAMPLE
waddmon ‘SybaseDatabase’ ‘PercentTransactionLogSpaceUsed’-t ‘1 minutes’ -c ‘critical’ -c ‘severe’ -c ‘warning’ -c ‘normal’ -c ‘always’ -f ‘pip:/data/Sybase/logs/percent_trans_log_used.log’ “<profilename>”
SUGGESTED RESPONSE LEVELS
The following table shows suggested threshold values for severitlevels.
See the “Specifying Response Levels” section in Chapter 5, “SettUp Monitoring Profiles,” in the Tivoli Manager for Sybase User’s Guide.
Suggested monitoring schedule: 20 minutes
Severity Trigger When Default Action
Critical Greater than 85% Send Sybase Sentry Notice
Severe Greater than 75% Send Sybase Sentry Notice
Warning Greater than 65% Send Sybase Sentry Notice
Normal Not applicable None
Always Not applicable None
3–30 Version 1.1
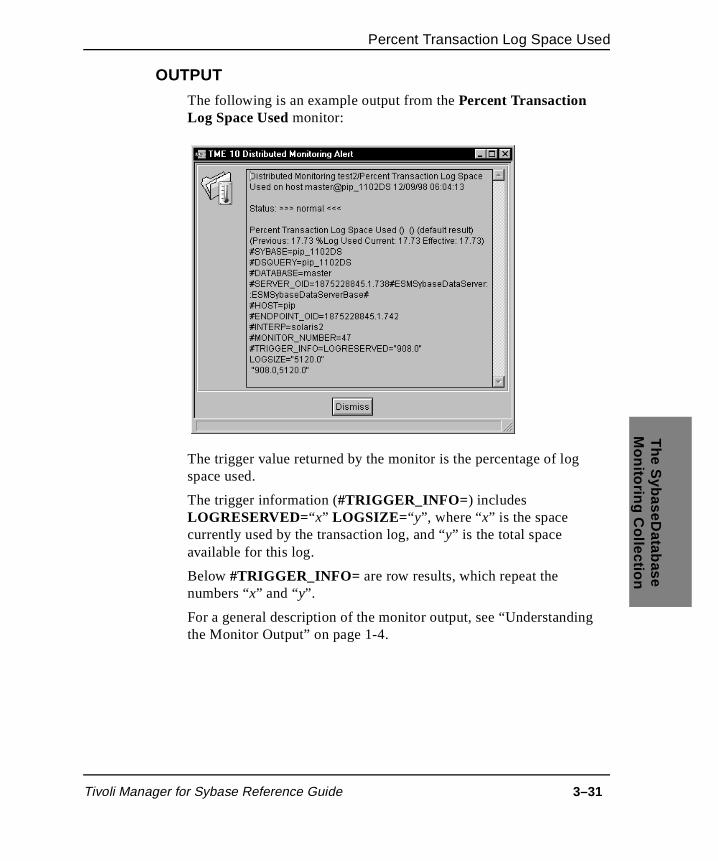
Percent Transaction Log Space Used
The S
ybaseDatabase
Monitoring C
ollection
OUTPUT
The following is an example output from the Percent Transaction Log Space Used monitor:
The trigger value returned by the monitor is the percentage of logspace used.
The trigger information (#TRIGGER_INFO= ) includes LOGRESERVED=“x” LOGSIZE= “y”, where “x” is the space currently used by the transaction log, and “y” is the total space available for this log.
Below #TRIGGER_INFO= are row results, which repeat the numbers “x” and “y”.
For a general description of the monitor output, see “Understandingthe Monitor Output” on page 1-4.
Tivoli Manager for Sybase Reference Guide 3–31

Percent Transaction Log Space Used
nly
r,
USAGE NOTES
A high usage figure returned by the monitor is not necessarily a causefor alarm. If the database is static, the space remaining for log expansion might be adequate. However, a volatile database with oa small amount of room for log expansion might soon run out of space.
To monitor the transaction logs of all the databases on the serveconsider using the Percent Transaction Log Space Used monitor defined in Chapter 2, “The SybaseServer Monitoring Collection,”which has the Sybase Adaptive Server as the target.
SEE ALSO
The SybaseDatabase monitor Transaction Log Space Used, and the SybaseServer monitor Percent Transaction Log Space Used
3–32 Version 1.1

Transaction Log Free Space
The S
ybaseDatabase
Monitoring C
ollection
tion B),
that
s
Transaction Log Free Space
DESCRIPTION
This monitor determines the total space available for the transaclog of the target database, and reports the space, in kilobytes (Kcurrently not used but available for that log.
For example, if a database has 10240 KB of disk space availableis permitted to have log information (that is, sp_helpdb dbname lists this space as being log only or data and log) and the transaction logcurrently contains 4096 KB of information, then this monitor return6144 KB as the amount of log space free.
You can use this monitor to alert you to transaction logs that are dangerously close to running out of space. Such an event would suspend the database’s operations until the log is dumped. Additionally, you can use this monitor to help you determine the optimum log size, select the optimum thresholds for the log, or schedule timing of transaction log dumps.
MONITOR NUMBER
50
AUTHORIZATION ROLE
sybase_monitor
TARGET ENDPOINT
SybaseDatabase
GUI DATA ENTRY FIELDS
None
CLI SYNTAX
TransactionLogFreeSpace
Tivoli Manager for Sybase Reference Guide 3–33
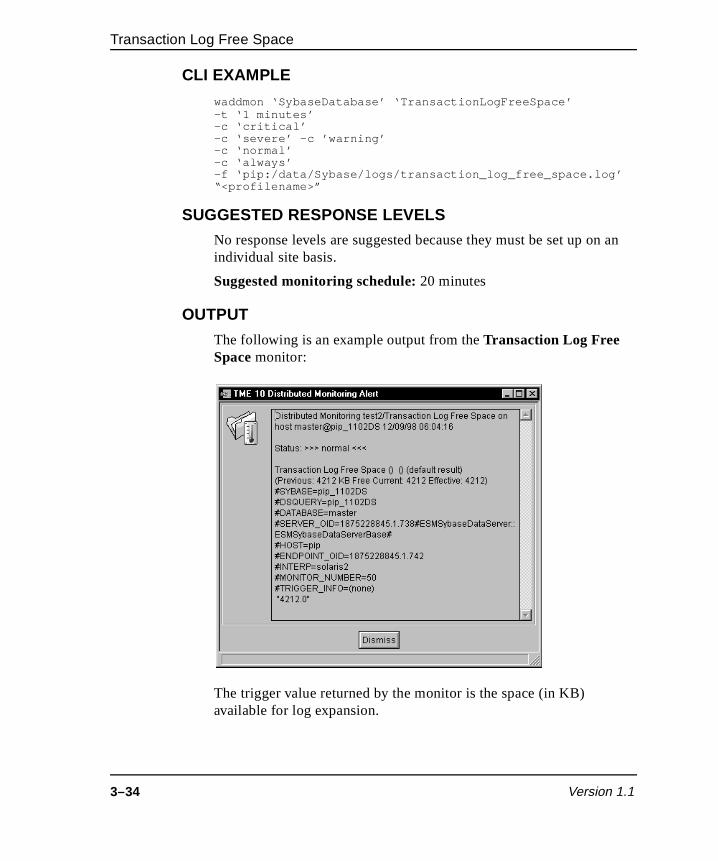
Transaction Log Free Space
on an
CLI EXAMPLE
waddmon ‘SybaseDatabase’ ‘TransactionLogFreeSpace’ -t ‘1 minutes’ -c ‘critical’ -c ‘severe’ -c ’warning’ -c ‘normal’ -c ‘always’ -f ‘pip:/data/Sybase/logs/transaction_log_free_space.log’ “<profilename>”
SUGGESTED RESPONSE LEVELS
No response levels are suggested because they must be set up individual site basis.
Suggested monitoring schedule: 20 minutes
OUTPUT
The following is an example output from the Transaction Log Free Space monitor:
The trigger value returned by the monitor is the space (in KB) available for log expansion.
3–34 Version 1.1
Transaction Log Free Space
The S
ybaseDatabase
Monitoring C
ollection
uate. r
r,
#TRIGGER_INFO=(none) means there is no trigger information.
Below #TRIGGER_INFO= are row results, which repeat the triggervalue.
For a general description of the monitor output, see “Understandingthe Monitor Output” on page 1-4.
USAGE NOTES
A low free-space figure returned by the monitor is not necessarily a cause for alarm. If the database is static, this space might be adeqHowever, a volatile database with only a small amount of room folog expansion might soon run out of space.
To monitor the transaction logs of all the databases on the serveconsider using the SybaseServer monitor Percent Transaction Log Space Used.
SEE ALSO
The SybaseDatabase monitor Percent Transaction Log Space Used, and the SybaseServer monitor Percent Transaction Log Space Used
Tivoli Manager for Sybase Reference Guide 3–35
Used Segment Space By Segment
xes the sed
ent
.
Used Segment Space By Segment
DESCRIPTION
This monitor checks the space currently used by data and by indein a user-specified segment on the target database, and returns total used space, in kilobytes (KB). The space allocated but not uis considered free space and not included in the total returned by themonitor.
For example, if the segment size is 10240 KB, and 1024 KB is currently in use by indexes and 5120 KB is currently in use by data, then the monitor returns 6144 KB (regardless of whether the remaining 4096 KB is part of an allocated extent).
You can use this monitor to track the space used on a specified segment of the database and the growth rate of data. If space is becoming low on a segment, consider either extending the segmwith the system-stored procedure sp_extendsegment, using the alter database option to automatically extend segments, or adding newsegments.
MONITOR NUMBER
51
AUTHORIZATION ROLE
sybase_monitor
TARGET ENDPOINT
SybaseDatabase
GUI DATA ENTRY FIELDS
The following shows the GUI fields on the Add Monitor to TME 10 Distributed Monitoring Profile dialog for the Used Segment Space By Segment monitor. Descriptions of the monitor arguments follow
3–36 Version 1.1

Used Segment Space By Segment
The S
ybaseDatabase
Monitoring C
ollection
by
m ey
Segment Name Specifies the name of the segment to be checkedthe monitor.
The default value for this field is default, which is the segment on which all objects (other than systetables and the transaction log) are placed, unless thare explicitly placed elsewhere.
Tivoli Manager for Sybase Reference Guide 3–37
Used Segment Space By Segment
on an
CLI SYNTAX
UsedSegmentSpaceBySegment –a <segment name>
where:
–a <segment name>Specifies the segment to check.
CLI EXAMPLE
waddmon ‘SybaseDatabase’ ‘UsedSegmentSpaceBySegment’ -a ‘default’ -t ‘1 minutes’ -c ‘critical’ -c ‘severe’ -c ‘warning’ -c ‘normal’ -c ‘always’ -f ‘pip:/data/Sybase/logs/used_segment_space.log’ “<profilename>”
SUGGESTED RESPONSE LEVELS
No response levels are suggested because they must be set up individual site basis.
Suggested monitoring schedule: 30 minutes
3–38 Version 1.1
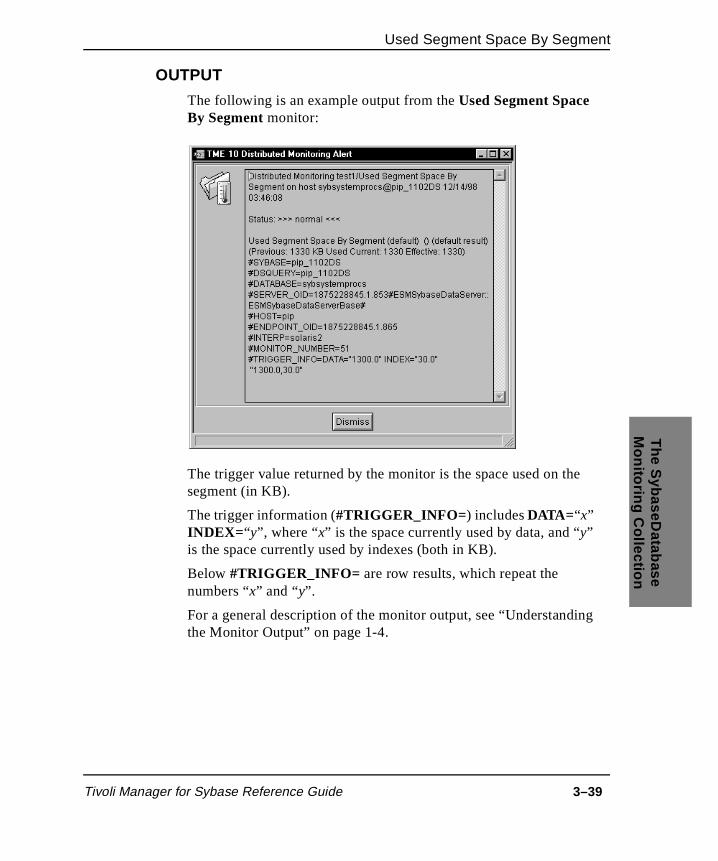
Used Segment Space By Segment
The S
ybaseDatabase
Monitoring C
ollection
OUTPUT
The following is an example output from the Used Segment Space By Segment monitor:
The trigger value returned by the monitor is the space used on the segment (in KB).
The trigger information (#TRIGGER_INFO= ) includes DATA= “x” INDEX= “y”, where “x” is the space currently used by data, and “y” is the space currently used by indexes (both in KB).
Below #TRIGGER_INFO= are row results, which repeat the numbers “x” and “y”.
For a general description of the monitor output, see “Understandingthe Monitor Output” on page 1-4.
Tivoli Manager for Sybase Reference Guide 3–39
Used Segment Space By Segment
.
the at
t of
a
s the o the se
then
ment. hose e evice y the h the
USAGE NOTES
You can set up this monitor to check either a user-defined segment or a system-defined segment. To monitor a system-defined segment, enter default, system, or logsegment as an argument to the monitorThis allows the monitor to be meaningfully distributed to any database.
However, if a specific segment name is passed as an argument tomonitor, it has relevance only on a database with a segment of thname. If the monitor is distributed to a database with no segmenthat name, then the monitor will always return zero.
This monitor checks only one segment. To check all segments ofdatabase, consider using the Percent Free Segment Space monitor.
When calculating the used space on a segment, the monitor usesegment column of the sysindexes table to determine which objectsare on the segment. So, if you enter a segment name that refers tsame device as another segment, the monitor considers only thoobjects assigned to the segment you entered.
For example, suppose a default segment is mapped to device dev1 and a user-defined segment seg1 is also mapped to device dev1. If you input seg1 to the monitor, it will consider the space occupied by only those objects assigned to seg1. Any objects assigned to default will not be considered, regardless of whether they are on device dev1.
In other words, if a segment shares devices with other segments, that segment’s used space reported by the monitor might not represent the used space on the devices associated with that segObjects might have been placed on the other segments sharing tdevices, and those objects might be occupying space on a devicassociated with the first segment. If a segment does not share a dwith another segment, then that segment’s used space reported bmonitor represents the used space on the devices associated witsegment.
SEE ALSO
The following SybaseDatabase monitors: Free Segment Space By Segment and Percent Free Segment Space
3–40 Version 1.1
p
Index
Symbols!TARGET! reserved keyword 3-13, 3-18% SQL wildcard 2-104
AAdd Monitor to TME 10 Distributed
Monitoring Profile dialog 2-5, 3-10
BBackup Server Errors monitor 2-4Bad Processes monitor 2-14Blocked Processes monitor 2-17
CCLI
list of SybaseDatabase monitor names 3-2
list os SybaseServer monitor names 2-2See also command line
command linelist of SybaseDatabase monitor names
3-2list of SybaseServer monitor names 2-2See also CLIspecifying path names 1-3table of database states 2-39using 1-3
command line interface (CLI)
See CLI and command linecommands
create table 2-39waddmon
example 2-7, 3-6-R arguments
Database State operator grou3-3
Device Mirror Status operatorgroup 2-61
Server Status operator group2-153
Connections Available monitor 2-22Connections In Use monitor 2-26CPU By Process monitor 2-30create table command 2-39Currently Open Databases monitor 2-33
Ddatabase ID (dbid) 2-86Database State dialog 2-38Database State monitor 3-3Database State operator group table 3-3database states table
explanations 2-39internal values 2-39user settable 2-39
Database Status monitor 2-36Dataserver Errors By Severity monitor 2-53Dataserver Errors monitor 2-44dataserver errors table
DEFAULT class 2-44dbid
See database ID (dbid)Device Mirror Status monitor 2-61Device Mirror Status operator group table
2-61dialogs
Tivoli Manager for Sybase Reference Guide Index–1
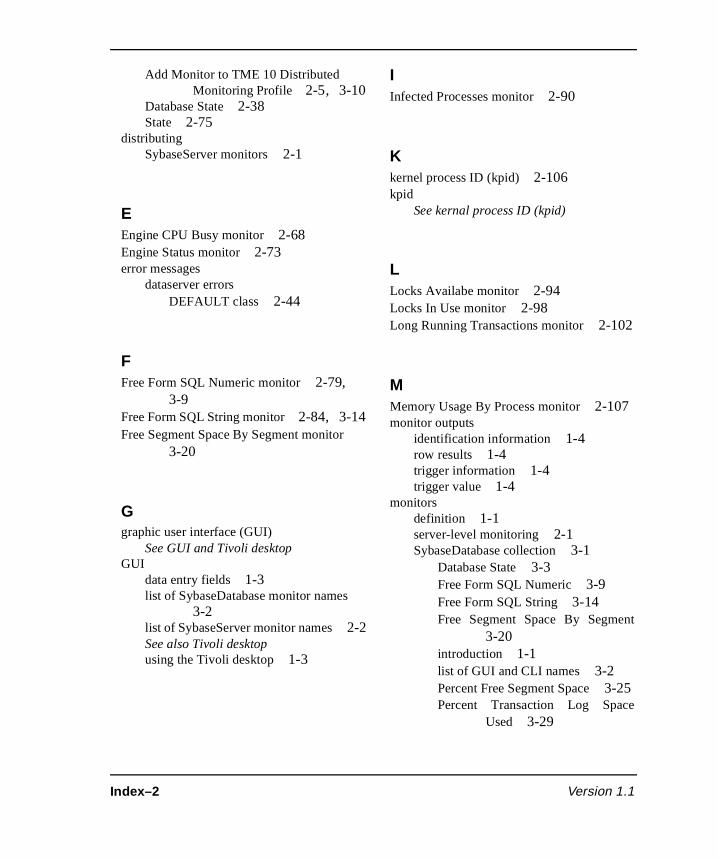
nt
e
Add Monitor to TME 10 Distributed Monitoring Profile 2-5, 3-10
Database State 2-38State 2-75
distributingSybaseServer monitors 2-1
EEngine CPU Busy monitor 2-68Engine Status monitor 2-73error messages
dataserver errorsDEFAULT class 2-44
FFree Form SQL Numeric monitor 2-79,
3-9Free Form SQL String monitor 2-84, 3-14Free Segment Space By Segment monitor
3-20
Ggraphic user interface (GUI)
See GUI and Tivoli desktopGUI
data entry fields 1-3list of SybaseDatabase monitor names
3-2list of SybaseServer monitor names 2-2See also Tivoli desktopusing the Tivoli desktop 1-3
IInfected Processes monitor 2-90
Kkernel process ID (kpid) 2-106kpid
See kernal process ID (kpid)
LLocks Availabe monitor 2-94Locks In Use monitor 2-98Long Running Transactions monitor 2-102
MMemory Usage By Process monitor 2-107monitor outputs
identification information 1-4row results 1-4trigger information 1-4trigger value 1-4
monitorsdefinition 1-1server-level monitoring 2-1SybaseDatabase collection 3-1
Database State 3-3Free Form SQL Numeric 3-9Free Form SQL String 3-14Free Segment Space By Segme
3-20introduction 1-1list of GUI and CLI names 3-2Percent Free Segment Space 3-25Percent Transaction Log Spac
Used 3-29
Index–2 Version 1.1
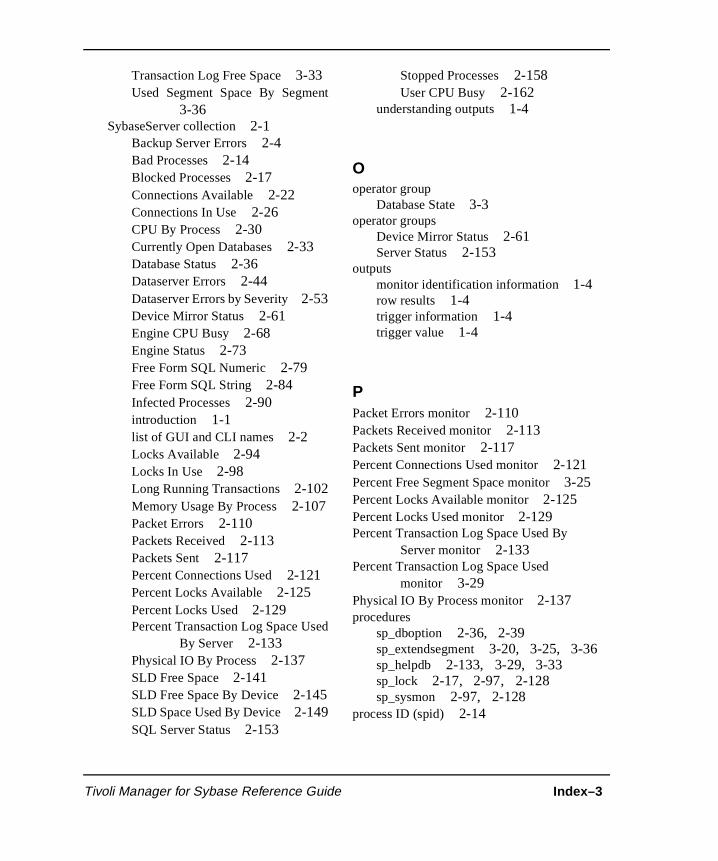
Transaction Log Free Space 3-33Used Segment Space By Segment
3-36SybaseServer collection 2-1
Backup Server Errors 2-4Bad Processes 2-14Blocked Processes 2-17Connections Available 2-22Connections In Use 2-26CPU By Process 2-30Currently Open Databases 2-33Database Status 2-36Dataserver Errors 2-44Dataserver Errors by Severity 2-53Device Mirror Status 2-61Engine CPU Busy 2-68Engine Status 2-73Free Form SQL Numeric 2-79Free Form SQL String 2-84Infected Processes 2-90introduction 1-1list of GUI and CLI names 2-2Locks Available 2-94Locks In Use 2-98Long Running Transactions 2-102Memory Usage By Process 2-107Packet Errors 2-110Packets Received 2-113Packets Sent 2-117Percent Connections Used 2-121Percent Locks Available 2-125Percent Locks Used 2-129Percent Transaction Log Space Used
By Server 2-133Physical IO By Process 2-137SLD Free Space 2-141SLD Free Space By Device 2-145SLD Space Used By Device 2-149SQL Server Status 2-153
Stopped Processes 2-158User CPU Busy 2-162
understanding outputs 1-4
Ooperator group
Database State 3-3operator groups
Device Mirror Status 2-61Server Status 2-153
outputsmonitor identification information 1-4row results 1-4trigger information 1-4trigger value 1-4
PPacket Errors monitor 2-110Packets Received monitor 2-113Packets Sent monitor 2-117Percent Connections Used monitor 2-121Percent Free Segment Space monitor 3-25Percent Locks Available monitor 2-125Percent Locks Used monitor 2-129Percent Transaction Log Space Used By
Server monitor 2-133Percent Transaction Log Space Used
monitor 3-29Physical IO By Process monitor 2-137procedures
sp_dboption 2-36, 2-39sp_extendsegment 3-20, 3-25, 3-36sp_helpdb 2-133, 3-29, 3-33sp_lock 2-17, 2-97, 2-128sp_sysmon 2-97, 2-128
process ID (spid) 2-14
Tivoli Manager for Sybase Reference Guide Index–3

Rreserved keyword !TARGET! 3-13, 3-18
Sscripts
SetErrorCategory utility 2-51Server Status operator group table 2-153set user ID (suid) 2-137, 2-162SetErrorCategory utility scripts 2-51SLD Free Space By Device monitor 2-145SLD Free Space monitor 2-141SLD Space Used By Device monitor 2-149sp_dboption procedure 2-36, 2-39sp_extendsegment procedure 3-20, 3-25,
3-36sp_helpdb procedure 2-133, 3-29, 3-33sp_lock procedure 2-17, 2-97, 2-128sp_sysmon procedure 2-97, 2-128specifying path names 1-3spid
See process ID (spid)SQL Server Status monitor 2-153SQL wildcard % 2-104State dialog 2-75Stopped Processes monitor 2-158suid
See set user ID (suid)SybaseDatabase monitoring collection
database-specific monitors 3-1introduction 1-1list of GUI and CLI monitor names 3-2
SybaseServer monitoring collectiondistributing monitors 2-1introduction 1-1list of GUI and CLI monitor names 2-2server-level monitors 2-1
syprocesses table 2-16sysdatabases system table 2-33
sysindexes system table 3-24, 3-28, 3-40sysmessages system table 2-59sysprocesses system table 2-90, 2-92,
2-102, 2-158
Ttables
Database State operator group 3-3database states 2-39dataserver errors DEFAULT class 2-44Device Mirror Status operator group
2-61Server Status operator group 2-153SybaseServer GUI and CLI monitor
names 2-2syprocesses 2-16sysdatabases 2-33sysindexes 3-24, 3-28, 3-40sysmessages 2-59sysprocesses 2-90, 2-92, 2-102,
2-158Tivoli desktop
See also GUIspecifying path names 1-3using 1-3
Tivoli Management Region (TMR) 2-44Tivoli Manager for Sybase
introduction 1-1Tivoli Manager for Sybase Reference Guide
organization 1-2using 1-2
TME 10 Distributed Monitoring Alert window 2-9
TMRSee Tivoli Management Region
Transaction Log Free Space monitor 3-33TRANSACT-SQL select statement 2-79,
2-83, 2-84, 2-89, 3-10, 3-14
Index–4 Version 1.1

Uunderstanding monitor outputs
identification information 1-4row results 1-4trigger information 1-4trigger value 1-4
Used Segment Space By Segment monitor 3-36
User CPU Busy monitor 2-162using
command line 1-3the Reference Guide 1-2Tivoli desktop 1-3
Wwaddmon command
example 2-7, 3-6-R arguments
Database State operator group 3-3Device Mirror Status operator
group 2-61Server Status operator group
2-153windows
TME 10 Distributed Monitoring Alert 2-9
Tivoli Manager for Sybase Reference Guide Index–5

Index–6 Version 1.1