título presentación en formato powerpoint cellnex 2015 · cellnex telecom is part of esg indices...
TRANSCRIPT

Q4
2018
January – December 2018 ResultsFebruary 22, 2019

Disclaimer
The information and forward-looking statements contained in this presentation have not been verified by an independent entity and the accuracy, completeness or correctnessthereof should not be relied upon. In this regard, the persons to whom this presentation is delivered are invited to refer to the documentation published or registered by CellnexTelecom, S.A. and its subsidiaries (“Cellnex”) with the National Stock Market Commission in Spain (Comision Nacional del Mercado de Valores). All forecasts and otherstatements included in this presentation that are not statements of historical fact, including, without limitation, those regarding the financial position, business strategy,management plans and objectives for future operations of Cellnex (which term includes its subsidiaries and investees) and run rate metrics, are forward-looking statements.These forward-looking statements involve known and unknown risks, uncertainties and other factors, which may cause actual results, performance or achievements of Cellnex,or industry results, to be materially different from those expressed or implied by these forward-looking statements. These forward-looking statements are based on numerousassumptions regarding Cellnex‘s present and future business strategies, performance by Cellnex's counterparties under certain of Cellnex's contracts and the environment inwhich Cellnex expects to operate in the future which may not be fulfilled. All forward-looking statements and other statements herein are only as of the date of thispresentation. None of Cellnex nor any of its affiliates, advisors or representatives, nor any of their respective directors, officers, employees or agents, shall bear any liability (innegligence or otherwise) for any loss arising from any use of this presentation or its contents, or otherwise in connection herewith, and they do not undertake any obligation toprovide the recipients with access to additional information or to update this presentation or to correct any inaccuracies in the information contained or referred to herein.
To the extent available, the industry and market data contained in this presentation has come from official or third party sources. Third party industry publications, studies andsurveys generally state that the data contained therein have been obtained from sources believed to be reliable, but that there is no guarantee of the accuracy orcompleteness of such data. In addition, certain of the industry and market data contained in this presentation come from Cellnex's own internal research and estimates basedon the knowledge and experience of Cellnex's management in the market in which Cellnex operates. Certain information contained herein is based on Cellnex's managementinformation and estimates and has not been audited or reviewed by Cellnex's auditors. Recipients should not place undue reliance on this information. The financialinformation included herein has not been reviewed for accuracy or completeness and, as such, should not be relied upon. Certain financial and statistical informationcontained in the presentation is subject to rounding adjustments. Accordingly, any discrepancies between the totals and the sums of the amounts listed are due to rounding.
This presentation is addressed to analysts and to institutional or specialized investors only and should only be read together with the supporting excel document published onthe Cellnex website. The distribution of this presentation in certain jurisdictions may be restricted by law. Consequently, persons to which this presentation is distributed mustinform themselves about and observe such restrictions. By receiving this presentation the recipient agrees to observe any such restrictions.
Neither this presentation nor the historical performance of Cellnex's management team constitute a guarantee of the future performance of Cellnex and there can be no
assurance that Cellnex's management team will be successful in implementing the investment strategy of Cellnex.
In addition to the financial information prepared under IFRS, this presentation includes certain alternative performance measures (“APMs”), as defined in the Guidelines onAlternative Performance Measures issued by the European Securities and Markets Authority on 5 October 2015 (ESMA/2015/1415es). An Alternative Performance Measure(APM) is a financial measure of historical or future financial performance, financial position, or cash flows, other than a financial measure defined or specified in the applicablefinancial reporting framework. Cellnex believes that there are certain APMs, which are used by the Group’s Management in making financial, operational and planningdecisions, which provide useful financial information that should be considered in addition to the financial statements prepared in accordance with the accounting regulationsthat applies (IFRS-EU), in assessing its performance. These APM are consistent with the main indicators used by the community of analysts and investors in the capital markets.The definition and determination of the aforementioned APMs are disclosed in the consolidated financial statements, and therefore, they are validated by the Group auditor(Deloitte).
Nothing herein constitutes an offer to purchase and nothing herein may be used as the basis to enter into any contract or agreement.
2Results January – December 2018

3
Key Highlights
Location: Switzerland3 tenantsRural site
Results January – December 2018
The European tower outsourcing opportunity
It’s massive, it’s here, and it’s now

The Period in a Nutshell
4
Consistent and sustainable organic growth
+5% new PoPs year on year
+c.20% DAS nodes
Continued commercial drive to secure future organic growth
Solid financial performance Revenues +c.15% vs. FY 2017
Adjusted EBITDA +c.20%
RLFCF +c.10%
Strong backlog of c.€18Bn
IFRS 16(1) a game changerSector debt increases as leases capitalized
Cellnex’s MSA avoids capitalization of leases(2)
Credit agencies removing the accounting benefit from selling minority stakes in
TowerCos
Becoming our clients’ partner of trust
Initial agreements create a precedent for a more progressive relationship
Increased scope with existing clients
Compelling pipeline of opportunities in Europe
Discussions with key European players with a strong industrial rationale
Owners of large portfolios of telecom sites considering divestments
2018 financial outlook beaten
2019 outlook under IFRS 16, effective from January 1st
(1) Mandatory from January 1st 2019(2) Cellnex’s approach has been validated by all four major auditing firms; for more information please see “Frequently Asked Questions” section
Results January – December 2018
Cellnex is at the cornerstone of the next outsourcing cycle triggered by 5G, IFRS 16 (1)
and macro challenges, generating a massive pipeline of deals
Strong operational and financial performance leading to results above Cellnex’s financial outlook

151
305
FY 2014 FY 2018
436
901
FY 2014 FY 2018
178
FY 2014 FY 2018
RLFCF (€Mn)
5
Adjusted EBITDA (€Mn) (1)
c.20% CAGR% c.25% CAGR c.20% CAGR%
Revenues (€Mn)
… positively impacting RLFCF per share (2) over this period
Cellnex’s growth strategy providing sustained increases across all
key financial metrics…
c.x2c.x2x2.3
(1) Figures before IFRS16(2) RLFCF per share; total number of shares unchanged over this period
Results January – December 2018
Key Highlights
418
0.65 (2)
1.32 (2)

Key HighlightsM&A Activity in the Period
6
EV (1) of up to c.€800Mn (to be cashed out over the next 5 years) for up to c.1,800 new sites and a run rate Adjusted EBITDA of up to c.€60Mn
Results January – December 2018
(1) Invested and committed Enterprise Value (cash out over the coming years as sites are built); for more details please see “M&A Update” section(2) Built-to-Suit, expected to be executed over the coming 5 years(3) Last stages of signing process(4) MSC = Mobile Switching Center, MO = Metropolitan Office, CO = Central Office(5) Already announced during the year
BTS (2) programs increased by 875 new sites in current markets
Acquisition of 723 new sites in Spain, Switzerland and Italy
IoT and Edge Computing solutions
Fiber optic network in Spain
• Positioning in a 5G world
1
2
4
• 2019-2024; EV €70Mn (3)
• EV €84Mn
• Executed (5)
• Executed; EV €34Mn (5)
• Reinforcing our partnerships with key customers
• Reinforcing our presence in existing markets
Construction of up to 88 MOs & COs (4)
Agreement for the acquisition of up to 62 MSCs & MOs (4)
• Strategic facilities for 5G networks and reinforcing our partnership with our anchor tenant in France
• By 2024; EV €250Mn (5)
• From 2020 to 2021; EV €330Mn
3
Densification
Increased ScaleSupporting
our clients’ network
deploymentLong-termindustrial
partnershipsDeep
industrial profile
Expanding our presence
in the 5G value chain

7
Key Highlights
Cellnex vs. Peers (thousands of sites)170
40 29 2911 7
AMT CC Cellnex SBA Inwit Cellnex
801 Sites
5,550 Sites (1)
8,718 Sites (3)
10,171 Sites (4)
608 Sites
Substantial improvement of Business Risk Profile
2014 - IPO Run Rate (5)
Significant expansion of European footprint
c.3,047 Sites (2)
(1) Acquisition of 500 sites from Bouygues Telecom + acquisition of up to 1,800 sites + construction of up to 1,200 sites + acquisition of up to 600 sites + construction of up to 1,000 sites + 300 sites under management + construction of up to 88 MOs & COs + acquisition of up to 62 MSCs & COs(2) Including contribution of Built-to-Suit program with Sunrise + c.200 DAS nodes(3) Including broadcast + DAS nodes(4) Including DAS nodes(5) Management estimate based on 2018 revenues and Adjusted EBITDA and including run rate revenues and Adjusted EBITDA contribution under our M&A contracts signed to date, respectively, assuming that all sites to be transferred or built under such contracts are actually transferred to or built by us, as applicable, by each relevant date
x4.3
Significant improvement of Cellnex’s business risk profile, focus on TIS (revenues c.75%) and geographical diversification (EBITDA c.65% ex-Spain)
AA
x Country Ratings
AA
AAA
AAA
BBBA-
Total c.29k Sites
5%
TIS
Other24%
c.75%
76%
95%
Impact on revenues contribution
Impact on EBITDA contribution
c.25%€1.2Bn
€800Mn
c.35%
c.65%
2014
Results January – December 2018

8Results January – December 2018
FY 2018 Business Performance
Operational excellence, industrial profile and full services approach
are our strengths

1,348
1,592
FY 2017 FY 2018
30,149
33,860
FY 2017 FY 2018
FY 2018 Business Performance
30,149
31,626
FY 2017 FY 2018
1.551.60
FY 2017 FY 2018
Ongoing strong performance of operational KPIs
9
DAS Nodes
PoPs – Total
Customer Ratio (1)
Leveraging on CommsCon’s expertise in our six current markets
Contribution from both organic growth and change of perimeter
PoPs – Organic Growth
New organic PoPs mainly due to network densification and new mobile operator in Italy
Contribution from organic growth
(1) Customer ratio excludes change of perimeter (organic growth only, including BTS)
Results January – December 2018

FY 2018 Business Performance Business Highlights
10
Continued commercial drive to secure future organic growth
Results January – December 2018
o Framework agreement signed with Fastweb in areas where Fastweb is testing 5G technology
o Continued commercial activity with Iliad in Italy: i) new colocations in the quarter and, ii) assessment of fiber opportunities
o Colocations from Iliad in France increasing, whilst assessing additional requests from additional customers
o Further deals being analyzed to strengthen our industrial relationship with current customers
o New hospitality framework agreements signed with both Swisscom and Salt will help the commercialization of site sharing services
o Cellnex is in the closing stages of being awarded contracts to install neutral host DAS systems in 2 Premier League stadiums
o Actively participating in a number of organic growth projects, including metropolitan transport systems
o Cellnex to present at the Mobile World Congress the first version of 5G Adaptive Edge to showcase the future of Edge in a live demo
o Cellnex renewed as “Zero Outage Supplier” by Deutsche Telekom and T-Systems
o Reinforcing IoT positioning by providing social houses with IoT Technology in the Basque region and installing IoT sensors at FiraBarcelona to improve visitor experience
o Cellnex joins the 5G Barcelona initiative and will develop a pilot project in the area of safety and emergency connectivity
o Fostering data centers business by targeting a more diversified customer base
o Working on potential management contracts where Cellnex can deliver high added value to the customer
o All organic targets on track: new PoPs, decommissioning and BTS progress

355 +16+22
+27 -2
591
FY 20 17 Organic growth & Effie ncies Co ntractualized in organ ic growth Ch ange o f pe rimeters Others IFRS 16 FY 20 18
11
FY 2018 Business PerformanceAdjusted EBITDA
FY 2017 (as reported)
Organic Growth
Change of Perimeter (3)
FY 2018 (1)
Others (4)
Figures in €Mn(1) Before IFRS 16 adoption, non-audited figures(2) Gradual contribution from contracted Bouygues Telecom and Sunrise sites (3) c.2½ quarters Swiss Towers + 3 quarters Alticom + limited contribution from XOC during c.1½ quarter (4) New distribution system implemented to transmit regional content
IFRS 16 Adjustments
FY 2018 (IFRS 16)
1418
Adjusted EBITDA growing at c.20% on a like-for-like accounting basis (1)
Mainly ground leases previously accounted
for as Opex+c.20%
like-for-like accounting basis
Results January – December 2018
Contracted Inorganic Growth
(2)
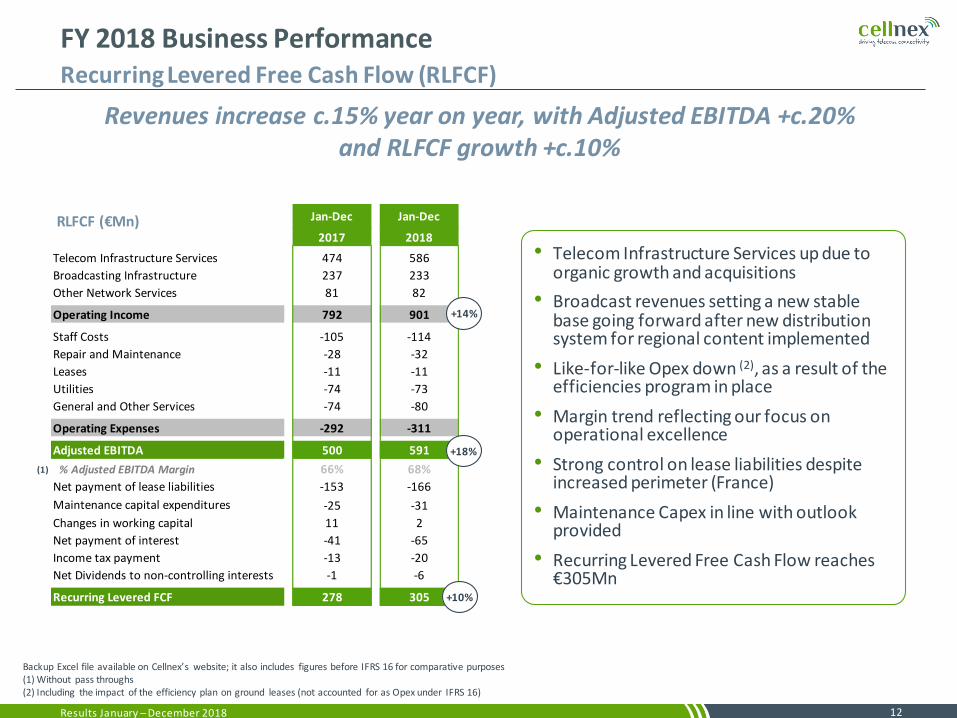
Jan-Dec Jan-Dec
2017 2018
Telecom Infrastructure Services 474 586
Broadcasting Infrastructure 237 233
Other Network Services 81 82
Operating Income 792 901
Staff Costs -105 -114
Repair and Maintenance -28 -32
Leases -11 -11
Utilities -74 -73
General and Other Services -74 -80
Operating Expenses -292 -311
Adjusted EBITDA 500 591
% Adjusted EBITDA Margin 66% 68%
Net payment of lease liabilities -153 -166
Maintenance capital expenditures -25 -31
Changes in working capital 11 2
Net payment of interest -41 -65
Income tax payment -13 -20
Net Dividends to non-controlling interests -1 -6
Recurring Levered FCF 278 305
Revenues increase c.15% year on year, with Adjusted EBITDA +c.20% and RLFCF growth +c.10%
• Telecom Infrastructure Services up due to organic growth and acquisitions
• Broadcast revenues setting a new stable base going forward after new distribution system for regional content implemented
• Like-for-like Opex down (2), as a result of the efficiencies program in place
• Margin trend reflecting our focus on operational excellence
• Strong control on lease liabilities despite increased perimeter (France)
• Maintenance Capex in line with outlook provided
• Recurring Levered Free Cash Flow reaches €305Mn
Backup Excel file available on Cellnex’s website; it also includes figures before IFRS 16 for comparative purposes(1) Without pass throughs(2) Including the impact of the efficiency plan on ground leases (not accounted for as Opex under IFRS 16)
12
+18%
+14%
RLFCF (€Mn)
+10%
Results January – December 2018
FY 2018 Business PerformanceRecurring Levered Free Cash Flow (RLFCF)
(1)

Dec Dec
2017 2018
Non Current Assets 3,956 4,479567
Property, Plant and Equipment 1,507 1,904
Goodwill and Other Intangible Assets 1,921 1,904
Right of Use 455 574
Financial Investments & Other Fin. Assets 73 98
Current Assets 490 654
Inventories 1 4
Trade and Other Receivables 193 194
Cash and Cash Equivalentes 295 456
Total Assets 4,445 5,133
Shareholders' Equity 610 615
Borrowings 2,500 2,993
Lease Liabilities 349 424
Provisions and Other Liabilities 579 591
Non Current Liabilities 3,428 4,008
Borrowings 32 103
Lease Liabilities 77 102
Provisions and Other Liabilities 299 305
Current Liabilities 407 510
Total Equity and Liabilities 4,445 5,133
Jan-Dec Jan-Dec
2017 2018
Operating Income 792 901
Operating Expenses -292 -311
Non-recurring expenses -20 -75
Depreciation & amortisation -352 -403
Operating profit 129 113
Net financial profit -109 -149
Profit of companies accounted for using the
equity method0 0
Income Tax 4 18
Attributable to non-controlling interests 2 3
Net Profit Attributable to the Parent Company 26 -15
FY 2018 Business PerformanceBalance Sheet and Consolidated Income Statement
Balance Sheet (€Mn)
Income Statement (€Mn)
• Prudent PPA allocation process leads to 100% fixed assets allocation, with only marginal impact on goodwill
• The adoption of IFRS 16 helps the leverage comparability among peers, as it equalizes the treatment of both land ownership and the management of ground leases
• Significant generation of cash and reinforced liquidity position due to the issuance of debt instruments in the period (convertible bond in January 2018)
• Net Income -€15Mn due to one-offs and prudent PPA process
• When looking at Net income on a cash flow basis (RLFCF of €305Mn), ROE reaches 50% (3)
(1) The provision of the workforce agreement will be cashed out in 2018, 2019 and first months of 2020. Accordingly, efficiencies will crystalize from 2020 onwards (this program includes 180 employees)
(2) Please see “Frequently Asked Questions” section
13
(1)
Net debt/Adjusted EBITDA improvement
under IFRS 16
Results January – December 2018
12
3
2
2
4
1
2
3
4
Net Debt 3,1662,663
(2)

70 30
600
304
91
80
750
335
80 6056 49 65
800
2018 2019 2020 2021 2022 2023 2024 2025 2026 2027 2029 2032
c.590
First significant refinancing in 2022
c.0.6x Net Debt/Adjusted EBITDA de-leveraging per year (1)
14
FY 2018 Business PerformanceFinancial Structure as of February 2019 – Excluding IFRS 16 Impact
Average Maturity 5.5 years
Average Cost 2.2% (drawn debt)
1.9% (both drawn and undrawn debt) (2)
Gross Debt c.€3.4Bn (Bonds and Credit Facilities)
Cash
c.1,000 (3) (4)
Credit Facilities
Euribor/Libor + c.1%Mat. 2020/23
Bonds and Other Instruments
2.875%Mat. 2025
2.375%Mat. 2024
3.125%Mat. 2022
3.875%Mat. 2032
3.25%Mat. 2027
Eur+2.27%Mat. 2026
Available Liquidity c.€1.6Bn
Net Debt c.€2.8Bn
600 750 335 65 (8)80 (8) 56 (10) 201 (6)
E/L + c.1%Mat. 21/23
304 (7)
Libor + c.1%%Mat. 2023
60 (7)
Eur+2.2%Mat. 2027
800 (9)
1.5%Mat. 2026
49 (11)
Eur+c.1.1%Mat. 2029
Figures in €Mn(1) Includes current dividend policy and no further perimeter changes(2) Considering current Euribor rates; cost over full financing period to maturity
(3) RCF Euribor 1M; Credit facilities Euribor 1M and 3M; floor of 0% applies(4) Maturity 5 years(5) Euro Commercial Paper(6) Includes c.£150Mn debt in GBP; natural hedge investment in Cellnex UK Ltd
(7) EUR 167Mn debt in Swiss Francs at corporate level (natural hedge) + EUR 138Mn debt in Swiss Francs at local level in Switzerland. No financial covenants or share pledge (Swiss Tower and/or Cellnex Switzerland) in line with all the debt placed at the Parent Company Corporate level
(8) Private placement(9) Convertible bond into Cellnex shares (conversion price at €38 per share). Includes 200Mn convertible issued in Jan -19(10) Bilateral loan (11) EIB
70 (5)
c.0% all-inMat. 2019
Results January – December 2018

• [€584Mn – €589Mn]
20
18
• Maintenance c.3%
• Expansion c.10% (2)
• 10% growth
• To grow ≥ 10%
Adjusted EBITDA (1)
RLFCF
Capex to Revenues
Dividends (3)
Guidance 2018
• €591Mn
• Maintenance c.3%
• Expansion c.10%
• 10% growth
• 10% growth
15
2018 financial outlook beaten...
(1) Guidance range [€410Mn-€415Mn] before IFRS 16, with actual figure €418Mn(2) Capex guidance excludes BTS programs with both Bouygues Telecom and Sunrise(3) 2017-2019 dividend policy: https://www.cellnextelecom.com/en/dividend-policy/(4) Adjusted EBITDA 2019 (IFRS 16) = €591Mn + Organic Growth/Efficiencies + Change of Perimeter; being the change of perimeter: gradual contribution from contracted Bouygues Telecom sites + full year contribution from deals explained on slide 6
FY 2018 Business PerformanceFinancial Outlook
Results January – December 2018
Actual 2018
... and 2019 outlook implying double-digit growth in key metrics
• [€640Mn – €655Mn]
2019
• Maintenance [3%-4%]
• Expansion c.10% (2)
• 10% growth
• To grow ≥ 10%
Adjusted EBITDA (4)
RLFCF
Capex to Revenues
Dividends (3)
16Results January – December 2018
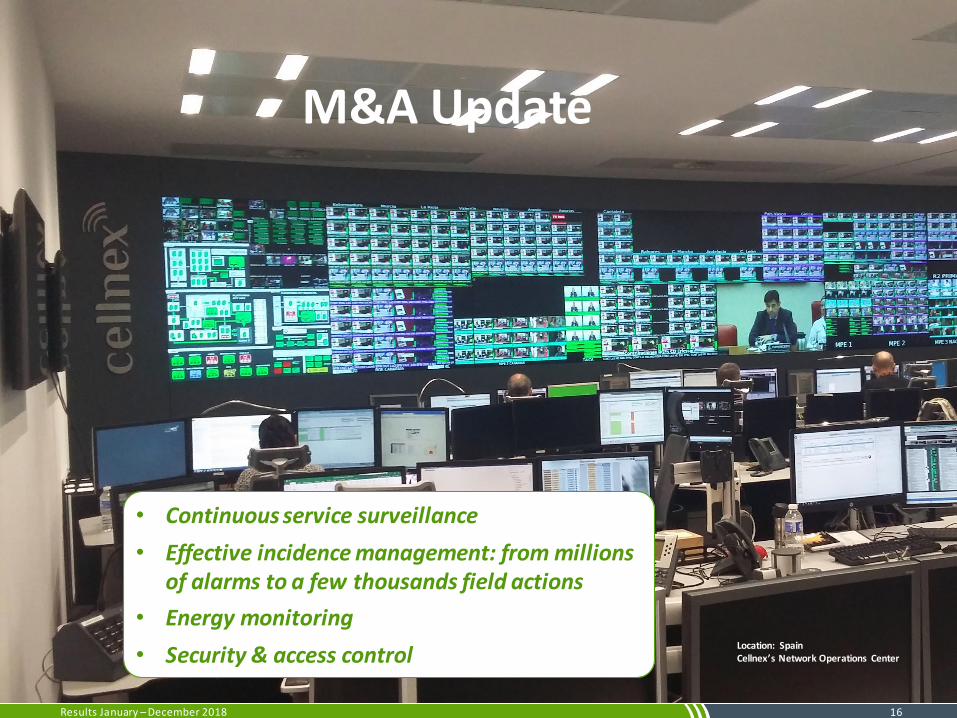
M&A Update
• Continuous service surveillance
• Effective incidence management: from millions of alarms to a few thousands field actions
• Energy monitoring
• Security & access controlLocation: SpainCellnex’s Network Operations Center

c.200
-c.90
-c.10
-c.15
c.800
-c.260
-40
0
-c.75
-c.35
c.385
17
M&A Update2018 RLFCF Run Rate
Adjusted EBITDA
Net Payment of Lease Liabilities
Maintenance Capex (2)
Change in Working Capital (2)
Interest Paid (3)
Corporate Taxes Paid
Recurring Levered FCF (4)
FY 2018Reported
591
-166
-31
2
-65
-20
311
Estimated incrementalcontribution contracted deals Run Rate (1)
RLFCF per share (4)
(1) Represents potential run rate metrics on the assumption that all sites that may, subject to certain conditions, to be tra nsferred or built under our M&A contracts are actually transferred to or built by us, as applicable, by each relevant date. Run rate EBITDA and other run rate adjustments are based on management’s estimates and are subject to assumptions that could cause actual adjusted EBITDA and other adjustments to differ from those reflected in this forward looking metric(2) Same guidance as for FY 2018(3) Deals funded with available cash, and cash to be generated by the Group. The run rate figure reflects our current debt structure as of Feb 2019 (thus including the convertible bond issued on Jan 2019) and does not reflect any incremental interest due to change of perimeter (please see current debt structure on slide 14) (4) RLFCF before net dividends to non-controlling interests; number of shares outstanding as of 22nd Feb 2019
1.34 1.66
The execution of already signed M&A deals is expected to boost Cellnex’sRLFCF per share on a run rate basis
€Mn
Results January – December 2018
+c.€75Mn
+c.25%

250
290
330
370
410
450
490
530
570
610
650
690
730
770
810
850
14.000
19.000
24.000
29.000
34.000
2015 2016 2017 2018 2019E 2020E 2025E 2026E 2027E
Current sites New sites New sites Estimated Adjusted EBITDA Run Rate
Adjusted EBITDA 2018 €591Mn
(1) Excludes DAS nodes and sites managed but not owned (2) Represents potential run rate metrics on the assumption that all sites that may, subject to certain conditions, to be transferred or built under our M&A contracts are actually transferred to or built by us, as applicable, by each relevant date. Run rate EBITDA and other run rate adjustments are based on management’s estimates and are subject to assumptions that could cause actual adjusted EBITDA and other adjustments to differ from those reflected in this forward looking metric. Please note this figure does not consider further potential organic growth component from the initial base perimeter (2018 = €16Mn)(3) Assumes that all sites to be transferred or built under our M&A contracts are actually transferred to or built by us, as applicable, by each relevant date
18Results January – December 2018
M&A UpdateGradual Contribution of Sites and Adjusted EBITDA
M&A deals signed in the year reinforce our strong cash flow
visibility and underpin future growth
15,199
16,828
21,017
23,440
c.24,200c.25,000
c.27,2 00 c.27,30027,603 (1)
Sites owned End of Period (cumulative) (1)
+ c.4,200 new sites
14,000
30,000
Estimated Adjusted EBITDA run rate c.€800Mn
(2)
(3)

19
M&A UpdateCellnex’s Positioning in a 5G World – A Focus on Edge Computing
Results January – December 2018
Cellnex and Bouygues Telecom have reached an agreement for the acquisition of up to 62 MSCs & MOs, and the construction of up to 88 MOs & COs (1) over the next 5 years (2)
(1) MSC = Mobile Switching Center, MO = Metropolitan Office, CO = Central Office(2) Construction of new MOs and COs by 2024; this agreement has been extended to acquire 62 existing MSCs and MOs by 2020/2021
1 What are MSCs, MOs and COs?
• MSCs, MOs and COs are strategic facilities with traffic concentration capabilities which will play a key role in the future deployment of 5G networks, as they will also provide processing capabilities in order to reduce data latency
3 How will 5G change network architectures?
Core Data Center
Regional Data Center
CO
Edge Data Centers
MO
End user
Computation and storage closer to end users
1-5ms30ms50ms
2 Why is this agreement strategic?
• Agreement to roll out strategic telecom centers ready to host data processing capabilities close to the points where traffic is generated and required
• EV of €330Mn + €250Mn with a run rate Adjusted EBITDA of €39Mn
4 What are these facilitieslike (3)?
(3) Existing facilities in Montpellier, Reims and Douai

To Conclude
20
5G, IFRS 16 and macro challenges to change the rules of the game
A compelling pipeline of deals in Europe today and in the making
Cellnex is becoming the MNOs’ partner of trust
An opportunity which is massive, it’s here, and it’s now
Results January – December 2018
Cellnex is at the cornerstone of the next outsourcing cycle, which will generate a massive pipeline of deals

Location: The NetherlandsTIS site and data center
21
Frequently Asked Questions
Results January – December 2018

22Results January – December 2018
IFRS 16• Capitalization
of leases
5G• New Capex cycle for MNOs
• Evolving business models
Frequently Asked QuestionsCellnex at the Cornerstone of the Next Tower Outsourcing Wave
Trend towards
continued outsourcing
Macro challenges
• Interest rates increase
• End of quantitative easing
A
B C

23Results January – December 2018
Operators have invested more than €100Bn in network deployments
over the last 5 years …
… and investment is expected to accelerate in the coming years
A
Capex Requirements – View per Asset
29-33
50-70
LTE (for 95% coverage)
200-250
5G (next 3 years)
Est. investments in EU-15 (€Bn)
FTTH (for 50% coverage)
Est. investments in EU-15 (€Bn)
Est. investments in Western Europe (€Bn)
Source: Arthur D. Little analysis, UK Government, GSMA
Frequently Asked QuestionsCellnex at the Cornerstone of the Next Tower Outsourcing Wave

24
Frequently Asked QuestionsCellnex’s Positioning in a 5G World
Traditional TowerCo: Passive infrastructure
NetCo: increased presence in 5G ecosystem
Network enablerTowerCo + commercial and industrial excellence
• Specialist in passive infrastructure management
• Rationalization strategy
• Commercialization• Site hunting• Full portfolio
marketing
• Manage & invest in active equipment
• Push for network sharing amongst operators
• Managing Radio Access Network
Results January – December 2018
The core of Cellnex’s strategy Whilst building 5G optionality
Edge Computing
Fiber
DAS and Small Cells
Recent deals represent an important expansion of Cellnex’s 5G capabilities
Current presence Cellnex’s view
A

25
Frequently Asked QuestionsIFRS 16 a Game Changer (Accounting View)
Results January – December 2018
IFRS 16 effective from 1st January 2019
Cellnex’s MSA does not fall under IFRS 16 due to the following industrial reasons:
B
Cellnex has validated with leading auditing firms that our MSA contracts are pure service contracts and therefore no liability appears in the Balance Sheet of
our customers
The network is considered our ‘unit of account’ – not individual sites
Our Master Service agreement consists of the reservation of a technical footprint
Cellnex has the right to relocateequipment within the site and to another site (Network Optimization)
Our clients (MNOs) can control Cellnex’squality of service through SLAs (1) and extensive KPIs (2)
1 2
43
(1) Service Level Agreements(2) Key Performance Indicators to measure operational performance

26
Frequently Asked QuestionsIFRS 16 a Game Changer (Accounting View)
Results January – December 2018
The MSA provides a network of infrastructures that enables the operator to offer its target coverage and quality of service
B
A proactive monitoring through a NOC (1) fosters proactive network management
+20,000 incidences per year
58% of incidences were
critical and affecting the service
16%of incidences
were critical but not affecting the
service
+ 1,000 energy incidences: commutation, energy cut,
generation failure, failure of AC or CC, consumption excess, …
+ 1,000 maintenance: corrective, preventive
or client notice
+ 6,000 infrastructure actions:tower, shelter, water leakage, ground changes, PRL system,…
+ 8,000 security incidences: break in, false alarm, animal
intrusion, …
+ 1,000 equipment failure: interference, radiant system
failure, transport network equipment, cable, radiant
systems, …
+ 3,000 other incidences: client
notice, climatology …
COSMOS (2) as an example of detailed real-time analysis
DAS monitoring
(1) Network Operating Center(2) Cellnex has implemented the Locken system in several sites through the COSMOS tool (authorization requests to work on site)

• 2 Nov 2018: IFRS 16 renders traditional sale-and-leaseback ineffective, as under the new accounting rules, lease contracts will be capitalized
27
Frequently Asked QuestionsIFRS 16 a Game Changer (Rating Agencies)
Results January – December 2018
“Fitch would capitalize the portion of the rents paid to the SPV and attributable to the minority interest if Fitch believes that the dividend paid by the SPV is more akin to an obligation to the minority shareholder than a normal discretionary dividend”
… therefore a lower incentive for MNOs to place minority stakes in infra assets
(1) Special Purpose Vehicle; a legal entity created to split assets according to a certain ownership structure
• 7 Dec 2018: Moody's downgrades the CFRs of Altice's European credit pools to B2; outlook negative
“Altice is reducing debt by selling infrastructure assets that Moody's believes are critical such as towers and fiber, which is positive for the group's liquidity at a time when its cash flow generation is weak. However, the group's underlying leverage will remain high after taking into account the pro-rata consolidation of its off-balance sheet vehicles”
Agencies are effectively removing the accounting benefit from selling a 49% stake in an SPV (1) owning leased-back assets (e.g. TowerCo, FiberCo, …)
• Selling minority stakes in TowerCos used to have advantages for MNOs; among them, avoiding debt increases while fully recognizing EBITDA
• IFRS 16 rules stipulated that the MNO does not need to increase its debt as future lease payments are intra-group between the MNO and the SPV, both >50% owned; however, this is no longer the situation from a credit rating perspective
51% 49%
Consolidation perimeter
B

50
100
150
200
ene-17 nov-17 sep-18
Cellnex US Peers US 10 years
28Results January – December 2018
…Cellnex’s share price unaffected by the increase of interest rates and short interest positions
Cellnex’s share price performance vs. US peers (1) and US yields
(1) US peers’ share price performance – calculation based on their historical market cap and number of shares
(2) Please note that the Spanish Securities Regulator (CNMV) discontinued disclosure of this information as of 1 January 2019
12
14
16
18
20
22
24
26
0%
2%
4%
6%
8%
10%
12%
Jun-15 Jun-16 Jun-17 Jun-18
Short Positions% of total capital
Share Price
Frequently Asked QuestionsDespite macro challenges…
Cellnex’s share price performance vs. short positions (2)
Source: Bloomberg
Base = 100
C
Jan-17 Nov-17 Sep-18

29
Frequently Asked QuestionsReturn Metrics
Reported P&L
591
-75
-
-403
-149
18
3
Net Income / Recurring Levered FCF
Return on Equity (4)
(1) D&A excludes the amortization charge of 50% of intangible assets (full charge amounts to €81Mn in 2018), as if the PPA process had resulted in an intangible allocation of 50% to goodwill(2) €149Mn (P&L) - €45Mn accrued interest not paid + €36Mn interest accrued 2017 paid in 2018 - 54Mn€ interest payment on lease liabilities - €21Mn non-cash costs = €65Mn (Cash)(3) When non-recurring expenses are excluded (mostly contribution of workforce agreement provision), its positive tax impact is also reverted(4) ROE has been calculated considering €615Mn Shareholder’s Equity
-15
Cash-based returns provide a more accurate picture of Cellnex’seconomic reality and strong fundamentals
Results January – December 2018
FY 2018€Mn
P&L - 50% Goodwill Allocation
w/o Non-Recurring Items
Reported Cash Flow
591
0
-
-362
-149
4
3
591
-
-166
-31
-65
-20
-4
87
14%
305
50%
• Cellnex’s business reality is not appropriately reflected in the bottom line of the P&L
• The reason behind this is the sharp differences between P&L and cash-based metrics, which arise due to the high amortization charges Cellnex has as a result of a prudent PPA exercise
• When looked at under a cash-based approach, Cellnex’s“Alternative” Return on Equity jumps to 50%
Adjusted EBITDA
Non-Recurring Expenses
Payments of Lease Instalments
D&A / Maintenance Capex (1)
Interests (2)
Taxes (3)
Non-Controlling Interests & Change in Working capital

30Results January – December 2018
Frequently Asked QuestionsCellnex’s Shareholding Structure
Source: CNMV and Cellnex’s 2018 Shareholders General Meeting(1) Includes stakes below 3%
Stable shareholding structure with a long-term focus
Others48.0%(1) 5.0%
5.9%
6.0%
6.0%
17.9%
4.8%
3.2% 3.2%
ConnecT S.p.A.29.9%
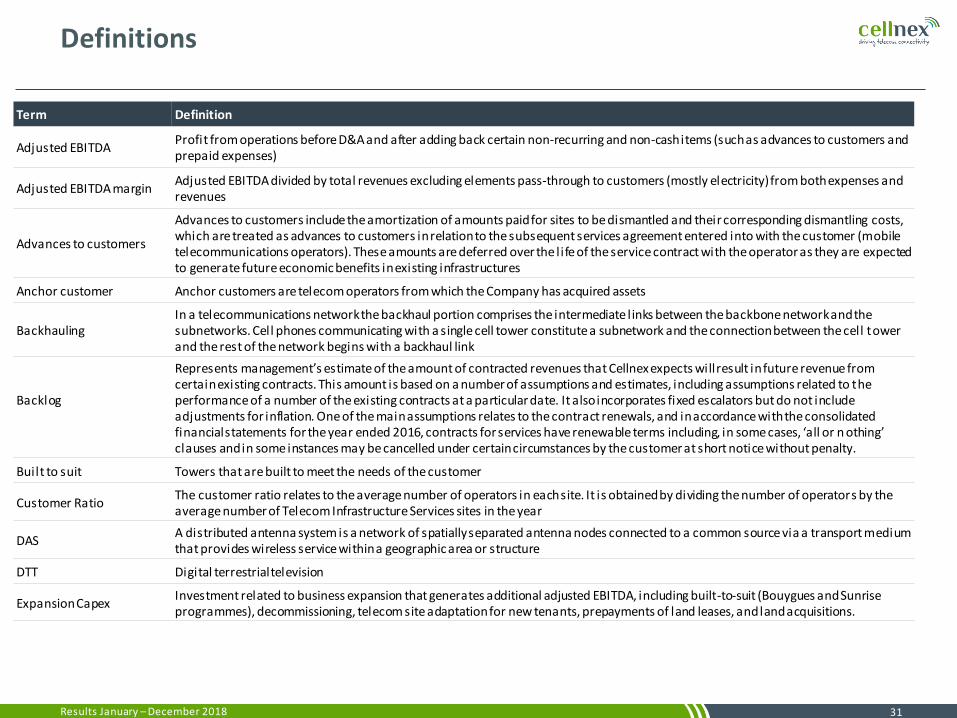
Definitions
Term Definition
Adjusted EBITDAProfit from operations before D&A and after adding back certain non-recurring and non-cash items (such as advances to customers and prepaid expenses)
Adjusted EBITDA marginAdjusted EBITDA divided by total revenues excluding elements pass-through to customers (mostly electricity) from both expenses and revenues
Advances to customers
Advances to customers include the amortization of amounts paid for sites to be dismantled and their corresponding dismantling costs, which are treated as advances to customers in relation to the subsequent services agreement entered into with the customer (mobile telecommunications operators). These amounts are deferred over the life of the service contract with the operator as they are expected to generate future economic benefits in existing infrastructures
Anchor customer Anchor customers are telecom operators from which the Company has acquired assets
BackhaulingIn a telecommunications network the backhaul portion comprises the intermediate links between the backbone network and the subnetworks. Cell phones communicating with a single cell tower constitute a subnetwork and the connection between the cell tower and the rest of the network begins with a backhaul link
Backlog
Represents management’s estimate of the amount of contracted revenues that Cellnex expects will result in future revenue fromcertain existing contracts. This amount is based on a number of assumptions and estimates, including assumptions related to the performance of a number of the existing contracts at a particular date. It also incorporates fixed escalators but do not include adjustments for inflation. One of the main assumptions relates to the contract renewals, and in accordance with the consolidated financial statements for the year ended 2016, contracts for services have renewable terms including, in some cases, ‘all or n othing’ clauses and in some instances may be cancelled under certain circumstances by the customer at short notice without penalty.
Built to suit Towers that are built to meet the needs of the customer
Customer RatioThe customer ratio relates to the average number of operators in each site. It is obtained by dividing the number of operators by the average number of Telecom Infrastructure Services sites in the year
DASA distributed antenna system is a network of spatially separated antenna nodes connected to a common source via a transport medium that provides wireless service within a geographic area or structure
DTT Digital terrestrial television
Expansion CapexInvestment related to business expansion that generates additional adjusted EBITDA, including built-to-suit (Bouygues and Sunrise programmes), decommissioning, telecom site adaptation for new tenants, prepayments of land leases, and land acquisitions.
31Results January – December 2018
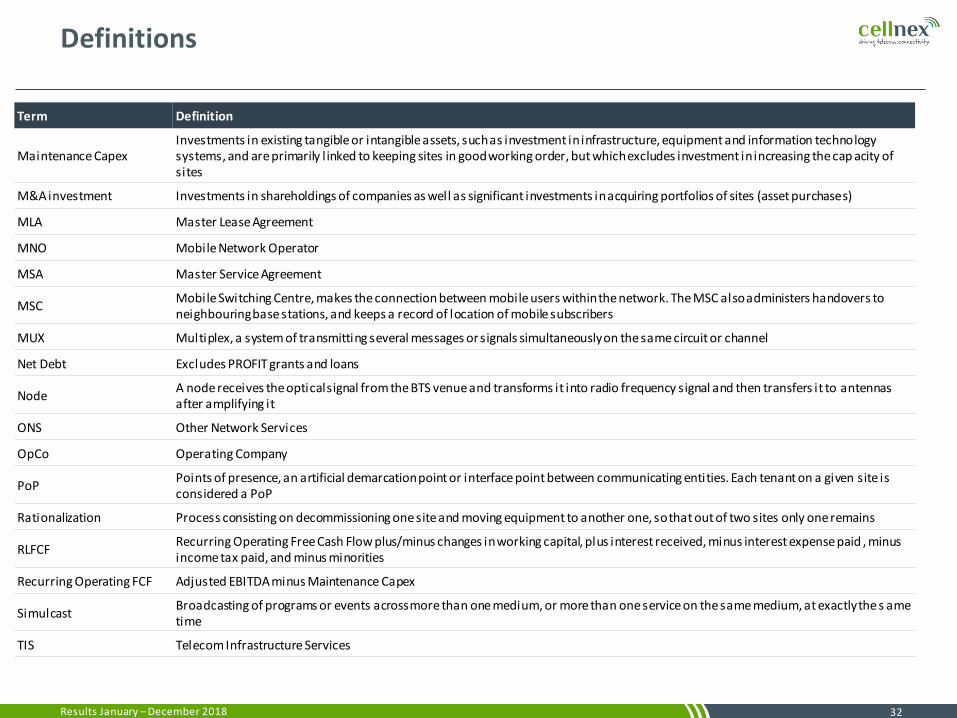
Definitions
Term Definition
Maintenance CapexInvestments in existing tangible or intangible assets, such as investment in infrastructure, equipment and information technology systems, and are primarily l inked to keeping sites in good working order, but which excludes investment in increasing the cap acity of sites
M&A investment Investments in shareholdings of companies as well as significant investments in acquiring portfolios of sites (asset purchases)
MLA Master Lease Agreement
MNO Mobile Network Operator
MSA Master Service Agreement
MSCMobile Switching Centre, makes the connection between mobile users within the network. The MSC also administers handovers to neighbouringbase stations, and keeps a record of location of mobile subscribers
MUX Multiplex, a system of transmitting several messages or signals simultaneously on the same circuit or channel
Net Debt Excludes PROFIT grants and loans
NodeA node receives the optical signal from the BTS venue and transforms it into radio frequency signal and then transfers it to antennas after amplifying it
ONS Other Network Services
OpCo Operating Company
PoPPoints of presence, an artificial demarcation point or interface point between communicating entities. Each tenant on a given site is considered a PoP
Rationalization Process consisting on decommissioning one site and moving equipment to another one, so that out of two sites only one remains
RLFCFRecurring Operating Free Cash Flow plus/minus changes in working capital, plus interest received, minus interest expense paid , minus income tax paid, and minus minorities
Recurring Operating FCF Adjusted EBITDA minus Maintenance Capex
SimulcastBroadcasting of programs or events across more than one medium, or more than one service on the same medium, at exactly the s ametime
TIS Telecom Infrastructure Services
32Results January – December 2018

Additional information available on the Investor Relations section of Cellnex’s website
Backup Excel File
Q4 2018 Results
33
FY 2018 Consolidated Annual Financial Statements
https://www.cellnextelecom.com/en/investor-relations/quaterly-results/
https://www.cellnextelecom.com/en/investor-relations/annual-report/
Results January – December 2018
Cellnex Telecom is part of ESG indices
(1)
(1) FTSE Russell confirmed Cellnex Telecom as FTSE4Good Index Series constituent in the review performed in the first half of 2018, and revised Cellnex’s overall score upwards to 3.9 out of 5, highlighting aspects related to corporate governance (4.5 out of 5). The company obtained the highest possible rating (5 out of 5) in work force standards and anti-corruption measures