titlepage - nso home...5.6 marriages by age and economic status/occupation of bride: 2013 90 5.7...
TRANSCRIPT

DEMOGRAPHIC REVIEW
2013
National Statistics Office, Malta. 2015

Published by the
National Statistics Office Lascaris
Valletta, VLT 2000 Malta
Tel.: (+356) 25997000 Fax: (+356) 25997103 / 25997205
e-mail: [email protected] http://www.nso.gov.mt
CIP Data Demographic Review 2013. – Valletta: National Statistics Office, 2015 xxv, 110p. ISBN: 978-99957-29-55-4 ISSN: 0076-3470 For further information, please contact: Unit C3: Population and Tourism Statistics Directorate C: Social Statistics National Statistics Office Lascaris Valletta VLT2000 Malta Tel.: (+356) 25997639 / (+356) 25997000 Our publications are available from: Unit D2: External Cooperation and Communication Directorate D: Resources and Support Services National Statistics Office Lascaris Valletta VLT2000 Malta Tel: (+356) 25997219 Fax: (+356) 25997205

Foreword
The Demographic Review is a publication which comprises the main demographic events together
with migration statistics. Detailed information on population counts, births, deaths, migration, family
formation and dissolution are presented in this publication.
This is the first annual demographic review to be published after the revisions exercise which was
carried out last year, further to the 2011 Population and Housing Census.
When analysing the data presented in the tables as well as emerging trends, users are encouraged to
consult the methodological notes. The National Statistics Office would like to thank the data
providers who supply crucial information required for the compilation of these statistics.
My appreciation goes to the staff of the Population and Tourism Statistics Unit for their work in
compiling this interesting and useful publication. I am certain that this publication will prove useful
to a large number of users, including researchers, policy makers, students and the general public.
Reuben Fenech Director General
July 2015

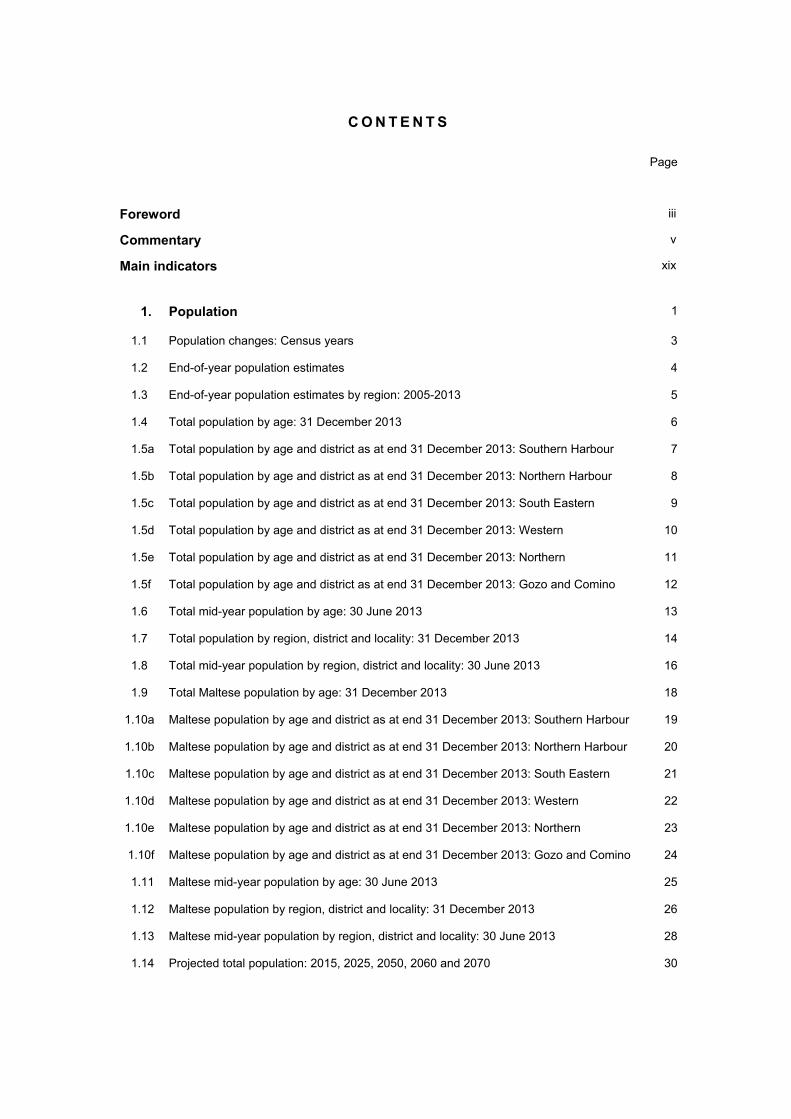
C O N T E N T S
Page
Foreword iii
Commentary v
Main indicators xix
1. Population 1
1.1 Population changes: Census years 3
1.2 End-of-year population estimates 4
1.3 End-of-year population estimates by region: 2005-2013 5
1.4 Total population by age: 31 December 2013 6
1.5a Total population by age and district as at end 31 December 2013: Southern Harbour 7
1.5b Total population by age and district as at end 31 December 2013: Northern Harbour 8
1.5c Total population by age and district as at end 31 December 2013: South Eastern 9
1.5d Total population by age and district as at end 31 December 2013: Western 10
1.5e Total population by age and district as at end 31 December 2013: Northern 11
1.5f Total population by age and district as at end 31 December 2013: Gozo and Comino 12
1.6 Total mid-year population by age: 30 June 2013 13
1.7 Total population by region, district and locality: 31 December 2013 14
1.8 Total mid-year population by region, district and locality: 30 June 2013 16
1.9 Total Maltese population by age: 31 December 2013 18
1.10a Maltese population by age and district as at end 31 December 2013: Southern Harbour 19
1.10b Maltese population by age and district as at end 31 December 2013: Northern Harbour 20
1.10c Maltese population by age and district as at end 31 December 2013: South Eastern 21
1.10d Maltese population by age and district as at end 31 December 2013: Western 22
1.10e Maltese population by age and district as at end 31 December 2013: Northern 23
1.10f Maltese population by age and district as at end 31 December 2013: Gozo and Comino 24
1.11 Maltese mid-year population by age: 30 June 2013 25
1.12 Maltese population by region, district and locality: 31 December 2013 26
1.13 Maltese mid-year population by region, district and locality: 30 June 2013 28
1.14 Projected total population: 2015, 2025, 2050, 2060 and 2070 30

Page
2. Births 31
2.1 Total and Maltese registered live births: 2000-2013 33
2.2 Total and Maltese live births resident in Malta: 2006-2013 33
2.3 Number and rate of total live births resident in Malta by residence of parents: 2013 34
2.4 Number and rate of Maltese live births resident in Malta by residence of parents: 2013 36
2.5 Total live births resident in Malta by age of mother/father and outside marriage: 2013 38
2.6 Maltese live births resident in Malta by age of mother/father and births outside marriage: 2013 39
2.7 Total live births resident in Malta by country of birth of mother/father and births outside marriage: 2013 40
2.8 Total live births resident in Malta by country of birth of mother and father: 2013 41
2.9 Total live births resident in Malta by age of mother and order of births: 2013 42
2.10 Maternities by type of maternity and age of mother reached at last birthday: 2013 43
2.11 Total live births resident in Malta by age and economic status/occupation of father: 2013 44
2.12 Monthly incidence of total live births resident in Malta: 2006-2013 45
3. Deaths 47
3.1 Deaths annual review: 2000-2013 49
3.2 Deaths by locality: 2013 50
3.3 Registered stillbirths: 2000-2013 52
3.4 Registered neonatal deaths and infant mortality: 2000-2013 53
3.5 Deaths by age reached at last birthday: 2000-2013 54
3.6 Deaths by age reached at last birthday: 2013 55
3.7 Deaths by age and marital status: 2013 56
3.8 Monthly incidence of deaths: 2000-2013 57
3.9 Deaths by cause: 2006-2013 58
3.10 Deaths of children under 5 by cause: 2013 59
3.11 Deaths by cause: 2013 60
3.12 Deaths by age and economic status/occupation at the time of death: 2013 66
3.13 Life table: 2013 67

Page
4. Migration 69
4.1 Annual estimates of migration flows: 2013 71
4.2 Boats arriving in Malta with irregular immigrants: 2002-2013 72
4.3 Boats arriving in Malta with irregular immigrants by nationality: 2013 72
4.4 Asylum applications filed with the Office of the Refugee Commissioner: 2002-2013 73
4.5 Asylum applications filed with the Office of the Refugee Commissioner by month: 2013 73
4.6 Asylum applications filed with the Office of the Refugee Commissioner by citizenship and age: 2013 74
4.7 Asylum decisions taken by the Office of the Refugee Commissioner: 2002-2013 75
4.8 Positive decisions (Refugee Status, Subsidiary Protection and other positive decisions) taken by the Office of the Refugee Commissioner by citizenship: 2013 76
4.9 Migrants residing in Open Centres and other institutional households by locality: 31 December 2011-2013 77
4.10 Migrants residing in open centres and other institutional households by sex: 31 December 2011-2013 77
4.11 Migrants residing in open centres and other institutional households by country of origin: 31 December 2011-2013 78
4.12 Third country nationals found to be illegally present and were subject to an obligation to leave and those who actually left Malta: 2013 79
4.13 Third country nationls found to be illegally present by citizenship, age and sex: 2013 80
4.14 Naturalisations and registrations: 2013 81
5. Family Formation and Dissolution 83
5.1 Number and rate of marriages occurring in Malta and Gozo: 2000-2013 85
5.2 Monthly and quarterly incidence of marriages: 2000-2013 86
5.3 Marriages classified by age and previous marital status of spouses: 2013 87
5.4 Marriages by previous marital status of spouses: 2013 88
5.5 Marriages by age and economic status/occupation of groom: 2013 89
5.6 Marriages by age and economic status/occupation of bride: 2013 90
5.7 Marriages by economic status/occupation of spouses: 2013 91
5.8 Marriages by region and age of spouses: 2013 92
5.9 Spouses by country of citizenship and age: 2013 93
5.10 Spouses previously residing in Malta by previous marital status and district: 2013 94

Page
Family Formation and Dissolution (continued)
5.11 Spouses previously residing abroad by previous marital status and country of residence: 2013 95
5.12 Spouses previously residing in Malta by citizenship and resident district before marriage: 2013 96
5.13 Spouses previously residing abroad by citizenship and previous country of residence: 2013 97
5.14 Total marriages classified by citizenship of spouses: 2013 98
5.15 Civil marriages by age and citizenship of spouses: 2013 99
5.16 Civil marriages by citizenship of spouses: 2013 100
5.17 Civil marriages by previous marital status of spouses: 2013 101
5.18 Registered separations by citizenship of spouses: 2013 101
5.19 Registered divorces recognised by Maltese Authority by country from where divorce was obtained: 2013 101
5.20 Registered divorces recognised by Maltes Authorities by duration of previous marriage: 2013 102
5.21 Registered annulments by duration of previous marriage and type of annulment: 2013 102

Commentary 1. Population
At the end of 2013, the total population of Malta stood at an estimated 425,384 – an increase of 1.0 per cent when compared to the previous year. The majority of the population was constituted of Maltese residents (94.1 per cent) while the remaining 5.9 per cent (24,980) were foreigners. 17.8 per cent of the population were children under the age of 18, while a quarter of the population were persons aged 60 and over.
The Northern Harbour District, once again the largest district in Malta, had an estimated population of 123,663 inhabitants (29.1 per cent of the total population). The smallest district was the district of Gozo and Comino with 7.4 per cent of the total population. The largest localities were Birkirkara, Mosta and St Paul’s Bay while the smallest was Mdina with only 236 persons residing.
Southern Harbour18.7%
Northern Harbour29.1%
South Eastern15.6%
Western13.8%
Northern15.4%
Gozo and Comino
7.4%
Chart 1. Percentage population by district: 2013
0.0
0.5
1.0
1.5
2.0
2.5
3.0
3.5
0 10 20 30 40 50 60 70 80 90+
popu
latio
n ('0
00)
ages
Chart 2. Total population by single years of age: 2013
Males Females
ix

2. Births
A total of 4,127 babies were born and registered in Malta during 2013. The majority of these babies (97.7 per cent) were born to mothers who were residing in Malta at the time of birth. The total number of births registered decreased by 2.5 per cent when compared to the previous year, while a decrease of 4.7 per cent was observed in Maltese births being registered. During the year under review, 90.9 per cent of the resident births were of Maltese nationality. During 2013, 28.0 per cent of the babies born to resident mothers were residing in the Northern Harbour District.
Slightly more than half of the babies born to mothers residing in Malta, were born to mothers aged between 30 and 39, while 4.0 per cent were born to mothers aged under 20. Of the babies born to resident mothers, a quarter were born outside wedlock, of which 16.2 per cent, or 167 babies, were registered as having an unknown father. Nearly half of the babies born with an unknown father were born to mothers under the age of 25, while a further 9.0 per cent (15 babies) were born to mothers aged over 35. The majority of babies were born to parents who were both born in Malta and have been residing in Malta (81.0 per cent). A further 2.6 per cent of the babies born were born to parents who were both born in the African continent while 2.4 per cent of the babies were born to parents who were both born in other EU member states. Of the 4,032 babies born to mothers residing in Malta, 96.3 per cent were single maternities. During 2013, there were 74 pairs of twins born. September, October and December 2013 were the most popular months for babies to be born in during the year under review.
3. Deaths
The total number of deaths registered during 2013 stood at 3,236, a decrease of 5 per cent when compared to total number of registered deaths during the previous year. Almost 70 per cent of these deaths took place in hospital. The crude death rate for Malta stood at 7.5 while that for Gozo stood at 9.5 during 2013. The Northern Harbour District registered the largest number of deaths (30 per cent of total registered deaths) while the district of Gozo and Comino registered the smallest number of deaths with 9 per cent of total registered deaths.
84
86
88
90
92
94
96
98
100
2000
2001
2002
2003
2004
2005
2006
2007
2008
2009
2010
2011
2012
2013
per
cent
year
Chart 3. Percentage of Maltese registered live births from total registered live births: 2000-2013
x

There were 19 stillbirths in 2013 – a decrease of 5.0 per cent when compared to the previous year. Nearly two thirds of all still born babies weighed more than 1000g. Cases of infant mortality increased from 22 in 2012 to 27 in 2013. Sixty-five per cent of registered deaths involved persons aged 75 and over. Mortalities of persons aged between 20 and 34 years decreased by 30.4 per cent when compared to the previous year. Deaths of persons aged 35-44 and 45-54 registered decreases of 29.1 per cent and 15.2 per cent respectively. Around 40 per cent of registered deaths occured during the winter months of January, Febraury, March and December.
Forty per cent of all deaths in 2013 were attributed to diseases of the circulatory system while a further 26.9 per cent occurred due to neoplasms. More than half of deaths caused by diseases of the circulatory system were due to ischaemic heart diseases. On the other hand, 17.7 per cent of the deaths caused by neoplasms were due to malignant neoplasm of the trachea, bronchus and lung. A further 10.6 per cent, 3.7 per cent and 3.6 per cent died of
Southern Harbour23.5%
Northern Harbour30.3%
South Eastern 12.3%
Western12.0%
Northern12.6%
Gozo and Comino
9.3%
Chart 4. Deaths by district: 2013
0
100
200
300
400
500
600
700
0-4
5-9
10-1
4
15-1
9
20-2
4
25-2
9
30-3
4
35-3
9
40-4
4
45-4
9
50-5
4
55-5
9
60-6
4
65-6
9
70-7
4
75-7
9
80-8
4
85-8
9
90+
num
ber
age
Chart 5. Deaths by completed age at time of death: 2013
Females Males
xi

diseases of the respiratory system, mental and behavioural disorders and endocrine, nutritional and metabolic diseases respectively.
4. Family formation and dissolution
A total of 2,578 marriages were registered in Malta during 2013 – a decrease of 8.7 per cent when compared to the previous year. Civil Marriages accounted for 46.5 per cent of total registered marriages in 2013 as opposed to 41.4 per cent during the previous year. Marriages registered in Malta decreased by 7.9 per cent while marriages registered in Gozo decreased by 18.0 per cent when compared to the previous year. The second quarter of 2013 proved to be the most popular period chosen by spouses, with nearly a third of the total marriages occurring during May and June.
Certain infectious and parasitic diseases
0.7%
Neoplasms26.9%
Endocrine, Nutritional and Metabolic diseases, and
diseases of blood forming organs
3.6%
Mental and behavioural disorders
3.7%
Diseases of the nervous system anddiseases of the ear
and mastoid process2.6%
Diseases of the respiratory
system10.6%
Diseases of the digestive system
3.1%
Diseases of the skin and
subcutaneous tissue0.6%
Diseases of the Musculo-skeletal system and the
connective tissue0.4%
Diseases of the genito-urinary system
3.0%
Pregnancy, childbirth and the puerperium,
and certain conditions originating
in theperinatal period
0.4%
Diseases of the circulatory system
40.1%
Congenital malformations,
deformations and chromosomal abnormalities
0.3%
Symptoms, signs and abnormal clinical and
laboratory findings n.e.c.0.7%
External causes of morbidity and
mortality3.3%
Chart 6. Deaths by cause: 2013
xii

The majority (89.1 per cent) of all marriages involved brides and grooms who were single before marriage. Of all the grooms married during 2013, 33.9 per cent were aged between 25 and 29 while 28.2 per cent fell within the 30-34 year-old age group. On the other hand, 39.1 per cent of all brides married during 2013 were aged between 25 and 29 while 23.2 per cent were aged between 30 and 34.
During 2013, 63.0 per cent and 64.5 per cent of brides and grooms respectively were of Maltese citizenship. More than half of the registered marriages took place between two Maltese spouses (56.2 per cent) while 350 couples (13.6 per cent) took place between British couples. Slightly less than three-fourths of both brides and grooms resided in Malta before the marriage while the remaining spouses were residing abroad. Out of a total 1,199 civil marriage registered during 2013, 45.5 per cent of the marriages involved at least one Maltese spouse. In 59.9 per cent of cases of civil marriages in 2013, both spouses were previously single.
0
100
200
300
400
500
600
Janu
ary
Feb
ruar
y
Mar
ch
Apr
il
May
June
July
Aug
ust
Sep
tem
ber
Oct
ober
Nov
embe
r
Dec
embe
r
num
ber
month
Chart 7. Registered marriages by month: 2013
0
500
1000
1500
2000
2500
3000
2000 2001 2002 2003 2004 2005 2006 2007 2008 2009 2010 2011 2012 2013
num
ber
year
Chart 8. Number of marriages registered in Malta and Gozo: 2000-2013
Civil marriages Religious marriages
xiii

A total of 666 separations were registered at the Public Registry during the year under review. The majority (99.2 per cent) of these separations involved at least one Maltese spouse. During 2013, 399 divorces were registered. The majority of the divorces registered (84.7 per cent) were granted by the responsible Maltese authority while a further 8.5 per cent were granted by the responsible British authorities and recognised by Maltese authorities. Of all the divorces recognised during 2013, 82.7 per cent of the cases involved marriages that had lasted for at least ten years. There were 90 annulments granted during 2013 – 56.7 per cent were civil annulments and 43.3 per cent were religious annulments. In 60.0 per cent of the cases, the duration of marriage was of ten years or more.
5. International Migration
During 2013, an estimated 8,428 persons immigrated to Malta. Less than a quarter of these immigrants were Maltese returned migrants accounting for 21.4 per cent of total immigration figure, while 37.3 per cent of immigrants were EU nationals. The remaining 41.0 per cent were third-country nationals. Nearly two-thirds of immigrants were males with the largest proportion of immigrants being males aged between 20 and 29. On the other hand, an estimated 5,204 persons left Malta during the period under review. Slightly more than a quarter of these emigrants were estimated to be Maltese citizens, while 40.1 per cent and 33.8 per cent were EU nationals and third-country nationals respectively. More males emigrated during 2013 (59.9 per cent) with the largest proportion of emigrants being males aged between 20 and 29 years (20.8 per cent).
10-19 years38.6%
20 years or more
44.1%
Unspecified
0.3%
Less than 5 years3.0%
5-9 years14.0%
Chart 9. Divorces recognised by Maltese authorities by duration of
marriage: 2013
Malta84.7%
United Kingdom
8.5%Other EU countries
1.5%
Other European countries
1.0%Other
countries4.3%
Chart 10. Divorces recognised by Maltese Authorities by
country from where divorce was obtained: 2013
5-9 years25.6%
10-19 years53.8%
20 years or
more20.5%
Chart 11. Registered religious annulments by duration of
marriage: 2013
Less than 5 years23.5%5-9
years27.5%
10-19 years37.3% 20 years
or more11.8%
Chart 12. Registered civil annulments by duration of
marriage: 2013
xiv

During the year under review, 24 boats carrying irregular migrants reached Maltese shores. These 24 boats carried 2,008 migrants – an increase of 6.2 per cent in persons on board when compared to the previous year. The majority of these persons on board were of African citizenship (88.7 per cent), while the remaining 11.3 per cent were of Asian origin. Almost half of the persons on board were Somali nationals, 23.0 per cent were Eritrean nationals and 8.4 per cent were Syrian nationals.
The Office of the Refugee Commissioner received 2,246 applications for asylum during 2013 – an increase of 8.0 per cent when compared to 2012. A third of the applications were submitted in August while July and September also proved to be busy months with 19.5 per cent and 13.0 per cent of applications being submitted respectively. The majority of the applicants were males (83.3 per cent) while the largest proportion of applicants (56.5 per cent) comprised males aged between 18 and 34 years. African applicants made up 87.5 per cent of the applications filed during 2013, while a further 12.4 per cent of the applications being filed by Asian nationals.
0500
1,0001,5002,0002,5003,0003,5004,000
Malta EU Member States Non-EU countries
num
ber
country of citizenship
Chart 13. Annual estimates of migration flows by country of citizenship: 2013
Immigration Emigration
0
10
20
30
40
50
60
70
80
90
0
500
1000
1500
2000
2500
3000
2002 2003 2004 2005 2006 2007 2008 2009 2010 2011 2012 2013
num
ber
of b
oats
arr
ivin
g
num
ber
of p
eopl
e on
boa
rd
year
Chart 14. Boats arriving in Malta with irregular immigrants: 2002-2013
Number of people on board Number of boats arriving (refer to right axis)
xv

During 2013, 1,905 cases were decided by the Office of the Refugee Commissioner – an increase of 19.8 per cent when compared to the previous year. The majority of the decisions (84.3 per cent) were positive decisions, of which 43 persons were granted Refugee Status while 1,563 were granted Subsidiary Protection and other forms of protection. Nearly 300 applications were rejected, or 15.7 per cent of all applications submitted. Of all the persons who were granted protection during 2013, 83.1 per cent were African nationals while the remaining 16.9 per cent were Asians. Slightly more than three quarters of the new beneficiaries of protection in 2013 were Somali and Eritrean nationals.
At the end of 2013, the open centre population totalled at 1,499. The largest proportion of persons residing in open centres and institutional households were living in Hal Far (60.4 per cent). Slightly less than two-thirds of the population were adult males. The majority of residents, or 95.6 of the total, were citizens of African countries (95.6 per cent), of which, 73.8 per cent originated from Eritrea and Somalia.
02004006008001,0001,2001,4001,6001,800
0
500
1,000
1,500
2,000
2,500
3,000
2002 2003 2004 2005 2006 2007 2008 2009 2010 2011 2012 2013
num
ber
of d
ecis
ions
num
ber
of a
pplic
atio
ns
year
Chart 15. Applications and decisions handled by the Office of the Refugee Commissioner: 2002-2013
Number of applications Positive decisions (refer to right axis) Rejections (refer to right axis)
Eritrea34%
Ethiopia1%
Libya4%
Sudan1%
Somalia42%
Other African countries
1%
Syrian Arab Republic
17%
Other Asian countries
0%
Chart 16. Positive decisions by citizenship: 2013
xvi

The police reported 2,437 cases of persons found to residing in Malta illegally. The majority of these persons were African nationals, with 41.1 per cent of the total being Somali and 19.0 per cent being Eritrean. A further 13.6 per cent were Asian nationals. Persons who were actually returned to their country of origin totalled at 460 during 2013. The majority of persons (60.1 per cent) who returned to their country of origin, were African nationals. Moreover, nearly half of all persons returned were Libyan nationals. A further 20.7 per cent were sent back to Asian countries. The largest proportion of persons found to be residing illegally were males aged between 18 and 34 (56.1 per cent). There were 1,019 persons who obtained Maltese citizenship through naturalisation or registration during 2013. More than a third of the persons obtaining Maltese citizenship were citizens of European countries with the largest proportion, 15.1 per cent, having British citizenship. Australian nationals accounted for 33.5 per cent of total naturalisations and registrations during the period under review.
Europe2.3%
Africa82.8%
America1.1%
Asia13.6%
Oceania0.2%
Chart 17. Third country nationals found to be illegally present and who were subject to an obligation to leave:
2013
Europe12.0%
Africa60.9%
America5.7%
Asia20.7%
Oceania0.9%
Chart 18. Third country nationals found to be illegally present and
who actually left Malta: 2013
xvii


MAIN INDICATORS


2006 2007 2008 2009 2010 2011 2012 2013
Total Population (end December)
Total 405,616 407,832 410,926 414,027 414,989 417,546 421,364 425,384
Males 201,519 202,734 204,607 206,203 206,405 207,695 209,880 212,424
Females 204,097 205,098 206,319 207,824 208,584 209,851 211,484 212,960
Maltese Population (end December)
Total 392,215 393,107 394,135 395,075 395,850 397,244 398,898 400,404
Males 194,791 195,254 195,681 196,052 196,397 197,027 197,857 198,648
Females 197,424 197,853 198,454 199,023 199,453 200,217 201,041 201,756
Percentage annual total population increase
Total 0.2% 0.5% 0.8% 0.8% 0.2% 0.6% 0.9% 1.0%
Males 0.3% 0.6% 0.9% 0.8% 0.1% 0.6% 1.1% 1.2%
Females 0.0% 0.5% 0.6% 0.7% 0.4% 0.6% 0.8% 0.7%
Percentage annual Maltese population increase
Total -0.2% 0.2% 0.3% 0.2% 0.2% 0.4% 0.4% 0.4%
Males -0.1% 0.2% 0.2% 0.2% 0.2% 0.3% 0.4% 0.4%
Females -0.3% 0.2% 0.3% 0.3% 0.2% 0.4% 0.4% 0.4%
Total Mid-Year Population
Total 405,355 406,778 409,429 412,530 414,562 416,318 419,507 423,431
Males 201,201 202,150 203,696 205,432 206,333 207,072 208,811 211,182
Females 204,154 204,628 205,733 207,098 208,229 209,246 210,696 212,249
Maltese Mid-Year Population
Total 392,575 392,711 393,677 394,660 395,515 396,606 398,132 399,710
Males 194,872 195,048 195,495 195,894 196,250 196,745 197,476 198,282
Females 197,703 197,663 198,182 198,766 199,265 199,861 200,656 201,428
Main indicators: 2006-2013 ...
xxi

2006 2007 2008 2009 2010 2011 2012 2013
Number of registered total live births
Total 3,885 3,871 4,126 4,143 4,008 4,283 4,231 4,127
Males 2,039 2,036 2,151 2,146 2,056 2,182 2,191 2,160
Females 1,846 1,835 1,975 1,997 1,952 2,101 2,040 1,967
Number of registered Maltese live births
Total 3,720 3,692 3,890 3,901 3,786 3,953 3,855 3,672
Males 1,953 1,939 2,033 2,012 1,941 2,016 2,009 1,910
Females 1,767 1,753 1,857 1,889 1,845 1,937 1,846 1,762
Number of total live births resident in Malta
Total 3,779 3,765 4,013 4,029 3,898 4,165 4,130 4,032
Males 1,983 1,980 2,092 2,087 2,000 2,116 2,141 2,109
Females 1,796 1,785 1,921 1,942 1,898 2,049 1,989 1,923
Number of Maltese live births resident in Malta
Total 3,711 3,683 3,880 3,891 3,777 3,943 3,838 3,666
Males 1,948 1,934 2,028 2,007 1,936 2,011 1,999 1,909
Females 1,763 1,749 1,852 1,884 1,841 1,932 1,839 1,757
Crude birth rate
Total live births resident in Malta 9.3 9.3 9.8 9.8 9.4 10.0 9.8 9.5
Maltese live births resident in Malta 9.5 9.4 9.9 9.9 9.5 9.9 9.6 9.2
Mean age at childbearing
Total registered live birth 28.28 28.46 28.56 28.58 28.83 29.23 29.33 29.57
Total live births resident in Malta 28.30 28.49 28.58 28.62 28.89 29.28 29.32 29.56
Maltese live births resident in Malta 28.28 28.45 28.53 28.62 28.86 29.26 29.30 29.60
Fertility rate
Total fertility rate 1.36 1.35 1.42 1.41 1.36 1.45 1.42 1.37
Maltese fertility rate 1.39 1.38 1.44 1.45 1.41 1.47 1.42 1.36
... Main indicators: 2006-2013
xxii

2006 2007 2008 2009 2010 2011 2012 2013
Number of deaths
Total 3,216 3,111 3,243 3,221 3,010 3,267 3,418 3,236
Males 1,667 1,610 1,668 1,672 1,489 1,664 1,746 1,636
Females 1,549 1,501 1,575 1,549 1,521 1,603 1,672 1,600
Crude death rate
Total crude death rate 7.9 7.6 7.9 7.8 7.3 7.8 8.1 7.6
Maltese crude death rate 8.0 7.6 8.0 7.9 7.4 7.9 8.2 7.8
Infant mortality rate 3.7 6.6 8.5 5.5 5.6 6.5 5.3 6.7
Life expectation at age 0
Total 79.5 79.9 79.7 80.4 81.5 80.9 80.9 81.9
Males 77.0 77.6 77.1 77.9 79.3 78.7 78.6 79.6
Females 82.0 82.2 82.3 82.7 83.6 83.0 83.0 84.0
Life expectation at age 65
Total 18.0 18.6 18.7 18.9 20.0 19.4 19.4 20.1
Males 16.2 16.7 17.1 16.8 18.5 17.7 17.6 18.4
Females 19.6 20.3 20.1 20.6 21.1 21.0 21.0 21.5
Migration flows
Immigration 3,889 5,292 6,043 6,161 4,275 5,465 7,111 8,428
Emigration 3,835 3,730 3,719 3,868 4,201 3,806 4,005 5,204
Number of irregular immigrants arriving by boat 1,780 1,702 2,775 1,475 47 1,579 1,890 2,008
Number of applications for asylum submitted at the Office of the Refugee Commissioner
1,261 1,386 2,608 2,387 176 1,891 2,080 2,246
Number of granted Refugee Status 22 7 19 20 43 70 35 43
Number of granted Subsidiary Protection 481 623 1,397 1,671 179 814 1,398 1,563
... Main indicators: 2006-2013
xxiii
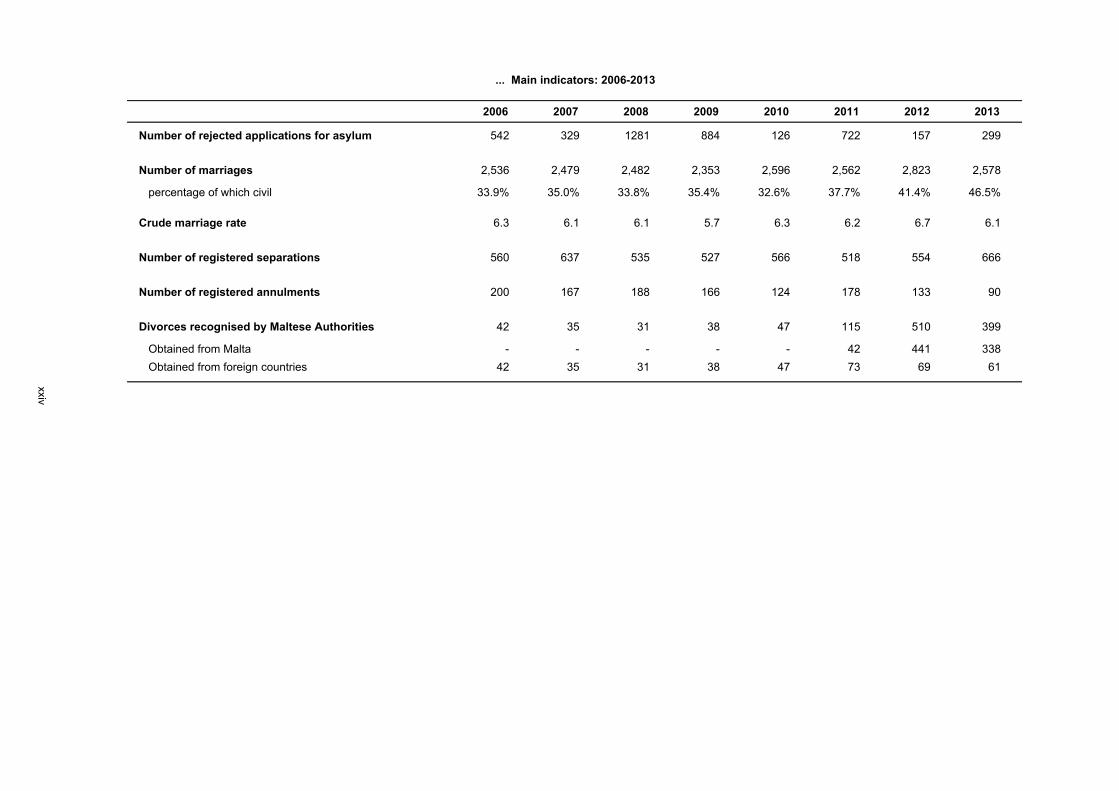
2006 2007 2008 2009 2010 2011 2012 2013
Number of rejected applications for asylum 542 329 1281 884 126 722 157 299
Number of marriages 2,536 2,479 2,482 2,353 2,596 2,562 2,823 2,578
percentage of which civil 33.9% 35.0% 33.8% 35.4% 32.6% 37.7% 41.4% 46.5%
Crude marriage rate 6.3 6.1 6.1 5.7 6.3 6.2 6.7 6.1
Number of registered separations 560 637 535 527 566 518 554 666
Number of registered annulments 200 167 188 166 124 178 133 90
Divorces recognised by Maltese Authorities 42 35 31 38 47 115 510 399
Obtained from Malta - - - - - 42 441 338
Obtained from foreign countries 42 35 31 38 47 73 69 61
... Main indicators: 2006-2013
xxiv

1. POPULATION

Males Females Total Males Females Total Males Females Total
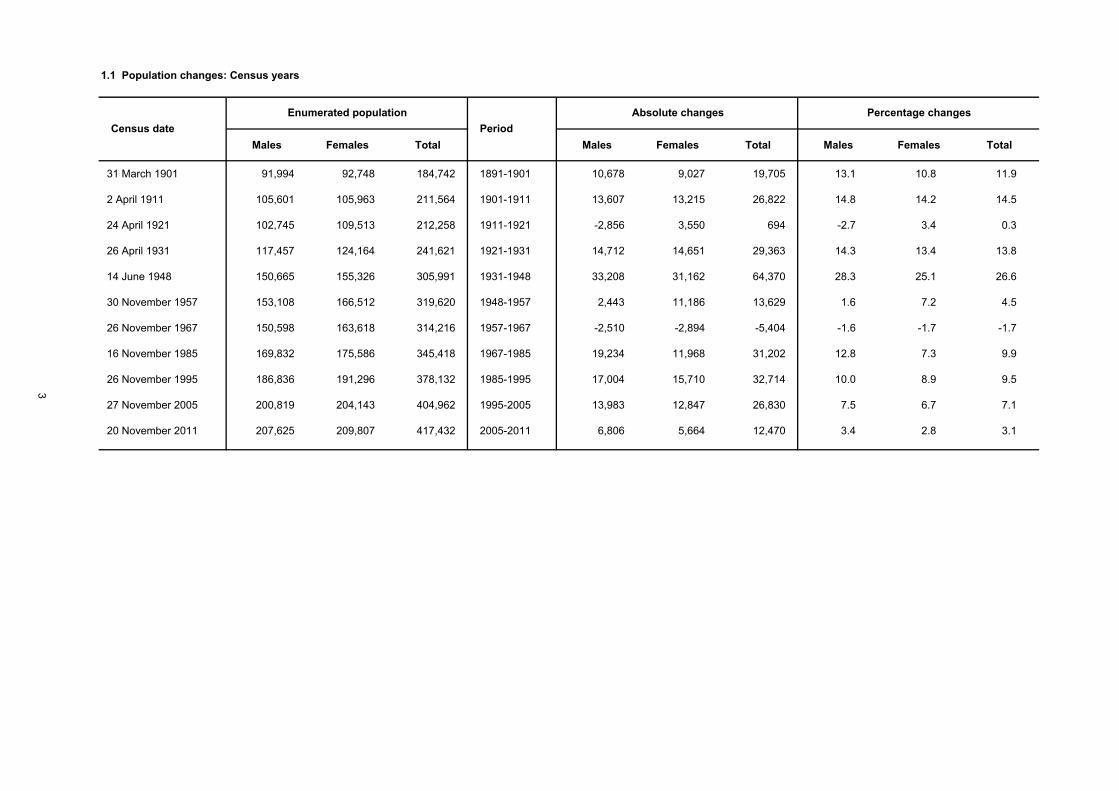
31 March 1901 91,994 92,748 184,742 1891-1901 10,678 9,027 19,705 13.1 10.8 11.9
2 April 1911 105,601 105,963 211,564 1901-1911 13,607 13,215 26,822 14.8 14.2 14.5
24 April 1921 102,745 109,513 212,258 1911-1921 -2,856 3,550 694 -2.7 3.4 0.3
26 April 1931 117,457 124,164 241,621 1921-1931 14,712 14,651 29,363 14.3 13.4 13.8
14 June 1948 150,665 155,326 305,991 1931-1948 33,208 31,162 64,370 28.3 25.1 26.6
30 November 1957 153,108 166,512 319,620 1948-1957 2,443 11,186 13,629 1.6 7.2 4.5
26 November 1967 150,598 163,618 314,216 1957-1967 -2,510 -2,894 -5,404 -1.6 -1.7 -1.7
16 November 1985 169,832 175,586 345,418 1967-1985 19,234 11,968 31,202 12.8 7.3 9.9
26 November 1995 186,836 191,296 378,132 1985-1995 17,004 15,710 32,714 10.0 8.9 9.5
27 November 2005 200,819 204,143 404,962 1995-2005 13,983 12,847 26,830 7.5 6.7 7.1
20 November 2011 207,625 209,807 417,432 2005-2011 6,806 5,664 12,470 3.4 2.8 3.1
1.1 Population changes: Census years
Census date
Enumerated population Percentage changes
Period
Absolute changes
3

Year Males Females Total Year Males Females Total
1985* 169,973 175,732 345,705 1985* 167,875 173,032 340,907
1986 171,284 177,088 348,372 1986 169,196 174,318 343,514
1987 172,534 178,380 350,914 1987 170,369 175,267 345,636
1988 174,313 180,219 354,532 1988 172,142 176,872 349,014
1989 176,110 182,078 358,188 1989 173,895 178,535 352,430
1990 177,939 183,969 361,908 1990 175,782 180,128 355,910
1991 179,843 185,938 365,781 1991 177,685 181,858 359,543
1992 181,649 187,806 369,455 1992 179,427 183,550 362,977
1993 183,471 189,690 373,161 1993 181,232 185,199 366,431
1994 185,079 191,354 376,433 1994 182,838 186,613 369,451
1995* 186,970 191,434 378,404 1995* 183,875 187,298 371,173
1996 188,452 192,953 381,405 1996 185,319 188,639 373,958
1997 189,968 194,208 384,176 1997 186,664 189,849 376,513
1998 191,120 195,277 386,397 1998 187,689 190,829 378,518
1999 192,428 196,331 388,759 1999 188,589 191,612 380,201
2000 193,689 197,726 391,415 2000 189,720 192,805 382,525
2001 195,363 199,278 394,641 2001 191,025 194,052 385,077
2002 196,836 200,460 397,296 2002 191,975 194,963 386,938
2003 198,099 201,768 399,867 2003 192,934 195,933 388,867
2004 199,580 203,088 402,668 2004 193,917 196,752 390,669
2005* 200,838 204,161 404,999 2005* 194,906 197,934 392,840
2006 201,519 204,097 405,616 2006 194,791 197,424 392,215
2007 202,734 205,098 407,832 2007 195,254 197,853 393,107
2008 204,607 206,319 410,926 2008 195,681 198,454 394,135
2009 206,203 207,824 414,027 2009 196,052 199,023 395,075
2010 206,405 208,584 414,989 2010 196,397 199,453 395,850
2011* 207,695 209,851 417,546 2011* 197,027 200,217 397,244
2012 209,880 211,484 421,364 2012 197,857 201,041 398,898
2013 212,424 212,960 425,384 2013 198,648 201,756 400,404
* Based on Census taken in year
1.2 End-of-year population estimates
Total population Maltese population
4

1.3 End-of-year population estimates by region: 2005-2013
Males Females Total Males Females Total Males Females Total
2005 185,552 188,440 373,992 15,286 15,721 31,007 200,838 204,161 404,999
2006 186,220 188,433 374,653 15,299 15,664 30,963 201,519 204,097 405,616
2007 187,385 189,411 376,796 15,349 15,687 31,036 202,734 205,098 407,832
2008 189,154 190,594 379,748 15,453 15,725 31,178 204,607 206,319 410,926
2009 190,668 192,037 382,705 15,535 15,787 31,322 206,203 207,824 414,027
2010 190,894 192,791 383,685 15,511 15,793 31,304 206,405 208,584 414,989
2011 192,119 194,024 386,143 15,576 15,827 31,403 207,695 209,851 417,546
2012 194,259 195,647 389,906 15,621 15,837 31,458 209,880 211,484 421,364
2013 196,800 197,138 393,938 15,624 15,822 31,446 212,424 212,960 425,384
YearTotalMalta Gozo
5

1.4 Total population by age: 31 December 2013*
Age Males Females Total Age Males Females Total
0-9 20,923 19,536 40,459 50-59 30,060 29,812 59,872
Less than 1 2,129 1,933 4,062 50 2,789 2,728 5,517
1 2,211 2,056 4,267 51 2,966 2,944 5,910
2 2,166 2,111 4,277 52 3,021 2,896 5,917
3 2,061 1,979 4,040 53 3,104 3,113 6,217
4 2,120 2,019 4,139 54 3,000 3,087 6,087
5 2,164 1,983 4,147 55 3,019 3,093 6,112
6 2,047 1,836 3,883 56 3,116 3,098 6,214
7 2,034 1,836 3,870 57 3,104 3,058 6,162
8 2,006 1,890 3,896 58 3,024 2,896 5,920
9 1,985 1,893 3,878 59 2,917 2,899 5,816
10-19 23,504 22,175 45,679 60-69 28,694 29,845 58,539
10 2,012 2,016 4,028 60 2,794 2,806 5,600
11 2,050 1,886 3,936 61 2,808 2,891 5,699
12 2,042 1,939 3,981 62 2,771 2,872 5,643
13 2,179 2,218 4,397 63 3,027 3,029 6,056
14 2,236 2,175 4,411 64 3,005 3,041 6,046
15 2,383 2,269 4,652 65 3,030 3,156 6,186
16 2,520 2,308 4,828 66 2,996 3,235 6,231
17 2,587 2,381 4,968 67 2,840 3,056 5,896
18 2,737 2,437 5,174 68 2,678 2,876 5,554
19 2,758 2,546 5,304 69 2,745 2,883 5,628
20-29 31,759 29,246 61,005 70-79 13,472 16,595 30,067
20 2,946 2,723 5,669 70 1,847 2,138 3,985
21 3,066 2,835 5,901 71 1,266 1,428 2,694
22 3,105 2,930 6,035 72 1,301 1,554 2,855
23 3,214 2,933 6,147 73 1,407 1,690 3,097
24 3,219 3,115 6,334 74 1,480 1,770 3,250
25 3,294 3,075 6,369 75 1,433 1,752 3,185
26 3,165 2,937 6,102 76 1,346 1,738 3,084
27 3,261 2,819 6,080 77 1,312 1,630 2,942
28 3,256 2,916 6,172 78 1,121 1,536 2,657
29 3,233 2,963 6,196 79 959 1,359 2,318
30-39 31,787 29,640 61,427 80-89 5,257 9,091 14,348
30 3,275 3,039 6,314 80 907 1,399 2,306
31 3,333 3,176 6,509 81 794 1,315 2,109
32 3,146 2,985 6,131 82 676 1,206 1,882
33 3,218 2,913 6,131 83 617 1,070 1,687
34 3,178 2,998 6,176 84 504 884 1,388
35 3,142 2,939 6,081 85 452 763 1,215
36 3,221 2,947 6,168 86 402 757 1,159
37 3,120 2,975 6,095 87 366 632 998
38 3,161 2,881 6,042 88 307 549 856
39 2,993 2,787 5,780 89 232 516 748
40-49 26,354 25,520 51,874 90+ 614 1,500 2,114
40 2,824 2,738 5,562
41 2,760 2,666 5,426 Total 212,424 212,960 425,384
42 2,745 2,614 5,359
43 2,661 2,515 5,176
44 2,516 2,370 4,886
45 2,552 2,467 5,019
46 2,451 2,448 4,899
47 2,502 2,437 4,939
48 2,586 2,587 5,173
49 2,757 2,678 5,435
* Based on the November 2011 Census
6

1.5a Total population by age and district as at end 31 December 2013*: Southern Harbour
Age Males Females Total Age Males Females Total
0-9 3,755 3,481 7,236 50-59 5,545 5,496 11,041
Less than 1 361 333 694 50 483 455 938
1 380 355 735 51 532 485 1,017
2 398 342 740 52 523 498 1,021
3 349 356 705 53 568 539 1,107
4 400 362 762 54 562 568 1,130
5 393 349 742 55 526 579 1,105
6 374 346 720 56 579 622 1,201
7 352 331 683 57 604 609 1,213
8 372 354 726 58 585 524 1,109
9 376 353 729 59 583 617 1,200
10-19 4,339 4,001 8,340 60-69 5,903 6,085 11,988
10 377 380 757 60 560 537 1,097
11 375 356 731 61 566 590 1,156
12 398 322 720 62 563 554 1,117
13 416 391 807 63 603 616 1,219
14 413 396 809 64 615 580 1,195
15 433 380 813 65 590 632 1,222
16 458 414 872 66 635 671 1,306
17 459 469 928 67 587 623 1,210
18 511 443 954 68 585 622 1,207
19 499 450 949 69 599 660 1,259
20-29 5,761 5,204 10,965 70-79 2,820 3,521 6,341
20 542 465 1,007 70 385 450 835
21 542 486 1,028 71 248 285 533
22 531 537 1,068 72 255 312 567
23 580 526 1,106 73 296 325 621
24 565 536 1,101 74 291 396 687
25 614 524 1,138 75 293 388 681
26 555 552 1,107 76 298 385 683
27 608 473 1,081 77 291 342 633
28 575 565 1,140 78 259 338 597
29 649 540 1,189 79 204 300 504
30-39 5,984 5,274 11,258 80-89 1,141 2,146 3,287
30 633 552 1,185 80 198 342 540
31 673 608 1,281 81 147 300 447
32 609 532 1,141 82 143 286 429
33 609 548 1,157 83 140 234 374
34 555 524 1,079 84 129 211 340
35 577 525 1,102 85 99 186 285
36 621 507 1,128 86 93 168 261
37 551 501 1,052 87 76 165 241
38 612 510 1,122 88 68 132 200
39 544 467 1,011 89 48 122 170
40-49 4,476 4,292 8,768 90+ 132 372 504
40 467 444 911
41 470 477 947 Total 39,856 39,872 79,728
42 513 482 995
43 502 420 922
44 449 391 840
45 412 420 832
46 397 362 759
47 390 438 828
48 424 426 850
49 452 432 884
* Based on the November 2011 Census
7

1.5b Total population by age and district as at end 31 December 2013*: Northern Harbour
Age Males Females Total Age Males Females Total
0-9 5,816 5,391 11,207 50-59 8,538 8,735 17,273
Less than 1 614 533 1,147 50 800 799 1,599
1 619 606 1,225 51 852 830 1,682
2 560 591 1,151 52 863 837 1,700
3 567 533 1,100 53 865 886 1,751
4 618 550 1,168 54 827 904 1,731
5 602 541 1,143 55 860 925 1,785
6 587 535 1,122 56 871 879 1,750
7 564 497 1,061 57 885 924 1,809
8 563 501 1,064 58 870 891 1,761
9 522 504 1,026 59 845 860 1,705
10-19 6,206 5,907 12,113 60-69 8,724 9,307 18,031
10 545 528 1,073 60 814 831 1,645
11 526 512 1,038 61 825 882 1,707
12 534 541 1,075 62 824 914 1,738
13 577 554 1,131 63 948 915 1,863
14 603 571 1,174 64 912 977 1,889
15 628 613 1,241 65 887 984 1,871
16 657 629 1,286 66 890 999 1,889
17 706 637 1,343 67 924 1,002 1,926
18 740 654 1,394 68 804 906 1,710
19 690 668 1,358 69 896 897 1,793
20-29 9,021 8,536 17,557 70-79 4,350 5,419 9,769
20 775 752 1,527 70 565 689 1,254
21 816 811 1,627 71 408 472 880
22 875 842 1,717 72 419 510 929
23 949 865 1,814 73 443 560 1,003
24 945 912 1,857 74 490 570 1,060
25 940 936 1,876 75 467 583 1,050
26 932 858 1,790 76 434 578 1,012
27 914 823 1,737 77 430 513 943
28 941 830 1,771 78 362 513 875
29 934 907 1,841 79 332 431 763
30-39 9,210 8,544 17,754 80-89 1,705 2,834 4,539
30 966 906 1,872 80 295 446 741
31 990 897 1,887 81 257 438 695
32 950 851 1,801 82 230 384 614
33 1,012 876 1,888 83 203 338 541
34 896 852 1,748 84 152 278 430
35 902 841 1,743 85 153 235 388
36 881 872 1,753 86 122 213 335
37 884 831 1,715 87 116 180 296
38 885 811 1,696 88 101 171 272
39 844 807 1,651 89 76 151 227
40-49 7,531 7,275 14,806 90+ 181 433 614
40 815 829 1,644
41 785 722 1,507 Total 61,282 62,381 123,663
42 752 696 1,448
43 745 705 1,450
44 738 673 1,411
45 736 724 1,460
46 711 716 1,427
47 692 694 1,386
48 756 752 1,508
49 801 764 1,565
* Based on the November 2011 Census
8

1.5c Total population by age and district as at end 31 December 2013*: South Eastern
Age Males Females Total Age Males Females Total
0-9 3,634 3,343 6,977 50-59 4,512 4,414 8,926
Less than 1 354 329 683 50 395 383 778
1 390 345 735 51 405 401 806
2 409 388 797 52 465 462 927
3 345 361 706 53 464 510 974
4 379 351 730 54 468 460 928
5 378 334 712 55 439 458 897
6 358 292 650 56 511 465 976
7 341 308 649 57 461 419 880
8 317 312 629 58 451 453 904
9 363 323 686 59 453 403 856
10-19 3,963 3,621 7,584 60-69 4,099 4,142 8,241
10 344 328 672 60 406 428 834
11 345 314 659 61 424 396 820
12 345 298 643 62 389 426 815
13 334 385 719 63 430 446 876
14 358 370 728 64 447 435 882
15 398 362 760 65 440 440 880
16 408 380 788 66 436 431 867
17 427 356 783 67 398 406 804
18 482 415 897 68 384 373 757
19 522 413 935 69 345 361 706
20-29 5,696 4,815 10,511 70-79 1,698 2,061 3,759
20 524 430 954 70 254 277 531
21 574 489 1,063 71 157 172 329
22 559 476 1,035 72 147 183 330
23 559 499 1,058 73 170 235 405
24 564 518 1,082 74 189 196 385
25 602 504 1,106 75 185 215 400
26 551 446 997 76 149 213 362
27 578 496 1,074 77 171 218 389
28 588 461 1,049 78 152 174 326
29 597 496 1,093 79 124 178 302
30-39 5,501 5,026 10,527 80-89 582 982 1,564
30 544 495 1,039 80 94 133 227
31 612 507 1,119 81 111 139 250
32 547 548 1,095 82 88 139 227
33 525 481 1,006 83 70 135 205
34 557 500 1,057 84 54 102 156
35 580 496 1,076 85 51 87 138
36 539 509 1,048 86 32 88 120
37 561 514 1,075 87 33 71 104
38 509 507 1,016 88 28 45 73
39 527 469 996 89 21 43 64
40-49 4,141 3,864 8,005 90+ 62 112 174
40 511 447 958
41 468 445 913 Total 33,888 32,380 66,268
42 443 398 841
43 413 417 830
44 393 359 752
45 418 358 776
46 371 360 731
47 374 330 704
48 349 357 706
49 401 393 794
* Based on the November 2011 Census
9

1.5d Total population by age and district as at end 31 December 2013*: Western
Age Males Females Total Age Males Females Total
0-9 2,792 2,730 5,522 50-59 4,324 4,262 8,586
Less than 1 255 271 526 50 393 394 787
1 287 273 560 51 446 479 925
2 286 301 587 52 449 440 889
3 290 264 554 53 438 444 882
4 268 285 553 54 422 441 863
5 278 282 560 55 463 426 889
6 291 230 521 56 466 439 905
7 276 270 546 57 443 413 856
8 286 281 567 58 421 396 817
9 275 273 548 59 383 390 773
10-19 3,434 3,171 6,605 60-69 3,834 4,105 7,939
10 270 283 553 60 382 411 793
11 321 257 578 61 378 422 800
12 289 309 598 62 395 380 775
13 333 302 635 63 400 424 824
14 347 309 656 64 412 415 827
15 345 350 695 65 444 455 899
16 365 322 687 66 405 440 845
17 386 317 703 67 352 403 755
18 384 336 720 68 310 381 691
19 394 386 780 69 356 374 730
20-29 4,524 4,103 8,627 70-79 1,663 2,073 3,736
20 431 418 849 70 240 254 494
21 437 396 833 71 162 161 323
22 459 409 868 72 172 212 384
23 464 403 867 73 161 203 364
24 474 428 902 74 177 224 401
25 452 442 894 75 191 221 412
26 458 442 900 76 170 181 351
27 499 389 888 77 158 234 392
28 439 395 834 78 122 195 317
29 411 381 792 79 110 188 298
30-39 4,123 4,085 8,208 80-89 679 1,225 1,904
30 421 414 835 80 108 193 301
31 360 417 777 81 112 174 286
32 365 391 756 82 80 156 236
33 395 373 768 83 65 141 206
34 438 415 853 84 62 118 180
35 406 392 798 85 63 96 159
36 455 410 865 86 57 112 169
37 420 453 873 87 49 71 120
38 461 409 870 88 45 78 123
39 402 411 813 89 38 86 124
40-49 3,734 3,667 7,401 90+ 107 256 363
40 402 391 793
41 399 393 792 Total 29,214 29,677 58,891
42 381 377 758
43 334 364 698
44 345 336 681
45 376 331 707
46 329 351 680
47 399 354 753
48 379 384 763
49 390 386 776
* Based on the November 2011 Census
10

1.5e Total population by age and district as at end 31 December 2013*: Northern
Age Males Females Total Age Males Females Total
0-9 3,496 3,290 6,786 50-59 4,756 4,487 9,243
Less than 1 393 339 732 50 489 474 963
1 375 346 721 51 479 496 975
2 378 352 730 52 497 456 953
3 363 325 688 53 504 462 966
4 344 352 696 54 467 466 933
5 355 342 697 55 475 447 922
6 296 311 607 56 472 423 895
7 346 307 653 57 476 452 928
8 328 300 628 58 463 404 867
9 318 316 634 59 434 407 841
10-19 3,745 3,689 7,434 60-69 3,946 3,937 7,883
10 326 336 662 60 432 402 834
11 325 317 642 61 386 380 766
12 318 330 648 62 404 371 775
13 351 379 730 63 417 412 829
14 348 365 713 64 377 414 791
15 388 363 751 65 412 440 852
16 435 377 812 66 421 416 837
17 398 389 787 67 357 374 731
18 428 406 834 68 393 361 754
19 428 427 855 69 347 367 714
20-29 4,477 4,449 8,926 70-79 1,857 2,082 3,939
20 436 445 881 70 235 284 519
21 482 464 946 71 186 202 388
22 447 466 913 72 209 202 411
23 465 413 878 73 213 214 427
24 439 485 924 74 210 243 453
25 450 445 895 75 193 214 407
26 429 446 875 76 191 229 420
27 434 405 839 77 163 186 349
28 479 461 940 78 139 168 307
29 416 419 835 79 118 140 258
30-39 4,998 4,999 9,997 80-89 641 1,082 1,723
30 487 488 975 80 131 170 301
31 474 566 1,040 81 90 154 244
32 475 499 974 82 70 138 208
33 486 474 960 83 75 112 187
34 520 528 1,048 84 62 103 165
35 511 523 1,034 85 58 92 150
36 532 503 1,035 86 50 98 148
37 514 521 1,035 87 44 86 130
38 498 453 951 88 28 65 93
39 501 444 945 89 33 64 97
40-49 4,584 4,615 9,199 90+ 60 198 258
40 460 444 904
41 436 456 892 Total 32,560 32,828 65,388
42 456 487 943
43 484 430 914
44 418 475 893
45 442 451 893
46 454 467 921
47 441 436 877
48 488 480 968
49 505 489 994
* Based on the November 2011 Census
11

1.5f Total population by age and district as at end 31 December 2013*: Gozo and Comino
Age Males Females Total Age Males Females Total
0-9 1,430 1,301 2,731 50-59 2,385 2,418 4,803
Less than 1 152 128 280 50 229 223 452
1 160 131 291 51 252 253 505
2 135 137 272 52 224 203 427
3 147 140 287 53 265 272 537
4 111 119 230 54 254 248 502
5 158 135 293 55 256 258 514
6 141 122 263 56 217 270 487
7 155 123 278 57 235 241 476
8 140 142 282 58 234 228 462
9 131 124 255 59 219 222 441
10-19 1,817 1,786 3,603 60-69 2,188 2,269 4,457
10 150 161 311 60 200 197 397
11 158 130 288 61 229 221 450
12 158 139 297 62 196 227 423
13 168 207 375 63 229 216 445
14 167 164 331 64 242 220 462
15 191 201 392 65 257 205 462
16 197 186 383 66 209 278 487
17 211 213 424 67 222 248 470
18 192 183 375 68 202 233 435
19 225 202 427 69 202 224 426
20-29 2,280 2,139 4,419 70-79 1,084 1,439 2,523
20 238 213 451 70 168 184 352
21 215 189 404 71 105 136 241
22 234 200 434 72 99 135 234
23 197 227 424 73 124 153 277
24 232 236 468 74 123 141 264
25 236 224 460 75 104 131 235
26 240 193 433 76 104 152 256
27 228 233 461 77 99 137 236
28 234 204 438 78 87 148 235
29 226 220 446 79 71 122 193
30-39 1,971 1,712 3,683 80-89 509 822 1,331
30 224 184 408 80 81 115 196
31 224 181 405 81 77 110 187
32 200 164 364 82 65 103 168
33 191 161 352 83 64 110 174
34 212 179 391 84 45 72 117
35 166 162 328 85 28 67 95
36 193 146 339 86 48 78 126
37 190 155 345 87 48 59 107
38 196 191 387 88 37 58 95
39 175 189 364 89 16 50 66
40-49 1,888 1,807 3,695 90+ 72 129 201
40 169 183 352
41 202 173 375 Total 15,624 15,822 31,446
42 200 174 374
43 183 179 362
44 173 136 309
45 168 183 351
46 189 192 381
47 206 185 391
48 190 188 378
49 208 214 422
* Based on the November 2011 Census
12

1.6 Total mid-year population by age: 30 June 2013*
Age Males Females Total Age Males Females Total
0-9 20,770 19,484 40,254 50-59 30,042 29,850 59,892
Less than 1 2,146 1,972 4,118 50 2,875 2,836 5,711
1 2,177 2,067 4,244 51 2,990 2,913 5,903
2 2,106 2,034 4,140 52 3,062 3,001 6,063
3 2,080 1,988 4,068 53 3,049 3,102 6,151
4 2,136 1,997 4,133 54 3,005 3,091 6,096
5 2,101 1,902 4,003 55 3,066 3,095 6,161
6 2,032 1,832 3,864 56 3,107 3,079 6,186
7 2,013 1,860 3,873 57 3,062 2,983 6,045
8 1,986 1,885 3,871 58 2,969 2,896 5,865
9 1,993 1,947 3,940 59 2,857 2,854 5,711
10-19 23,778 22,449 46,227 60-69 28,342 29,559 57,901
10 2,023 1,945 3,968 60 2,806 2,853 5,659
11 2,044 1,909 3,953 61 2,805 2,882 5,687
12 2,102 2,073 4,175 62 2,909 2,951 5,860
13 2,201 2,192 4,393 63 3,025 3,038 6,063
14 2,309 2,220 4,529 64 3,030 3,101 6,131
15 2,448 2,287 4,735 65 3,023 3,201 6,224
16 2,533 2,344 4,877 66 2,928 3,150 6,078
17 2,604 2,389 4,993 67 2,770 2,979 5,749
18 2,704 2,476 5,180 68 2,738 2,888 5,626
19 2,810 2,614 5,424 69 2,308 2,516 4,824
20-29 31,575 29,210 60,785 70-79 13,203 16,401 29,604
20 2,986 2,760 5,746 70 1,568 1,787 3,355
21 3,060 2,853 5,913 71 1,295 1,500 2,795
22 3,112 2,905 6,017 72 1,369 1,632 3,001
23 3,200 3,000 6,200 73 1,462 1,747 3,209
24 3,198 3,070 6,268 74 1,477 1,771 3,248
25 3,181 2,977 6,158 75 1,411 1,762 3,173
26 3,173 2,860 6,033 76 1,356 1,709 3,065
27 3,218 2,860 6,078 77 1,237 1,612 2,849
28 3,225 2,931 6,156 78 1,067 1,477 2,544
29 3,222 2,994 6,216 79 961 1,404 2,365
30-39 31,463 29,444 60,907 80-89 5,120 8,895 14,015
30 3,284 3,110 6,394 80 880 1,387 2,267
31 3,232 3,080 6,312 81 763 1,293 2,056
32 3,171 2,936 6,107 82 672 1,175 1,847
33 3,196 2,947 6,143 83 587 1,004 1,591
34 3,146 2,962 6,108 84 495 858 1,353
35 3,158 2,937 6,095 85 451 796 1,247
36 3,164 2,961 6,125 86 406 733 1,139
37 3,142 2,917 6,059 87 360 624 984
38 3,074 2,840 5,914 88 291 561 852
39 2,896 2,754 5,650 89 215 464 679
40-49 26,290 25,502 51,792 90+ 599 1,455 2,054
40 2,784 2,702 5,486
41 2,750 2,645 5,395 Total 211,182 212,249 423,431
42 2,703 2,564 5,267
43 2,587 2,440 5,027
44 2,524 2,424 4,948
45 2,496 2,456 4,952
46 2,471 2,438 4,909
47 2,539 2,507 5,046
48 2,667 2,632 5,299
49 2,769 2,694 5,463
* Based on the November 2011 Census
13

Males Females Total
MALTA 212,424 212,960 425,384
Malta 196,800 197,138 393,938
Gozo and Comino 15,624 15,822 31,446
Southern Harbour 39,856 39,872 79,728
101 Valletta 2,791 2,909 5,700
103 Vittoriosa 1,260 1,215 2,475
104 Senglea 1,364 1,355 2,719
105 Cospicua 2,566 2,620 5,186
108 Ħaż-Żabbar 7,502 7,342 14,844
117 Fgura 5,727 5,820 11,547
118 Floriana 959 1,048 2,007
129 Kalkara 1,491 1,457 2,948
133 Ħal Luqa 2,733 3,024 5,757
134 Marsa 2,803 2,482 5,285
145 Paola 4,219 3,980 8,199
157 Santa Luċija 1,448 1,530 2,978
162 Ħal Tarxien 4,196 4,273 8,469
165 Xgħajra 797 817 1,614
Northern Harbour 61,282 62,381 123,663
206 Ħal Qormi 8,162 8,281 16,443
214 Birkirkara 10,848 11,041 21,889
221 Gżira 3,595 3,690 7,285
227 Ħamrun 4,413 4,582 8,995
241 Msida 4,214 4,045 8,259
246 Pembroke 1,756 1,811 3,567
247 Tal-Pietà 1,939 2,090 4,029
252 St Julian's 4,430 4,171 8,601
253 San Ġwann 6,098 6,242 12,340
258 Santa Venera 3,398 3,462 6,860
259 Tas-Sliema 6,813 7,376 14,189
260 Swieqi 4,858 4,784 9,642
261 Ta' Xbiex 758 806 1,564
South Eastern 33,888 32,380 66,268
310 Żejtun 5,643 5,609 11,252
315 Birżebbuġa 6,624 5,204 11,828
320 Gudja 1,506 1,540 3,046
326 Ħal Għaxaq 2,352 2,275 4,627
331 Ħal Kirkop 1,163 1,142 2,305
335 Marsaskala 5,682 5,698 11,380
336 Marsaxlokk 1,705 1,693 3,398
340 Mqabba 1,652 1,619 3,271
349 Qrendi 1,330 1,351 2,681
351 Ħal Safi 1,065 1,041 2,106
367 Żurrieq 5,166 5,208 10,374
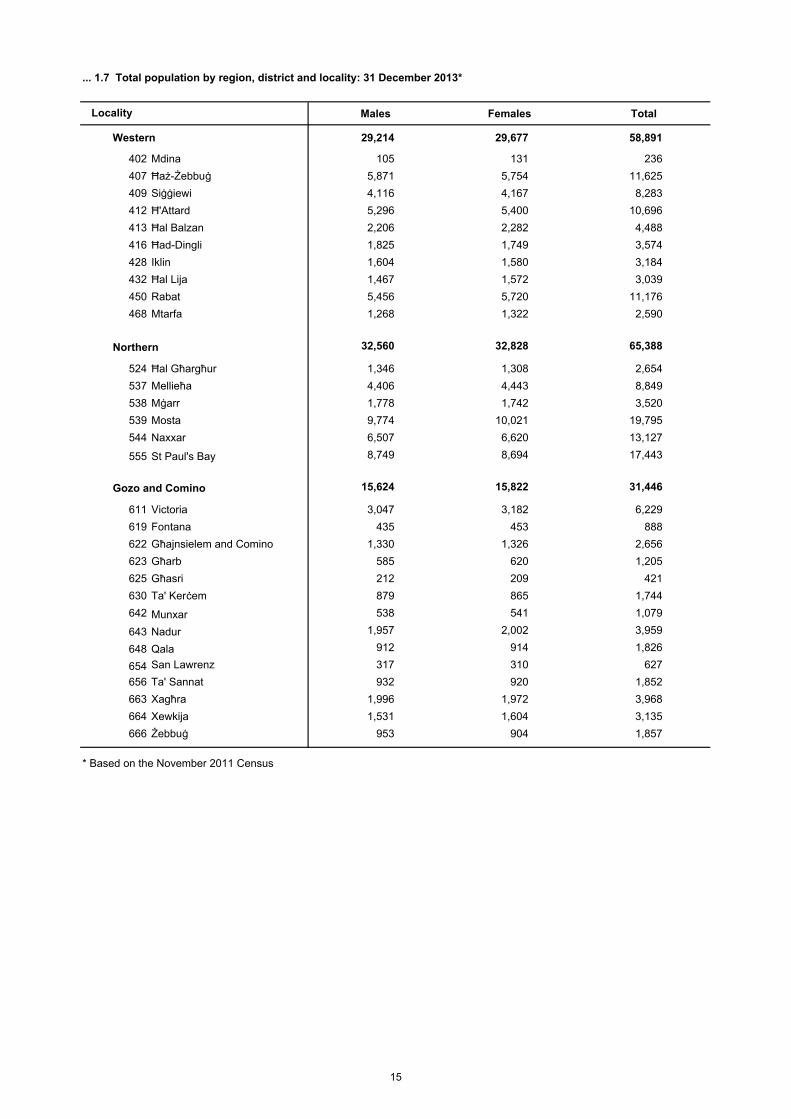
1.7 Total population by region, district and locality: 31 December 2013* ...
Locality
14
Males Females Total
Western 29,214 29,677 58,891
402 Mdina 105 131 236
407 Ħaż-Żebbuġ 5,871 5,754 11,625
409 Siġġiewi 4,116 4,167 8,283
412 Ħ'Attard 5,296 5,400 10,696
413 Ħal Balzan 2,206 2,282 4,488
416 Ħad-Dingli 1,825 1,749 3,574
428 Iklin 1,604 1,580 3,184
432 Ħal Lija 1,467 1,572 3,039
450 Rabat 5,456 5,720 11,176
468 Mtarfa 1,268 1,322 2,590
Northern 32,560 32,828 65,388
524 Ħal Għargħur 1,346 1,308 2,654
537 Mellieħa 4,406 4,443 8,849
538 Mġarr 1,778 1,742 3,520
539 Mosta 9,774 10,021 19,795
544 Naxxar 6,507 6,620 13,127
555 St Paul's Bay 8,749 8,694 17,443
Gozo and Comino 15,624 15,822 31,446
611 Victoria 3,047 3,182 6,229
619 Fontana 435 453 888
622 Għajnsielem and Comino 1,330 1,326 2,656
623 Għarb 585 620 1,205
625 Għasri 212 209 421
630 Ta' Kerċem 879 865 1,744
642 Munxar 538 541 1,079
643 Nadur 1,957 2,002 3,959
648 Qala 912 914 1,826
654 San Lawrenz 317 310 627
656 Ta' Sannat 932 920 1,852
663 Xagħra 1,996 1,972 3,968
664 Xewkija 1,531 1,604 3,135
666 Żebbuġ 953 904 1,857
* Based on the November 2011 Census
... 1.7 Total population by region, district and locality: 31 December 2013*
Locality
15

Males Females Total
MALTA 211,182 212,249 423,431
Malta 195,556 196,417 391,973
Gozo and Comino 15,626 15,832 31,458
Southern Harbour 39,758 39,882 79,640
101 Valletta 2,792 2,918 5,710
103 Vittoriosa 1,261 1,217 2,478
104 Senglea 1,371 1,354 2,725
105 Cospicua 2,578 2,628 5,206
108 Ħaż-Żabbar 7,518 7,357 14,875
117 Fgura 5,728 5,808 11,536
118 Floriana 960 1,051 2,011
129 Kalkara 1,495 1,457 2,952
133 Ħal Luqa 2,750 3,046 5,796
134 Marsa 2,660 2,451 5,111
145 Paola 4,232 3,986 8,218
157 Santa Luċija 1,447 1,526 2,973
162 Ħal Tarxien 4,175 4,271 8,446
165 Xgħajra 791 812 1,603
Northern Harbour 60,762 62,101 122,863
206 Ħal Qormi 8,153 8,229 16,382
214 Birkirkara 10,787 11,031 21,818
221 Gżira 3,611 3,651 7,262
227 Ħamrun 4,402 4,600 9,002
241 Msida 4,122 4,016 8,138
246 Pembroke 1,750 1,806 3,556
247 Tal-Pietà 1,936 2,096 4,032
252 St Julian's 4,298 4,159 8,457
253 San Ġwann 6,100 6,226 12,326
258 Santa Venera 3,387 3,463 6,850
259 Tas-Sliema 6,721 7,333 14,054
260 Swieqi 4,731 4,681 9,412
261 Ta' Xbiex 764 810 1,574
South Eastern 33,567 32,233 65,800
310 Żejtun 5,652 5,629 11,281
315 Birżebbuġa 6,378 5,097 11,475
320 Gudja 1,502 1,538 3,040
326 Ħal Għaxaq 2,345 2,270 4,615
331 Ħal Kirkop 1,159 1,141 2,300
335 Marsaskala 5,625 5,663 11,288
336 Marsaxlokk 1,704 1,690 3,394
340 Mqabba 1,647 1,613 3,260
349 Qrendi 1,334 1,349 2,683
351 Ħal Safi 1,061 1,040 2,101
367 Żurrieq 5,160 5,203 10,363
1.8 Total mid-year population by region, district and locality: 30 June 2013* ...
Locality
16

Males Females Total
Western 29,128 29,578 58,706
402 Mdina 106 131 237
407 Ħaż-Żebbuġ 5,869 5,760 11,629
409 Siġġiewi 4,116 4,153 8,269
412 Ħ'Attard 5,272 5,397 10,669
413 Ħal Balzan 2,150 2,204 4,354
416 Ħad-Dingli 1,818 1,743 3,561
428 Iklin 1,608 1,577 3,185
432 Ħal Lija 1,462 1,568 3,030
450 Rabat 5,457 5,725 11,182
468 Mtarfa 1,270 1,320 2,590
Northern 32,341 32,623 64,964
524 Ħal Għargħur 1,339 1,304 2,643
537 Mellieħa 4,377 4,434 8,811
538 Mġarr 1,771 1,736 3,507
539 Mosta 9,748 10,030 19,778
544 Naxxar 6,491 6,572 13,063
555 St Paul's Bay 8,615 8,547 17,162
Gozo and Comino 15,626 15,832 31,458
611 Victoria 3,047 3,193 6,240
619 Fontana 434 452 886
622 Għajnsielem and Comino 1,329 1,326 2,655
623 Għarb 583 618 1,201
625 Għasri 213 211 424
630 Ta' Kerċem 877 864 1,741
642 Munxar 535 538 1,073
643 Nadur 1,962 2,005 3,967
648 Qala 916 916 1,832
654 San Lawrenz 319 309 628
656 Ta' Sannat 929 919 1,848
663 Xagħra 1,996 1,970 3,966
664 Xewkija 1,535 1,608 3,143
666 Żebbuġ 951 903 1,854
* Based on the November 2011 Census
Locality
... 1.8 Total mid-year population by region, district and locality: 30 June 2013*
17

1.9 Total Maltese population by age: 31 December 2013*
Age Males Females Total Age Males Females Total
0-9 19,949 18,675 38,624 50-59 28,822 28,469 57,291
Less than 1 1,925 1,773 3,698 50 2,662 2,595 5,257
1 2,043 1,891 3,934 51 2,851 2,775 5,626
2 2,064 1,992 4,056 52 2,911 2,772 5,683
3 1,984 1,901 3,885 53 2,960 2,963 5,923
4 2,047 1,949 3,996 54 2,870 2,955 5,825
5 2,079 1,914 3,993 55 2,891 2,946 5,837
6 1,988 1,794 3,782 56 3,011 2,977 5,988
7 1,962 1,779 3,741 57 2,968 2,918 5,886
8 1,926 1,839 3,765 58 2,909 2,788 5,697
9 1,931 1,843 3,774 59 2,789 2,780 5,569
10-19 22,558 21,550 44,108 60-69 27,388 28,598 55,986
10 1,942 1,961 3,903 60 2,677 2,701 5,378
11 2,005 1,826 3,831 61 2,698 2,767 5,465
12 1,999 1,879 3,878 62 2,664 2,765 5,429
13 2,119 2,169 4,288 63 2,901 2,915 5,816
14 2,178 2,124 4,302 64 2,883 2,913 5,796
15 2,322 2,215 4,537 65 2,893 3,015 5,908
16 2,446 2,251 4,697 66 2,849 3,064 5,913
17 2,489 2,336 4,825 67 2,703 2,921 5,624
18 2,530 2,343 4,873 68 2,535 2,762 5,297
19 2,528 2,446 4,974 69 2,585 2,775 5,360
20-29 28,228 26,990 55,218 70-79 12,697 15,958 28,655
20 2,672 2,576 5,248 70 1,739 2,030 3,769
21 2,769 2,669 5,438 71 1,170 1,341 2,511
22 2,827 2,766 5,593 72 1,223 1,476 2,699
23 2,822 2,723 5,545 73 1,303 1,618 2,921
24 2,839 2,888 5,727 74 1,398 1,715 3,113
25 2,895 2,790 5,685 75 1,342 1,694 3,036
26 2,791 2,691 5,482 76 1,273 1,675 2,948
27 2,900 2,550 5,450 77 1,258 1,584 2,842
28 2,839 2,648 5,487 78 1,078 1,490 2,568
29 2,874 2,689 5,563 79 913 1,335 2,248
30-39 28,837 27,347 56,184 80-89 5,038 8,861 13,899
30 2,947 2,779 5,726 80 863 1,360 2,223
31 2,959 2,917 5,876 81 761 1,288 2,049
32 2,809 2,746 5,555 82 655 1,171 1,826
33 2,876 2,638 5,514 83 582 1,038 1,620
34 2,923 2,757 5,680 84 483 862 1,345
35 2,860 2,719 5,579 85 437 748 1,185
36 2,922 2,725 5,647 86 384 739 1,123
37 2,885 2,799 5,684 87 354 614 968
38 2,913 2,661 5,574 88 293 532 825
39 2,743 2,606 5,349 89 226 509 735
40-49 24,546 23,860 48,406 90+ 585 1,448 2,033
40 2,575 2,558 5,133
41 2,546 2,481 5,027 Total 198,648 201,756 400,404
42 2,561 2,448 5,009
43 2,468 2,337 4,805
44 2,334 2,202 4,536
45 2,388 2,301 4,689
46 2,285 2,295 4,580
47 2,358 2,293 4,651
48 2,420 2,435 4,855
49 2,611 2,510 5,121
* Based on the November 2011 Census
18

1.10a Maltese population by age and district as at end 31 December 2013*: Southern Harbour
Age Males Females Total Age Males Females Total
0-9 3,706 3,427 7,133 50-59 5,437 5,403 10,840
Less than 1 347 316 663 50 472 450 922
1 367 343 710 51 517 471 988
2 398 339 737 52 512 488 1,000
3 346 352 698 53 550 529 1,079
4 396 360 756 54 552 564 1,116
5 390 346 736 55 517 566 1,083
6 371 344 715 56 575 615 1,190
7 351 326 677 57 592 597 1,189
8 368 349 717 58 578 515 1,093
9 372 352 724 59 572 608 1,180
10-19 4,203 3,970 8,173 60-69 5,824 6,027 11,851
10 372 379 751 60 553 532 1,085
11 374 356 730 61 558 585 1,143
12 392 321 713 62 555 547 1,102
13 412 391 803 63 595 612 1,207
14 411 393 804 64 607 575 1,182
15 429 378 807 65 583 628 1,211
16 448 407 855 66 624 663 1,287
17 445 465 910 67 578 615 1,193
18 465 437 902 68 579 618 1,197
19 455 443 898 69 592 652 1,244
20-29 5,249 5,013 10,262 70-79 2,786 3,490 6,276
20 495 451 946 70 381 448 829
21 493 467 960 71 242 280 522
22 492 521 1,013 72 252 307 559
23 513 511 1,024 73 291 323 614
24 510 518 1,028 74 289 394 683
25 553 499 1,052 75 292 382 674
26 503 535 1,038 76 293 380 673
27 558 446 1,004 77 286 341 627
28 530 544 1,074 78 257 336 593
29 602 521 1,123 79 203 299 502
30-39 5,693 5,131 10,824 80-89 1,130 2,134 3,264
30 609 534 1,143 80 195 342 537
31 637 590 1,227 81 147 299 446
32 572 518 1,090 82 143 281 424
33 567 517 1,084 83 136 230 366
34 531 511 1,042 84 127 211 338
35 558 511 1,069 85 98 185 283
36 587 499 1,086 86 93 167 260
37 529 490 1,019 87 76 165 241
38 583 500 1,083 88 67 132 199
39 520 461 981 89 48 122 170
40-49 4,326 4,180 8,506 90+ 131 369 500
40 441 430 871
41 444 468 912 Total 38,485 39,144 77,629
42 499 471 970
43 485 413 898
44 433 377 810
45 402 408 810
46 390 348 738
47 377 423 800
48 418 419 837
49 437 423 860
* Based on the November 2011 Census
19

1.10b Maltese population by age and district as at end 31 December 2013*: Northern Harbour
Age Males Females Total Age Males Females Total
0-9 5,395 5,047 10,442 50-59 8,024 8,231 16,255
Less than 1 508 456 964 50 751 743 1,494
1 539 530 1,069 51 808 768 1,576
2 518 551 1,069 52 825 785 1,610
3 545 503 1,048 53 814 837 1,651
4 583 525 1,108 54 767 849 1,616
5 574 518 1,092 55 806 874 1,680
6 564 513 1,077 56 818 830 1,648
7 535 478 1,013 57 823 875 1,698
8 534 484 1,018 58 822 851 1,673
9 495 489 984 59 790 819 1,609
10-19 5,948 5,644 11,592 60-69 8,257 8,922 17,179
10 515 503 1,018 60 761 788 1,549
11 504 482 986 61 773 845 1,618
12 517 515 1,032 62 784 878 1,662
13 552 536 1,088 63 895 875 1,770
14 576 548 1,124 64 872 936 1,808
15 603 584 1,187 65 849 944 1,793
16 637 602 1,239 66 840 949 1,789
17 678 628 1,306 67 882 962 1,844
18 717 620 1,337 68 760 877 1,637
19 649 626 1,275 69 841 868 1,709
20-29 7,907 7,562 15,469 70-79 4,132 5,266 9,398
20 712 685 1,397 70 535 660 1,195
21 752 752 1,504 71 380 454 834
22 789 788 1,577 72 396 489 885
23 821 779 1,600 73 415 548 963
24 834 821 1,655 74 469 556 1,025
25 797 807 1,604 75 439 572 1,011
26 811 742 1,553 76 414 569 983
27 795 707 1,502 77 414 501 915
28 776 706 1,482 78 352 497 849
29 820 775 1,595 79 318 420 738
30-39 8,005 7,525 15,530 80-89 1,638 2,771 4,409
30 811 789 1,600 80 282 439 721
31 842 798 1,640 81 248 429 677
32 820 754 1,574 82 225 375 600
33 864 755 1,619 83 193 328 521
34 799 742 1,541 84 145 275 420
35 770 737 1,507 85 150 232 382
36 774 766 1,540 86 118 209 327
37 784 748 1,532 87 113 177 290
38 799 701 1,500 88 93 159 252
39 742 735 1,477 89 71 148 219
40-49 6,751 6,638 13,389 90+ 168 420 588
40 686 753 1,439
41 697 644 1,341 Total 56,225 58,026 114,251
42 657 631 1,288
43 683 641 1,324
44 661 602 1,263
45 659 662 1,321
46 642 658 1,300
47 639 654 1,293
48 690 690 1,380
49 737 703 1,440
* Based on the November 2011 Census
20

1.10c Maltese population by age and district as at end 31 December 2013*: South Eastern
Age Males Females Total Age Males Females Total
0-9 3,422 3,154 6,576 50-59 4,386 4,303 8,689
Less than 1 324 307 631 50 375 370 745
1 359 310 669 51 392 390 782
2 368 340 708 52 448 453 901
3 310 337 647 53 447 494 941
4 368 325 693 54 454 447 901
5 354 320 674 55 425 451 876
6 347 289 636 56 508 446 954
7 332 300 632 57 451 409 860
8 303 309 612 58 443 448 891
9 357 317 674 59 443 395 838
10-19 3,651 3,531 7,182 60-69 3,995 4,019 8,014
10 337 321 658 60 401 410 811
11 336 305 641 61 416 383 799
12 341 292 633 62 380 419 799
13 328 381 709 63 423 440 863
14 348 369 717 64 441 419 860
15 387 353 740 65 425 424 849
16 389 376 765 66 427 411 838
17 391 351 742 67 385 398 783
18 387 394 781 68 368 365 733
19 407 389 796 69 329 350 679
20-29 4,392 4,262 8,654 70-79 1,621 2,009 3,630
20 404 395 799 70 248 269 517
21 433 427 860 71 145 167 312
22 446 420 866 72 136 175 311
23 423 442 865 73 157 228 385
24 407 458 865 74 181 193 374
25 467 428 895 75 179 213 392
26 425 396 821 76 142 204 346
27 457 437 894 77 166 213 379
28 460 418 878 78 148 169 317
29 470 441 911 79 119 178 297
30-39 4,814 4,711 9,525 80-89 561 956 1,517
30 456 454 910 80 92 128 220
31 508 464 972 81 105 137 242
32 456 496 952 82 86 134 220
33 455 440 895 83 67 133 200
34 503 476 979 84 50 99 149
35 510 466 976 85 49 84 133
36 472 482 954 86 31 85 116
37 510 497 1,007 87 32 70 102
38 463 480 943 88 28 44 72
39 481 456 937 89 21 42 63
40-49 3,925 3,752 7,677 90+ 58 108 166
40 478 434 912
41 441 434 875 Total 30,825 30,805 61,630
42 423 392 815
43 389 397 786
44 368 347 715
45 403 353 756
46 356 352 708
47 354 316 670
48 328 341 669
49 385 386 771
* Based on the November 2011 Census
21

1.10d Maltese population by age and district as at end 31 December 2013*: Western
Age Males Females Total Age Males Females Total
0-9 2,734 2,661 5,395 50-59 4,261 4,168 8,429
Less than 1 242 268 510 50 388 385 773
1 280 259 539 51 439 470 909
2 282 292 574 52 443 429 872
3 288 256 544 53 429 428 857
4 258 280 538 54 415 434 849
5 274 273 547 55 451 414 865
6 288 225 513 56 463 430 893
7 267 263 530 57 442 406 848
8 285 278 563 58 410 387 797
9 270 267 537 59 381 385 766
10-19 3,362 3,126 6,488 60-69 3,760 4,039 7,799
10 266 281 547 60 373 408 781
11 318 254 572 61 375 413 788
12 288 303 591 62 386 377 763
13 329 295 624 63 395 416 811
14 344 307 651 64 406 407 813
15 340 345 685 65 434 450 884
16 359 317 676 66 396 434 830
17 377 314 691 67 343 394 737
18 366 331 697 68 303 374 677
19 375 379 754 69 349 366 715
20-29 4,326 3,976 8,302 70-79 1,623 2,043 3,666
20 413 413 826 70 238 248 486
21 419 387 806 71 158 156 314
22 440 400 840 72 166 212 378
23 442 390 832 73 158 196 354
24 453 415 868 74 169 223 392
25 437 430 867 75 184 216 400
26 443 428 871 76 166 181 347
27 470 372 842 77 156 230 386
28 418 375 793 78 121 195 316
29 391 366 757 79 107 186 293
30-39 3,947 3,869 7,816 80-89 669 1,206 1,875
30 402 390 792 80 108 189 297
31 343 388 731 81 109 169 278
32 353 373 726 82 79 155 234
33 372 351 723 83 65 139 204
34 421 394 815 84 62 118 180
35 390 369 759 85 61 96 157
36 427 385 812 86 56 109 165
37 406 440 846 87 48 68 116
38 447 394 841 88 43 77 120
39 386 385 771 89 38 86 124
40-49 3,622 3,504 7,126 90+ 106 239 345
40 394 372 766
41 380 371 751 Total 28,410 28,831 57,241
42 371 360 731
43 320 350 670
44 328 316 644
45 366 317 683
46 316 341 657
47 394 338 732
48 368 370 738
49 385 369 754
* Based on the November 2011 Census
22

1.10e Maltese population by age and district as at end 31 December 2013*: Northern
Age Males Females Total Age Males Females Total
0-9 3,278 3,101 6,379 50-59 4,410 4,073 8,483
Less than 1 355 298 653 50 454 436 890
1 344 319 663 51 446 445 891
2 363 334 697 52 464 423 887
3 348 314 662 53 462 412 874
4 331 340 671 54 438 423 861
5 330 323 653 55 447 397 844
6 279 302 581 56 436 392 828
7 323 294 617 57 433 404 837
8 297 280 577 58 435 371 806
9 308 297 605 59 395 370 765
10-19 3,600 3,523 7,123 60-69 3,535 3,504 7,039
10 305 319 624 60 396 373 769
11 315 300 615 61 356 339 695
12 304 311 615 62 372 331 703
13 335 363 698 63 380 369 749
14 338 345 683 64 335 371 706
15 373 359 732 65 369 383 752
16 417 365 782 66 372 362 734
17 388 367 755 67 314 324 638
18 404 383 787 68 341 317 658
19 421 411 832 69 300 335 635
20-29 4,115 4,072 8,187 70-79 1,560 1,829 3,389
20 413 422 835 70 192 239 431
21 459 448 907 71 154 170 324
22 431 439 870 72 178 169 347
23 430 382 812 73 174 189 363
24 412 443 855 74 180 218 398
25 407 403 810 75 158 186 344
26 378 397 775 76 163 199 362
27 393 358 751 77 140 173 313
28 426 405 831 78 119 152 271
29 366 375 741 79 102 134 236
30-39 4,467 4,465 8,932 80-89 575 1,007 1,582
30 448 437 885 80 115 150 265
31 411 499 910 81 82 146 228
32 410 445 855 82 61 130 191
33 438 422 860 83 65 106 171
34 464 464 928 84 55 92 147
35 467 478 945 85 52 87 139
36 473 454 927 86 44 93 137
37 475 473 948 87 41 78 119
38 438 402 840 88 27 63 90
39 443 391 834 89 33 62 95
40-49 4,105 4,090 8,195 90+ 54 187 241
40 412 399 811
41 389 403 792 Total 29,699 29,851 59,550
42 418 426 844
43 417 373 790
44 375 428 803
45 396 396 792
46 401 420 821
47 395 389 784
48 437 434 871
49 465 422 887
* Based on the November 2011 Census
23

1.10f Maltese population by age and district as at end 31 December 2013*: Gozo and Comino
Age Males Females Total Age Males Females Total
0-9 1,414 1,285 2,699 50-59 2,304 2,291 4,595
Less than 1 149 128 277 50 222 211 433
1 154 130 284 51 249 231 480
2 135 136 271 52 219 194 413
3 147 139 286 53 258 263 521
4 111 119 230 54 244 238 482
5 157 134 291 55 245 244 489
6 139 121 260 56 211 264 475
7 154 118 272 57 227 227 454
8 139 139 278 58 221 216 437
9 129 121 250 59 208 203 411
10-19 1,794 1,756 3,550 60-69 2,017 2,087 4,104
10 147 158 305 60 193 190 383
11 158 129 287 61 220 202 422
12 157 137 294 62 187 213 400
13 163 203 366 63 213 203 416
14 161 162 323 64 222 205 427
15 190 196 386 65 233 186 419
16 196 184 380 66 190 245 435
17 210 211 421 67 201 228 429
18 191 178 369 68 184 211 395
19 221 198 419 69 174 204 378
20-29 2,239 2,105 4,344 70-79 975 1,321 2,296
20 235 210 445 70 145 166 311
21 213 188 401 71 91 114 205
22 229 198 427 72 95 124 219
23 193 219 412 73 108 134 242
24 223 233 456 74 110 131 241
25 234 223 457 75 90 125 215
26 231 193 424 76 95 142 237
27 227 230 457 77 96 126 222
28 229 200 429 78 81 141 222
29 225 211 436 79 64 118 182
30-39 1,911 1,646 3,557 80-89 465 787 1,252
30 221 175 396 80 71 112 183
31 218 178 396 81 70 108 178
32 198 160 358 82 61 96 157
33 180 153 333 83 56 102 158
34 205 170 375 84 44 67 111
35 165 158 323 85 27 64 91
36 189 139 328 86 42 76 118
37 181 151 332 87 44 56 100
38 183 184 367 88 35 57 92
39 171 178 349 89 15 49 64
40-49 1,817 1,696 3,513 90+ 68 125 193
40 164 170 334
41 195 161 356 Total 15,004 15,099 30,103
42 193 168 361
43 174 163 337
44 169 132 301
45 162 165 327
46 180 176 356
47 199 173 372
48 179 181 360
49 202 207 409
* Based on the November 2011 Census
24

1.11 Maltese mid-year population by age: 30 June 2013*
Age Males Females Total Age Males Females Total
0-9 19,899 18,697 38,596 50-59 28,850 28,530 57,380
Less than 1 1,967 1,814 3,781 50 2,757 2,685 5,442
1 2,042 1,927 3,969 51 2,881 2,773 5,654
2 2,016 1,939 3,955 52 2,936 2,865 5,801
3 2,009 1,918 3,927 53 2,919 2,958 5,877
4 2,059 1,928 3,987 54 2,880 2,952 5,832
5 2,033 1,848 3,881 55 2,952 2,963 5,915
6 1,972 1,782 3,754 56 2,995 2,949 5,944
7 1,942 1,805 3,747 57 2,942 2,859 5,801
8 1,925 1,837 3,762 58 2,850 2,784 5,634
9 1,934 1,899 3,833 59 2,738 2,742 5,480
10-19 22,936 21,843 44,779 60-69 27,054 28,320 55,374
10 1,969 1,889 3,858 60 2,697 2,739 5,436
11 2,001 1,850 3,851 61 2,694 2,768 5,462
12 2,055 2,021 4,076 62 2,794 2,842 5,636
13 2,144 2,143 4,287 63 2,901 2,919 5,820
14 2,251 2,171 4,422 64 2,899 2,970 5,869
15 2,387 2,233 4,620 65 2,885 3,045 5,930
16 2,466 2,293 4,759 66 2,791 2,997 5,788
17 2,515 2,338 4,853 67 2,633 2,854 5,487
18 2,534 2,394 4,928 68 2,586 2,778 5,364
19 2,614 2,511 5,125 69 2,174 2,408 4,582
20-29 28,410 27,092 55,502 70-79 12,455 15,788 28,243
20 2,733 2,622 5,355 70 1,465 1,689 3,154
21 2,813 2,718 5,531 71 1,209 1,417 2,626
22 2,839 2,745 5,584 72 1,278 1,554 2,832
23 2,852 2,806 5,658 73 1,369 1,683 3,052
24 2,862 2,840 5,702 74 1,390 1,714 3,104
25 2,838 2,741 5,579 75 1,328 1,701 3,029
26 2,844 2,620 5,464 76 1,291 1,654 2,945
27 2,867 2,599 5,466 77 1,187 1,564 2,751
28 2,853 2,667 5,520 78 1,022 1,440 2,462
29 2,909 2,734 5,643 79 916 1,372 2,288
30-39 28,623 27,220 55,843 80-89 4,911 8,674 13,585
30 2,948 2,849 5,797 80 840 1,354 2,194
31 2,880 2,831 5,711 81 735 1,262 1,997
32 2,839 2,691 5,530 82 643 1,139 1,782
33 2,898 2,695 5,593 83 559 977 1,536
34 2,888 2,737 5,625 84 477 838 1,315
35 2,888 2,720 5,608 85 434 779 1,213
36 2,900 2,759 5,659 86 390 714 1,104
37 2,897 2,728 5,625 87 347 606 953
38 2,828 2,631 5,459 88 279 548 827
39 2,657 2,579 5,236 89 207 457 664
40-49 24,573 23,862 48,435 90+ 571 1,402 1,973
40 2,560 2,520 5,080
41 2,553 2,464 5,017 Total 198,282 201,428 399,710
42 2,514 2,393 4,907
43 2,401 2,268 4,669
44 2,356 2,245 4,601
45 2,334 2,296 4,630
46 2,318 2,293 4,611
47 2,389 2,362 4,751
48 2,514 2,472 4,986
49 2,634 2,549 5,183
* Based on the November 2011 Census
25

Males Females Total
MALTA 198,648 201,756 400,404
Malta 183,644 186,657 370,301
Gozo and Comino 15,004 15,099 30,103
Southern Harbour 38,485 39,144 77,629
101 Valletta 2,695 2,825 5,520
103 Vittoriosa 1,214 1,178 2,392
104 Senglea 1,336 1,332 2,668
105 Cospicua 2,528 2,574 5,102
108 Ħaż-Żabbar 7,455 7,296 14,751
117 Fgura 5,625 5,738 11,363
118 Floriana 911 1,005 1,916
129 Kalkara 1,478 1,431 2,909
133 Ħal Luqa 2,691 2,980 5,671
134 Marsa 2,283 2,343 4,626
145 Paola 3,923 3,897 7,820
157 Santa Luċija 1,438 1,518 2,956
162 Ħal Tarxien 4,123 4,223 8,346
165 Xgħajra 785 804 1,589
Northern Harbour 56,225 58,026 114,251
206 Ħal Qormi 8,049 8,037 16,086
214 Birkirkara 10,537 10,815 21,352
221 Gżira 3,106 3,216 6,322
227 Ħamrun 4,259 4,488 8,747
241 Msida 3,475 3,566 7,041
246 Pembroke 1,689 1,718 3,407
247 Tal-Pietà 1,776 1,946 3,722
252 St Julian's 3,640 3,620 7,260
253 San Ġwann 5,831 5,947 11,778
258 Santa Venera 3,320 3,394 6,714
259 Tas-Sliema 5,546 6,357 11,903
260 Swieqi 4,310 4,194 8,504
261 Ta' Xbiex 687 728 1,415
South Eastern 30,825 30,805 61,630
310 Żejtun 5,597 5,568 11,165
315 Birżebbuġa 4,205 4,190 8,395
320 Gudja 1,489 1,519 3,008
326 Ħal Għaxaq 2,327 2,261 4,588
331 Ħal Kirkop 1,152 1,132 2,284
335 Marsaskala 5,280 5,384 10,664
336 Marsaxlokk 1,663 1,668 3,331
340 Mqabba 1,639 1,605 3,244
349 Qrendi 1,308 1,327 2,635
351 Ħal Safi 1,043 1,016 2,059
367 Żurrieq 5,122 5,135 10,257
1.12 Maltese population by region, district and locality: 31 December 2013* ...
Locality
26
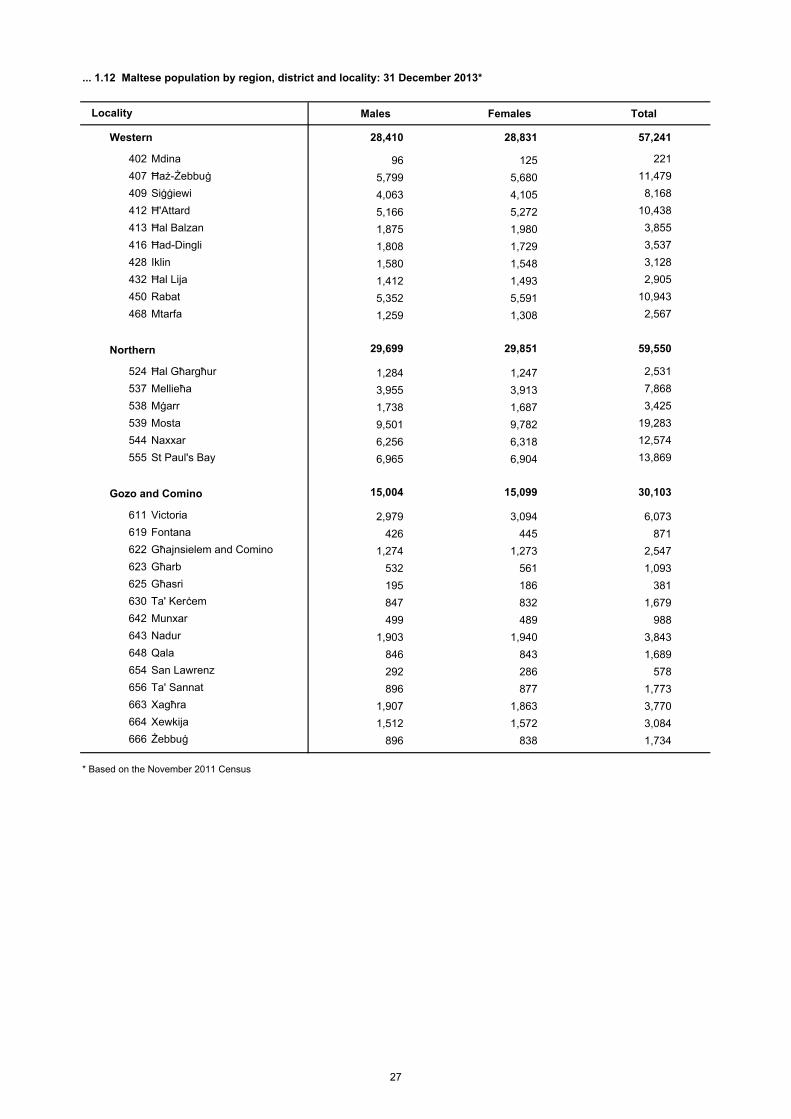
Males Females Total
Western 28,410 28,831 57,241
402 Mdina 96 125 221
407 Ħaż-Żebbuġ 5,799 5,680 11,479
409 Siġġiewi 4,063 4,105 8,168
412 Ħ'Attard 5,166 5,272 10,438
413 Ħal Balzan 1,875 1,980 3,855
416 Ħad-Dingli 1,808 1,729 3,537
428 Iklin 1,580 1,548 3,128
432 Ħal Lija 1,412 1,493 2,905
450 Rabat 5,352 5,591 10,943
468 Mtarfa 1,259 1,308 2,567
Northern 29,699 29,851 59,550
524 Ħal Għargħur 1,284 1,247 2,531
537 Mellieħa 3,955 3,913 7,868
538 Mġarr 1,738 1,687 3,425
539 Mosta 9,501 9,782 19,283
544 Naxxar 6,256 6,318 12,574
555 St Paul's Bay 6,965 6,904 13,869
Gozo and Comino 15,004 15,099 30,103
611 Victoria 2,979 3,094 6,073
619 Fontana 426 445 871
622 Għajnsielem and Comino 1,274 1,273 2,547
623 Għarb 532 561 1,093
625 Għasri 195 186 381
630 Ta' Kerċem 847 832 1,679
642 Munxar 499 489 988
643 Nadur 1,903 1,940 3,843
648 Qala 846 843 1,689
654 San Lawrenz 292 286 578
656 Ta' Sannat 896 877 1,773
663 Xagħra 1,907 1,863 3,770
664 Xewkija 1,512 1,572 3,084
666 Żebbuġ 896 838 1,734
* Based on the November 2011 Census
... 1.12 Maltese population by region, district and locality: 31 December 2013*
Locality
27

Males Females Total
MALTA 198,282 201,428 399,710
Malta 183,282 186,324 369,606
Gozo and Comino 15,000 15,104 30,104
Southern Harbour 38,559 39,182 77,741
101 Valletta 2,700 2,836 5,536
103 Vittoriosa 1,217 1,181 2,398
104 Senglea 1,342 1,330 2,672
105 Cospicua 2,540 2,579 5,119
108 Ħaż-Żabbar 7,469 7,307 14,776
117 Fgura 5,627 5,724 11,351
118 Floriana 915 1,009 1,924
129 Kalkara 1,483 1,430 2,913
133 Ħal Luqa 2,708 2,999 5,707
134 Marsa 2,290 2,345 4,635
145 Paola 3,928 3,908 7,836
157 Santa Luċija 1,437 1,515 2,952
162 Ħal Tarxien 4,122 4,219 8,341
165 Xgħajra 781 800 1,581
Northern Harbour 55,988 57,858 113,846
206 Ħal Qormi 8,060 8,057 16,117
214 Birkirkara 10,506 10,804 21,310
221 Gżira 3,107 3,211 6,318
227 Ħamrun 4,270 4,507 8,777
241 Msida 3,478 3,564 7,042
246 Pembroke 1,683 1,712 3,395
247 Tal-Pietà 1,777 1,950 3,727
252 St Julian's 3,571 3,613 7,184
253 San Ġwann 5,830 5,930 11,760
258 Santa Venera 3,311 3,392 6,703
259 Tas-Sliema 5,496 6,279 11,775
260 Swieqi 4,203 4,107 8,310
261 Ta' Xbiex 696 732 1,428
South Eastern 30,777 30,766 61,543
310 Żejtun 5,601 5,588 11,189
315 Birżebbuġa 4,210 4,191 8,401
320 Gudja 1,484 1,517 3,001
326 Ħal Għaxaq 2,320 2,256 4,576
331 Ħal Kirkop 1,150 1,132 2,282
335 Marsaskala 5,245 5,351 10,596
336 Marsaxlokk 1,666 1,664 3,330
340 Mqabba 1,635 1,599 3,234
349 Qrendi 1,311 1,324 2,635
351 Ħal Safi 1,039 1,016 2,055
367 Żurrieq 5,116 5,128 10,244
1.13 Maltese mid-year population by region, district and locality: 30 June 2013* ...
Locality
28

Males Females Total
Western 28,377 28,799 57,176
402 Mdina 98 125 223
407 Ħaż-Żebbuġ 5,795 5,685 11,480
409 Siġġiewi 4,063 4,089 8,152
412 Ħ'Attard 5,152 5,267 10,419
413 Ħal Balzan 1,867 1,976 3,843
416 Ħad-Dingli 1,803 1,723 3,526
428 Iklin 1,581 1,545 3,126
432 Ħal Lija 1,409 1,489 2,898
450 Rabat 5,348 5,594 10,942
468 Mtarfa 1,261 1,306 2,567
Northern 29,581 29,719 59,300
524 Ħal Għargħur 1,277 1,243 2,520
537 Mellieħa 3,937 3,901 7,838
538 Mġarr 1,731 1,681 3,412
539 Mosta 9,484 9,790 19,274
544 Naxxar 6,245 6,269 12,514
555 St Paul's Bay 6,907 6,835 13,742
Gozo and Comino 15,000 15,104 30,104
611 Victoria 2,977 3,102 6,079
619 Fontana 425 445 870
622 Għajnsielem and Comino 1,275 1,271 2,546
623 Għarb 529 558 1,087
625 Għasri 196 188 384
630 Ta' Kerċem 844 831 1,675
642 Munxar 496 486 982
643 Nadur 1,911 1,944 3,855
648 Qala 850 843 1,693
654 San Lawrenz 291 285 576
656 Ta' Sannat 892 877 1,769
663 Xagħra 1,904 1,860 3,764
664 Xewkija 1,515 1,577 3,092
666 Żebbuġ 895 837 1,732
* Based on the November 2011 Census
Locality
... 1.13 Maltese mid-year population by region, district and locality: 30 June 2013*
29
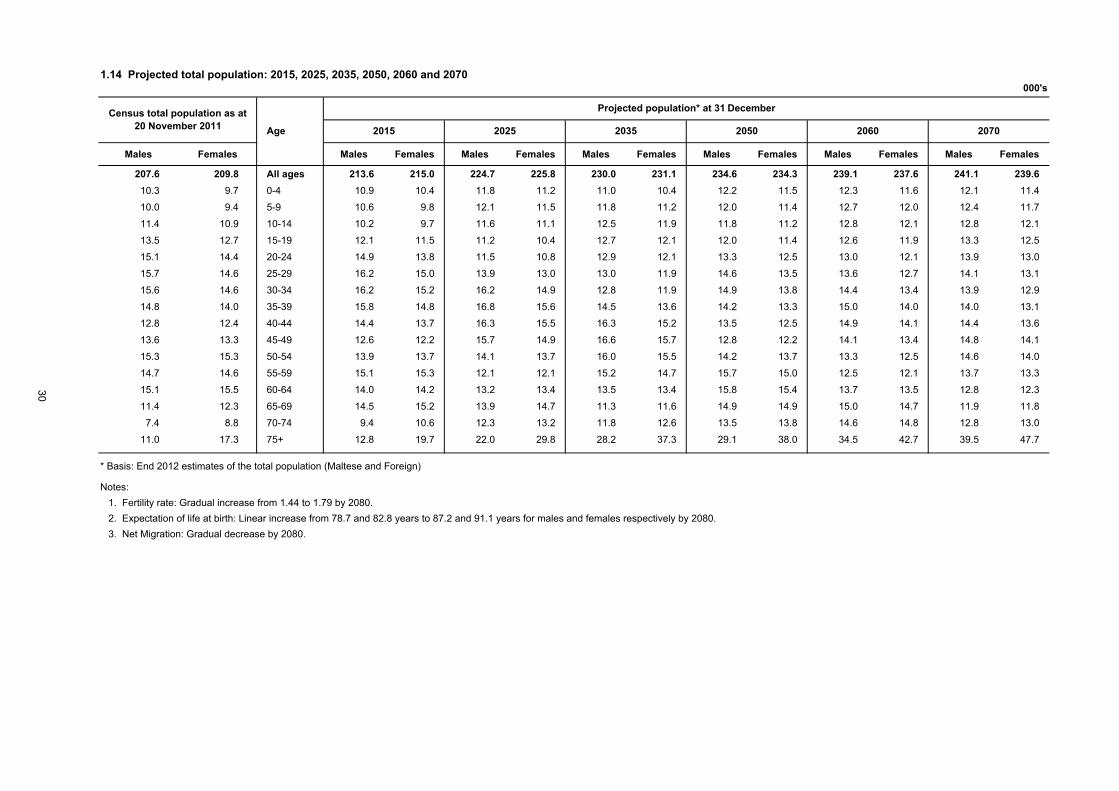
000's
Males Females Males Females Males Females Males Females Males Females Males Females Males Females
207.6 209.8 All ages 213.6 215.0 224.7 225.8 230.0 231.1 234.6 234.3 239.1 237.6 241.1 239.6
10.3 9.7 0-4 10.9 10.4 11.8 11.2 11.0 10.4 12.2 11.5 12.3 11.6 12.1 11.4
10.0 9.4 5-9 10.6 9.8 12.1 11.5 11.8 11.2 12.0 11.4 12.7 12.0 12.4 11.7
11.4 10.9 10-14 10.2 9.7 11.6 11.1 12.5 11.9 11.8 11.2 12.8 12.1 12.8 12.1
13.5 12.7 15-19 12.1 11.5 11.2 10.4 12.7 12.1 12.0 11.4 12.6 11.9 13.3 12.5
15.1 14.4 20-24 14.9 13.8 11.5 10.8 12.9 12.1 13.3 12.5 13.0 12.1 13.9 13.0
15.7 14.6 25-29 16.2 15.0 13.9 13.0 13.0 11.9 14.6 13.5 13.6 12.7 14.1 13.1
15.6 14.6 30-34 16.2 15.2 16.2 14.9 12.8 11.9 14.9 13.8 14.4 13.4 13.9 12.9
14.8 14.0 35-39 15.8 14.8 16.8 15.6 14.5 13.6 14.2 13.3 15.0 14.0 14.0 13.1
12.8 12.4 40-44 14.4 13.7 16.3 15.5 16.3 15.2 13.5 12.5 14.9 14.1 14.4 13.6
13.6 13.3 45-49 12.6 12.2 15.7 14.9 16.6 15.7 12.8 12.2 14.1 13.4 14.8 14.1
15.3 15.3 50-54 13.9 13.7 14.1 13.7 16.0 15.5 14.2 13.7 13.3 12.5 14.6 14.0
14.7 14.6 55-59 15.1 15.3 12.1 12.1 15.2 14.7 15.7 15.0 12.5 12.1 13.7 13.3
15.1 15.5 60-64 14.0 14.2 13.2 13.4 13.5 13.4 15.8 15.4 13.7 13.5 12.8 12.3
11.4 12.3 65-69 14.5 15.2 13.9 14.7 11.3 11.6 14.9 14.9 15.0 14.7 11.9 11.8
7.4 8.8 70-74 9.4 10.6 12.3 13.2 11.8 12.6 13.5 13.8 14.6 14.8 12.8 13.0
11.0 17.3 75+ 12.8 19.7 22.0 29.8 28.2 37.3 29.1 38.0 34.5 42.7 39.5 47.7
* Basis: End 2012 estimates of the total population (Maltese and Foreign)
Notes:
1. Fertility rate: Gradual increase from 1.44 to 1.79 by 2080.
2. Expectation of life at birth: Linear increase from 78.7 and 82.8 years to 87.2 and 91.1 years for males and females respectively by 2080.
3. Net Migration: Gradual decrease by 2080.
1.14 Projected total population: 2015, 2025, 2035, 2050, 2060 and 2070
Census total population as at 20 November 2011 Age
Projected population* at 31 December
2015 2025 2035 2050 2060 2070
30

2. BIRTHS


Boys Girls Total Boys Girls Total
2,174 2,218 4,392 2,129 2,159 4,288
2,037 1,920 3,957 1,996 1,880 3,876
2,048 1,870 3,918 1,990 1,819 3,809
2,029 2,021 4,050 1,961 1,955 3,916
1,998 1,889 3,887 1,946 1,836 3,782
1,984 1,874 3,858 1,916 1,820 3,736
2,039 1,846 3,885 1,953 1,767 3,720
2,036 1,835 3,871 1,939 1,753 3,692
2,151 1,975 4,126 2,033 1,857 3,890
2,146 1,997 4,143 2,012 1,889 3,901
2,056 1,952 4,008 1,941 1,845 3,786
2,182 2,101 4,283 2,016 1,937 3,953
2,191 2,040 4,231 2,009 1,846 3,855
2,160 1,967 4,127 1,910 1,762 3,672
All babies born outside wedlock and registered with the Public Authorities in Malta, having a Maltese mother.
All babies born and registered with the Public Authorities in Malta, one of whose parents is Maltese.
All babies born in wedlock and registered with the Public Authorities in Malta, one of whose parents is Maltese.
2.1 Total and Maltese* registered live births: 2000-2013
Maltese
* Classification of Maltese live births:
2012
2013
Total
2011 onwards:
Year
2000
2001
2002
2003
2009
2010
2011
2000-2010:
2004
2005
2006
2007
2008
Boys Girls Total Boys Girls Total
1,983 1,796 3,779 9.3 1,948 1,763 3,711 9.5
1,980 1,785 3,765 9.3 1,934 1,749 3,683 9.4
2,092 1,921 4,013 9.8 2,028 1,852 3,880 9.9
2,087 1,942 4,029 9.8 2,007 1,884 3,891 9.9
2,000 1,898 3,898 9.4 1,936 1,841 3,777 9.5
2,116 2,049 4,165 10.0 2,011 1,932 3,943 9.9
2,141 1,989 4,130 9.8 1,999 1,839 3,838 9.6
2,109 1,923 4,032 9.5 1,909 1,757 3,666 9.2
All babies born outside wedlock and registered with the Public Authorities in Malta, having a Maltese mother.
All babies born in wedlock and registered with the Public Authorities in Malta, one of whose parents is Maltese.
2011 onwards:
2.2 Total and Maltese* live births resident in Malta: 2006-2013
2009
2010
2011
2012
Year
2006
2007
2008
MalteseCrude birth
rate (a)
(a) Number of live births per 1,000 total mid-year population
* Classification of Maltese live births:
All babies born and registered with the Public Authorities in Malta, one of whose parents is Maltese.
2013
TotalCrude birth
rate (a)
2006-2010:
33

2.3 Number and rate of total live births resident in Malta by residence of parents: 2013 …
MALTA 2,109 1,923 4,032 9.5
Malta 1,957 1,791 3,748 9.6
Gozo and Comino 152 132 284 9.0
Southern Harbour 357 337 694 8.7
101 Valletta 26 24 50103 Vittoriosa 10 9 19104 Senglea 8 16 24105 Cospicua 21 20 41108 Ħaż-Żabbar 85 67 152117 Fgura 50 67 117118 Floriana 9 4 13129 Kalkara 9 13 22133 Ħal Luqa 20 15 35134 Marsa 25 17 42145 Paola 31 24 55157 Santa Luċija 8 12 20162 Ħal Tarxien 41 39 80165 Xgħajra 14 10 24
Northern Harbour 604 524 1,128 9.2
206 Ħal Qormi 86 69 155214 Birkirkara 127 103 230221 Gżira 37 33 70227 Ħamrun 41 23 64241 Msida 31 44 75246 Pembroke 21 15 36247 Tal-Pietà 20 20 40252 St Julian's 49 26 75253 San Ġwann 44 45 89258 Santa Venera 36 27 63259 Tas-Sliema 63 63 126260 Swieqi 43 51 94261 Ta' Xbiex 6 5 11
South Eastern 354 329 683 10.4
310 Żejtun 48 47 95315 Birżebbuġa 57 50 107320 Gudja 17 13 30326 Ħal Għaxaq 32 26 58331 Ħal Kirkop 11 10 21335 Marsaskala 66 69 135336 Marsaxlokk 16 16 32340 Mqabba 17 21 38349 Qrendi 12 12 24351 Ħal Safi 15 6 21367 Żurrieq 63 59 122
Crude birth rate*Boys Girls TotalLocality
34

... 2.3 Number and rate of total live births resident in Malta by residence of parents: 2013
Western 253 270 523 8.9
402 Mdina 1 2 3407 Ħaż-Żebbuġ 67 67 134409 Siġġiewi 35 48 83412 Ħ'Attard 53 38 91413 Ħal Balzan 15 16 31416 Ħad-Dingli 16 19 35428 Iklin 3 10 13432 Ħal Lija 14 17 31450 Rabat 43 38 81468 Mtarfa 6 15 21
Northern 389 331 720 11.1
524 Ħal Għargħur 24 17 41537 Mellieħa 49 37 86538 Mġarr 28 21 49539 Mosta 115 96 211544 Naxxar 63 66 129555 St Paul's Bay 110 94 204
Gozo and Comino 152 132 284 9.0
611 Victoria 34 25 59619 Fontana 5 3 8622 Għajnsielem and Comino 12 13 25623 Għarb 10 6 16625 Għasri 1 1 2630 Ta' Kerċem 12 9 21642 Munxar 6 6 12643 Nadur 13 17 30648 Qala 5 8 13654 San Lawrenz 4 3 7656 Ta' Sannat 16 6 22663 Xagħra 15 20 35664 Xewkija 9 6 15666 Żebbuġ 10 9 19
* Number of live births per 1,000 persons in total mid-year population
Locality Boys Girls Total Crude birth rate*
35
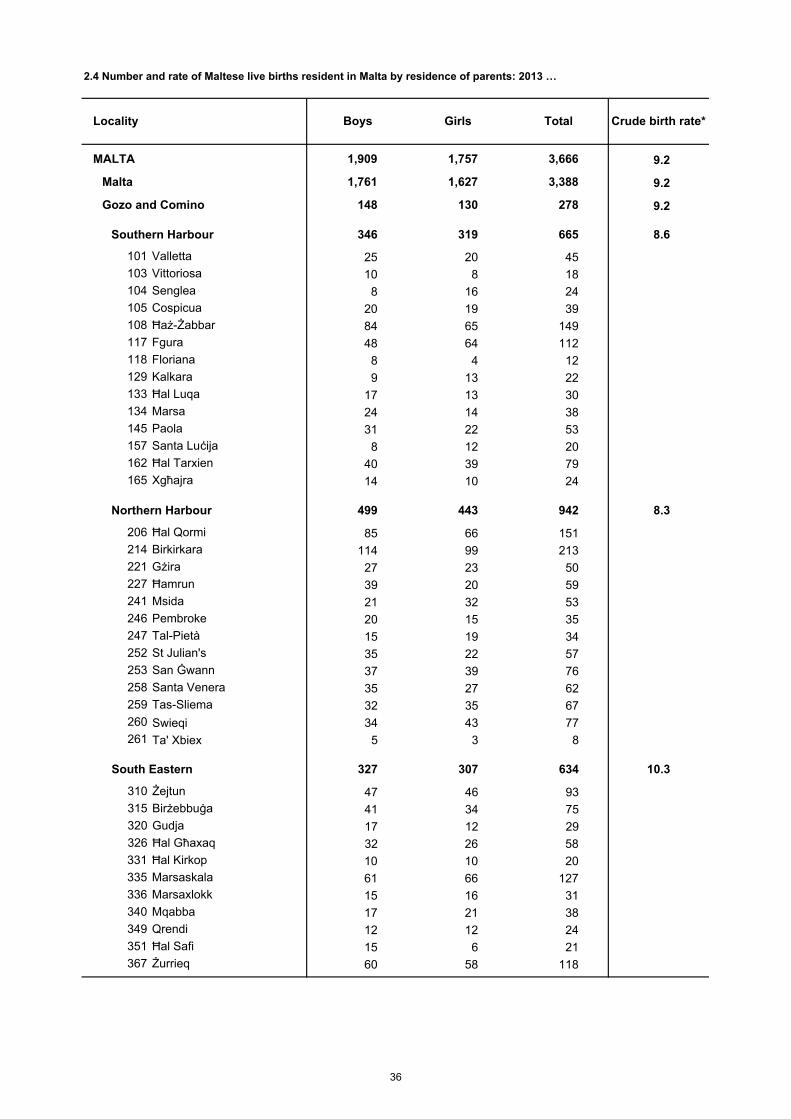
2.4 Number and rate of Maltese live births resident in Malta by residence of parents: 2013 …
MALTA 1,909 1,757 3,666 9.2
Malta 1,761 1,627 3,388 9.2
Gozo and Comino 148 130 278 9.2
Southern Harbour 346 319 665 8.6
101 Valletta 25 20 45103 Vittoriosa 10 8 18104 Senglea 8 16 24105 Cospicua 20 19 39108 Ħaż-Żabbar 84 65 149117 Fgura 48 64 112118 Floriana 8 4 12129 Kalkara 9 13 22133 Ħal Luqa 17 13 30134 Marsa 24 14 38145 Paola 31 22 53157 Santa Luċija 8 12 20162 Ħal Tarxien 40 39 79165 Xgħajra 14 10 24
Northern Harbour 499 443 942 8.3
206 Ħal Qormi 85 66 151214 Birkirkara 114 99 213221 Gżira 27 23 50227 Ħamrun 39 20 59241 Msida 21 32 53246 Pembroke 20 15 35247 Tal-Pietà 15 19 34252 St Julian's 35 22 57253 San Ġwann 37 39 76258 Santa Venera 35 27 62259 Tas-Sliema 32 35 67260 Swieqi 34 43 77261 Ta' Xbiex 5 3 8
South Eastern 327 307 634 10.3
310 Żejtun 47 46 93315 Birżebbuġa 41 34 75320 Gudja 17 12 29326 Ħal Għaxaq 32 26 58331 Ħal Kirkop 10 10 20335 Marsaskala 61 66 127336 Marsaxlokk 15 16 31340 Mqabba 17 21 38349 Qrendi 12 12 24351 Ħal Safi 15 6 21367 Żurrieq 60 58 118
Locality Boys Girls Total Crude birth rate*
36
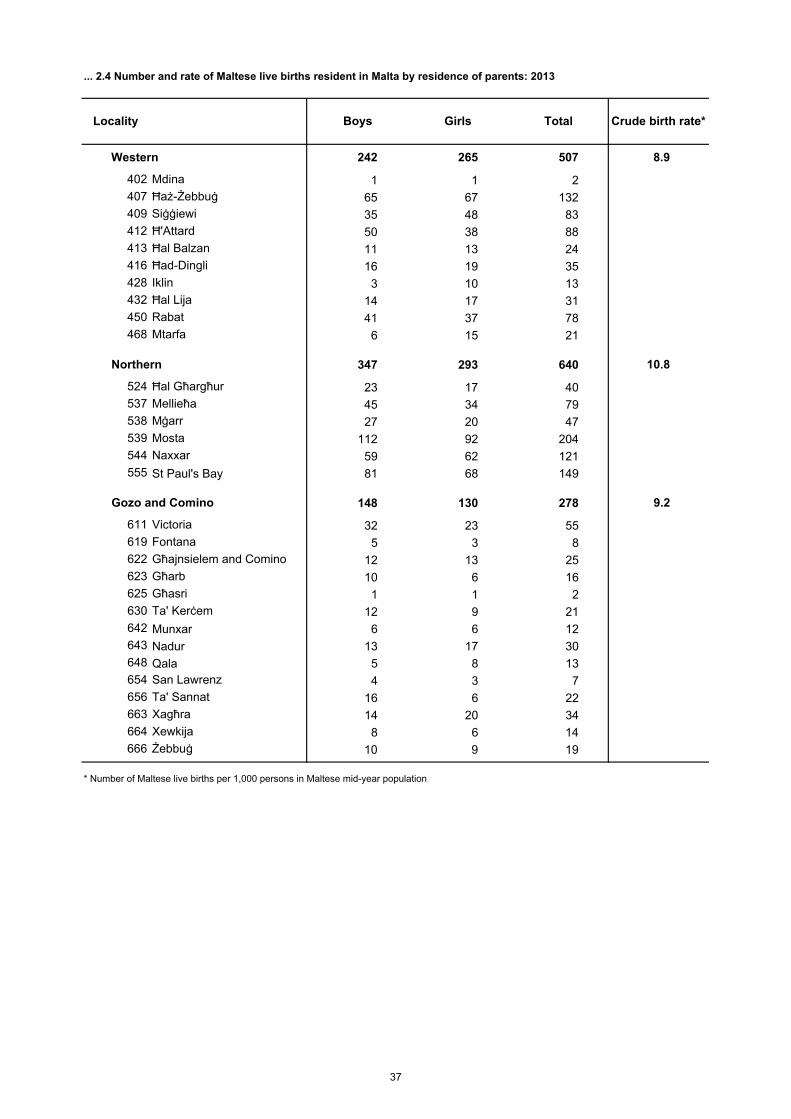
... 2.4 Number and rate of Maltese live births resident in Malta by residence of parents: 2013
Western 242 265 507 8.9
402 Mdina 1 1 2407 Ħaż-Żebbuġ 65 67 132409 Siġġiewi 35 48 83412 Ħ'Attard 50 38 88413 Ħal Balzan 11 13 24416 Ħad-Dingli 16 19 35428 Iklin 3 10 13432 Ħal Lija 14 17 31450 Rabat 41 37 78468 Mtarfa 6 15 21
Northern 347 293 640 10.8
524 Ħal Għargħur 23 17 40537 Mellieħa 45 34 79538 Mġarr 27 20 47539 Mosta 112 92 204544 Naxxar 59 62 121555 St Paul's Bay 81 68 149
Gozo and Comino 148 130 278 9.2
611 Victoria 32 23 55619 Fontana 5 3 8622 Għajnsielem and Comino 12 13 25623 Għarb 10 6 16625 Għasri 1 1 2630 Ta' Kerċem 12 9 21642 Munxar 6 6 12643 Nadur 13 17 30648 Qala 5 8 13654 San Lawrenz 4 3 7656 Ta' Sannat 16 6 22663 Xagħra 14 20 34664 Xewkija 8 6 14666 Żebbuġ 10 9 19
* Number of Maltese live births per 1,000 persons in Maltese mid-year population
Locality Boys Girls Total Crude birth rate*
37

2.5 Total live births resident in Malta by age of mother/father and births outside marriage: 2013
Boys Girls Boys Girls Boys Girls Boys Girls Boys Girls
Under 20 79 83 17 19 68 74 14 17 12 22
20-24 261 258 138 121 155 151 105 85 22 25
25-29 659 565 439 371 147 111 124 108 22 16
30-34 749 683 748 671 95 97 97 97 17 16
35-39 312 296 465 457 53 57 58 70 6 5
40-44 46 38 155 136 9 9 26 18 3 1
45-49 3 - 31 35 2 - 7 8 - -
50-54 - - 17 9 - - 5 5 - -
55-59 - - 6 5 - - 3 2 - -
60-64 - - 2 2 - - 2 2 - -
65+ - - - - - - - - - -
Unspecified - - 91 97 - - 88 87 - -
Total 2,109 1,923 2,109 1,923 529 499 529 499 82 85
AgeBy age of mother By age of father
... of which births outside marriage... of which births of
unknown father
By age of mother By age of father By age of mother
38

2.6 Maltese live births resident in Malta by age of mother/father and births outside marriage: 2013
Boys Girls Boys Girls Boys Girls Boys Girls Boys Girls
Under 20 71 75 17 16 65 69 14 14 12 22
20-24 221 239 122 112 142 148 99 82 20 23
25-29 599 503 402 333 130 97 115 101 21 16
30-34 685 644 688 626 86 89 88 88 16 15
35-39 290 265 424 431 47 50 51 65 4 4
40-44 40 31 132 120 7 7 23 15 3 1
45-49 3 - 25 26 2 - 3 7 - -
50-54 - - 14 8 - - 4 5 - -
55-59 - - 6 3 - - 3 1 - -
60-64 - - 2 - - - 2 - - -
65+ - - - - - - - - - -
Unspecified - - 77 82 - - 77 82 - -
Total 1,909 1,757 1,909 1,757 479 460 479 460 76 81
AgeBy age of mother By age of father
... of which births outside marriage... of which births of
unknown father
By age of mother By age of father By age of mother
39

Boys Girls Boys Girls Boys Girls Boys Girls
Malta 1,849 1,724 1,776 1,618 479 460 394 371
Europe (excluding Malta) 140 108 122 106 36 25 29 28
United Kingdom 26 17 36 27 6 6 7 9
Italy 4 4 17 13 2 1 10 5
Germany 5 7 2 4 2 2 - 2
Other EU Member States 68 55 47 39 22 15 9 9
Other European countries 37 25 20 23 4 1 3 3
America 6 4 5 3 1 1 1 -
Africa 82 64 86 68 10 10 12 11
Asia 31 23 24 24 3 3 3 -
Oceania 1 - 1 2 - - 1 -
Unspecified - - 95 102 - - 89 89
Total 2,109 1,923 2,109 1,923 529 499 529 499
2.7 Total live births resident in Malta by country of birth of mother/father and births outside marriage: 2013
Country of birth
By country of birth of mother
By country of birth of father
... of which births outside marriage
By country of birth of mother
By country of birth of father
40
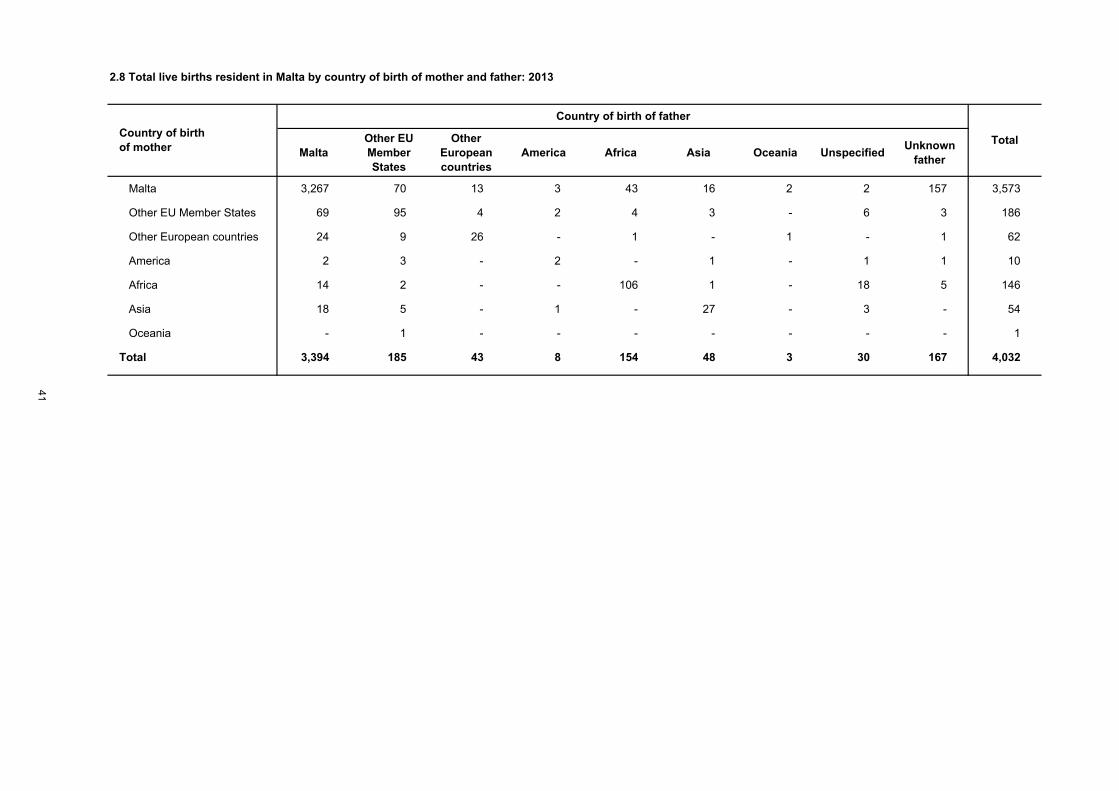
MaltaOther EU Member States
Other European countries
America Africa Asia Oceania UnspecifiedUnknown
father
Malta 3,267 70 13 3 43 16 2 2 157 3,573
Other EU Member States 69 95 4 2 4 3 - 6 3 186
Other European countries 24 9 26 - 1 - 1 - 1 62
America 2 3 - 2 - 1 - 1 1 10
Africa 14 2 - - 106 1 - 18 5 146
Asia 18 5 - 1 - 27 - 3 - 54
Oceania - 1 - - - - - - - 1
Total 3,394 185 43 8 154 48 3 30 167 4,032
2.8 Total live births resident in Malta by country of birth of mother and father: 2013
Country of birth of mother
Country of birth of father
Total
41

1st birth 2nd birth 3rd birth 4th birth 5th birth6th birth or more
Under 20 137 23 2 - - - 162
20-24 346 131 31 8 3 - 519
25-29 728 389 84 17 4 2 1,224
30-34 638 572 157 47 14 4 1,432
35-39 172 256 134 28 12 6 608
40-44 23 25 20 11 4 1 84
45+ - 1 1 - - 1 3
Total 2,044 1,397 429 111 37 14 4,032
Note: Excludes births born to mothers resident abroad.
Source: Public Registry and National Obstetric Information Systems (NOIS), Department of Health Information and Research.
2.9 Total live births resident in Malta by age of mother and order of birth: 2013
Age
Live birth order
Total
42

2.10 Maternities by type of maternity and age of mother reached at last birthday: 2013
Live Still** Total Live StillBoth alive
One still
Total
Under 20 161 162 - 162 160 - 1 - 1
20-24 518 519 3 522 511 3 4 - 4
25-29 1,210 1,224 8 1,232 1,180 8 22 - 22
30-34 1,411 1,432 4 1,436 1,382 4 25 - 25
35-39 592 608 4 612 568 4 20 - 20
40-44 82 84 - 84 80 - 2 - 2
45+ 3 3 - 3 3 - - - -
Total 3,977 4,032 19 4,051 3,884 19 74 - 74
* Excludes births born to mothers resident abroad
** All registered stillbirths are included i.e. over and under 1,000 grams
Multiple maternities
TwinsAge All maternities*
All births Single maternities
43

2.11 Total live births resident in Malta by age and economic status/occupation of father: 2013
Under 20 20-24 25-29 30-34 35-39 40-44 45-49 50-54 55-59 60-64 65+ Unspecified
Employed 29 210 734 1,337 847 262 62 18 9 1 - - 3,509
Legislators, senior officials and managers
- 9 59 170 151 48 8 4 4 1 - - 454
Professionals 2 15 127 343 203 54 20 7 1 - - - 772
Technicians and associate professionals
3 16 102 161 115 34 9 2 2 - - - 444
Clerks 2 13 40 88 44 21 - - - - - - 208
Service workers, shop and market sales workers
8 32 92 167 85 22 6 3 - - - - 415
Skilled agriculture and fishery workers
- 3 8 11 15 7 - - - - - - 44
Craft and related trades workers
4 57 152 211 114 41 10 - - - - - 589
Plant and machine operators and assemblers
2 15 55 60 39 12 3 1 - - - - 187
Elementary occupations 8 44 79 98 72 19 5 1 2 - - - 328
Armed forces - 6 20 28 9 4 1 - - - - - 68
Unemployed 7 35 49 39 33 17 3 5 1 - - - 189
Inactive - 1 1 2 1 - - 1 - 3 - - 9
Pensioner - - - - - - - 1 - 3 - - 4
Student - 1 1 2 1 - - - - - - - 5
Unspecified - 13 26 41 41 12 1 2 1 - - 188 325
Total 36 259 810 1,419 922 291 66 26 11 4 - 188 4,032
Economic status/occupation
AgeTotal
44

2.12 Monthly incidence of total live births resident in Malta: 2006-2013
Year Jan Feb Mar Apr May Jun Jul Aug Sep Oct Nov Dec Total
2006 325 281 327 311 289 321 289 313 331 368 314 310 3,779
2007 325 286 278 285 308 322 296 330 341 335 349 310 3,765
2008 303 312 413 288 274 309 317 353 363 346 365 370 4,013
2009 337 301 322 315 297 311 374 323 344 360 382 363 4,029
2010 359 290 318 275 291 280 336 338 364 322 365 360 3,898
2011 366 319 381 301 303 316 371 365 387 381 339 336 4,165
2012 356 327 308 283 355 300 370 378 365 394 348 346 4,130
2013 338 296 329 296 312 322 327 341 363 377 360 371 4,032
45


3. DEATHS


Year Males Females Total Crude Death Rate *... of which deaths
in hospitals **
2000 1,491 1,450 2,941 7.5 1,880
2001 1,465 1,439 2,904 7.4 1,913
2002 1,585 1,421 3,006 7.6 2,002
2003 1,584 1,562 3,146 7.9 2,113
2004 1,492 1,514 3,006 7.5 2,017
2005 1,577 1,555 3,132 7.8 2,113
2006 1,667 1,549 3,216 7.9 2,240
2007 1,610 1,501 3,111 7.6 2,103
2008 1,668 1,575 3,243 7.9 2,239
2009 1,672 1,549 3,221 7.8 2,178
2010 1,489 1,521 3,010 7.3 2,025
2011 1,664 1,603 3,267 7.8 2,172
2012 1,746 1,672 3,418 8.1 2,280
2013 1,636 1,600 3,236 7.6 2,253
* Number of deaths per 1,000 persons in total mid-year population
** Including persons who died in hospital within 24 hours
Notes:
1. Deaths in hospital refers to deaths of Maltese and foreign residents in all hospitals in Malta and Gozo.
2. St. Vincent de Paule is not included as a hospital.
3.1 Deaths annual review: 2000-2013
49

3.2 Deaths by locality: 2013…
MALTA 1,636 1,600 3,236 7.6
Malta 1,484 1,452 2,936 7.5
Gozo and Comino 152 148 300 9.5
Southern Harbour 410 352 762 9.6
101 Valletta 45 43 88
103 Vittoriosa 16 14 30
104 Senglea 19 14 33
105 Cospicua 40 32 72
108 Ħaż-Żabbar 58 58 116
117 Fgura 37 21 58
118 Floriana 18 11 29
129 Kalkara 17 9 26
133 Ħal Luqa 38 45 83
134 Marsa 36 24 60
145 Paola 47 40 87
157 Santa Luċija 4 5 9
162 Ħal Tarxien 31 36 67
165 Xgħajra 4 - 4
Northern Harbour 492 488 980 8.0
206 Ħal Qormi 54 53 107
214 Birkirkara 94 91 185
221 Gżira 28 36 64
227 Ħamrun 54 51 105
241 Msida 35 45 80
246 Pembroke 5 4 9
247 Tal-Pietà 19 27 46
252 St Julian's 35 42 77
253 San Ġwann 33 22 55
258 Santa Venera 26 23 49
259 Tas-Sliema 85 74 159
260 Swieqi 18 12 30
261 Ta' Xbiex 6 8 14
South Eastern 187 211 398 6.0
310 Żejtun 44 73 117
315 Birżebbuġa 26 31 57
320 Gudja 4 7 11
326 Ħal Għaxaq 14 12 26
331 Ħal Kirkop 4 8 12
335 Marsaskala 22 18 40
336 Marsaxlokk 10 7 17
340 Mqabba 8 8 16
349 Qrendi 13 7 20
351 Ħal Safi 6 5 11
367 Żurrieq 36 35 71
Crude death rate*
Locality Males Females Total
50

... 3.2 Deaths by locality: 2013
Western 171 218 389 6.6
402 Mdina 3 - 3
407 Ħaż-Żebbuġ 27 36 63
409 Siġġiewi 25 19 44
412 Ħ'Attard 32 48 80
413 Ħal Balzan 16 26 42
416 Ħad-Dingli 7 5 12
428 Iklin 3 4 7
432 Ħal Lija 5 11 16
450 Rabat 46 59 105
468 Mtarfa 7 10 17
Northern 224 183 407 6.3
524 Ħal Għargħur 10 8 18
537 Mellieħa 25 30 55
538 Mġarr 11 10 21
539 Mosta 59 73 132
544 Naxxar 40 28 68
555 St Paul's Bay 79 34 113
Gozo and Comino 152 148 300 9.5
611 Victoria 35 41 76
619 Fontana 4 1 5
622 Għajnsielem and Comino 14 14 28
623 Għarb 5 1 6
625 Għasri 2 5 7
630 Ta' Kerċem 6 5 11
642 Munxar 3 2 5
643 Nadur 22 25 47
648 Qala 15 9 24
654 San Lawrenz 2 1 3
656 Ta' Sannat 8 6 14
663 Xagħra 14 16 30
664 Xewkija 15 14 29
666 Żebbuġ 7 8 15
* Number of deaths per 1,000 persons in mid-year population
Crude death rate*
Locality Males Females Total
51

>= 500g 1000g or more
2000 16 3.7 16 12
2001 20 5.2 20 17
2002 21 5.5 20 13
2003 18 4.5 16 8
2004 15 4.0 15 15
2005 8 2.1 8 7
2006 15 4.0 10 7
2007 12 3.2 11 8
2008 29 7.2 26 18
2009 28 6.9 21 15
2010 18 4.6 16 13
2011 26 6.2 22 18
2012 20 4.8 14 7
2013 19 4.7 16 12
* Total Fetal deaths are all fetal deaths >= 22 weeks gestation or >= 500g
(a) Rate of all stillbirths per 1,000 total resident births (live and still).
3.3 Registered stillbirths: 2000-2013
Year
Stillbirths
Total * Rate (a)... of which weighing
52

3.4 Registered neonatal deaths and infant mortality: 2000-2013
>=500g >=1000g Boys Girls
2000 23 5.4 23 11 26 6.1 13 13
2001 12 3.1 12 4 17 4.4 12 5
2002 20 5.2 20 16 22 5.8 9 13
2003 21 5.3 20 13 23 5.8 16 7
2004 17 4.5 17 13 23 6.1 14 9
2005 17 4.5 17 8 23 6.1 14 9
2006 9 2.4 9 5 14 3.7 10 4
2007 20 5.3 17 10 25 6.6 9 16
2008 24 6.0 24 14 34 8.5 22 12
2009 18 4.5 17 13 22 5.5 11 11
2010 18 4.6 18 14 22 5.6 13 9
2011 23 5.5 22 14 27 6.5 13 14
2012 19 4.6 14 10 22 5.3 11 11
2013 18 4.5 16 8 27 6.7 14 13
(a) All neonatal deaths including those weighing less than 500grams.
(b) Rate of all deaths of children aged under 4 weeks per 1,000 total resident live births.
(c) All infant deaths including those weighing less than 500grams.
(d) Rate of all deaths of children aged under 1 year of age per 1,000 total resident live births.
Year
Neonatal deaths Infant mortality
Total (a) Rate (b)... of which weighing
Total (c) Rate (d)... of which
Notes:
53

3.5 Deaths by age reached at last birthday: 2000-2013
Under 1 1-4 5-9 10-14 15-19 20-24 25-34 35-44 45-54 55-64 65-74 75+
2000 11 4 1 1 7 7 12 28 84 159 423 754 1,491
2001 10 7 2 1 6 10 23 29 87 143 371 776 1,465
2002 11 5 2 3 7 11 20 23 89 156 387 871 1,585
2003 17 1 1 1 7 9 19 36 88 163 387 855 1,584
2004 13 4 1 2 7 11 15 29 72 169 376 793 1,492
2005 13 2 - 2 8 9 21 21 72 198 374 857 1,577
2006 10 1 - 3 7 12 17 38 95 202 393 889 1,667
2007 9 1 1 3 7 16 28 35 77 211 368 854 1,610
2008 22 5 - 2 3 6 29 36 97 260 336 872 1,668
2009 11 1 1 2 6 11 27 28 71 222 352 940 1,672
2010 13 2 - 2 5 9 23 37 77 221 328 772 1,489
2011 13 - 1 - 9 7 22 29 82 219 371 911 1,664
2012 11 1 1 1 1 7 24 37 77 231 364 991 1,746
2013 14 1 - 1 3 10 13 29 72 212 375 906 1,636
2000 12 3 2 1 4 1 8 15 71 114 268 951 1,450
2001 5 4 1 1 3 5 3 12 62 102 244 997 1,439
2002 10 1 - 1 2 1 12 15 52 116 269 942 1,421
2003 6 - 2 1 1 5 14 22 48 124 257 1,082 1,562
2004 9 5 - 2 4 7 8 12 51 115 273 1,028 1,514
2005 9 4 4 1 2 2 4 17 63 126 237 1,086 1,555
2006 4 3 - 3 2 1 6 17 52 135 258 1,068 1,549
2007 16 - 1 2 1 1 6 19 51 142 250 1,012 1,501
2008 12 1 1 1 1 3 7 11 50 145 251 1,092 1,575
2009 11 2 1 2 2 4 15 10 52 136 217 1,097 1,549
2010 9 2 - 3 1 3 4 11 49 131 235 1,073 1,521
2011 14 3 1 1 2 1 13 19 46 124 228 1,151 1,603
2012 11 2 - 2 2 1 14 18 55 137 233 1,197 1,672
2013 13 1 - - 2 5 4 10 40 110 217 1,198 1,600
2000 23 7 3 2 11 8 20 43 155 273 691 1,705 2,941
2001 15 11 3 2 9 15 26 41 149 245 615 1,773 2,904
2002 21 6 2 4 9 12 32 38 141 272 656 1,813 3,006
2003 23 1 3 2 8 14 33 58 136 287 644 1,937 3,146
2004 22 9 1 4 11 18 23 41 123 284 649 1,821 3,006
2005 22 6 4 3 10 11 25 38 135 324 611 1,943 3,132
2006 14 4 - 6 9 13 23 55 147 337 651 1,957 3,216
2007 25 1 2 5 8 17 34 54 128 353 618 1,866 3,111
2008 34 6 1 3 4 9 36 47 147 405 587 1,964 3,243
2009 22 3 2 4 8 15 42 38 123 358 569 2,037 3,221
2010 22 4 - 5 6 12 27 48 126 352 563 1,845 3,010
2011 27 3 2 1 11 8 35 48 128 343 599 2,062 3,267
2012 22 3 1 3 3 8 38 55 132 368 597 2,188 3,418
2013 27 2 - 1 5 15 17 39 112 322 592 2,104 3,236
Total
Males
Females
Total
Year
Age
54

3.6 Deaths by age reached at last birthday: 2013
Age Males Females Total Age Males Females Total
0-4 15 14 29 45-49 28 14 42
Less than 1 14 13 27 45 5 1 6
1 1 1 2 46 5 5 10
2 - - - 47 4 3 7
3 - - - 48 7 1 8
4 - - - 49 7 4 11
5-9 - - - 50-54 44 26 70
5 - - - 50 8 2 10
6 - - - 51 8 9 17
7 - - - 52 6 4 10
8 - - - 53 10 5 15
9 - - - 54 12 6 18
10-14 1 - 1 55-59 76 41 117
10 - - - 55 15 5 20
11 - - - 56 16 9 25
12 - - - 57 13 6 19
13 - - - 58 14 14 28
14 1 - 1 59 18 7 25
15-19 3 2 5 60-64 136 69 205
15 1 2 3 60 13 7 20
16 - - - 61 27 16 43
17 - - - 62 34 11 45
18 2 - 2 63 35 15 50
19 - - - 64 27 20 47
20-24 10 5 15 65-69 202 105 307
20 2 1 3 65 32 19 51
21 2 - 2 66 33 21 54
22 3 1 4 67 37 13 50
23 1 2 3 68 40 32 72
24 2 1 3 69 60 20 80
25-29 6 1 7 70-74 173 112 285
25 - 1 1 70 30 16 46
26 2 - 2 71 32 15 47
27 4 - 4 72 31 23 54
28 - - - 73 33 24 57
29 - - - 74 47 34 81
30-34 7 3 10 75-79 249 237 486
30 1 - 1 75 47 29 76
31 - - - 76 49 38 87
32 1 2 3 77 55 50 105
33 2 - 2 78 41 59 100
34 3 1 4 79 57 61 118
35-39 15 2 17 80-84 280 305 585
35 2 - 2 80 59 50 109
36 1 - 1 81 59 61 120
37 4 - 4 82 57 64 121
38 4 1 5 83 50 75 125
39 4 1 5 84 55 55 110
40-44 14 8 22 85-89 220 343 563
40 2 1 3 85 37 69 106
41 1 1 2 86 47 72 119
42 1 1 2 87 46 78 124
43 6 4 10 88 48 67 115
44 4 1 5 89 42 57 99
90+ 157 313 470
Total 1,636 1,600 3,236
55

Single Married WidowedDivorced/ Separated
Unspecified Total Single Married WidowedDivorced/ Separated
Unspecified Total
0-4 15 - - - - 15 14 - - - - 14 29
5-9 - - - - - - - - - - - - -
10-14 1 - - - - 1 - - - - - - 1
15-19 3 - - - - 3 2 - - - - 2 5
20-24 10 - - - - 10 4 - - - 1 5 15
25-29 4 1 - - 1 6 1 - - - - 1 7
30-34 2 1 - 1 3 7 1 2 - - - 3 10
35-39 4 8 - 2 1 15 1 1 - - - 2 17
40-44 7 5 - 2 - 14 3 5 - - - 8 22
45-49 8 15 - 2 3 28 2 8 1 3 - 14 42
50-54 7 27 1 2 7 44 1 21 2 2 - 26 70
55-59 21 47 1 3 4 76 5 27 4 2 3 41 117
60-64 23 91 9 2 11 136 11 50 4 2 2 69 205
65-69 30 139 11 10 12 202 17 62 22 1 3 105 307
70-74 33 113 13 3 11 173 16 58 30 - 8 112 285
75-79 38 155 31 8 17 249 58 76 93 2 8 237 486
80-84 44 167 50 1 18 280 65 52 174 2 12 305 585
85-89 32 113 68 1 6 220 73 38 219 1 12 343 563
90+ 35 38 76 - 8 157 69 26 213 - 5 313 470
Total 317 920 260 37 102 1,636 343 426 762 15 54 1,600 3,236
Total
3.7 Deaths by age and marital status: 2013
Age
Males Females
56

3.8 Monthly incidence of deaths: 2000-2013
Year Jan Feb Mar Apr May Jun Jul Aug Sep Oct Nov Dec Total
2000 180 161 125 117 115 115 115 117 111 103 96 136 1,491
2001 148 154 124 121 113 114 127 115 93 116 110 130 1,465
2002 196 135 145 142 134 132 120 109 97 118 97 160 1,585
2003 148 159 146 134 117 131 139 110 126 95 115 164 1,584
2004 180 131 129 122 120 99 124 108 103 122 109 145 1,492
2005 160 177 181 132 135 99 101 105 99 116 121 151 1,577
2006 192 146 163 126 122 135 131 122 127 116 129 158 1,667
2007 174 137 136 138 127 134 115 107 115 136 133 158 1,610
2008 146 151 177 148 142 124 141 104 123 115 134 163 1,668
2009 148 185 184 117 124 128 122 99 134 147 145 139 1,672
2010 147 141 156 143 106 94 105 112 110 106 129 140 1,489
2011 180 146 170 145 120 128 129 115 108 132 123 168 1,664
2012 181 174 202 142 121 103 156 136 129 120 125 157 1,746
2013 178 185 170 118 129 127 115 113 115 111 114 161 1,636
2000 184 142 121 124 126 90 115 118 96 104 102 128 1,450
2001 132 138 133 142 111 84 110 121 95 104 121 148 1,439
2002 159 132 147 127 103 128 111 103 89 98 107 117 1,421
2003 151 145 178 126 106 122 144 121 106 91 120 152 1,562
2004 188 139 151 111 117 121 113 114 110 102 115 133 1,514
2005 159 189 170 130 107 113 133 109 109 97 90 149 1,555
2006 157 140 123 122 128 142 130 135 112 102 117 141 1,549
2007 146 134 128 135 106 140 105 125 102 100 142 138 1,501
2008 163 160 135 145 120 129 137 126 124 99 109 128 1,575
2009 180 162 145 132 119 123 104 121 109 113 138 103 1,549
2010 113 136 154 121 124 108 104 148 114 132 110 157 1,521
2011 162 160 176 119 136 114 143 121 95 126 103 148 1,603
2012 182 207 190 109 121 121 130 105 126 115 123 143 1,672
2013 200 165 164 140 101 112 121 95 107 113 121 161 1,600
2000 364 303 246 241 241 205 230 235 207 207 198 264 2,941
2001 280 292 257 263 224 198 237 236 188 220 231 278 2,904
2002 355 267 292 269 237 260 231 212 186 216 204 277 3,006
2003 299 304 324 260 223 253 283 231 232 186 235 316 3,146
2004 368 270 280 233 237 220 237 222 213 224 224 278 3,006
2005 319 366 351 262 242 212 234 214 208 213 211 300 3,132
2006 349 286 286 248 250 277 261 257 239 218 246 299 3,216
2007 320 271 264 273 233 274 220 232 217 236 275 296 3,111
2008 309 311 312 293 262 253 278 230 247 214 243 291 3,243
2009 328 347 329 249 243 251 226 220 243 260 283 242 3,221
2010 260 277 310 264 230 202 209 260 224 238 239 297 3,010
2011 342 306 346 264 256 242 272 236 203 258 226 316 3,267
2012 363 381 392 251 242 224 286 241 255 235 248 300 3,418
2013 378 350 334 258 230 239 236 208 222 224 235 322 3,236
Males
Females
Total
57

MTL 1* Causes of death 2006 2007 2008 2009 2010 2011 2012 2013
1 Certain infectious and parasitic diseases 19 23 15 10 5 25 25 24
2 Neoplasms 798 826 855 852 865 881 925 870
3/4Endocrine, Nutritional and Metabolic diseases, and diseases of blood forming organs
144 134 165 164 123 65 53 118
5 Mental and behavioural disorders 88 90 111 131 123 138 89 121
6Diseases of the nervous system and diseases of the ear and mastoid process
95 64 97 93 74 96 60 84
9 Diseases of the circulatory system 1,369 1,265 1,273 1,248 1,152 1,463 1,596 1,298
10 Diseases of the respiratory system 283 281 298 303 293 234 288 344
11 Diseases of the digestive system 140 101 118 109 93 99 112 101
12 Diseases of the skin and subcutaneous tissue 37 42 36 30 28 33 15 18
13Diseases of the Musculo-skeletal system and the connective tissue
18 12 15 20 11 10 7 12
14 Diseases of the genito-urinary system 58 59 61 68 64 79 91 96
15/16Pregnancy, childbirth and the puerperium, and certain conditions originating in the perinatal period
7 12 16 8 8 13 11 12
17Congenital malformations, deformations and chromosomal abnormalities
12 22 19 21 19 23 16 10
18Symptoms, signs and abnormal clinical and laboratory findings n.e.c.
33 39 28 34 33 12 15 22
20 External causes of morbidity and mortality 115 141 136 130 119 96 112 106
U Unspecified - - - - - - 3 -
All causes 3,216 3,111 3,243 3,221 3,010 3,267 3,418 3,236
* Mortality tabulation list 1, ICD-10
3.9 Deaths by cause: 2006-2013
58

Under 1 week
Under 4 weeks
Under 1 year 1 2 3 4
1046 Remainder of malignant neoplasms M 1 1 1 1 - - - -
F - - - - - - - -
1049 Anaemias M - - - - - - - -
F 1 - - 1 - - - -
1054 Remainder of endocrine, nutritional and M 2 - - 1 1 - - -
metabolic diseases F - - - - - - - -
1061 Remainder of diseases of the nervous system M 1 - - 1 - - - -
F - - - - - - - -
1068 Other heart diseases M - - - - - - - -
F 1 - - 1 - - - -
1074 Pneumonia M - - - - - - - -
F 1 - - 1 - - - -
1077 Remainder of diseases of the respiratory system M - - - - - - - -
F 1 - - 1 - - - -
1092 Certain conditions originating in the perinatal M 6 6 6 6 - - - -
period F 5 3 5 5 - - - -
1093 Congenital malformations, deformations and M 4 3 3 4 - - - -
chromosomal abnormalities F 5 1 2 4 1 - - -
1094 Symptoms, signs and abnornal clinical and M 1 - - 1 - - - -
laboratory findings, not elsewhere classified F - - - - - - - -
All causes M 15 10 10 14 1 - - -
F 14 4 7 13 1 - - -
* Mortality tabulation list 1, ICD-10
3.10 Deaths of children under 5 by cause: 2013
MTL 1* Cause of death Sex
Age
Total under 5 years
Under 1 year Completed year
59

3.11 Deaths by cause: 2013 …
0-4 5-14 15-24 25-34 35-44 45-54 55-64 65-74 75-84 85+
1001 Certain infectious and parasitic diseases M - - - - 1 2 3 3 - 4 13
F - - - - - - - 1 2 8 11
1003 Diarrhoea and gastroenteritis of presumed infectious origin M - - - - - - - - - - -
F - - - - - - - 1 - - 1
1004 Other intestinal infectious diseases M - - - - - - 1 - - 1 2
F - - - - - - - - - 1 1
1005 Respiratory tuberculosis M - - - - - - - - - - -
F - - - - - - - - 1 - 1
1012 Septicaemia M - - - - - - - 1 - 1 2
F - - - - - - - - 1 5 6
1019 Viral hepatitis M - - - - - 2 - - - - 2
F - - - - - - - - - - -
1020 Human immunodeficiency virus [HIV] disease M - - - - 1 - - - - - 1
F - - - - - - - - - - -
1025 Remainder of certain infectious and parasitic diseases M - - - - - - 2 2 - 2 6
F - - - - - - - - - 2 2
1026 Neoplasms M 1 - 2 - 7 20 90 142 152 52 466
F - - 1 2 7 27 63 101 138 65 404
1027 Malignant neoplasm of lip, oral cavity and pharynx M - - - - - - 3 3 3 - 9
F - - - - - - 2 1 4 1 8
1028 Malignant neoplasm of oesophagus M - - - - 2 - 2 2 1 2 9
F - - - - - - 1 1 - 1 3
1029 Malignant neoplasm of stomach M - - - - - 4 3 12 9 3 31
F - - - - - 1 1 4 5 4 15
1030 Malignant neoplasm of colon, rectum and anus M - - - - - 1 11 17 25 7 61
F - - - - - 4 8 14 12 10 48
MTL1* Cause of death SexAge
Total
60

... 3.11 Deaths by cause: 2013
0-4 5-14 15-24 25-34 35-44 45-54 55-64 65-74 75-84 85+
1031 Malignant neoplasm of liver and intrahepatic bile ducts M - - - - - 1 5 4 2 1 13
F - - - - - - 2 1 4 1 8
1032 Malignant neoplasm of pancreas M - - - - - 5 10 12 6 1 34
F - - - 1 1 1 7 12 12 4 38
1033 Malignant neoplasm of larynx M - - - - - - 1 4 1 - 6
F - - - - - - - - - - -
1034 Malignant neoplasm of trachea, bronchus and lung M - - - - - 3 19 43 45 7 117
F - - - - - 5 8 11 9 4 37
1035 Malignant neoplasm of skin M - - - - - - - 2 3 - 5
F - - - - - - 1 2 4 - 7
1036 Malignant neoplasm of breast M - - - - - - - - - - -
F - - - - 3 5 16 23 19 17 83
1037 Malignant neoplasm of cervix uteri M - - - - - - - - - - -
F - - - - - 2 - - 2 - 4
1038 Malignant neoplasm of other and unspecified parts of uterus M - - - - - - - - - - -
F - - - - - 1 - 2 7 1 11
1039 Malignant neoplasm of ovary M - - - - - - - - - - -
F - - - - - 4 1 12 11 1 29
1040 Malignant neoplasm of prostate M - - - - - - 4 11 7 15 37
F - - - - - - - - - - -
1041 Malignant neoplasm of bladder M - - - - - - 6 2 8 4 20
F - - - - 1 - 2 1 2 3 9
1042 Malignant neoplasm of meninges, brain and other parts of M - - - - 1 2 5 2 5 2 17
central nervous system F - - - - - 2 1 1 3 1 8
1043 Non-Hodgkin's lymphoma M - - 1 - 1 2 3 3 5 - 15
F - - 1 - - - 2 1 5 1 10
MTL1* Cause of death SexAge
Total
61

... 3.11 Deaths by cause: 2013
0-4 5-14 15-24 25-34 35-44 45-54 55-64 65-74 75-84 85+
1044 Multiple myeloma and malignant plasma cell neoplasms M - - - - - - 3 2 2 - 7
F - - - - - 2 2 1 1 1 7
1045 Leukaemia M - - - - 1 - 2 2 4 1 10
F - - - - - - 1 2 6 1 10
1046 Remainder of malignant neoplasms M 1 - 1 - 1 2 13 20 22 9 69
F - - - 1 1 - 5 11 26 9 53
1047 Remainder of neoplasms M - - - - 1 - - 1 4 - 6
F - - - - 1 - 3 1 6 5 16
1048 Diseases of the blood and blood-forming organs and M - - - - - - 1 - 1 - 2
certain disorders involving the immune mechanism F 1 - - - - - - - - 2 3
1049 Anaemias M - - - - - - 1 - - - 1
F 1 - - - - - - - - 2 3
1050 Remainder of diseases of the blood and blood-forming organs M - - - - - - - - 1 - 1
and certain disorders involving the immune mechanism F - - - - - - - - - - -
1051 Endocrine, nutritional and metabolic diseases M 2 - - 1 3 1 12 9 23 7 58
F - - 1 - - 4 2 11 20 17 55
1052 Diabetes mellitus M - - - - 3 1 11 9 23 7 54
F - - - - 3 2 11 20 15 51
1054 Remainder of endocrine, nutritional and metabolic diseases M 2 - - 1 - - 1 - - - 4
F - - 1 - - 1 - - - 2 4
1055 Mental and behavioural disorders M - - - - - 1 3 8 13 13 38
F - - - - - - - 4 22 57 83
1056 Mental and behavioural disorders due to psychoactive M - - - - - 1 - 1 - - 2
substance use F - - - - - - - - - - -
1057 Remainder of mental and behavioural disorders M - - - - - - 3 7 13 13 36
F - - - - - - - 4 22 57 83
MTL1* Cause of death SexAge
Total
62
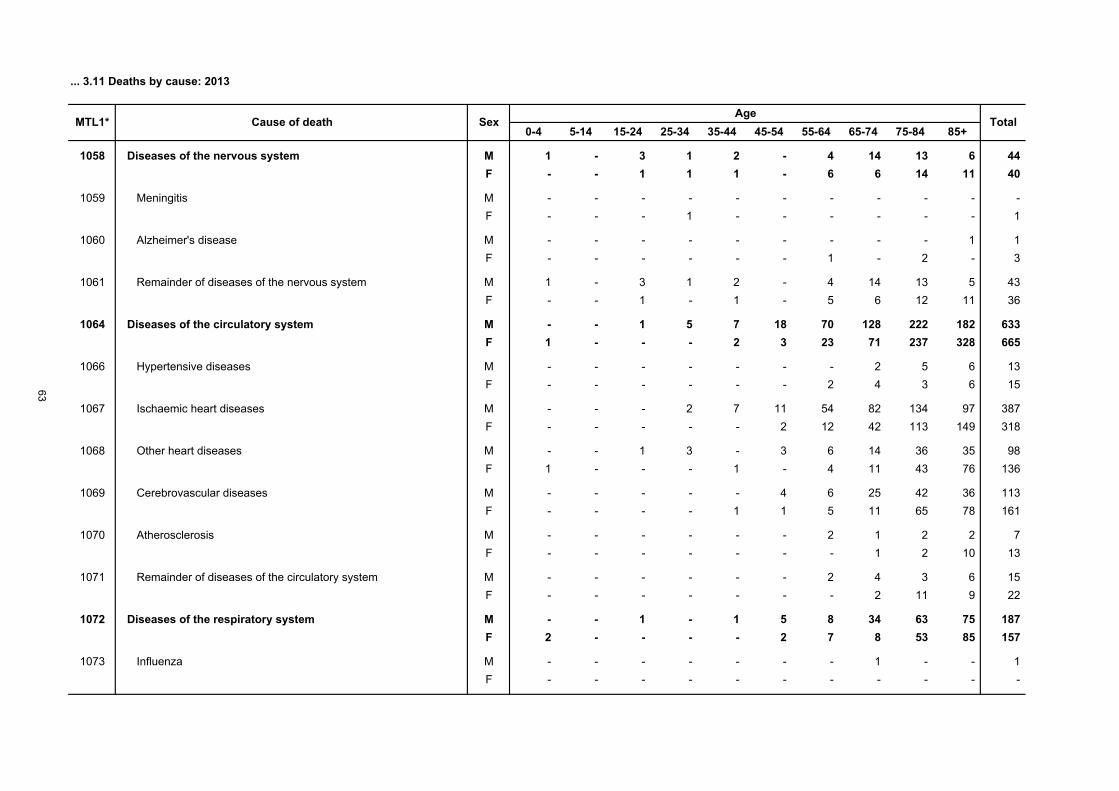
... 3.11 Deaths by cause: 2013
0-4 5-14 15-24 25-34 35-44 45-54 55-64 65-74 75-84 85+
1058 Diseases of the nervous system M 1 - 3 1 2 - 4 14 13 6 44
F - - 1 1 1 - 6 6 14 11 40
1059 Meningitis M - - - - - - - - - - -
F - - - 1 - - - - - - 1
1060 Alzheimer's disease M - - - - - - - - - 1 1
F - - - - - - 1 - 2 - 3
1061 Remainder of diseases of the nervous system M 1 - 3 1 2 - 4 14 13 5 43
F - - 1 - 1 - 5 6 12 11 36
1064 Diseases of the circulatory system M - - 1 5 7 18 70 128 222 182 633
F 1 - - - 2 3 23 71 237 328 665
1066 Hypertensive diseases M - - - - - - - 2 5 6 13
F - - - - - - 2 4 3 6 15
1067 Ischaemic heart diseases M - - - 2 7 11 54 82 134 97 387
F - - - - - 2 12 42 113 149 318
1068 Other heart diseases M - - 1 3 - 3 6 14 36 35 98
F 1 - - - 1 - 4 11 43 76 136
1069 Cerebrovascular diseases M - - - - - 4 6 25 42 36 113
F - - - - 1 1 5 11 65 78 161
1070 Atherosclerosis M - - - - - - 2 1 2 2 7
F - - - - - - - 1 2 10 13
1071 Remainder of diseases of the circulatory system M - - - - - - 2 4 3 6 15
F - - - - - - - 2 11 9 22
1072 Diseases of the respiratory system M - - 1 - 1 5 8 34 63 75 187
F 2 - - - - 2 7 8 53 85 157
1073 Influenza M - - - - - - - 1 - - 1
F - - - - - - - - - - -
MTL1* Cause of death SexAge
Total
63

... 3.11 Deaths by cause: 2013
0-4 5-14 15-24 25-34 35-44 45-54 55-64 65-74 75-84 85+
1074 Pneumonia M - - 1 - 1 5 2 6 22 24 61
F 1 - - - - 2 1 2 25 43 74
1075 Other acute lower respiratory infections M - - - - - - - 3 12 12 27
F - - - - - - - 1 15 26 42
1076 Chronic lower respiratory diseases M - - - - - - 6 15 24 21 66
F - - - - - - 3 2 4 3 12
1077 Remainder of diseases of the respiratory system M - - - - - - - 9 5 18 32
F 1 - - - - - 3 3 9 13 29
1078 Diseases of the digestive system M - - - - 2 6 6 16 14 6 50
F - - - - - 3 5 3 16 24 51
1079 Gastric and duodenal ulcer M - - - - - - - 1 1 2 4
F - - - - - - 1 - 3 2 6
1080 Diseases of the liver M - - - - 2 5 5 6 4 - 22
F - - - - - 1 3 1 - - 5
1081 Remainder of diseases of the digestive system M - - - - - 1 1 9 9 4 24
F - - - - - 2 1 2 13 22 40
1082 Diseases of the skin and subcutaneous tissue M - - - - - - - 1 1 2 4
F - - - - - - - - 6 8 14
1083 Diseases of the musculoskeletal system and M - - 1 - - 1 - 2 - - 4
connective tissue F - - - - - - 1 2 5 - 8
1084 Diseases of the genitourinary system M - - - - 1 - 3 9 15 10 38
F - - - - - - 3 4 19 32 58
1085 Glomerular and renal tubulo-interstitial diseases M - - - - - - 1 - - - 1
F - - - - - - 1 1 - 1 3
1086 Remainder of diseases of the genito-urinary system M - - - - 1 - 2 9 15 10 37
F - - - - - - 2 3 19 31 55
MTL1* Cause of death SexAge
Total
64

... 3.11 Deaths by cause: 2013
0-4 5-14 15-24 25-34 35-44 45-54 55-64 65-74 75-84 85+
1092 Certain conditions originating in the perinatal period M 6 - - - - - - - - - 6
F 6 - - - - - - - - - 6
1093 Congenital malformations, deformations and M 4 - - - - 1 - - - - 5
chromosomal abnormalities F 4 - - - - - - - 1 - 5
1094 Symptoms, signs and abnormal clinical and M 1 - - - - - - - 2 7 10
laboratory findings, not elsewhere classified F - - - - - - - - 3 9 12
1095 External causes of morbidity and mortality M - 1 5 6 5 17 12 9 10 13 78
F - - 4 1 - 1 - 6 6 10 28
1096 Transport accidents M - - 2 4 1 3 4 3 1 - 18
F - - 3 - - 1 - 2 - - 6
1097 Falls M - - - - - 3 1 5 6 13 28
F - - - - - - - 2 6 10 18
1098 Accidental drowning and submersion M - - - - - - - - - - -
F - - 1 - - - - - - - 1
1101 Intentional self-harm M - 1 2 2 3 8 4 - 1 - 21
F - - - 1 - - - - - - 1
1102 Assault M - - 1 - - 3 1 1 - - 6
F - - - - - - - - - - -
1103 All other external causes M - - - - 1 - 2 - 2 - 5
F - - - - - - - 2 - - 2
Total T 29 1 20 17 39 112 322 592 1,071 1,033 3,236
M 15 1 13 13 29 72 212 375 529 377 1,636
F 14 - 7 4 10 40 110 217 542 656 1,600
* Mortality tabulation list 1, ICD-10
MTL1* Cause of death SexAge
Total
65

3.12 Deaths by age and economic status/occupation at the time of death: 2013
Males Females Males Females Males Females Males Females Males Females Total
Employed - - 17 5 59 13 - - 76 18 94
Legislators, senior officials and managers - - 1 1 4 2 - - 5 3 8
Professionals - - 4 2 9 3 - - 13 5 18
Technicians and associate professionals - - 3 1 5 2 - - 8 3 11
Clerical support workers - - - - 1 2 - - 1 2 3
Service workers, shop and market sales workers - - 1 - 8 1 - - 9 1 10
Skilled agriculture and fishery workers - - - - - - - - - - -
Craft and related trades workers - - 2 - 10 - - - 12 - 12
Plant and machine operators and assemblers - - 3 - 6 2 - - 9 2 11
Elementary occupations - - - - 7 1 - - 7 1 8
Armed forces - - - - - - - - - - -
Unspecified - - 3 1 9 - - - 12 1 13
Unemployed - - 10 3 19 4 - - 29 7 36
Inactive 16 14 9 10 159 126 1,281 1,415 1,465 1,565 3,030
Children/students 16 14 1 4 - - - - 17 18 35
Housewife - - - 4 - 56 - 4 - 64 64
Pensioner - - - - 138 69 1,281 1,411 1,419 1,480 2,899
Other inactive - - 8 2 21 1 - - 29 3 32
Unspecified - - 19 3 47 7 - - 66 10 76
Total 16 14 55 21 284 150 1,281 1,415 1,636 1,600 3,236
65 and overOccupation
TotalUnder 15 15-44 45-64
66

Males Females Total
lxoex lx
oex lxoex
0 10,000 79.6 10,000 84.0 10,000 81.9
1 9,935 79.1 9,934 83.6 9,935 81.4
2 9,931 78.2 9,930 82.6 9,930 80.4
3 9,931 77.2 9,930 81.6 9,930 79.4
4 9,931 76.2 9,930 80.6 9,930 78.4
5 9,931 75.2 9,930 79.6 9,930 77.4
6 9,931 74.2 9,930 78.6 9,930 76.4
7 9,931 73.2 9,930 77.6 9,930 75.4
8 9,931 72.2 9,930 76.6 9,930 74.4
9 9,931 71.2 9,930 75.6 9,930 73.4
10 9,931 70.2 9,930 74.6 9,930 72.4
11 9,931 69.2 9,930 73.6 9,930 71.4
12 9,931 68.2 9,930 72.6 9,930 70.4
13 9,931 67.2 9,930 71.6 9,930 69.4
14 9,931 66.2 9,930 70.6 9,930 68.4
15 9,926 65.2 9,930 69.6 9,928 67.5
16 9,922 64.2 9,921 68.7 9,922 66.5
17 9,922 63.2 9,921 67.7 9,922 65.5
18 9,922 62.2 9,921 66.7 9,922 64.5
19 9,915 61.3 9,921 65.7 9,918 63.5
20 9,915 60.3 9,921 64.7 9,918 62.5
21 9,908 59.3 9,917 63.7 9,913 61.6
22 9,902 58.3 9,917 62.7 9,909 60.6
23 9,892 57.4 9,914 61.7 9,903 59.6
24 9,889 56.4 9,907 60.8 9,898 58.7
25 9,883 55.4 9,904 59.8 9,893 57.7
26 9,883 54.4 9,901 58.8 9,892 56.7
27 9,877 53.5 9,901 57.8 9,888 55.7
28 9,864 52.5 9,901 56.8 9,882 54.7
29 9,864 51.5 9,901 55.8 9,882 53.7
30 9,864 50.5 9,901 54.8 9,882 52.7
31 9,861 49.6 9,901 53.8 9,880 51.8
32 9,861 48.6 9,901 52.8 9,880 50.8
33 9,858 47.6 9,894 51.8 9,875 49.8
34 9,852 46.6 9,894 50.8 9,872 48.8
35 9,843 45.7 9,891 49.9 9,866 47.8
36 9,837 44.7 9,891 48.9 9,862 46.8
37 9,833 43.7 9,891 47.9 9,861 45.8
38 9,821 42.7 9,891 46.9 9,854 44.9
39 9,808 41.8 9,887 45.9 9,846 43.9
40 9,795 40.9 9,884 44.9 9,837 43.0
41 9,788 39.9 9,880 43.9 9,832 42.0
42 9,784 38.9 9,876 42.9 9,828 41.0
43 9,780 37.9 9,872 41.9 9,825 40.0
44 9,758 37.0 9,856 41.0 9,805 39.1
3.13 Life table: 2013 ...
Age
67

Males Females Total
lxoex lx
oex lxoex
45 9,742 36.1 9,852 40.0 9,795 38.1
46 9,723 35.1 9,848 39.0 9,783 37.2
47 9,703 34.2 9,828 38.1 9,763 36.2
48 9,688 33.3 9,816 37.2 9,750 35.3
49 9,662 32.3 9,812 36.2 9,735 34.3
50 9,638 31.4 9,798 35.2 9,716 33.4
51 9,611 30.5 9,791 34.3 9,699 32.5
52 9,586 29.6 9,761 33.4 9,671 31.6
53 9,567 28.6 9,748 32.4 9,655 30.6
54 9,536 27.7 9,732 31.5 9,631 29.7
55 9,498 26.9 9,713 30.5 9,603 28.8
56 9,451 26.0 9,698 29.6 9,572 27.9
57 9,403 25.1 9,669 28.7 9,533 27.0
58 9,363 24.2 9,650 27.7 9,503 26.1
59 9,319 23.3 9,603 26.8 9,458 25.2
60 9,260 22.5 9,580 25.9 9,417 24.3
61 9,217 21.6 9,556 25.0 9,383 23.4
62 9,129 20.8 9,503 24.1 9,313 22.6
63 9,023 20.0 9,468 23.2 9,241 21.7
64 8,919 19.2 9,421 22.3 9,166 20.9
65 8,840 18.4 9,361 21.5 9,096 20.1
66 8,747 17.6 9,305 20.6 9,021 19.2
67 8,649 16.8 9,244 19.7 8,942 18.4
68 8,534 16.0 9,203 18.8 8,864 17.5
69 8,410 15.2 9,102 18.0 8,751 16.8
70 8,195 14.6 9,030 17.1 8,607 16.0
71 8,039 13.9 8,949 16.3 8,490 15.2
72 7,843 13.2 8,860 15.4 8,349 14.5
73 7,667 12.5 8,736 14.7 8,200 13.7
74 7,496 11.8 8,617 13.9 8,055 13.0
75 7,262 11.2 8,453 13.1 7,857 12.3
76 7,024 10.5 8,315 12.3 7,671 11.6
77 6,774 9.9 8,132 11.6 7,456 10.9
78 6,480 9.3 7,884 10.9 7,186 10.3
79 6,235 8.7 7,575 10.4 6,909 9.7
80 5,876 8.2 7,253 9.8 6,573 9.2
81 5,495 7.7 6,996 9.1 6,264 8.6
82 5,086 7.3 6,674 8.6 5,909 8.1
83 4,672 6.9 6,320 8.0 5,534 7.6
84 4,290 6.5 5,865 7.6 5,116 7.2
85+ 3,839 6.2 5,501 7.1 4,716 6.7
... 3.13 Life table: 2013
Age
The column lx shows, for each sex, the number of persons who would survive to exact age x out of 10,000 born who were subject
throughout their lives to the recorded age death rates of the period. Column oex is the 'expectation of life', that is the averageremaining lifetime for a person who survives at the beginning of the indicated age interval, if likewise subject to those death rates.
68

4. MIGRATION


4.1 Annual estimates of migration flows: 2013
Males Females Total Males Females Total Males Females Total Males Females Total
0-19 134 183 317 191 170 361 472 208 680 797 561 1,358
20-29 305 243 548 494 350 844 1,003 448 1,451 1,802 1,041 2,843
30-39 212 213 425 476 231 707 503 314 817 1,191 758 1,949
40-49 94 81 175 264 132 396 158 156 314 516 369 885
50-59 83 55 138 259 150 409 74 71 145 416 276 692
60-69 63 70 133 197 129 326 28 19 47 288 218 506
70-79 35 34 69 54 22 76 5 - 5 94 56 150
80+ 12 7 19 16 10 26 - - - 28 17 45
Total 938 886 1,824 1,951 1,194 3,145 2,243 1,216 3,459 5,132 3,296 8,428
Males Females Total Males Females Total Males Females Total Males Females Total
0-19 65 31 96 118 106 224 77 83 160 260 220 480
20-29 418 262 680 276 226 502 368 129 497 1,062 617 1,679
30-39 177 233 410 335 212 547 416 214 630 928 659 1,587
40-49 44 65 109 159 117 276 156 136 292 359 318 677
50-59 - 20 20 168 123 291 70 37 107 238 180 418
60-69 - 18 18 144 93 237 22 14 36 166 125 291
70-79 - - - 37 15 52 - - - 37 15 52
80+ - - - 10 6 16 1 3 4 11 9 20
Total 704 629 1,333 1,247 898 2,145 1,110 616 1,726 3,061 2,143 5,204
Age
Emigration by citizenship
Malta EU Member States Non-EU countries Total
Age
Immigration by citizenship
Malta EU Member States Non-EU countries Total
71

Year Number of boats arriving Total persons on boardAverage number of people
on board per boat
2002 21 1,686 80
2003 12 502 42
2004 52 1,388 27
2005 48 1,822 38
2006 57 1,780 31
2007 68 1,702 25
2008 84 2,775 33
2009 17 1,475 87
2010 2 47 24
2011 9 1,579 175
2012 27 1,890 70
2013 24 2,008 84
4.2 Boats arriving in Malta with irregular immigrants: 2002-2013
Total 2,008
Africa 1,782
4.3 Boats arriving in Malta with irregular immigrants by nationality: 2013
Nationality Total
Cameroon 5
Eritrea 462
Ethiopia 19
Gambia 70
Ghana 43
Guinea Bissau 6
Mali 37
Morocco 7
Nigeria 76
Senegal 37
Somalia 1,000
Sudan 4
Syria 168
Other Asian countries 5
Other African countries 16
Asia 226
Palestine 53
72

Year Number
2002 350
2003 455
2004 995
2005 1,165
2006 1,261
2007 1,386
2008 2,608
2009 2,387
2010 176
2011 1,891
2012 2,080
2013 2,246
4.4 Asylum applications filed with the Office of the Refugee Commissioner: 2002-2013
Note: Data for 2002-2005 were sourced from the Eurostat New Cronos database.
Males Females Unspecified
January 20 4 - 24
February 17 5 - 22
March 59 13 1 73
April 131 36 - 167
May 121 6 - 127
June 39 15 - 54
July 338 99 - 437
August 640 99 - 739
September 229 62 - 291
October 105 12 - 117
November 124 4 - 128
December 49 18 - 67
Total 1,872 373 1 2,246
4.5 Asylum applications filed with the Office of the Refugee Commissioner by month: 2013
MonthApplications
Total
73

Citizenship Males Females Unspecified Total
Europe - 2 - 2
Other European countries - 2 - 2
Africa 1,653 312 1 1,966
Cameroon 4 1 - 5
Cote d'Ivoire 4 - - 4
Egypt 9 4 - 13
Eritrea 408 68 - 476
Ethiopia 14 2 - 16
Gambia 70 - - 70
Ghana 30 - - 30
Guinea-Bissau 6 - - 6
Libya 91 18 - 109
Mali 42 - - 42
Morocco 9 3 - 12
Nigeria 71 23 1 95
Senegal 35 - - 35
Somalia 828 189 - 1,017
Sudan 13 - - 13
Tunisia 7 4 - 11
Other African countries 12 - - 12
Asia 219 59 - 278
Bangladesh 6 1 - 7
Palestinian Territory, Occupied 10 1 - 11
Syrian Arab Republic 196 55 - 251
Other Asian countries 7 2 - 9
Total 1,872 373 1 2,246
Age Males Females Unspecified Total
0-17 451 96 - 547
18-34 1,268 240 - 1,508
35+ 148 37 - 185
Unspecified 5 - 1 6
Total 1,872 373 1 2,246
4.6 Asylum applications filed with the Office of the Refugee Commissioner by citizenship and age: 2013
74

4.7 Asylum decisions taken by the Office of the Refugee Commissioner: 2002-2013
Negative Decisions
Subsidiary protection or other forms of
protection
Refugee status
Total Rejections
2002 111 22 133 286 419
2003 328 53 381 187 568
2004 560 49 609 259 868
2005 510 36 546 556 1,102
2006 481 22 503 542 1,045
2007 623 7 630 329 959
2008 1,397 19 1,416 1,281 2,697
2009 1,671 20 1,691 884 2,575
2010 179 43 222 126 348
2011 814 70 884 722 1,606
2012 1,398 35 1,433 157 1,590
2013 1,563 43 1,606 299 1,905
Year
Positive decisions
Total
75

Citizenship Males Females Total
Africa 1,111 223 1,334
Egypt 3 3 6
Eritrea 457 94 551
Ethiopia 13 1 14
Libya 61 10 71
Morocco 1 3 4
Nigeria 5 3 8
Somalia 558 108 666
Sudan 13 1 14
Asia 209 63 272
Syrian Arab Republic 206 63 269
Other Asian countries 3 - 3
Total 1,320 286 1,606
Age group Males Females Total
0-17 112 52 164
18-34 1,063 205 1,268
35+ 141 29 170
Unspecified 4 - 4
Total 1,320 286 1,606
4.8 Positive decisions (Refugee Status, Subsidiary Protection and other positive decisions) taken by the Office of the Refugee Commissioner by citizenship: 2013
76

4.9 Migrants residing in Open Centres and other institutional households by locality: 31 December 2011-2013
Locality 2011 2012 2013
Open centres 969 1,453 1,255
Birkirkara 14 24 20
Fgura 43 50 20
Floriana 19 26 15
Ħal Far 595 1,091 905
Marsa 298 262 295
Other institutional households 320 295 244
Total 1,289 1,748 1,499
4.10 Migrants residing in open centres and other institutional households by sex: 31 December 2011-2013
Sex 2011 2012 2013
Adults 1,076 1,505 1,182
Males 833 1,150 949
Females 243 355 233
Minors 213 243 317
Males 120 141 207
Females 93 102 110
Total 1,289 1,748 1,499
77

Country of origin Males Females Total
Europe 12 6 18
Turkey 11 6 17
Other European countries 1 - 1
Africa 1,110 323 1,433
Chad 8 1 9
Eritrea 365 106 471
Ethiopia 66 46 112
Gambia 18 - 18
Ghana 7 - 7
Guinea 5 - 5
Ivory Coast 20 1 21
Libya 13 - 13
Mali 31 - 31
Niger 11 1 12
Nigeria 38 19 57
Senegal 8 - 8
Somalia 487 148 635
Sudan 14 - 14
Togo 5 - 5
Other African countries 14 1 15
Asia 34 14 48
Bangladesh 5 - 5
Pakistan 3 1 4
Palestine 14 10 24
Syria 8 3 11
Other Asian countries 4 - 4
Total 1,156 343 1,499
4.11 Migrants residing in open centres and other institutional households by country of origin: 31 December 2013
78

Citizenship Subject to an obligation to leave Returned to a third country
Europe 57 55
Russia 18 16
Serbia 16 15
Turkey 13 13
Ukraine 4 4
Other European countries 6 7
Africa 2,019 280
Cameroon 5 -
Egypt 9 11
Eritrea 463 -
Ethiopia 19 2
Gambia 70 1
Ghana 44 9
Guinea 4 -
Guinea-Bissau 6 -
Libya 210 212
Mali 39 3
Morocco 8 8
Nigeria 76 19
Senegal 37 1
Somalia 1,001 2
Sudan 4 -
Tunisia 10 7
Other African countries 14 5
America 26 26
Brazil 10 10
United States of America 11 11
Other American countries 5 5
Asia 331 95
Afghanistan 4 -
Bangladesh 4 1
China (including Hong Kong) 25 25
Georgia 9 9
India 4 6
Iran, Islamic Republic of 5 4
Japan 5 5
Korea, Dem. People's Rep. of 7 7
Pakistan 5 4
Palestine 54 1
Philippines 5 5
Syrian Arab Republic 176 7
Thailand 4 4
Uzbekistan 9 9
Other Asian countries 15 8
Oceania 4 4
Other Oceanic countries 4 4
Total 2,437 460
4.12 Third country nationals found to be illegally present and were subject to an obligation to leave and those who actually left Malta: 2013
79

0-13 14-17 18-34 35+ Total 0-13 14-17 18-34 35+ Total
Europe - 1 23 3 27 - - 15 15 30 57
Russia - - 3 - 3 - - 9 6 15 18
Serbia - - 11 2 13 - - 2 1 3 16
Turkey - - 6 - 6 - - 3 4 7 13
Ukraine - - 1 - 1 - - 1 2 3 4
Other European countries - 1 2 1 4 - - - 2 2 6
Africa 33 369 1,169 141 1,712 16 45 215 31 307 2,019
Cameroon - - 4 - 4 - - 1 - 1 5
Egypt - - 3 4 7 - - 1 1 2 9
Eritrea 3 33 324 40 400 2 6 51 4 63 463
Ethiopia - - 15 1 16 - - 3 - 3 19
Gambia - 14 56 - 70 - - - - - 70
Ghana - 6 36 1 43 - - - 1 1 44
Guinea - 1 3 - 4 - - - - - 4
Guinea-Bissau - 1 5 - 6 - - - - - 6
Libya - 4 122 59 185 1 - 8 16 25 210
Mali - 2 33 2 37 1 - 1 - 2 39
Morocco - 1 5 2 8 - - - - - 8
Nigeria 2 7 44 2 55 2 3 15 1 21 76
Senegal - 7 28 2 37 - - - - - 37
Somalia 28 293 470 22 813 10 36 134 8 188 1,001
Sudan - - 4 - 4 - - - - - 4
Tunisia - - 7 2 9 - - 1 - 1 10
Other African countries - - 10 4 14 - - - - - 14
America - - 15 4 19 - - 6 1 7 26
Brazil - - 8 1 9 - - 1 - 1 10
United States of America - - 5 2 7 - - 3 1 4 11
Other American countries - - 2 1 3 - - 2 - 2 5
Asia 20 18 161 48 247 13 5 32 34 84 331
Afghanistan - 1 1 1 3 - - - 1 1 4
Bangladesh - 2 2 - 4 - - - - - 4
China (including Hong Kong) - - 4 4 8 - - 6 11 17 25
Georgia - - 5 2 7 - - 1 1 2 9
India - - 2 2 4 - - - - - 4
Iran, Islamic Republic of - - 2 2 4 - - - 1 1 5
Japan - - 2 - 2 - - 2 1 3 5
Korea, Dem. People's Rep. of - - 1 5 6 - - 1 - 1 7
Pakistan - - 4 1 5 - - - - - 5
Palestine 6 3 21 10 40 3 3 2 6 14 54
Philippines - - - - - - - 2 3 5 5
Syrian Arab Republic 14 12 103 18 147 10 2 10 7 29 176
Thailand - - - - - - - 3 1 4 4
Uzbekistan - - 6 1 7 - - 2 - 2 9
Other Asian countries - - 8 2 10 - - 3 2 5 15
Oceania - - - 1 1 - - 2 1 3 4
Other Oceanic countries - - - 1 1 - - 2 1 3 4
Total 53 388 1,368 197 2,006 29 50 270 82 431 2,437
Total
4.13 Third country nationals found to be illegally present by citizenship, age and sex: 2013
CitizenshipMales Females
80

Citizenship Males Females Total
Europe 147 210 357
EU 120 151 271
Bulgaria 2 2 4
France 9 7 16
Germany 4 17 21
Greece 1 3 4
Italy 27 19 46
Poland 3 1 4
Romania 2 3 5
Sweden 2 2 4
United Kingdom 68 86 154
Other EU countries 2 11 13
Other Europe 27 59 86
Russia 4 32 36
Serbia 8 10 18
Turkey 4 2 6
Ukraine 5 8 13
Other European countries 6 7 13
Africa 55 36 91
Egypt 5 3 8
Libya 25 6 31
Morocco 1 10 11
Nigeria 4 - 4
South Africa 8 8 16
Tunisia 7 7 14
Other African countries 5 2 7
America 77 74 151
Brazil 2 2 4
Canada 28 35 63
United States of America 43 35 78
Other American countries 4 2 6
Asia 21 29 50
China - 6 6
Jordan 3 2 5
Lebanon 8 1 9
Philippines - 4 4
Syria 6 - 6
Thailand - 8 8
Other Asian countries 4 8 12
Oceania 179 167 346
Australia 178 163 341
New Zealand 1 4 5
Stateless 1 - 1
Unspecified 13 10 23
Total 493 526 1,019
Age Males Females Total
0-17 123 110 233
18-34 173 195 368
35+ 197 221 418
Total 493 526 1,019
4.14 Naturalisations and registrations: 2013
81


5. FAMILY FORMATION AND DISSOLUTIONAND DISSOLUTION


5.1 Number and rate of marriages occuring in Malta and Gozo: 2000-2013
Crude marriage rate*
MALTA Malta Gozo MALTA
2000 2,545 2,375 170 509 6.5
2001 2,194 2,058 136 474 5.6
2002 2,240 2,068 172 575 5.7
2003 2,350 2,169 181 803 5.9
2004 2,402 2,210 192 756 6.0
2005 2,374 2,216 158 779 5.9
2006 2,536 2,352 184 859 6.3
2007 2,479 2,326 153 867 6.1
2008 2,482 2,289 193 840 6.1
2009 2,353 2,158 195 832 5.7
2010 2,596 2,356 240 847 6.3
2011 2,562 2,377 185 965 6.2
2012 2,823 2,612 211 1,170 6.7
2013 2,578 2,405 173 1,199 6.1
*The crude marriage rate relates the number of marriages per 1,000 total mid-year population
YearNumber ... of which civil
marriages
85

Year Jan Feb Mar1st
QuarterApr May Jun
2nd Quarter
Jul Aug Sep3rd
QuarterOct Nov Dec
4th Quarter
Total
2000 82 71 124 277 249 461 354 1,064 244 168 276 688 226 97 193 516 2,545
2001 74 78 124 276 164 270 331 765 197 173 268 638 229 100 186 515 2,194
2002 69 72 108 249 199 255 342 796 239 199 252 690 235 101 169 505 2,240
2003 49 74 148 271 165 330 327 822 253 223 272 748 244 100 165 509 2,350
2004 78 63 121 262 194 343 352 889 274 174 293 741 250 98 162 510 2,402
2005 60 52 125 237 216 301 347 864 290 182 307 779 249 94 151 494 2,374
2006 50 61 123 234 231 309 389 929 275 232 321 828 242 108 195 545 2,536
2007 37 60 117 214 187 293 426 906 302 253 322 877 222 107 153 482 2,479
2008 51 52 104 207 161 342 347 850 298 313 310 921 252 91 161 504 2,482
2009 36 57 90 183 159 359 381 899 295 240 287 822 224 75 150 449 2,353
2010 58 56 86 200 175 369 412 956 360 222 312 894 299 90 157 546 2,596
2011 45 57 92 194 162 308 462 932 372 244 303 919 253 125 139 517 2,562
2012 59 56 133 248 186 329 575 1,090 345 297 339 981 218 95 191 504 2,823
2013 52 54 111 217 179 344 479 1,002 304 268 313 885 223 91 160 474 2,578
5.2 Monthly and quarterly incidence of marriages: 2000-2013
86
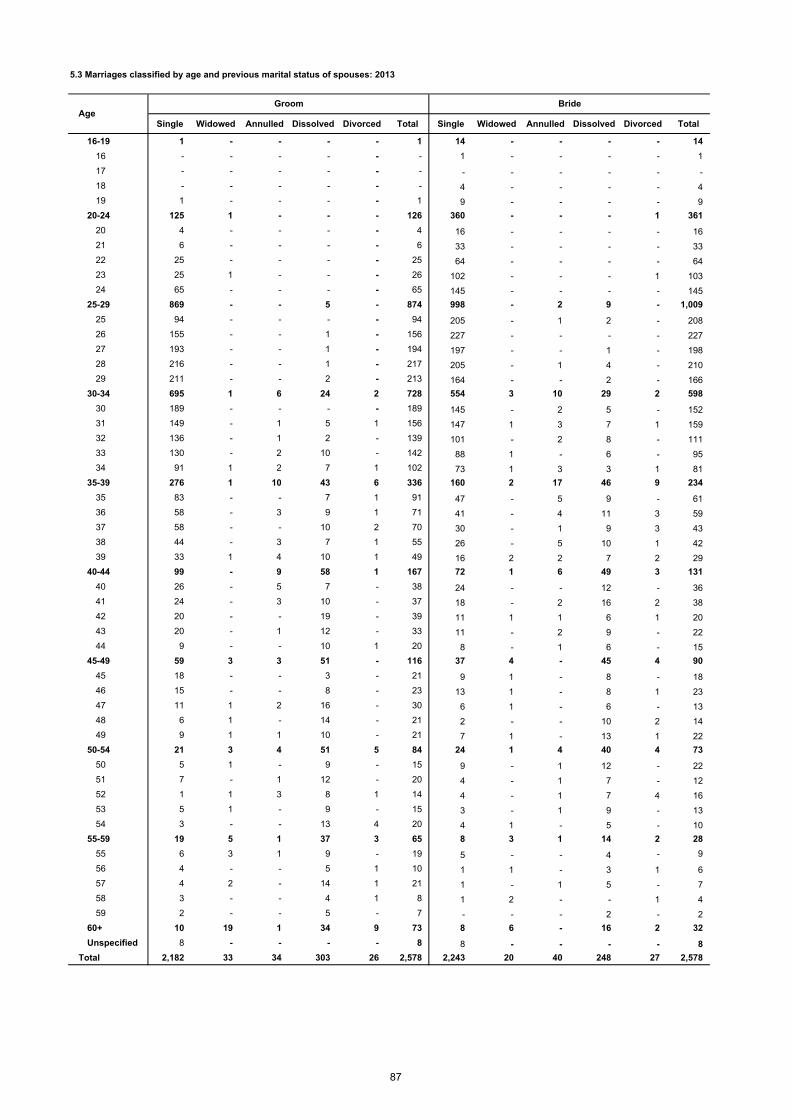
Single Widowed Annulled Dissolved Divorced Total Single Widowed Annulled Dissolved Divorced Total
16-19 1 - - - - 1 14 - - - - 14
16 - - - - - - 1 - - - - 1
17 - - - - - - - - - - - -
18 - - - - - - 4 - - - - 4
19 1 - - - - 1 9 - - - - 9
20-24 125 1 - - - 126 360 - - - 1 361
20 4 - - - - 4 16 - - - - 16
21 6 - - - - 6 33 - - - - 33
22 25 - - - - 25 64 - - - - 64
23 25 1 - - - 26 102 - - - 1 103
24 65 - - - - 65 145 - - - - 145
25-29 869 - - 5 - 874 998 - 2 9 - 1,009
25 94 - - - - 94 205 - 1 2 - 208
26 155 - - 1 - 156 227 - - - - 227
27 193 - - 1 - 194 197 - - 1 - 198
28 216 - - 1 - 217 205 - 1 4 - 210
29 211 - - 2 - 213 164 - - 2 - 166
30-34 695 1 6 24 2 728 554 3 10 29 2 598
30 189 - - - - 189 145 - 2 5 - 152
31 149 - 1 5 1 156 147 1 3 7 1 159
32 136 - 1 2 - 139 101 - 2 8 - 111
33 130 - 2 10 - 142 88 1 - 6 - 95
34 91 1 2 7 1 102 73 1 3 3 1 81
35-39 276 1 10 43 6 336 160 2 17 46 9 234
35 83 - - 7 1 91 47 - 5 9 - 61
36 58 - 3 9 1 71 41 - 4 11 3 59
37 58 - - 10 2 70 30 - 1 9 3 43
38 44 - 3 7 1 55 26 - 5 10 1 42
39 33 1 4 10 1 49 16 2 2 7 2 29
40-44 99 - 9 58 1 167 72 1 6 49 3 131
40 26 - 5 7 - 38 24 - - 12 - 36
41 24 - 3 10 - 37 18 - 2 16 2 38
42 20 - - 19 - 39 11 1 1 6 1 20
43 20 - 1 12 - 33 11 - 2 9 - 22
44 9 - - 10 1 20 8 - 1 6 - 15
45-49 59 3 3 51 - 116 37 4 - 45 4 90
45 18 - - 3 - 21 9 1 - 8 - 18
46 15 - - 8 - 23 13 1 - 8 1 23
47 11 1 2 16 - 30 6 1 - 6 - 13
48 6 1 - 14 - 21 2 - - 10 2 14
49 9 1 1 10 - 21 7 1 - 13 1 22
50-54 21 3 4 51 5 84 24 1 4 40 4 73
50 5 1 - 9 - 15 9 - 1 12 - 22
51 7 - 1 12 - 20 4 - 1 7 - 12
52 1 1 3 8 1 14 4 - 1 7 4 16
53 5 1 - 9 - 15 3 - 1 9 - 13
54 3 - - 13 4 20 4 1 - 5 - 10
55-59 19 5 1 37 3 65 8 3 1 14 2 28
55 6 3 1 9 - 19 5 - - 4 - 9
56 4 - - 5 1 10 1 1 - 3 1 6
57 4 2 - 14 1 21 1 - 1 5 - 7
58 3 - - 4 1 8 1 2 - - 1 4
59 2 - - 5 - 7 - - - 2 - 2
60+ 10 19 1 34 9 73 8 6 - 16 2 32
Unspecified 8 - - - - 8 8 - - - - 8
Total 2,182 33 34 303 26 2,578 2,243 20 40 248 27 2,578
5.3 Marriages classified by age and previous marital status of spouses: 2013
AgeGroom Bride
87

5.4 Marriages by previous marital status of spouses: 2013
Single Widowed Annulled Dissolved Divorced
Single 2,051 7 25 84 15 2,182
Widowed 12 9 - 10 2 33
Annulled 15 1 8 9 1 34
Dissolved 152 1 5 145 - 303
Divorced 13 2 2 - 9 26
Total 2,243 20 40 248 27 2,578
GroomBride
Total
88

5.5 Marriages by age and economic status/occupation of groom: 2013
16-19 20-24 25-29 30-34 35-39 40-44 45-49 50-54 55-59 60-64 65+ Unspecified
Employed - 100 725 526 208 88 55 41 34 5 5 2 1,789
Legislators, senior officials and managers
- 5 56 79 28 20 16 7 10 1 3 - 225
Professionals - 9 175 126 42 13 8 5 8 2 1 - 389
Technicians and associate professionals
- 15 138 91 35 18 9 7 7 1 - - 321
Clerks - 4 37 40 18 5 3 3 - - - - 110
Service workers and shop and market sales workers
- 15 64 42 18 10 8 4 4 - - - 165
Skilled agricultural and fishery workers
- 1 7 3 2 - - 1 - - - - 14
Craft and related trades workers
- 25 123 82 33 15 6 11 2 - 1 - 298
Plant and machine operators and assemblers
- 5 34 17 13 1 2 - - - - 2 74
Elementary occupations - 20 70 40 16 6 2 2 3 1 - - 160
Armed Forces - 1 21 6 3 - 1 1 - - - - 33
Unemployed - 5 10 8 3 4 1 2 2 - - - 35
Inactive 1 2 3 1 - 1 2 - 2 8 20 - 40
Student 1 2 3 - - 1 1 - - - - - 8
Retired - - - - - - 1 - 1 8 20 - 30
Other inactive - - - 1 - - - - 1 - - - 2
Unspecified - 19 136 193 125 74 58 41 27 19 16 6 714
Total 1 126 874 728 336 167 116 84 65 32 41 8 2,578
OccupationAge
Total
89

5.6 Marriages by age and economic status/occupation of bride: 2013
16-19 20-24 25-29 30-34 35-39 40-44 45-49 50-54 55-59 60-64 65+ Unspecified
Employed 6 242 763 350 106 44 29 24 11 1 - 2 1,578
Legislators, senior officials and managers
- 6 41 40 16 9 3 3 1 - - - 119
Professionals - 53 311 114 34 16 8 4 5 - - 1 546
Technicians and associate professionals
3 36 113 61 15 6 5 4 3 - - 1 247
Clerks 2 47 98 55 9 5 4 4 - - - - 224
Service workers and shop and market sales workers
- 80 144 52 18 5 7 7 2 - - - 315
Skilled agricultural and fishery workers
- - 1 - - - - - - - - - 1
Craft and related trades workers
- 11 27 18 5 2 1 - - 1 - - 65
Plant and machine operators and assemblers
- 2 4 3 1 1 - - - - - - 11
Elementary occupations 1 7 24 7 8 - 1 2 - - - - 50
Armed Forces - - - - - - - - - - - - -
Unemployed 2 11 14 10 8 3 - 1 - - - - 49
Inactive 3 45 55 40 25 20 11 12 7 8 3 - 229
Student 2 13 9 1 - 1 - - - - - - 26
Housewife 1 32 46 39 25 19 11 12 6 4 1 - 196
Retired - - - - - - - - 1 4 2 - 7
Unspecified 3 63 177 198 95 64 50 36 10 12 8 6 722
Total 14 361 1,009 598 234 131 90 73 28 21 11 8 2,578
OccupationAge
Total
90

Legislators, senior
officials and managers
ProfessionalsTechnicians
and associate professionals
Clerks
Service workers and
shop and market sales
workers
Skilled agricultural and fishery
workers
Craft and related trades
workers
Plant and machine
operators and assemblers
Elementary occupations
Armed Forces
Student RetiredOther
inactive
Employed 175 356 274 95 129 10 230 56 127 27 20 6 11 1 61 1,578
Legislators, senior officials and managers
29 26 22 9 5 2 8 2 5 1 - 1 1 - 8 119
Professionals 65 221 83 29 29 2 47 13 23 5 2 2 2 - 23 546
Technicians and associate professionals
36 42 55 11 27 - 37 10 14 3 5 2 1 - 4 247
Clerks 18 30 52 20 12 1 42 9 18 6 3 1 1 - 11 224
Service workers and shop and market sales workers
23 34 47 17 46 5 60 14 36 9 7 - 5 1 11 315
Skilled agricultural and fishery workers
- - - - - - - - 1 - - - - - - 1
Craft and related trades workers 2 1 9 6 5 - 25 3 13 - - - - - 1 65
Plant and machine operators and assemblers
1 - 1 1 1 - 2 2 1 - 1 - - - 1 11
Elementary occupations 1 2 5 2 4 - 9 3 16 3 2 - 1 - 2 50
Armed Forces - - - - - - - - - - - - - - - -
Unemployed 4 5 9 3 3 - 11 4 4 1 4 - - - 1 49
Inactive 29 16 27 8 25 4 46 12 24 5 11 2 17 1 2 229
Student - 2 4 3 4 1 6 - 1 1 3 1 - - - 26
Housewife 29 13 23 5 21 3 40 12 22 4 8 1 12 1 2 196
Retired - 1 - - - - - - 1 - - - 5 - - 7
Unspecified 17 12 11 4 8 - 11 2 5 - - - 2 - 650 722
Total grooms 225 389 321 110 165 14 298 74 160 33 35 8 30 2 714 2,578
5.7 Marriages by economic status/occupation of spouses: 2013
Bride's economic status/occupation
Groom's economic status/occupation
Employed
Unemployed
Inactive
UnspecifiedTotal
brides
91

16-19 20-24 25-29 30-34 35-39 40-44 45-49 50-54 55-59 60-64 65+ Unspecified
16-19 - 9 2 - - - - - - - - - 11
20-24 - 58 179 57 15 5 1 - - - - - 315
25-29 - 36 505 315 71 18 4 - 1 - - - 950
30-34 - 6 106 254 136 43 9 8 2 2 1 1 568
35-39 - 2 9 48 77 35 23 12 8 - 2 - 216
40-44 - 1 2 10 14 40 28 14 9 4 2 - 124
45-49 - - - 3 - 11 32 23 10 4 4 - 87
50-54 - - - 1 3 4 9 20 19 8 7 - 71
55-59 - - - - - 1 1 2 10 7 5 - 26
60-64 - - - - - - 2 1 1 3 11 - 18
65+ - - - - - - - - 1 2 8 - 11
Unspecified - 1 - - - - - - - - - 7 8
Total - 113 803 688 316 157 109 80 61 30 40 8 2,405
16-19 1 1 - - 1 - - - - - - - 3
20-24 - 10 25 9 2 - - - - - - - 46
25-29 - 1 37 15 4 1 - 1 - - - - 59
30-34 - 1 7 11 7 3 1 - - - - - 30
35-39 - - 1 5 5 6 1 - - - - - 18
40-44 - - 1 - 1 - 2 1 1 1 - - 7
45-49 - - - - - - 1 1 1 - - - 3
50-54 - - - - - - 1 - - - 1 - 2
55-59 - - - - - - 1 - 1 - - - 2
60-64 - - - - - - - 1 1 1 - - 3
65+ - - - - - - - - - - - - -
Unspecified - - - - - - - - - - - - -
Total 1 13 71 40 20 10 7 4 4 2 1 - 173
16-19 1 10 2 - 1 - - - - - - - 14
20-24 - 68 204 66 17 5 1 - - - - - 361
25-29 - 37 542 330 75 19 4 1 1 - - - 1,009
30-34 - 7 113 265 143 46 10 8 2 2 1 1 598
35-39 - 2 10 53 82 41 24 12 8 - 2 - 234
40-44 - 1 3 10 15 40 30 15 10 5 2 - 131
45-49 - - - 3 - 11 33 24 11 4 4 - 90
50-54 - - - 1 3 4 10 20 19 8 8 - 73
55-59 - - - - - 1 2 2 11 7 5 - 28
60-64 - - - - - - 2 2 2 4 11 - 21
65+ - - - - - - - - 1 2 8 - 11
Unspecified - 1 - - - - - - - - - 7 8
Total 1 126 874 728 336 167 116 84 65 32 41 8 2,578
Total
Total
Malta
Gozo
5.8 Marriages by region and age of spouses: 2013
Age of bride
Age of groom
92

Groom Bride Groom Bride Groom Bride Groom Bride Groom Bride
16-19 - 9 - - - 1 - 2 - -
20-24 102 291 6 25 2 13 2 11 3 4
25-29 677 759 90 105 41 74 12 23 10 7
30-34 490 334 95 103 86 85 9 27 8 9
35-39 186 104 66 43 47 48 6 8 6 9
40-44 76 53 46 31 29 25 - 10 3 4
45-49 32 24 36 30 28 17 2 1 8 6
50-54 37 20 25 25 14 12 - 5 5 6
55-59 29 17 17 6 10 4 - - 3 -
60-64 11 6 7 7 5 2 1 2 4 1
65+ 20 3 11 4 8 1 - - - 1
Unspecified 4 3 - - - - - - - -
Total 1,664 1,623 399 379 270 282 32 89 50 47
Groom Bride Groom Bride Groom Bride Groom Bride Groom Bride
16-19 - - - - - - 1 2 1 14
20-24 2 - 1 3 - - 8 14 126 361
25-29 4 3 11 8 2 5 27 25 874 1,009
30-34 7 3 7 13 1 6 25 18 728 598
35-39 4 2 - 6 8 5 13 9 336 234
40-44 1 - - 2 4 1 8 5 167 131
45-49 - 1 - 1 - 2 10 8 116 90
50-54 - 2 - 2 - - 3 1 84 73
55-59 - - - - - - 6 1 65 28
60-64 1 - - - 1 1 2 2 32 21
65+ - - - - - - 2 2 41 11
Unspecified - - - - - - 4 5 8 8
Total 19 11 19 35 16 20 109 92 2,578 2,578
Malta
Africa
5.9 Spouses by country of citizenship and age: 2013
AgeUK Other EU Member State Other European country America
AgeAsia Oceania Unspecified Total
93

5.10 Spouses previously residing in Malta by previous marital status and district: 2013
Groom Bride Groom Bride Groom Bride Groom Bride Groom Bride Groom Bride
MALTA 1,623 1,628 18 15 34 39 133 106 23 21 1,831 1,809
Malta 1,503 1,494 16 14 29 33 129 101 23 20 1,700 1,662
Southern Harbour 317 287 5 5 3 5 15 12 3 3 343 312
Northern Harbour 481 478 4 5 9 10 44 34 7 6 545 533
South Eastern 229 240 2 2 7 7 14 17 2 4 254 270
Western 216 223 3 - 3 7 19 9 4 4 245 243
Northern 260 266 2 2 7 4 37 29 7 3 313 304
Gozo and Comino 120 134 2 1 5 6 4 5 - 1 131 147
Dissolved Divorced TotalResident district before marriage
Single Widowed Annulled
94

5.11 Spouses previously residing abroad by previous marital status and country of residence: 2013
Groom Bride Groom Bride Groom Bride Groom Bride Groom Bride Groom Bride
United Kingdom 295 311 12 3 - - 92 77 2 5 401 396
Other EU Member States 154 175 2 1 - - 48 32 1 1 205 209
Other European countries 14 12 - - - - 3 8 - - 17 20
America 23 26 1 1 - - 22 20 - - 46 47
Africa 4 7 - - - 1 - - - - 4 8
Asia 10 25 - - - - 2 - - - 12 25
Oceania 21 22 - - - - 3 5 - - 24 27
Unspecified 38 37 - - - - - - - - 38 37
Total 559 615 15 5 - 1 170 142 3 6 747 769
Dissolved Divorced TotalResident country before marriage
Single Widowed Annulled
95

5.12 Spouses previously residing in Malta by citizenship and resident district before marriage: 2013
Groom Bride Groom Bride Groom Bride Groom Bride Groom Bride
MALTA 1,623 1,563 25 16 61 70 16 65 6 5
Malta 1,502 1,420 25 16 61 70 16 65 6 5
Southern Harbour 322 289 2 1 2 5 2 6 1 2
Northern Harbour 451 425 11 7 33 36 8 29 2 2
South Eastern 231 236 3 3 6 10 1 8 - -
Western 229 229 1 1 6 3 1 2 - -
Northern 269 241 8 4 14 16 4 20 3 1
Gozo and Comino 121 143 - - - - - - - -
Groom Bride Groom Bride Groom Bride Groom Bride Groom Bride
MALTA 19 9 13 28 2 3 66 50 1,831 1,809
Malta 19 9 12 28 2 3 57 46 1,700 1,662
Southern Harbour 4 2 3 5 1 - 6 2 343 312
Northern Harbour 7 - 6 14 1 2 26 18 545 533
South Eastern 2 1 1 2 - - 10 10 254 270
Western 2 1 2 3 - 1 4 3 245 243
Northern 4 5 - 4 - - 11 13 313 304
Gozo and Comino - - 1 - - - 9 4 131 147
America
Africa
MaltaResident district before marriage
United Kingdom Other EU Member States Other European countries
Resident district before marriage
Asia Oceania Unspecified Total
96

5.13 Spouses previously residing abroad by citizenship and previous country of residence: 2013
Groom Bride Groom Bride Groom Bride Groom Bride Groom Bride
United Kingdom 11 26 363 352 12 14 - 1 2 -
Other EU Member States 2 4 6 4 190 193 - 3 3 3
Other European countries - - - - 1 1 15 18 - -
America 3 4 1 1 1 1 - - 38 39
Africa 2 2 - - - - - 1 - -
Asia 1 1 2 4 3 1 1 1 - -
Oceania 2 5 2 2 2 2 - - 1 -
Unspecified 20 18 - - - - - - - -
Total 41 60 374 363 209 212 16 24 44 42
Groom Bride Groom Bride Groom Bride Groom Bride Groom Bride
United Kingdom - - - 1 2 - 11 2 401 396
Other EU Member States - - 1 1 - - 3 1 205 209
Other European countries - - - - - - 1 1 17 20
America - 1 - - - - 3 1 46 47
Africa - 1 - - - - 2 4 4 8
Asia - - 5 5 - - - 13 12 25
Oceania - - - - 12 17 5 1 24 27
Unspecified - - - - - - 18 19 38 37
Total - 2 6 7 14 17 43 42 747 769
America
TotalCountry of residence before marriage
Asia Oceania
Country of residence before marriage
Other European countriesMalta United Kingdom Other EU Member States
Africa Unspecified
97

MaltaUnited
Kingdom
Other EU Member
States
Other European countries
America Africa Asia Oceania Unspecified
Malta 1,450 22 34 6 7 16 9 1 78 1,623
United Kingdom 15 350 12 - 2 - - - - 379
Other EU Member States 42 15 207 4 2 2 3 2 5 282
Other European countries 46 8 14 19 - 1 - - 1 89
America 4 1 1 2 38 - - 1 - 47
Africa 8 - - 1 1 - - - 1 11
Asia 26 1 1 - - - 7 - - 35
Oceania 3 2 1 - - - - 12 2 20
Unspecified 70 - - - - - - - 22 92
Total 1,664 399 270 32 50 19 19 16 109 2,578
5.14 Total marriages classified by citizenship of spouses: 2013
Citizenship of bride
Citizenship of groom
Total
98

5.15 Civil marriages by age and citizenship of spouses: 2013
16-19 20-24 25-29 30-34 35-39 40-44 45-49 50-54 55-59 60-64 65+ Unspecified
Malta - 26 61 87 75 56 25 34 27 9 17 4 421
United Kingdom - 4 74 77 61 43 35 25 15 7 10 - 351
Other EU Member States - 2 26 53 34 25 26 14 8 5 7 - 200
Other European countries - 2 12 9 6 - 1 - - 1 - - 31
America - 3 9 6 5 3 8 5 3 4 - - 46
Africa - 2 4 6 3 1 - - - 1 - - 17
Asia - 1 11 7 - - - - - - - - 19
Oceania - - 1 - 7 4 - - - 1 - - 13
Unspecified 1 8 25 24 12 6 8 3 6 2 2 4 101
Total 1 48 223 269 203 138 103 81 59 30 36 8 1,199
16-19 20-24 25-29 30-34 35-39 40-44 45-49 50-54 55-59 60-64 65+ Unspecified
Malta 4 36 80 85 48 41 16 16 13 4 3 3 349
United Kingdom - 22 92 85 42 31 28 25 6 6 4 - 341
Other EU Member States 1 13 53 63 38 24 17 9 4 2 1 - 225
Other European countries 1 11 21 27 8 10 1 5 - 2 - - 86
America - 4 7 8 9 4 6 6 - 1 1 - 46
Africa - - 3 3 2 - 1 2 - - - - 11
Asia - 3 8 12 6 2 1 2 - - - - 34
Oceania - - 4 4 5 1 2 - - 1 - - 17
Unspecified 2 14 24 17 9 5 8 1 1 2 2 5 90
Total 8 103 292 304 167 118 80 66 24 18 11 8 1,199
Citizenship of groom
Citizenship of bride
AgeTotal
AgeTotal
99

MaltaUnited
Kingdom
Other EU Member States
Other European countries
America Africa Asia Oceania Unspecified
Malta 224 6 15 5 5 15 9 - 70 349
United Kingdom 11 321 8 - 1 - - - - 341
Other EU Member States 35 12 161 4 1 2 3 2 5 225
Other European countries 44 8 14 19 - - - - 1 86
America 3 1 1 2 38 - - 1 - 46
Africa 8 - - 1 1 - - - 1 11
Asia 26 1 - - - - 7 - - 34
Oceania 2 2 1 - - - - 10 2 17
Unspecified 68 - - - - - - - 22 90
Total 421 351 200 31 46 17 19 13 101 1,199
5.16 Civil marriages by citizenship of spouses: 2013
Citizenship of bride
Citizenship of groom
Total
100

5.17 Civil marriages by previous marital status of spouses: 2013
Single Widowed Annulled Dissolved Divorced
Single 718 5 14 79 15 831
Widowed 10 5 - 10 2 27
Annulled 7 1 8 9 1 26
Dissolved 140 1 5 144 - 290
Divorced 13 2 1 - 9 25
Total 888 14 28 242 27 1,199
GroomBride
Total
5.18 Registered separations by citizenship of spouses: 2013
Maltese Foreign
Maltese 600 32 632
Foreign 29 5 34
Total 629 37 666
Citizenshipof wife
Citizenship of husbandTotal
5.19 Registered divorces recognised by Maltese Authorities by country from where divorce was obtained: 2013
Country Number
Malta 338
United Kingdom 34
Other EU countries 6
Other European countries 4
Other countries 17
Total 399
101

Duration of marriage (years) Religious Civil Total
Less than 5 - 12 12
5-9 10 14 24
10-19 21 19 40
20+ 8 6 14
Total 39 51 90
5.21 Registered annulments by duration of previous marriage and type of annulment: 2013
Duration of marriage (years) Number
Less than 5 12
5-9 56
10-19 154
20+ 176
Unspecified 1
Total 399
5.20 Registered divorces recognised by Maltese Authorities by duration of previous marriage: 2013
102

6. METHODOLOGICALNOTES


Methodological Notes GENERAL DEFINITIONS Usual residence: refers to the place where a person normally spends the daily period of rest, regardless of temporary absences for purposes of recreation, holidays, visits to friends and relatives, business, medical treatment or religious pilgrimage. This definition is line with the European Regulation (EC) No. 1260/2013. The following persons alone shall be considered to be usual residents of a specific geographical area:
those who have lived in their place of usual residence for a continuous period of at least 12
months before the reference time; or
those who arrived in their place of usual residence during the 12 months before the reference time with the intention of staying there for at least one year.
Usually resident population: refers to all persons who have their usual residence in a Member State at the reference time. Unless otherwise stated, all figures in this publication refer to this reference population.
GENERAL NOTE
Population figures were revised following the results of the Census of Population and Housing 2011, and are in accordance with the ‘usual residence’ definition.
SECTION 1: POPULATION
All population components are based on definitions provided for in the European Regulation (EU) No. 1260/2013 on European demographic statistics.
Total Population: includes both Maltese and foreign residents. The total population at the end of year t, is computed using the following equation:
Pt = Pt-1 + Bt - Dt + It – Et , where:
Pt is the total resident population at the end of year t,
Pt-1 is the total resident population at the end of year t-1,
Bt is the total number of births born to mothers resident in Malta registered during year t,
Dt is the total number of deaths of persons resident in Malta registered during year t,
It is the total immigration of both Maltese and foreign nationals registered during year t who immigrated with the intention to live in Malta for a period of at least 12 months.
Et is the total emigration of both Maltese and foreign nationals resident in Malta registered during year t who leave the country for a period of at least 12 months.
Maltese Population: includes Maltese residents only. The Maltese population at the end of year t is computed using the following equation:
P’t = P’t-1 + B’t – D’t + I’t – E’t , where:
P’t is the Maltese resident population at the end of year t,
P’t-1 is the Maltese resident population at the end of year t-1,
B’t is the number of Maltese births born to mothers resident in Malta registered during year t,
D’t is the number of deaths occurring to Maltese citizens resident in Malta during year t,
It is the total immigration of Maltese nationals registered during year t who immigrated with the intention to live in Malta for a period of at least 12 months.
Et is the total emigration of Maltese nationals during year t who leave the country for a period of at least 12 months.
105

Maltese and Total mid-year Population: these are calculated by averaging beginning and end-year population estimates.
Population Projections: EUROPOP (EUROpean POPulation projections) are a series of population projections released by Eurostat, the Statistical Office of the European Communities. The latest set of European Population projections refer to the base year 2013, thus short named as EUROPOP2013. EUROPOP2013 is a 'Convergence Trends' scenario that includes short-term (nowcasting), medium-term (trend) and long-term (convergence) components.
Computations are based on a cohort-component method with 1 January 2013 as the base population, disaggregated by sex and age. Data on population, live births and deaths used as input data in the EUROPOP2013 round are official statistics provided by the national statistical authorities to Eurostat in the frame of annual demographic data collection. Migration flows have been measured in terms of net migration (including statistical adjustment) and computed as residual from the annual demographic balance.
As was the case with the previous EUROPOP2010, the convergence year was set to 2150. The ‘main input dataset’, which defines the frame of the main scenario for producing population projections, includes:
2013 base-population;
assumptions for fertility, mortality and international net migration (including statistical adjustment).
a. Fertility
The transition starts in 2020 and the model for convergence is linear interpolation between fertility rates in the last observed year and the rates of the ultimate distribution. A constraint on the total fertility rate is set to 1.928.
b. Mortality
The convergence model is an exponential interpolation between mortality rates in the last observed year and the rates of the ultimate distribution.
c. Total net migration flows
These are based on the convergence assumption and are computed on the logic adopted in the previous population projections, EUROPOP2010. The convergence model assumes net migration to converge to zero in the convergence year. Intermediate values for the total net migration are obtained by means of a double linear interpolation between net migration levels in the last observed year and zero in the convergence year, the intermediate point being obtained as an average of the last 10 years. In case a country has a negative intermediate point, the convergence is brought forward to 2035 in order to avoid negative net migration for a very long period.
More information on EUROPOP2013 may be obtained from:
http://ec.europa.eu/eurostat/data/database
Data Navigation Tree
Database by themes
Population and social conditions Population projections
EUROPOP2013 - Population projections at national level
Tables by themes Population and social conditions
Population Population projections
106

SECTION 2: BIRTHS
Total live births: includes all babies born and registered with the Public Authorities in Malta. Still births are excluded. Crude birth rate: the number of total live births per thousand mid-year population. Live births resident in Malta: includes all babies whose parent(s) is(are) resident in Malta at the time of birth. Therefore the definition excludes babies born to mothers who are resident abroad. Maltese live births: includes all babies born and registered with the Public Authorities in Malta, having a Maltese father or mother if they are born in wedlock, and having a Maltese mother if outside wedlock. Maltese crude birth rate: the number of Maltese live births per thousand mid-year Maltese population. Total fertility rate: the number of children that would be born to a woman if she were to live to the end of her child-bearing years, and bear children in accordance with current age-specific fertility rates. Live-birth order: the numerical order of the live birth being recorded, in relation to all previous live babies born to the mother. In the case of multiple issue, each live-born is counted separately. Maternities: includes both still and live births. Multiple births are counted as one maternity.
SECTION 3: DEATHS Total deaths: includes all registered deaths of Maltese and foreign nationals resident in Malta and Gozo. This definition excludes tourists, but includes Maltese residents who die abroad. Total deaths exclude still births. Crude death rate: the total number of deaths per thousand mid-year total population. Maltese deaths: includes all registered deaths of Maltese nationals resident in Malta and Gozo. This definition includes Maltese residents who die abroad. Maltese deaths exclude still births. Maltese crude death rate: the number of Maltese deaths per thousand mid-year Maltese population. Still births: deaths occurring to babies prior to complete expulsion or extraction from the mother, and having a gestational age of more than 22 weeks. Neonatal deaths: deaths occurring within the first 28 days after birth. Infant deaths: deaths occurring during the first year of life. Infant mortality rate: the number of infant deaths per thousand life births. Life expectancy at birth: the number of years a newborn is expected to live if mortality in the various age groups remains at the level of the period in which the expectation of life is computed. SECTION 4: MIGRATION This domain comprises the compilation of statistics on international migration, as stipulated by Article 3 of the European Regulation (EC) 862/2007. The NSO carries out such work both by using own sources and in collaboration with government entities that provide access to administrative records. This is shown in Table M1:
107

Table M1. Sources of migration statistics
Entity Data flows Data records
National Statistics Office (NSO) Immigration
of Maltese Nationals 1
Decennial Census of Population and Housing
Ongoing Labour Force Survey: LFS
Emigration of
Maltese Nationals 2
Ongoing frontier survey: TOURSTAT
Employment and Training Corporation (ETC)
Migration flows
of European Union
Nationals 3
Employment engagement and termination forms
Office of the Refugee Commissioner Migration
flows of
Third-Country Nationals 4
Asylum records: REFCOM database
Third-Country Nationals Unit Resettlements and repatriations
Citizenship and Expatriates Affairs
Residence permits database
1 Calculations are based on the most recent Census of Population and Housing using the
information on the country of residence one year prior to the Census. By using the same question in LFS, the change between the Census reference year and the LFS reference period is observed
2 Calculations are based on information collected by TOURSTAT on Maltese nationals travelling from Malta, basing on the past three years. Duration of trips is analysed and the average number of persons whose intention is to stay abroad for 12 months or over is calculated
3 Calculations in respect of immigration of EU Nationals are based on information provided by ETC’s engagement forms. This information is linked to termination of employment data in order to remove persons who have not been employed for at least one year. A check is then made with the I.D Card database to remove persons who were registered in Malta prior to the reference year
Calculations in respect of emigration of EU Nationals are based on termination of employment data. Persons who terminated their job and have not been re-employed are considered as emigrants
Calculations in respect of immigration and emigration of EU Nationals’ dependants are based on extractions from the most recent edition of the Census of Population and Housing
4 Migration of Third-Country Nationals (TCNs) draws on two types of records: Asylum Records and Residence Permits
Asylum Records:
REFCOM is used to extract information on persons, covered by a first-instance decision, who have been granted refugee status, subsidiary protection status or temporary protection status. Emigration of TCNs includes re-settled persons who, following a re-settlement request from UNHCR which is based on such persons’ need for international protection, are transferred to a Member State where they are permitted to reside
Residence Permits:
Calculations of immigration of TCNs are based on residence permits that have a duration of at least one year. These are linked with the I.D Card database and ETC records to remove persons who were registered in Malta prior to the reference year. Calculations of emigration of TCNs take into consideration persons whose residence permit has not been extended, and who have had a viable permit for more than one year
108

Immigration: the action by which a natural person establishes his or her usual residence in a territory of a State for a period that is, or is expected to last, a minimum of 12 months. This figure is measured by summing up the count of all new employment engagement forms and residence permit holders, their dependants, asylum seekers under protection, returned migrants and new adoptions of children from foreign countries. Emigration: the action by which a natural person leaves his or her usual residence in the territory of the Member State for a period that is, or is expected to last, a minimum of 12 months. This figure is measured by summing up the counts of all employment termination forms which ended during the reference year; residence permit holders who fail to extend their permits during the reference year, together with their dependants; resettled or repatriated asylum seekers who were previously given protection and other Maltese emigrants (i.e. persons who leave the country for a period of at least 12 months). Asylum applicant: a person who submits an application for international protection to the Office of the Refugee Commissioner. Application for asylum: the application made by a third-country national or stateless person, which can be understood as a request for international protection from a Member State under the Geneva Convention. Any application for international protection is presumed to be an application for asylum (including requests for refugee status or for subsidiary protection status) unless a third-country national or a stateless person explicitly requests another kind of protection that can be applied for separately. An application for asylum is deemed to have been lodged once a form is submitted by the applicant for asylum, or an authoritative report is received by the competent authorities. Refugee: a third-country national who, owing to a well-founded fear of persecution for reasons of race, religion, nationality, political opinion or membership of a particular social group, is outside the country of nationality and is unable or, owing to such fear, is unwilling to avail him/herself of the protection of that country. A refugee can also be a stateless person who, being outside the country of former habitual residence for the reasons mentioned above, is unable or, owing to such fear, unwilling to return to that country (Directive 2004/83/EC, Art.2 (d)). Third-country national: also know as stateless person. Such a person is granted the Geneva Convention status (also referred to as refugee status) if, owing to a well-founded fear of prosecution for reasons of race, religion, nationality, political opinion or membership of a particular social group, is outside the country of nationality and is unable or, owing to such fear, is unwilling to avail him/herself of the protection of that country. A third-country nationals refers to a Non-EU citizen.
Person eligible for subsidiary protection: a third-country national or stateless person who does not qualify as a refugee but in respect of whom substantial grounds have been shown for believing that the person concerned, if returned to the country of former habitual residence, would face a real risk of suffering serious harm or, owing to such risk, is unable to avail him/herself of the protection of that country. Person granted authorisation to stay for humanitarian reasons: a person who is not considered to be eligible for international protection, but who is nonetheless protected against removal. In such cases a decision is taken which grants the person concerned authorisation to stay from humanitarian reasons. Rejected applicant: a person in respect of whom a decision is taken by the responsible national authority to reject an application for international protection. Unaccompanied minors: third-country nationals or stateless persons below the age of 18, who arrive in the territory of the State unaccompanied by an adult responsible for them, whether such responsibility is in terms of law or custom, and for as long as they are not effectively taken into the care of such an adult. The definition includes minors who are left unaccompanied following their entrance into the territory of the State (Directive 2004/83/EC, Art.2(i)). Third-country nationals found to be illegally present: persons who are officially found to be in the territory of the State and who do not fulfil, or no longer fulfil, the conditions for stay or residence in the State. Registration: the action by which foreign residents register themselves as Maltese citizens at the Citizenship and Expatriate Affairs Department. Registered persons are included in the Maltese population count. Naturalisation: the action by which a foreigner may be granted Maltese citizenship according to the Maltese Citizenship Act.
109

SECTION 5: FAMILY FORMATION AND DISSOLUTION Total marriages: marriages registered in Malta and Gozo, including marriages between non-resident foreign spouses. Crude marriage rate: the number of marriages per thousand mid-year total population. Civil marriages: non-religious marriages that are recognised by law in Malta. Separations: information extracted from records held at the Public Registry in Malta and Gozo. This includes separations that involve Maltese and/or foreign spouses and which have been concluded by a legal contract. Annulments: includes annulments of religious and civil marriages between Maltese and/or foreign spouses, extracted from records held at the Public Registry in Malta and Gozo. Divorces obtained in Malta: includes divorces that involve both Maltese and foreign spouses. Divorce registration was introduced in Malta at the end of 2011 (Civil Code Amendment Act 2011 (Act XIV of 2011)). Divorces obtained abroad: includes divorces that involve both Maltese and foreign spouses. The definition is inclusive of divorces that were accepted by the Laws of Malta in terms of Section 33 of the Marriage Act (1975), for which records are held at the Public Registry in Malta and Gozo. CLASSIFICATIONS
Local Administrative Units For aggregation purposes, all localities are grouped in six districts, in line with the Local Administrative Unit classification (LAU):
Southern Harbour Valletta, Senglea, Cospicua, Ħaż-Żabbar, Fgura, Floriana, Kalkara, Ħal Luqa, Marsa, Paola, Santa Luċija, Ħal Tarxien, Xgħajra
Northern Harbour Ħal Qormi, Birkirkara, Gżira, Ħamrun, Msida, Pembroke, Tal-Pietà, St Julian's, San Ġwann, Santa Venera, Tas-Sliema, Swieqi, Ta' Xbiex
South Eastern Żejtun, Birżebbuġa, Gudja, Ħal Għaxaq, Ħal Kirkop, Marsaskala, Marsaxlokk, Mqabba, Qrendi, Ħal Safi, Żurrieq
Western Mdina, Ħaż-Żebbuġ, Siġġiewi, Ħ'Attard, Ħal Balzan, Ħad-Dingli, Iklin, Ħal Lija, Rabat, Mtarfa
Northern Ħal Għargħur, Mellieħa, Mġarr, Mosta, Naxxar, St Paul's Bay
Gozo and Comino Victoria, Fontana, Għajnsielem and Comino, Għarb, Għasri, Ta' Kerċem, Munxar, Nadur, Qala, San Lawrenz, Ta' Sannat, Xagħra, Xewkija, Żebbuġ
International Standard Classification of Occupations (ISCO) An internationally harmonised classification used for coding occupations. International Classification of Diseases (ICD) An internationally harmonised classification used for coding causes of death.
110

SOURCES The source for births, marriages, marital separations, annulments and divorces is the Public Registry in Malta and Gozo. Sources for maternities are the Public Registry and the Directorate for Health Information and Research (DHIR). The source for deaths is the Directorate for Health Information and Research (DHIR). In addition to the information given in Table M1, the Agency for the Welfare of Asylum Seekers (AWAS) and the Immigration Section of the Police General Headquarters provides statistics on migration.
111