title slide option - snl · executive vice president, chief financial officer & chief operating...
TRANSCRIPT
Financial Management
Frank Hall EVP, Chief Financial Officer and Chief Operating Officer
Investor Day August 15, 2012

2
Overview
Operating results are discussed absent the impact of acquired loan discounts, accounting valuation changes and FDIC indemnification payments and indemnification asset changes
Presentations are organized to provide Overview of the strategy, background and relative context Revenue growth opportunities Expense savings or efficiency opportunities

3
Overview
Environmental observations Net interest income Noninterest income Noninterest expense Credit Capital
Efficiency Initiative
Financial Reporting and Management
4
Net Interest Income
Challenging environment
Net interest income – earning assets Loan portfolio environmental challenges
Competitive pricing pressure Frequency of prepayments and refinancing
Good news – chance to bid for new business Bad news – faster re-pricing of assets even if we retain the business
Investment portfolio challenges Reinvestment rates are low Asset class differentiation is not reflected in relative yield
Focus needs to be on growth – now more than ever!

5
Net Interest Income
Net interest income – liabilities
Industry loan to deposit ratio at all-time lows
Pricing of deposit liabilities is one remaining margin lever
6
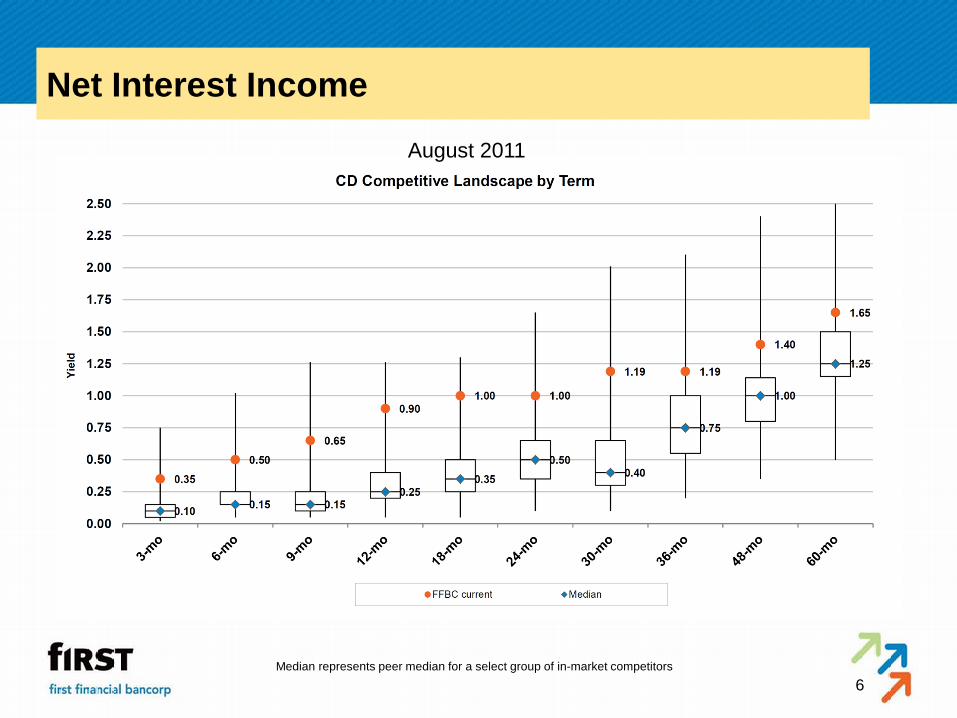
Net Interest Income
August 2011
Median represents peer median for a select group of in-market competitors

7
Net Interest Income
July 2012
Median represents peer median for a select group of in-market competitors

8
Noninterest Income
Fee revenue is largely in a competitive-based pricing range
Dependent on overall growth of core business
Wealth management presents most significant “stand-alone” opportunity
Always mindful of new opportunities
9
Noninterest Expense
Near-term impact of branch acquisitions and openings
Evaluation of where investments are made
New technology
Efficiency initiative
10
Credit
Still subject to volatility
Cautious outlook
Not sure what “normal” looks like in the future

11
Capital
Remain very well capitalized
Preliminary analysis under conservative Basel III estimates are strong
Sufficient capital for meaningful growth

12
Efficiency Initiative
Utilizing area-specific KPIs and peer performance data to identify areas for opportunity
Sales production comparisons
Operating efficiency comparisons
Deadline
Targeting strategic, operating expense reduction of 5% or more
Operating efficiency ratio target remains between 55% to 60% - currently in the mid-60%
Timing may be up to 24 months to fully recognize some savings due to contractual or long-term implementation issues
More specifics will be shared in the third quarter earnings release
13
Financial Reporting and Management
Dedicated and integrated with business units and support areas
Financial tools
Business unit reporting – monthly
Pricing models – integrated with lender incentives and credit quality
Profitability model & capacity utilization reporting
Aids in staffing for branches and operations areas
Driver based planning
KPI based accountability

14
Management Reporting Evolution
14
Implemented funds transfer pricing
ALM model
2005
2006
Launched client derivative product
Commercial loan pricing model
Profitability based Commercial incentive
Introduced management reporting
Established 5 year planning
Streamlined budget process
Acquisition integration
Product profitability to support Compass
Dedicated staff for LOBs
Profitability initiative
Activity based costing
Capacity utilization analysis
Enhanced management reporting
Client profitability
Perfect Bank
New planning and reporting system
Focus on results
KPIs
Driver based planning
2007-2009
2010-2011
Current Continual evolution to enhance analytics and drive business performance
15
Financial Reporting and Management
Business accountability for operating plans
Risks and opportunities
Monthly results meetings with CEO and CFO
KPI scorecards
Measurable indicators of business performance
Targets established to drive top quartile performance
Compare to public peers and industry data (10Qs, H8, etc.)
16
Financial Reporting and Management
Driver-based forecast
Transparency of future business performance
Continual analysis to identify risks and opportunities
Promotes idea generation
Provides connectivity of resource utilization across departments
Simplifies root cause analysis and course correction dialogue

17
Financial Reporting and Management
•Business strategy execution•Sales focus•Performance at KPI targets
Business Execution /
Results
•Corporate / business priorities•Project updates / management•Business accountability for operating plans•Course correction opportunities
Decisioning
•Driver based planning•Risks/opportunities•Profitability analytics
Analysis
•KPIs / peer benchmarking•Management reporting•Client / portfolio segmentation•Report design, automation and controls
Reporting
•Data and system infrastructure•Data mining•Activity based costing
Information
•Centralized data repository•Archive management and database
structuring•Data dictionary by leveraging a user group
Data Management
Strong foundational support
Integral elements for performance measurement
Focus on results Continual analysis of
business performance to identify risks and
opportunities
IT leadership for centralized data management
Process based activities managed within Information Management team
Dedicated financial analysts for all businesses
Senior finance leadership; cross functional connectivity

18
Biography
J. Franklin Hall Executive Vice President, Chief Financial Officer & Chief Operating Officer Mr. Hall joined First Financial in 1999 and was appointed to his current position in 2005. Prior to joining the Company, he was with Firstar Bank (currently US Bancorp). He is a Certified Public Accountant (inactive) and began his career with the public accounting firm Ernst & Young, LLP.