title slide - hewlett packard enterprise/media/files/h/hp... · q115 q215 q315 q415 q116 q216 q316...
TRANSCRIPT


Q115 Q215 Q315 Q415 Q116 Q216 Q316
Revenue as Reported (5)% (8)% (5)% (4)% (3)% 1% (7)%
Impact of divestitures 0 pts (0) pts (0) pts (1) pts (0) pts (0) pts (4) pts
Impact of currency (3) pts (6) pts (8) pts (7) pts (6) pts (4) pts (2) pts
Revenue change Y/Y (CC, ex-divest) (2)% (1)% 3% 4% 4% 5% (1)%
Q115 Q215 Q315 Q415 Q116 Q216 Q316
Revenue as Reported (5)% (4)% (1)% (1)% (2)% 4% 1%
Impact of divestitures (0) pts (0) pts (0) pts (1) pts (1) pts (2) pts (2) pts
Impact of currency (1) pts (2) pts (3) pts (3) pts (3) pts (2) pts (1) pts
Revenue change Y/Y (CC, ex-divest) (3)% (2)% 2% 3% 2% 8% 4%
Q115 Q215 Q315 Q415 Q116 Q216 Q316
Revenue as Reported (5)% (4)% (3)% (3)% 0% 6% 4%
Impact of divestitures 0 pts 0 pts 0 pts (1) pts (1) pts (2) pts (2) pts
Revenue change Y/Y (CC, ex-divest) (5)% (4)% (3)% (2)% 1% 8% 6%
Q115 Q215 Q315 Q415 Q116 Q216 Q316
Revenue as Reported (8)% (13)% (9)% (8)% (5)% (3)% (9)%
Impact of divestitures 0 pts 0 pts (0) pts (0) pts (0) pts (1) pts (1) pts
Impact of currency (4) pts (11) pts (14) pts (11) pts (10) pts (4) pts (3) pts
Revenue change Y/Y (CC, ex-divest) (3)% (2)% 4% 3% 5% 2% (6)%
Q115 Q215 Q315 Q415 Q116 Q216 Q316
Revenue as Reported (2)% (4)% (4)% (5)% 1% 2% (21)%
Impact of divestitures (1) pts (2) pts (1) pts 1 pts 1 pts 4 pts (14) pts
Impact of currency (4) pts (6) pts (8) pts (11) pts (8) pts (5) pts (4) pts
Revenue change Y/Y (CC, ex-divest) 2% 4% 5% 5% 8% 4% (3)%
HPE WWY/Y % Y/Y %
HPE AMSY/Y % Y/Y %
HPE APJY/Y % Y/Y %
USY/Y % Y/Y %
HPE EMEAY/Y % Y/Y %
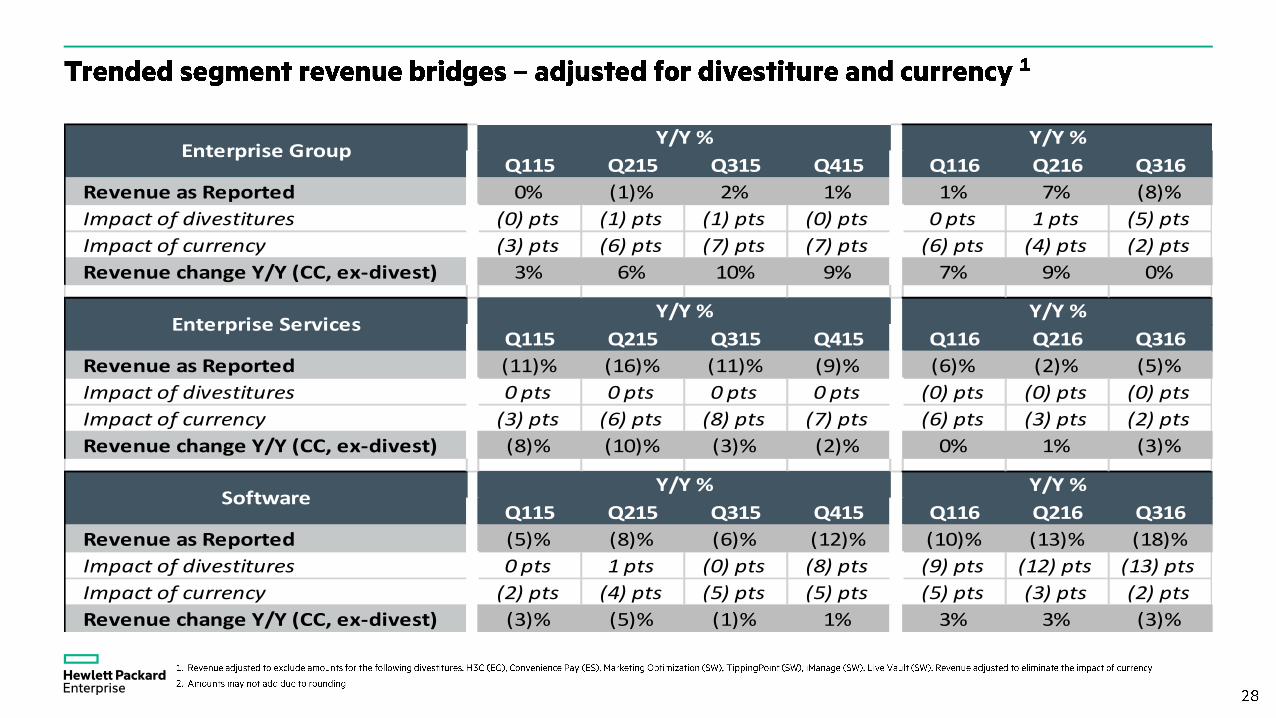
Q115 Q215 Q315 Q415 Q116 Q216 Q316
Revenue as Reported 0% (1)% 2% 1% 1% 7% (8)%
Impact of divestitures (0) pts (1) pts (1) pts (0) pts 0 pts 1 pts (5) pts
Impact of currency (3) pts (6) pts (7) pts (7) pts (6) pts (4) pts (2) pts
Revenue change Y/Y (CC, ex-divest) 3% 6% 10% 9% 7% 9% 0%
Q115 Q215 Q315 Q415 Q116 Q216 Q316
Revenue as Reported (11)% (16)% (11)% (9)% (6)% (2)% (5)%
Impact of divestitures 0 pts 0 pts 0 pts 0 pts (0) pts (0) pts (0) pts
Impact of currency (3) pts (6) pts (8) pts (7) pts (6) pts (3) pts (2) pts
Revenue change Y/Y (CC, ex-divest) (8)% (10)% (3)% (2)% 0% 1% (3)%
Q115 Q215 Q315 Q415 Q116 Q216 Q316
Revenue as Reported (5)% (8)% (6)% (12)% (10)% (13)% (18)%
Impact of divestitures 0 pts 1 pts (0) pts (8) pts (9) pts (12) pts (13) pts
Impact of currency (2) pts (4) pts (5) pts (5) pts (5) pts (3) pts (2) pts
Revenue change Y/Y (CC, ex-divest) (3)% (5)% (1)% 1% 3% 3% (3)%
SoftwareY/Y % Y/Y %
Enterprise GroupY/Y % Y/Y %
Enterprise ServicesY/Y % Y/Y %

Q115 Q215 Q315 Q415 Q116 Q216 Q316
Revenue as Reported 6% 9% 6% 4% (1)% 7% (4)%
Impact of divestitures 0 pts (0) pts (0) pts (0) pts (0) pts 0 pts (0) pts
Impact of currency (2) pts (6) pts (7) pts (7) pts (6) pts (3) pts (2) pts
Revenue change Y/Y (CC, ex-divest) 8% 15% 13% 12% 5% 10% (2)%
ServersY/Y % Y/Y %
Q115 Q215 Q315 Q415 Q116 Q216 Q316
Revenue as Reported 0% (8)% (2)% (7)% (3)% 2% (8)%
Impact of divestitures 1 pts 1 pts (0) pts (0) pts (1) pts (1) pts (1) pts
Impact of currency (2) pts (6) pts (9) pts (7) pts (7) pts (4) pts (2) pts
Revenue change Y/Y (CC, ex-divest) 2% (3)% 7% 0% 4% 6% (5)%
StorageY/Y % Y/Y %
Q115 Q215 Q315 Q415 Q116 Q216 Q316
Revenue as Reported (11)% (16)% 23% 35% 53% 57% (22)%
Impact of divestitures (3) pts (7) pts (26) pts (24) pts (17) pts (2) pts (33) pts
Impact of currency (3) pts (8) pts (11) pts (11) pts (10) pts (5) pts (2) pts
Revenue change Y/Y (CC, ex-divest) (5)% (1)% 60% 70% 81% 64% 12%
NetworkingY/Y % Y/Y %
Q115 Q215 Q315 Q415 Q116 Q216 Q316
Revenue as Reported (5)% (8)% (10)% (11)% (9)% (6)% (7)%
Impact of divestitures 1 pts 0 pts 1 pts 0 pts (0) pts (1) pts (6) pts
Impact of currency (4) pts (6) pts (7) pts (7) pts (7) pts (4) pts (2) pts
Revenue change Y/Y (CC, ex-divest) (2)% (2)% (4)% (4)% (2)% (1)% 1%
Technology ServicesY/Y % Y/Y %

Q115 Q215 Q315 Q415 Q116 Q216 Q316
Revenue as Reported (11)% (20)% (13)% (11)% (8)% (1)% (6)%
Impact of divestitures 0 pts 0 pts 0 pts 0 pts 0 pts 0 pts 0 pts
Impact of currency (3) pts (6) pts (8) pts (7) pts (7) pts (3) pts (2) pts
Revenue change Y/Y (CC, ex-divest) (8)% (14)% (5)% (4)% (2)% 2% (3)%
ITOY/Y % Y/Y %
Q115 Q215 Q315 Q415 Q116 Q216 Q316
Revenue as Reported (11)% (8)% (7)% (6)% (2)% (3)% (4)%
Impact of divestitures 0 pts 0 pts 0 pts 0 pts (0) pts (0) pts (0) pts
Impact of currency (3) pts (6) pts (7) pts (7) pts (5) pts (3) pts (1) pts
Revenue change Y/Y (CC, ex-divest) (8)% (2)% 0% 1% 3% 0% (3)%
ABSY/Y % Y/Y %

Q115 Q215 Q315 Q415 Q116 Q216 Q316
Revenue as Reported (17)% (17)% (12)% (10)% (6)% (13)% (28)%
Impact of divestitures 0 pts 2 pts (1) pts (6) pts (6) pts (12) pts (9) pts
Impact of currency (3) pts (4) pts (7) pts (5) pts (5) pts (3) pts (2) pts
Revenue change Y/Y (CC, ex-divest) (14)% (14)% (4)% 1% 5% 2% (17)%
Q115 Q215 Q315 Q415 Q116 Q216 Q316
Revenue as Reported 0% (2)% (3)% (15)% (13)% (16)% (17)%
Impact of divestitures (0) pts 0 pts 1 pts (9) pts (9) pts (13) pts (15) pts
Impact of currency (2) pts (3) pts (5) pts (5) pts (5) pts (4) pts (2) pts
Revenue change Y/Y (CC, ex-divest) 2% 1% 1% (1)% 1% 1% 0%
Q115 Q215 Q315 Q415 Q116 Q216 Q316
Revenue as Reported (7)% (14)% (6)% (9)% (7)% (3)% (8)%
Impact of divestitures 0 pts 0 pts 0 pts (7) pts (7) pts (8) pts (7) pts
Impact of currency (3) pts (7) pts (8) pts (7) pts (6) pts (2) pts (2) pts
Revenue change Y/Y (CC, ex-divest) (3)% (9)% 2% 5% 6% 7% 1%
Q115 Q215 Q315 Q415 Q116 Q216 Q316
Revenue as Reported 0% (4)% (4)% (6)% (9)% (11)% (5)%
Impact of divestitures 0 pts 1 pts (2) pts (10) pts (21) pts (19) pts (21) pts
Impact of currency (1) pts (1) pts (2) pts (2) pts (2) pts (2) pts (1) pts
Revenue change Y/Y (CC, ex-divest) 1% (3)% 0% 5% 14% 10% 17%
Q115 Q215 Q315 Q415 Q116 Q216 Q316
Revenue as Reported (4)% (10)% (5)% (8)% (8)% (7)% (7)%
Impact of divestitures 0 pts 1 pts (1) pts (8) pts (13) pts (12) pts (12) pts
Impact of currency (2) pts (5) pts (6) pts (5) pts (4) pts (3) pts (2) pts
Revenue change Y/Y (CC, ex-divest) (2)% (7)% 1% 5% 9% 8% 7%
LicenseY/Y % Y/Y %
SupportY/Y % Y/Y %
Services TotalY/Y % Y/Y %
Professional ServicesY/Y % Y/Y %
SaaSY/Y % Y/Y %