title page a comparison of the organization of...
TRANSCRIPT

A Comparison of the Organization of Merchant Empires: Portugal, England and the Netherlands
Claudia Rei* July 27, 2009
Department of Economics Vanderbilt University VU Station B#351833 2301 Vanderbilt Place Nashville, TN 37235
[email protected] Phone: (615) 936-7260 Fax: (615) 343-8495
*I have benefited from very helpful discussions with Maristella Botticini, Boyan Jovanovic, Bob Margo, and Andy Newman. Jeremy Atack, Sidarth Chandra, Bill Collins, Leonor Costa, Guillaume Daudin, Mauricio Drelichman, Eric Hilt, Andrea Moro, Carol Shiue, Peter Temin, Joachim Voth, Jeff Williamson, the participants at the annual meetings of the Economic History Association, the EGE meeting at the NBER, and the SITE meetings in Stanford offered useful comments. The financial support of the Economic History Association (dissertation award) is gratefully acknowledged. All errors remain my own.

Abstract
In the sixteenth century, several European countries engaged in long-distance trade
with the East. Despite sharing the same objectives and technology, Portugal opted for
a crown monopoly whereas England and the Netherlands franchised trade to private
merchants. I provide a model that explains organizational variation in terms of the
di¤erences in relative endowments of king and merchants. I also explore the impli-
cations of control allocation using archival data on labor compensation and shipping
technology. Di¤erences in the long run performance of the empires suggest a major
impact of organization.
1

1 Introduction
The choice of how to organize overseas trade arose when Europeans began to venture across
the seas in the �fteenth century. After the discovery of the Eastern passage around the Cape
of Good Hope in 1487, several European countries directly engaged in Eastern trade, halting
a long lasting reliance on the business intermediaries of the Silk Route.
Even though monarchs had similar goals �revenue and glory1 �for their overseas posses-
sions and access to the same technology (all used the sailing ship to travel East), methods
of organizing long-distance trade di¤ered radically across countries. In Portugal and Spain,
long-distance trade was directly controlled by government companies and commercial privi-
leges reverted mostly to the crowns. On the other hand, the English and Dutch companies
organized long-distance trade according to the interests of private merchants.
The success of the empires was also quite di¤erent across countries. The initial control of
a large number of eastern ports by the Portuguese in the �rst half of the sixteenth century
was gradually supplanted by that of the Dutch and the English in the second half. The
�rms�distinct abilities to maintain territorial control and therefore to guarantee a sustained
volume of trade, suggest that the choice of organization had an impact on the long term
economic performance of the empires. Figure 1 shows a relative measure of countries success
with the percent tonnage of European shipping to Asia by country in the sixteenth and
seventeen centuries. Initially the Portuguese crown maintained a monopoly position, but
then her market share dropped below that of the Dutch and English private companies and
by the end of the period, Portuguese shipping to Asia was at the level of the smaller French
and Danish companies.2
This paper goes beyond the historical literature which is vast in the characterization of
merchant empires and their economic performance, but silent on the reasons behind the
1Throughout the paper royal �glory� is broadly de�ned as the king�s international recognition, whichcould have been achieved through visible signs of power such as, the successful exertion of military powerin foreign territories, the expansion of the crown�s rule (and eventually religion) over a larger number ofsubjects, the enormous dazzling ships, etc.
2The Portuguese decline is also visible in absolute terms.
2

emergence of the di¤erent organizational forms.3 In section 2 I o¤er a static model of
"incomplete contracts" to explain the choice of organization at the establishment of the
empires.4 The di¤erences in the distribution of bargaining power between the king and
the merchants, which stem directly from the original endowments, have direct implications
on who controls the enterprise: if the king is �ush with capital (relative to the scale of
investment) he chooses to maintain control; if not, then the king franchises the enterprise,
thereby delegating control to the merchants.5
In section 3 I use the model�s implications illustrate historical facts. In Portugal, the
extremely high rates of return accrued by the king early on (1415-1498) justi�ed the crown�s
decision to own the monopoly of trade after Da Gama�s 1498 voyage. In contrast by 1600,
when the East India Company was founded, the English Royal Treasury was empty: the
funds the crown was able to raise not only had more pressing employment (war), but were
also insu¢ cient to bear the cost of the voyages. Unable to fund the empire, the English
monarch chose instead to charter a monopoly of trade to the East India Company (EIC),
thereby forfeiting full pro�ts in lieu of a tax on the proceeds.
In the model, the control structure a¤ects the business decisions taken by the party in
charge and also each party�s investment. It is not surprising therefore, that the performance
of the empires was so diverse. In section 4, I brie�y address the divergent business decisions
across �rms in two areas: labor compensation and shipping technology.
The paper contributes to the general literature on the impact of institutions in the long
run performance of countries (Davis and North 1970, North 1991, Greif 1993, and Acemoglu
et al 2005). However, the paper goes beyond the debate of institutions that are growth
enhancing or hindering by looking at the reasons behind their emergence. The model draws
3Braudel (1972), Chaudhuri (1978), Furber (1976), Godinho (1969), Hart (2003), Steensgaard (1974).4If the objective of the paper were to explain the divergent long run performance of merchant empires,
a dynamic model would be required but since only the original organizational choice is analyzed, then thesimple static model su¢ ces. Given that neither the Portuguese nor the English or Dutch empires everswitch organizational form, one could argue some sort of path dependency to derive implications on �rm�sperformance. This is beyond the scope of the current paper.
5See Blair and Lafontaine (2005) for a survey on the literature of franchising.
3

on the theory of the �rm, in particular, on the e¤ect of property rights on �rm ownership
(Grossman and Hart 1986, and Hart andMoore 1990). The main thrust is on how the division
of surplus, rather than e¢ ciency, a¤ects the negotiation outcome: divergent bargaining
positions, may result in less e¢ cient outcomes (Legros and Newman 2008).
2 A Model of Organizational Choice
Long-distance trade results from the cooperation between two parties: merchants and king.
The merchants contribute with management skills, a non-contractible and non-transferable
e¤ort type represented by e � 0.6 The king owns the right to award the monopoly of trade
either to the merchants or to himself.7 Beyond e¤ort and charter, the business also requires
"cash" c owned by the merchants cm or by the king ck (with c = cm + ck and cm; ck > 0),
which can be invested either in long-distance trade (e.g. to buy ships and pay sailors)
or other alternative purposes (e.g. to build cathedrals, domestic trade).8 Historically, we
observe kings and merchants engaging in long-distance trade, indicating it was an attractive
investment. Therefore, for the purpose of the model, I assume the competing outside options
for merchants �cm, and king �ck to have lower returns � < �, with � representing the return
on long distance trade.
Long-distance trade also depends on operational decisions d 2 [0; d] (e.g. size of ships),
ordered according to the king�s preferences. Although the choice of high d may be favorable
to production (larger ships carry more spices), it a¤ects the cost of merchants�e¤ort (larger
ships are harder to maneuver and more likely to perish in storms, therefore merchants prefer
6Merchants are a group of agents with the same preferences negotiating with the king as a single agent,which was historically observed. The considerable investment to run such an enterprise made merchantsgather their resources together in the form of joint stock, and negociate directly with the monarch formonopoly rights of overseas trade, then a royal prerogative (Cawston and Keane 1896).
7I also considered the case in which the king exerts e¤ort (e.g. protection). Here, I ignore this alternative,as the results do not change and calculations are simpler.
8An alternative use of cash could be to make transfers between parties in order to achieve the outcomeof the bargaining process. The party in control would prefer not to do so because its utility would fall; theparty not in control could not do so because of cash constraints (refer to Figure 3). I therefore assume thatcash is non-transferrable and that parties cooperating in long-distance trade invest all available cash.
4

smaller and safer ships). Business decisions are far too complex to specify in the contract (let
alone enforce), so d is chosen after the realization of the "state of the world" � 2 [0; 1], with
mean �.9 The right to make such decisions can be allocated to either party in the contract.
Output from long-distance trade results in
y = �c, with probability �(e; d) = D�e1��, 0 < � < 1 (1)
and 0 otherwise. The success probability � depends on merchants� e¤ort e, and a term
D = 1� 12(d� �)2 re�ecting the sensitivity of � to d and �: the farther d is from the realized
state of the world �, the smaller the D and the less likely the venture is to succeed.
The utility functions for merchants and king are:
u = sE[y]� e; and v = (1� s)E[y] + d: (2)
Each party cares for its share of expected output and also for organizational control, which
confers the right to choose d. Like the merchants�, the king�s utility is a¤ected by d through
expected output. In addition, the king cares for royal glory: even with a zero share of output,
having control generates positive utility ( > 0) for the king (bigger ships are a means to
show o¤ military power) who rules over more people, controls a larger territory, etc.10
The timing of the game is as follows: (i) design a contract consisting of two variables over
which parties bargain: a sharing rule s 2 [0; 1], and a control structure (king control �KC,
or merchant control �MC);11 ;12 (ii) realization of the state of the world �, and subsequent
9The state of the world � is characterized by a set of conditions such as the local political system, theexistence of armed con�icts, the quality of the crops in a given year, the weather faced in the voyage, localprices, or any other conditions in the East that may a¤ect business decisions d.10I considered a similar term in the merchants�utility function, but the results are left unchanged.11If the sharing rule were non-contractible (e.g. if the king were unable to commit not to expropriate-
con�scate the proceeds of a private company), renegotiation would be allowed at the end of the period.Instead of two frontiers corresponding to di¤erent control rights, we would get two points only.12Implied in this stage is the assumption that both monarchs could choose over the same menu options:
own or franchise. While this is clear in the English case, it may be less obvious that the Portuguese king couldchoose anything else than a crown monopoly. In the �fteenth century, Portugal did not have an institutionalsetting like that of the English Magna Carta (1215), which imposed voluntary restrictions on the king�s
5

choice of d by the party in control; (iii) determination of optimal e¤ort level, e, by the
merchant.
Solving the model by backward induction, I get optimal values for e¤ort e� and business
decisions d� in both control structures.13 The �rst result is that for any sharing rule s
merchants choose to put more e¤ort into an organization they control (e�MC > e�KC). Given
(1) and all else the same, the probability of success of the venture is smaller when the king
is in charge (�KC < �MC). Second, d�KC > d�MC for any s, which reinforces �KC < �MC
and is consistent with the king extracting direct utility from taking business decisions: he
will always overshoot relative to the optimal level of d, for any realized state of the world.
The two results go in the same direction: choices of e¤ort and business decisions in a king
controlled organization combine into a lower probability of success � relative to the merchant
controlled scenario.
Given the e¤ort and decision pro�les determined in stages (iii) and (ii), in stage (i)
parties bargain over the sharing rule s, and the control structure. Substituting e� and d� in
the utility functions, generates the optimal utility pair for merchants and king (u�; v�) which
depicts concave utility possibility frontiers in Figure 2 upon variation of s.
The model encompasses any cash allocation scanario: there is a continuum of disagree-
ment points [(�c; 0); (0; �c)] representing the parties�outside options. For example, if the
king owns a lot of cash (in the limit c = ck), bargaining takes place to the northeast of the
disagreement point (in the limit (0; �c)) and the solution will likely lie on frontier KC (say
point A). Though resulting from the bargaining process, outcomes on KC are not socially
optimal if we consider the social surplus to be the unweighted sum of the utilities of both
parties.14 The choice of control structure does not derive from social e¢ ciency, but rather
activities. This particular institution allowed English agents to engage in private organizations. Franchising,however, was an option for the Portuguese king in 1469-1474 when the trade o¤ the Guinea coast was rentedto a private Lisbon merchant, and also in 1587, 1628 and 1697 when the monarch attempted to convert theenterprise into private ownership. Moreover, history provides evidence for private corporations of craftsmenand artisans in medieval Lisbon (Marques 1982, Vol. I; Serrão 1980, Vol. I, pp. 336-44).13See appendix for detailed expressions of e�, d�, u� and v� under either control structure.14The highest indi¤erence curve of slope -1 touches MC, that is, the socially optimal control structure.
6

from the distribution of bargaining power across parties.
The implications of the model are very clear: 1) a cash �ush king will control the monopoly
of trade: he does not need merchant money to conduct trade, so he hires merchants to run the
royal business and giving them a small share of the spoils of trade (KC); 2) a cash constrained
king will give up control to the merchants who gather in the form of joint stock (MC), forcing
the king to concede them monopoly rights over trade (i.e. franchise) in exchange for a small
share; 3) �rms controlled by king and merchants are very di¤erent, which should be visible
in the adopted business decisions.
If bargaining power is a direct re�ection of the cash ownership of kings and merchants,
then it becomes an historically observable measure that can explain the emergence of the
di¤erent organizational forms. In the next two sections I look at the historical evidence in
the light of the model�s suggestions.15
3 The Emergence of Merchant Empires in the East
In light of the model, the key question for organizational choice is how well endowed monarchs
were at the establishment of long-distance trade. I analyze the Portuguese and the English
cases.16 The model implies the Portuguese king should have been well endowed by 1498 after
Da Gama�s voyage, which established the crown monopoly of the spices. On the other hand,
the English queen should have been poorly endowed by 1600 when the EIC was chartered.
15Competition may be an alternative explanation for the emergence of di¤erent organizational forms.Initially, Portugal was the only country in the newly opened market of long-distance trade and chose a givenorganizational form, which ex-post revealed to be worse. Later entrants chose more e¢ cient organizationalforms because they had to compete with each other in some sort of survival of the �ttest. This argumentdoes not account for why Portugal never switched to a more e¢ cient organizational form, nor does it explainPortugal�s choice. Despite all handicaps, competition can be complementary to the bargaining story ifunderstood in terms of relative scarcity of kings and merchants. Initially there were few kings willing toengage in long-distance trade, so merchants with little room for negotiation would settle for work in a royalorganization. As more kings got interested in long-distance trade, bargaining power favored merchants whowould then be able to choose the monarch who best tailored their interests, and control the enterprise.16Portugal and England were hardly the only European nations to embark on overseas trade. In the
appendix I discuss the cases of Denmark, France, the Netherlands, and Sweden, which established theirmerchant empires in the East between the �fteenth and eighteenth centuries. The model seems to illuminatethe events in these countries as well.
7

3.1 The Portuguese Case
Table 1 shows the progress of the Portuguese discoveries and conquests throughout the �f-
teenth century which contained military expeditions in Northern Africa as well as exploration
voyages down the African coast and out to the Atlantic islands. The narrative evidence seems
to indicate that the crown-sponsored expansion provided signi�cant revenue when the near
monopoly position of the king in the African trade started paying o¤ in the �rst half of the
�fteenth century. Gold was �rst found in West Africa in 1436, the �rst slaves were brought
to Lisbon in 1441, and trade in Guinean pepper started around 1450 (Serrão 1980:194-9).
The king�s political and �nancial independence can be inferred from the records of cortes,
which were general assemblies of the king with representatives of the nobility, the clergy and
the general estates. These meetings had legislative, political, and �scal purposes, for instance,
in order to levy new taxes, the king had to call cortes (De Sousa 1990).17 In general, the
cortes were the place where the king checked the pulse of the country and where the �nancing
of royal policies was discussed.
Table 2 shows the average interval between assemblies before the expansion, in the early
expansion period and the late expansion period. If the cortes were a constraint on the king,
or if the king was �nancially dependent on taxes raised at this level, then there should be
no signi�cant change or even a decrease in the average time between meetings. Between
1385 and 1415, before the start of maritime expansion, the cortes met on average every
1.5 years, whereas in the period of expansion down the African coast (1415-1498), Atlantic
Islands and Northern Africa, they met every 3 years. After reaching India there was a
meeting every 9.1 years. The increasing time between meetings suggests that the monarch
was revenue independent, and could take important decisions for the kingdom without the
advice, consent, or funding of his subjects. This seems to be consistent with a �nancially
17De Sousa (1990) argues that the meetings never assumed a regular periodicity even though the generalestates often requested so: it was their single chance to voice complaints to the monarch, who depended onthe payment of their taxes. In 1371, the general estates proposed a three-year interval for the assemblies,to which the monarch replied that parliament would be called "whenever he understood necessary to hisservice and good of the land" (De Sousa 1990, p. 111).
8

unconstrained monarch who was able to control the merchant empire without outside help.
So far I have presented indirect evidence that the king of Portugal was �nancially able
to support the costs of empire, arguably because the early stages of discovery were very
pro�table. I now turn to the estimation of (labor and capital) costs of the discovery voyages
from 1415 to 1498 in Table 1 and compare it to the historical reports of revenues from these
voyages. The purpose of this excercise is to evaluate the king�s �nancial ability in 1498 when
he faced the decision of owning the monopoly of trade or chatering out monopoly rights.
Costs and Revenues
Wage series for �fteenth century Portugal are not available.18 Therefore, I rely on Robert
Allen�s (2001) database of wages for laborers and craftsmen of other European cities in the
same time period.19 Together with the scattered information on ships and men in maritime
expeditions (henceforth events), labor costs per event i at time t are calculated as follows:
wLi;t = daily waget � number of meni � number of daysi
Daily waget is a weighted average of daily wages of skilled (20%) and unskilled (80%) labor
(in grams of silver) for all available cities for the year of the event.20 The conversion of silver
into gold is based on the gold-silver rate for the year of the event.21
The labor requirement varies according to the nature of the event: military expeditions
were more demanding in terms of men (usually in the thousands) and ships (hundreds),
18The 1755 Lisbon earthquake destroyed two-thirds of the city and burried the national archives, makingit nearly impossible to �nd data for earlier periods.19Cities (Antwerp, Florence, Krakow, London, Oxford, Paris, Strasbourg, Valencia) were weighted by own
population (DeVries 1984) in the year of the event. Labor markets need not be integrated, but shared shocks(demographic or technological) possibly yielded similar wage trends in early modern Europe (Allen 2001).20The ratio was observed in the ships sailing to India in the late sixteenth century: in a crew of 123 men
there were 45 sailors, 48 apprentice sailors, 4 pages, and 11 bombers. Other crew members were holders ofa single occupation in the ship associated with a skill, for instance, mason, or pilot (Falcão 1859:198). Ifbombers are not considered skilled labor the percentage of unskilled workers is 79%, if they are, the �gurechanges to 88%.21Conversion is necessary to compare estimated costs with revenues from the gold trade. There are three
gold-silver ratios: .1080 for 1410 (Wee 1963:127); .0895 for 1457-64 (Munro 1994:674-5); and .0897 for 1489(Munro 1994:674-5). I calculate yearly values by linear interpolation.
9

whereas exploration voyages like Da Gama�s in 1498 relied on 170 men and four ships only
(Sanceau 1967). I assume all military expeditions were the size of Ceuta�s (9,000 men, 225
ships, and 28 days). Historical records indicate that exploration voyages before the Gulf of
Guinea were of small scale with single ships sent to coastal exploration (60 men crew would
be standard), whereas voyages after the Gulf of Guinea required more labor and ships (170
men and 4 ships).22 My calculations are based on ships sent and not returned, therefore I
assume no destruction rate and consider the full investment upfront.
Duration is estimated based on the distance from Lisbon to destination using the baseline
duration from the voyage Lisbon-Ceuta in 1415 (28 days) for explorations voyages before the
Gulf of Guinea, whereas the duration of voyages after that gulf was estimated using the
duration of the voyage from Lisbon to the Cape of Good Hope in 1487 (252 days).23 I
approximate the sea routes by straight lines. Therefore, in addition to the latitude and
longitude coordinates of origin and destination, I also use those of intermediate locations in
the ocean.
Capital costs for each event (rKi;t) are calculated recursively using a given labor share
and applying it to wLi;t. With a Cobb-Douglas24 production function y = AL�K1�� I
assume that each factor of production is paid at its marginal product w = �(KL)1�� and
r = (1� �)( LK)�. Labor share is calculated as follows:
wL
rK=
�y
(1� �)y , wL = �(rK + wL), � =1
1 + rKwL
. (3)
With a constant labor share over time, capital costs are given by:
rKi;t =(1� �)�
wLi;t. (4)
22Please refer to the appendix for assumption details.23Da Gama�s �rst voyage to India is well documented, so the duration used in the cost calculation of this
event is exact (departed Lisbon on July 8, 1497 and returned on July 10, 1498).24The original reduced form problem Max(2); s:t:(1) is the same as the one in which the production
function is E[y] = AL�K1���c�D�e1�� � rk�wL. Along the utility possibilities frontier, it can be shownthat the cost minimizing problem must be solved. The two functional forms are therefore equivalent.
10

The labor share �, can be calculated from (4) for any event in maritime history with data on
labor and capital costs. I consider two episodes: a trip to India on a Portuguese vessel in 1615,
the calculation of which yields �1615 = :8188; and a trip of a vessel in the American whaling
industry in 1859, which yields �1859 = :4559.25 Any labor share above �1615 = :8188 or below
�1859 = :4559 seems implausible given current estimations for developed and underdeveloped
countries of .65 and .80 respectively (Senhadji (2000) and Gollin (2002)).26 A high value of
� generates low capital costs, which depress total costs and, in turn, generates high rates of
return. Omitting the value of cargo, a part of capital costs, contributes to this e¤ect. I am
interested, however, in measuring the cost of �fteenth century exploration voyages in which
ships were not loaded with bullion.27 The estimations of �1615 and �1859 generate upper and
lower bounds for capital costs (third and fourth columns on Table 3).28
On the revenue side I consider three possibilities according to location:29 (i) locations
conquered in military expeditions (Northern African strongholds) yielded immediate revenue
from looting, and eventually some annual revenue in taxes;30 (ii) inhabited regions suitable
for trade (such as the Gold Coast), o¤ered an annual �ow of revenue; (iii) remote deserted
25Detailed steps for the calculation of �1615 and �1859 in the Appendix, where I also calculate the laborshare for a 1693 voyage of an English ship, and for Portuguese shipping to Brazil in the seventeenth century.Both are within the bounds.26Underdeveloped countries today are likely to have labor shares that resemble pre-industrial values given
the relatively intense use of labor due to the low degree of mechanization in these countries.27Similar calculations taking into account cargo have been done for France in the eighteenth century and
the labor share falls to about .4 (Daudin 2005, p. 306). Using this lower labor share and adding 4 trips ayear for the gold trade with the Guinea coast (Vogt 1979) the return rates are reduced, ranging between 1.6and 2.5, still a high return on the investment.28Keeping � constant in the calculation of rKi;t for all �fteenth century events does not rule out techno-
logical progress, which could be captured by the residual A. In addition, maintaining a constant labor share(at the 1615 or the 1859 level) does not reduce the estimates of rKi;t. On the contrary, capital costs duringthe period of interest are overestimated: if � changed over time, it could only have dropped (and therefore1��� in (4) would be lower in 1415 than 1615), for two reasons. First, the �fteenth and sixteenth centurieswitnessed dramatic technological improvements in shipping: both the transition from oars to sails in the early�fteenth century (lower L) and the later increase in vessel size (higher K) increased the ratio K=L, whichwould bring � down if labor were cheaper than capital ( rw > 1). Second, even though nominal wages went upin almost all cities, real wages fell everywhere but in Antwerp both for laborers and craftsmen (Allen 2001).This is consistent with the specie in�ow in Europe since the late �fteenth century, which caused generalizedin�ation. Therefore, r is likely to have risen more than w (stickier wages) over the �fteenth century, whichcon�rms the prior condition r
w > 1.29Please see Figure 4 in the appendix for a map of the Portuguese controlled locations in the sixteenth
century.30The latter are assumed to be negligible for simplicity.
11

locations, such as the Atlantic islands of the Azores, generated an initial cost from the
exploration voyage and added new territory, but no revenue.
Due to lack of accurate �fteenth century data, I only observe revenue of the gold trade
in Guinea. As for the two other sources of trade controlled by the crown � slaves and
Guinean pepper �unfortunately, prices are available only for the sixteenth century, although
historians have ranked the �fteenth century sources of royal revenue as slaves, gold, and
spices by order of magnitude (Marques 1982:64).31 The reported revenues on Table 3 are,
therefore, underestimated by at least one-half.32 In the third column, we see revenues always
exceeding total Costs (wLi;t + rKi;t) by a magnitude of at least three, thereby indicating
a pro�table enterprise for the Portuguese monarch. The return was even higher in the
successful military ventures of Northern Africa: though more demanding in ships and men,
the revenue in looting was considerably higher than that attained in regular trade.
Sensitivity Analysis
Even though revenues are underestimated, because revenue-cost ratios are likely to be a lower
bound on the crown�s returns, the unusually high magnitudes beg a few robustness checks.
Since revenues are �xed, one could attribute the high return ratios to the underestimation
of costs either via low wages, or low duration of the events.33
First, I compute labor costs using the highest available value in Allen�s wage database
(Valencia for all years). Doing so reduces the ratio of revenues to costs, but it is still between
2.1 and 10.6. Therefore, low wages are not entirely driving high returns.
Second, I compute labor costs using only the wages of the highest paid craftsmen (again
Valencia�s), and the returns now vary from 1.5 to 9.3, which are still quite high.
Third, using the diary of Christopher Columbus for the duration and the relevant lo-
cations of his 1492 venture, I calculated its distance based on latitude and longitude co-
31In the sixteenth century, after arrival in India the order was reversed to spices, gold and slaves.32Moreover, slaves had been arriving in Lisbon since 1441: not only the size of the downward bias is large,
but also the king was getting revenue much earlier than reported.33Lost shis would have the same e¤ect if the calculations included destruction rate, which is not the case:
I calculate the costs of ships sent, not returned.
12
ordinates. The duration of Columbus�s voyage relative to the distance traveled was much
shorter than that of the Portuguese expedition to Ceuta on which the results of Table 3 are
calculated.34 Using the number of days in Columbus�s voyage to estimate the duration of
each event would even bring down estimated costs. Therefore, low duration of the events
appears not to result in high rates of return either.
Both the indirect evidence and the computed returns on investment indicate that the
early expansion process was pro�table. With such high return rates, it is not surprising that
the Portuguese crown chose to maintain the monopoly of trade after arrival in India: the
King did not need merchant money to engage in long-distance trade because he could do it
himself. This result was helped by the fact that initial expeditions were fairly cheap. The
model�s prediction that a non-cash constrained monarch would opt to take charge of the
enterprise seems to illuminate Portugal�s choice of organization.
3.2 The English Case
The foundation of the EIC came at the end of the long and politically agitated reign of
Elizabeth I (1558-1603).35 Internal tensions, such as the northern rebellion of Catholic Earls
in 1569, the Nine-Years war (1594-1603) with Ireland, and the dispute of the throne by Mary
Queen of Scots, were coupled with the ensuing Anglo-Spanish war (1585-1604). All events
added to the �nancial distress of the crown.
The �nancial condition of the crown was already problematic when Elizabeth ascended
the throne. The political divisions of the kingdom resulting from the Wars of the Roses
emerged again at the death of Henry VIII in 1547. The sequence of de jure and de facto
reigns in the following ten turbulent years represented a further strain on royal �nances.34Columbus took 71 days to travel 4,323 miles (7 days from Palos in the South of Spain to the Canary
Islands; 28 days stopped for repairs at the Canary Islands; and 36 days from the Canary Islands to theBahamas), which is an average of 60.9 miles a day (Columbus, 1989). The 1415 voyage to Ceuta lasted 28days for a distance of 479 miles, that is, 17.1 miles a day. Columbus could have arrived Ceuta in 8 days only.35The seventeenth century brought four other countries into long-distance trade: England in 1600, the
Netherlands in 1602, Denmark in 1616 and France in 1664. According to the relative scarcity/abundanceargument, the addition of more kings in the European market of overseas ventures adds bargaining powerto the merchants, who can choose over alternative kings.
13

Queen Elizabeth had a lot of people to please with little money.
In order to shift some of the costs of government and court away from the Royal Treasury,
and to escape the dangers of the plague in London, during the summer the Queen would go
on country progresses. These tours not only generated royal propaganda, but also helped
to please the nobility who had the privilege of hosting the queen and her entourage, which
could number between 200 and 300 people (Leahy 2005).
The basic costs of the visits were paid by the Royal Household, but the hosts often chose
to make a social display of the visit. In 1591, for example, a 10-day visit to Lord Burghley
cost over £ 1,000 and in 1575 Robert Dudley �Earl of Leicester �spent several thousand
pounds on a three week royal visit (Pringle 1980:84). The expensive lifestyle of the royal
court did not help to keep healthy public �nances either. With so many competing uses for
her resources, could the queen a¤ord to support foreign ventures?
Royal Finances
Elizabeth�s predecessors had been very successful in raising government revenue: Henry VII
raised taxes, requesting �nancial help from parliament only once during his reign (1485-
1509); his successor Henry VIII (1509-1547) seized the lands of monasteries as a result of the
split from the Roman Church in 1534 (Pollard 1910). The wars with France and Scotland,
however, reversed the �nancial advantage.
The incipient nature of national credit in the sixteenth century led the English monarch
in 1544 to turn to the Antwerp market, which had abundant resources and was, therefore,
capable of o¤ering the large loans the crown was looking for. Antwerp was however, a credit
market originally developed to satisfy the short term credit requirements of merchants, quite
di¤erent from the �nancing of long term wars. The increasing di¢ culty of the royal agent to
raise loans led to a virtual closure of Antwerp to the English in 1569. Even though all foreign
debt was repaid by 1574, new foreign loans were sought in 1575-6 and 1589, but neither was
fully subscribed (Outhwaite 1971).
14

Royal �nances remained constrained even after the Antwerp episode.36 From a surplus in
1583-5, the government balance had turned into a de�cit by 1597-1600 (Goldsmith 1987:190,
194). Increasing wars � the Anglo-Spanish war 1585-1604, and the Irish rebellion or the
Nine-Years war 1594-1603 � resulted in greater �nancial needs. The de�cit around 1600,
would not prevent royal engagement in long-distance trade, provided there was scope for
government borrowing and debt issue. Such was not the case in the late sixteenth and early
seventeenth centuries when the English �nancial system was characterized by the absence of
specialized lenders, which had been the main reason behind the earlier switch to the Antwerp
market.37
Government borrowing turned to the internal market in the form of forced loans. These
were involuntary loans, usually secured under threat, with highly unpredictable repayment
and never on the initial terms (North and Weingast 1989). Such method of raising capital
was both unwelcome with merchants and unsustainable in the long run. Table 4 shows the
history of forced loans in this period. Granted the queen had many competing uses for such
funds. We still need to see if these amounts were su¢ cient to assume control of the East
India trade should the crown have decided to do so.
Table 5 presents the expenses of the EIC during its �rst �fteen years during which the
original merchants were granted exclusive trade to the east of the Cape of Good Hope.38
The last column shows the discounted value of the cost of ships and victuals in 1601 pounds
sterling. The cost of the �rst voyage is above the value the monarch could obtain in forced
loans and also above the value the merchants could gather in the �rst subscription of the
EIC�s stock �£ 30,000 (East India Company 1886:1-4).
The limited size of the initial subscription and the slowness with which capital was raised
36The �nancial situation of the crown was also negatively a¤ected by falling revenues due to the parlia-ment�s cancelation of patented monopolies, such as the manufacture and importing of playing cards grantedby the Queen to Darcy, her groom in 1601 (Letwin 1965:27).37Only after the 1688 Glorious Revolution were there institutional arrangements protecting lenders�prop-
erty rights, which allowed for an expansion of the national credit market. Long-term government borrowingrose to unprecedented levels (Brewer 1989, Dickson 1967, North and Weingast 1989).38For the complete text of the original charter, see East India Company (1893).
15
delayed the �rst voyage for a year (Chaudhuri 1965). Nevertheless, the merchants ability to
raise capital was higher than that of the king in the early years of the company. The total
discounted (at a 10% annual rate) value sums to £ 227,062, a value higher than any amount
obtained by the monarch in the form of forced loans. The minimum cost of the production
process was high relative to the monarch�s ability to pay it herself.
Once again the model illuminates historical facts: with public �nance under stress and
no borrowing possibilities, the English crown chose to franchise out monopoly rights in 1600.
4 Implications of Firm Control
The diverse �nancial situations of the monarchs at the emergence of merchant empires re-
sulted in di¤erent control structures across �rms. If control had an e¤ect on �rm�s perfor-
mance, then an enterprise controlled by the king should have been fundamentally di¤erent
from an enterprise where the merchants were in charge. The potential implications of �rm
control can be tested with surviving historical data.
4.1 Labor Compensation
The organizer of overseas ventures, whether a king or a board of merchants, faced a classic
agency problem: how to provide workers with incentives to work hard in distant locations
where they could not only shirk, but also smuggle merchandise thus reducing the venture�s
returns. All else equal, better monitoring should lead to high wages and low bonuses. If,
however, monitoring is costly, merchants will choose to implement less of it when the king
controls the enterprise (in the model e�KC < e�MC). This moral hazard implication can be
tested historically across empires with di¤erent control structures.
I have collected two datasets on the labor compensation of Portuguese and Dutch work-
ers overseas from the sixteenth to the eighteenth centuries.39 The Portuguese dataset was
39The English and Dutch companies di¤ered quite substantially in terms of the incentives of top managerslocated in Europe. Unlike the English, the Dutch board of governors�earnings not only depended on the
16
extracted from a document ca. 1582, which provides a survey of all job posts and respective
compensations for the complete network of Portuguese strongholds around the Indian Ocean
(Luz 1960).40 The Dutch dataset was collected from Lequin (1982), which provides, among
other information, complete career records for 115 workers of the Dutch East India Company
(VOC) that spent some time in Bengal between 1669 and 1799. Like the Portuguese dataset,
all workers in the Dutch sample were hired in their home country. The dates of the two data
sets are not coincident, but both start when the two empires are already well established in
the East, therefore the ratios are still comparable.
Labor compensation over each worker�s career is divided into two parts: a wage paid
by the Portuguese Royal Treasury, or the VOC; and a variable bonus. For the Portuguese
workers, the bonus is paid in kind (spices) and reported in the document as the expected
value each worker could import over the term of the contract (three years). For the Dutch
workers I interpret the career bonus as the remittances to the family in the Netherlands, and
payments in kind in the form of exports in the employee�s account.41
For each of the 313 workers in the samples I construct a bonus-wage ratio (Table 6).42
Even though there are cases of zero bonuses in both samples, average ratios show compen-
sation structures that relied more on bonuses than on wages. This is not surprising: in
order to attract workers to risky ultramarine ventures, �rms had to provide enough of a
premium. Also, the moral hazard problem made it in the principal�s best interest to tie
workers�compensation to the outcome of the enterprise in the form of bonus.
There is, however, a di¤erence in the magnitudes of the ratios: the Portuguese average
is almost three times its Dutch counterpart, indicating a compensation package that relied
company�s pro�t, but also on its turnover (Irwin 1991). I am interested, however, in the structure of payof overseas workers. Since both the VOC and the EIC were controlled by merchants I consider the twocompanies equivalent when compared to the Portuguese Crown monopoly.40The Portuguese loss of independence to Spain in 1580 e¤ectively merged overseas Eastern and Western
Iberian possessions. The document is dedicated to the Spanish monarch with the purpose of providinginformation about the long-standing conditions of the newly acquired eastern empire.41Payments in kind in the Dutch package are similar to the Portuguese imports of spices. The remmitances
may not be compensation above wage, but interpreting them as bonuses only overstates the Dutch bonus-wage ratio, which is not "helping" the model.42I lose 39 observations of Portuguese workers who receive just bonus and no wage.
17

much more on bonuses than the Dutch, as implied by the model�s predictions. Median ratios
and standard deviations show the same tendency, indicating a more dispersed distribution
in Portugal.
4.2 Shipping Technology
Whether controlled by a king or a private company, long-distance trade faced the most varied
business decisions. According to the model, these decisions would vary with the party in
charge (d�KC > d�MC). I now focus on the adoption of shipping technology, measured by ship
size.
In the early �fteenth century, the Portuguese used small and easily maneuverable ships
suited for navigation in unchartered coastlines, but the increased volume of trade gave place
to large cargo vessels in the sixteenth century. Though able to carry more merchandise,
larger ships were also di¢ cult to maneuver under stroms making them less seaworthy, which
was re�ected in higher wreckage rates.43
The �rst attempts to introduce ships larger than 500 tons in Portugal�s Carreira da
Índia date from the 1520s. By the 1550s, large galleons of 900 to 1,000 tons were used, but
were not the most common vessels. From 1551 to 1570 the steady increase in tonnage lead
sea captains to pressure the king to limit ship size. In 1570 the monarch decreed that all
naus in the Carreira should be between 300 and 450 tons. Under Spanish rule (1580-1640)
however, the 1570 law was relaxed and it became a yearly practice to build two or three
naus over 1,000 tons each (Boxer 1968:13). In 1588 upon royal initiative, Lisbon witnessed
the construction of large galleons of 700 to 900 tons.44
In the seventeenth century, smaller and more e¢ cient Dutch ships, ideal for long-distance
43The higher rates of wreckage coincide with the emergence of the popular literature of tragic voyages inthe second half of the sixteenth century (Brito 1959, Brito 1968, Burman 1967, Lanciani 1990).44The timing coincides with the adventures of the Spanish Armada, in which the Spanish �at the time,
also Portuguese �king was heavily involved. It is therefore not surprising that the crown intervenes in theconstruction of large war ships. For an account on the participation of Portuguese ships in the SpanishArmada, see Costa 1997:146.
18

cargo transportation, were used throughout Europe (Unger 1978).45 If the decisions on
shipping technology, as other business decisions in the Portuguese empire, were not following
a standard business perspective but were subject to the whims of the monarch, then we may
see a slower adoption of the more e¢ cient ships, which should be re�ected in a higher
wreckage rate. This pattern seems to emerge from the historical evidence gathered for the
Portuguese and Dutch merchant empires.
Falcão (1859) presents a detailed list of all Portuguese ships sailing out of Lisbon in the
Carreira da Índia from 1497 to 1612.46 Table 7 summarizes this information in two periods
1497-1579 and 1580-1612, before and after Spanish rule. Out of 806 ships sent over the
complete period 52.7% returned safely to Lisbon. Of those that did not return to Lisbon,
35.4% ships stayed in the East for defense purposes. Summing the two rates, we get 88.1%
of successful voyages. Out of the 11.9% ships that ended in failed voyages, 2.5% returned
after aborting the voyage, 8.2% were lost in shipwreck, 0.5% were taken by enemies, and
0.7% were voluntarily burned.
The most substantial rise in the percentage of failed voyages is that of shipwrecks: before
1580 one in every twenty ships was lost, whereas after 1580 one in every 5 su¤ered that same
fate. Assuming Portuguese navigation malpractices �delayed departures, ship overcrowding
and overloading �remained unchanged throughout the period, then the increase in ship size
seems to be the only other factor capable of raising the loss rate.
On the Dutch side, the VOC purchased some ships from private shipyards and built some
itself. Table 8 shows the sizes of the ships built by the VOC in the seventeenth century.
Though the share of large ships of 800 tons or more rises from the �rst (10%) to the second
half of the seventeenth century (14%), the overwhelming majority (86%) of vessels built in
45As a result of the Dutch specialization in naval construction, in the seventeenth century Holland wassupplying ships all across Europe: to the French India Company, England, Hamburg and Ostende, as well asDenmark and Sweden (half of whose �eets was Dutch-built), and even the Spanish colonial trade (Barbour1930:286-7). The pervasiveness of Dutch ships all over Europe is consistent with the assumption that thesetechnologically advanced ships were generally available to all countries and not just the Netherlands.46Royal involvement in the Carreira as the main merchant and armor lead to the specialization of the
Lisbon yards in the construction of large vessels (Costa 1997).
19

the company�s yards have smaller tonnage. This value is likely to be understated, given the
purchase of ships from private shipyards, which were mostly �uits and other small vessels.
Given the approximate composition of the �eet I now turn to Table 9, which summarizes
the losses of in VOC voyages throughout the seventeenth century.
The percentage of losses due to wreckage or capture rises from the �rst to the second
half of the century for both out- and inbound voyages, however, the increase is rather small
(0.5% in outbound voyages, and 1% inbound). Overall losses throughout the period vary
between 3% and 4.2%, a much lower number than that veri�ed for Portuguese ships on Table
7. Handling a larger volume of trade, the Dutch conducted more voyages with a much lower
loss rate, which seems to be associated with vessel seaworthiness.47
5 Concluding Remarks
When European overseas expansion began, monarchs were faced with a choice of how to
organize it. Portugal, the �rst European country to venture across the seas, chose to keep
control. England and the Netherlands chose to franchise. I o¤er a model in which the decision
faced by monarchs with respect to the choice of organizational form is determined by surplus
division rather than maximization, so that bargaining power matters. If the monarch was
not cash constrained ownership was the best alternative. On the other hand, a �nancially
constrained monarch would sell monopoly rights to private merchants.
The model helps to illuminate historical facts. The necessary investment costs in the Por-
tuguese expansion were relatively small compared to expected returns, so it is not surprising
that the Portuguese king chose to keep control of the spice trade. On the contrary, �nancially
pressed by heavy borrowing to �ght wars, the English monarch chartered monopoly rights
of eastern trade to the EIC.47Granted the Portuguese had a period of adaptation to and learning of the Cape route that may have
increased the loss rate, so did the Dutch. Throughout the sixteenth century, Portuguese ships could beseen (and copied) in ports throughout Europe, but navigation knowledge was treated with the most secrecy.Moreover, the Dutch specialized in a slightly di¤erent route in the Indian Ocean, given the VOC headquarterswere located in Batavia (now Jakarta) and, therefore, the Dutch also had some learning to acquire.
20

According to the model, the control structure a¤ects the �rm at di¤erent levels. This
implication provides further insights on the historical evidence of merchant empires. Using
archival data on labor compensation, I �nd that workers employed in a royally controlled �rm
were more likely to receive a higher fraction of their compensation in the form of bonuses than
workers employed in a private company, which is consistent with more di¢ cult monitoring
in a more centralized �rm. Using historical records of shipping technology across merchant
empires, I also �nd that royal ownership often led to the choice of larger ships, more suited
to �ghting wars than to conducting trade. These were less seaworthy ships, which is seen in
a higher wreckage rate in the crown controlled �rm.
Analyzing the implications of control structure and understanding the alignment of in-
centives within each �rm is a step forward in understanding the divergent performance of
merchant empires.
21

References
[1] Acemoglu, Daron, Simon Johnson, and James Robinson. 2005. "The Rise of Europe:
Atlantic Trade, Institutional Change, and Economic Growth." American Economic Re-
view 95(3): 546-579.
[2] Allen, Robert. 2001. "The Great Divergence in European Wages and Prices from the
Middle Ages to the First World War." Explorations in Economic History 38: 411-441.
[3] Barbour, Violet. 1930. "Dutch and English Merchant Shipping in the Seventeenth Cen-
tury." Economic History Review 2(2): 261-290.
[4] Barros, João. 1988. Ásia de João de Barros. Lisboa: Imprensa Nacional � Casa da
Moeda, (Orig. pub. 1552).
[5] Blair, Roger D. and Francine Lafontaine. 2005. The Economics of Franchising. Cam-
bridge, UK: Cambridge University Press.
[6] Braudel, Fernand. 1972. The Mediterranean and the Mediterranean world in the age of
Philip II. New York: Harper & Row.
[7] Brewer, John. 1989. The sinews of power: war, money, and the English state, 1688-1783.
New York: Alfred A. Knopf.
[8] Brito, Bernardo Gomes de. The Tragic History of the Sea 1559-1565. Translated and
edited from the original Portuguese by Charles R. Boxer. Cambridge: Published by the
Hakluyt Society at the University Press, 1968 [1735-6].
[9] Brito, Bernardo Gomes de. The Tragic History of the Sea 1589-1622. Edited from the
original Portuguese by Charles R. Boxer. Cambridge: Published by the Hakluyt Society
at the University Press, 1959 [1735-6].
[10] Burman, Jose. Great shipwrecks o¤ the coast of Southern Africa. Cape Town: Struik,
1967.
22

[11] Bruijn, J. R., F. S. Gaastra and I. Schö¤er editors, with assistance of E. S. van Eyck
van Heslinga, ed. 1987. Dutch-Asiatic shipping in the 17th and 18th centuries. Vol. I,
Introductory Volume. The Hague: Martinus Nijho¤.
[12] Cawston, George and A. H. Keane. 1896. The Early Chartered Companies (A.D. 1296-
1858). London, New York: E. Arnold.
[13] Charles Blunt of London: Account book. 1684-1722. Manuscript held by the British
National Archives (Ref. PRO, C114/165).
[14] Chaudhuri, K. N. 1965. The English East India Company: The Study of an Early Joint-
Stock Company 1600-1640. London: Frank Cass & Co Ltd.
[15] Columbus, Christopher. c1989. The Diario of Christopher Columbus�s �rst voyage to
America, 1492-1493. Abstracted by Fray Bartolomé de las Casas. Transcribed and trans-
lated into English, with notes and a concordance of the Spanish by Oliver Dunn and
James E. Kelley, Jr. Norman, OK : University of Oklahoma Press.
[16] Coornaert, E. L. J. 1967. "European Economic Institutions and the New World; the
Chartered Companies." In The Cambridge Economic History of Europe, ed.M.M. Postan
and H.J. Habakkuk, Vol. 4, 222-274. Cambridge, MA: at the University Press.
[17] Costa, Leonor Freire. 1997. Naus e galeões na ribeira de Lisboa: a construção naval no
século XVI para a Rota do Cabo. Cascais: Patrimonia.
[18] Costa, Leonor Freire. 2002.O Transporte no Atlântico e a Companhia Geral do Comércio
do Brasil (1580-1663). Vol. 1. Lisboa: Comissão Nacional para as Comemorações dos
Descobrimentos Portugueses.
[19] Daudin, Guillaume. 2005. Commerce et prospérité: La France du XVIIIe siècle. Paris:
PU Paris-Sorbonne.
23

[20] Davis, Lance and Douglass North. 1970. �Institutional Change and American Economic
Growth: A First Step Towards a Theory of Institutional Innovation.�Journal of Eco-
nomic History 30(1): 131-149.
[21] Davis, Lance, Robert Gallman and Karin Gleiter. 1997. In Pursuit of Leviathan �Tech-
nology, Institutions, and Pro�ts in American Whaling, 1816-1906. Chicago: The Uni-
versity of Chicago Press.
[22] De Sousa, Armindo. 1990. As Cortes Medievais Portuguesas (1385-1490). Vol. I. Porto:
Instituto Nacional de Investigação Cientí�ca �Centro de História da Universidade do
Porto.
[23] DeVries, Jan. 1984. European urbanization, 1500-1800. Cambridge, Mass.: Harvard
University Press.
[24] Dickson, Peter George Muir. 1967. The Financial Revolution in England: a study in the
development of public credit, 1688-1756. New York: St. Martin�s Press.
[25] Dietz, Frederick. 1964. Charles. English Public Finance, 1485-1641. Vol. I. 2nd ed.
London: Frank Cass and Co. Ltd.
[26] East India Company. 1893. The register of letters &c. of the Governour and Company of
Merchants of London trading into the East Indies, 1600-1619, ed. Sir George Birdwood.
London: Quaritch.
[27] Elbl, Martin. 1994. "The Caravel and the Galleon �The Caravel." In Cogs, Caravels and
Galleons: The Sailing Ship 1000-1650, ed. Robert Gardiner, 91-98. London: Conway
Maritime Press.
[28] Falcão, Luiz de Figueiredo. 1859. Livro em que se contém toda a fazenda real e
património dos reinos de Portugal, India e das ilhas adjacentes e outras particulari-
dades. Lisboa: Imprensa Nacional, (Orig. pub. ca1607).
24

[29] Feldbaek, Ole. 1981. �The Organization and Structure of the Danish East India, West
India and Guinea Companies in the 17th and 18th Centuries.�In Companies and Trade,
ed. Leonard Blussé and Femme Gaastra, 135-158. Leiden: Leiden University Press.
[30] Furber, Holden. 1976. Rival Empires of Trade in the Orient, 1600-1800. Minneapolis:
University of Minnesota Press.
[31] Glamann, Kristof. c1981. Dutch-Asiatic Trade: 1620-1740. Den Haag: Nijho¤.
[32] Godinho, Vitorino Magalhães. L�Économie de l�Empire Portugais aux XVe et XVIe
Siècles. Paris:S.E.V.P.E.N., 1969.
[33] Goldsmith, Raymond W. 1987. Premodern Financial Systems: a historical comparative
study. Cambridge, New York: Cambridge University Press.
[34] Gollin, Douglas. 2002. "Getting income shares right." Journal of Political Economy, 110
(2): 458-474.
[35] Greif, Avner. 1993. �Contract Enforceability and Economic Institutions in Early Trade:
The Maghribi Traders�Coalition.�American Economic Review, 83 (3): 525-548.
[36] Grossman, Sanford J. and Oliver Hart. 1986. �The Costs and Bene�ts of Ownership:
A Theory of Vertical and Lateral Integration.� Journal of Political Economy, 94(4):
691�719.
[37] Hart, Jonhathan. Comparing Empires �European Colonialism from Portuguese Expan-
sion to the Spanish-American War. New York : Palgrave Macmillan, 2003.
[38] Hart, Oliver and John Moore. 1990. �Property Rights and the Nature of the Firm.�
Journal of Political Economy, 98: 1119�158.
[39] Hermansson, Robert. 2004. The Great East India Adventure �the Story of the Swedish
East India Company. Göteborg: Breakwater Publishing.
25
[40] Hunter, William Wilson. 1919. A History of British India. London: Longmans, Green,
and co.
[41] Irwin, Douglas A. 1991. �Mercantilism as Strategic Trade Policy: The Anglo-Dutch
Rivalry for the East India Trade.�Journal of Political Economy, 99: 1296-1314.
[42] Jacobs, Els M. 1991. In Pursuit of Pepper and Tea: the Story of the Dutch East India
Company. Amsterdam: Netherlands Maritime Museum; Zuatphen: Walburg Pers.
[43] Koninckx, C. 1999. �Sweden and India in the Eighteenth Century: Sweden�s di¢ culty
in gaining access to a crowded market.�Merchants, Companies, and Trade: Europe and
Asia in the Early Modern Era, ed. Sushil Chaudhury and Michael Morineau. London,
New York: Cambridge University Press.
[44] Lanciani, Giulia. 1990. "Une Histoire Tragico-Maritime." In Lisbonne Hors des Murs
1415-1580 - L�Invention du Monde par les Navigateurs Portuguais, 89-117. Paris:
Autrement.
[45] Leahy, William. c2005. Elizabethan Triumphal Processions. Aldershot, Hants, England;
Burlington, VT: Ashgate.
[46] Legros, Patrick and Andrew F. Newman. 2008. "Competing for Ownership." Journal of
the European Economic Association, 6 (6): 1279-1308.
[47] Lequin, Frank. 1982. Het personeel van de Vereengide Oostindische Compagnie in Azie.
Leiden: F. Lequin.
[48] Letwin, William. 1965. Law and Economic Policy in America: The Evolution of the
Sherman Antitrust Act. New York: Random House.
[49] Luz, Francisco Paulo Mendes da. 1960. Livro das Cidades e Fortalezas, que a Coroa
de Portugal tem nas partes da India e das Capitanias, e mais cargos que nelas ha, e
26

da importância delles. Lisboa: Centro de Estudos Históricos Ultramarinos, (Orig. pub.
ca1582).
[50] Manning, Catherine. 1996. Fortunes a Faire � The French in Asian Trade, 1719-48.
Brook�eld, VT, USA: Ashgate Pub.
[51] Marques, Oliveira A. H. 1982. História de Portugal. Vols. 1 and 2. Lisboa: Palas Edi-
tores.
[52] Marsden, Peter. 2003. Sealed by Time �The Loss and Recovery of the Mary Rose. Vol.
1. The Mary Rose Trust.
[53] Martinez-Hidalgo, José Maria. 1966. Columbus�Ships. Barre Mass.: Barre Publishers.
[54] Munro, John. 1994. Handbook of European History 1400-1600 �Late Middle Ages, Re-
naissance and Reformation, ed. Thomas A. Brady, Jr., Heiko A. Oberman, and James
D. Tracy. Leiden; New York: E.J. Brill.
[55] North, Douglass C. 1991. "Institutions, Transaction Costs, and the Rise of Merchant
Empires." In The Political Economy of Merchant Empires � State power and World
trade 1350-1750, ed. James D. Tracy. New York: Cambridge University Press.
[56] North, Douglass and Barry Weingast. 1989. "Constitutions and Commitment: The
Evolution of Institutional Governing Public Choice in Seventeenth-Century England."
Journal of Economic History, 49(4): 803-832.
[57] Outhwaite, R. Brian. 1971. "Royal Borrowing in the Reign of Elizabeth I: The Aftermath
of Antwerp." English Historical Review, 86(339): 251-263.
[58] Phillips, Carla Rahn. 1994. "The Caravel and the Galleon �The Galleon." In Cogs, Car-
avels and Galleons: The Sailing Ship 1000-1650, ed Robert Gardiner, 98-114. London:
Conway Maritime Press.
27

[59] Pollard, Abert Frederick 1910. �Henry VIII.�In The Encyclopædia Britannica. Cam-
bridge, England: at the University Press.
[60] Pringle, Roger. 1980. A Portrait of Elizabeth I in the words of the Queen and her
contemporaries. Totowa, NJ: Barnes & Noble Books.
[61] Renault, Gilbert. 1959. The Caravels of Christ. London: Allen & Unwin.
[62] Sanceau, Elaine. 1967. Good Hope �the voyage of Vasco da Gama. Lisboa: Academia
Internacional da Cultura Portuguesa.
[63] Senhadji, Abdelhak. 2000. "Sources of Economic Growth: An Extensive Growth Ac-
counting Exercise." International Monetary Fund Sta¤ Papers, 47(1): 129-57.
[64] Serrão, Joaquim Veríssimo. 1980. História de Portugal. Vol. 2. A Formação do Estado
Moderno (1415-1495). 3rd revised ed. Lisboa: Editorial Verbo.
[65] Serrão, Joel. 1977. Cronologia Geral da História de Portugal. 3rd ed. Lisboa: Livros
Horizonte.
[66] Steensgaard, Niels. 1965. "Freight Costs in the English East India Trade 1601-1657."
Scandinavian Economic History Review, 13(2): 143-62.
[67] Steensgaard, Neils. 1970. �European Shipping to Asia 1497-1700.�Scandinavian Eco-
nomic History Review, 18(1): 1-11.
[68] Steensgaard, Niels. The Asian Trade Revolution of the Seventeenth Century �The East
India Companies and the decline of the Caravan Trade. Chicago: The University of
Chicago Press, 1974.
[69] Subrahmanyam, Sanjay. 1989. �The Coromandel Trade of the Danish East India Com-
pany, 1618-1649.�Scandinavian Economic History Review, XXXVII(1): 41-56.
28

[70] Unger, Richard W. 1978. Dutch Shipbuilding Before 1800. Amsterdam, Assen: Van
Gorcum.
[71] Vogt, John. 1979. Portuguese Rule on the Gold Coast 1469-1682. Athens: The University
of Georgia Press.
29

Figure 1: European Shipping to Asia
0.0
0.2
0.4
0.6
0.8
1.0
14911
500
15111
520
15311
540
15511
560
15711
580
15911
600
16111
620
16311
640
16511
660
16711
680
16911
700
% o
f tot
al to
nnag
ePT
ENNL
FRDN
Source: Steensgaard (1970).
Figure 2: Outcome on the Pareto Frontier
A•
(λc, 0) u
MC
KC
v
(0, λc)
30

Table 1: Portuguese discoveries and conquests in the �fteenth centuryYear Location Region
1415 Ceuta Northern Africa1419 Madeira Islands Atlantic Islands1421 Cape Não West African coast1427 Azores Islands Atlantic Islands1434 Cape Bojador West African coast1436 Gold River West African coast1442 Cape Branco West African coast1443 Cape Verde –Senegal West African coast1446 Grande River West African coast1446 Guinea West African coast1458 ElQsaresSeghir Northern Africa1460 Cape Verde Islands and Sierra Leone West African coast1471 Asilah and Tangier Northern Africa1471 Gulf of Guinea West African coast1474 Cape Saint Catherine West African coast1481 Mina –Ghana West African coast1482 Congo River West African coast1487 Cape of Good Hope Southern African coast1489 Sofala –Mozambique East African coast1498 Calicut –India East
Source: Serrão (1980:175).
Table 2: Frequency of assemby of cortes from 1385 to 1580Average interval (years) between meetings
13851414 1.514171495 3.014981580 9.1
Source: Serrao (1977), lists all years in which meetings were held.Note: I calculated the average interval between meetings in the three subperiods.
31

Table 3: Estimated returns of the Portuguese expansion (Kg of Gold)Cost
RevenueRevenue
wL rK – α1615 rK – α1859 wL + rK1415a 97.3 21.5 116.1 1419 1.4 0.3 1.8 1421 1.5 0.3 1.8 1427 2.2 0.5 2.6 1434 2.4 0.5 2.9 1436 2.6 0.6 3.1 1442 3.5 0.8 4.2 1443 4.7 1.0 5.6 1446 6.2 1.4 7.4 1458a 75.1 16.6 89.6 1460 3.0 0.7 3.6 1471a 139.5 30.9 166.5 3,620b 11.821.21471 4.2 0.9 5.0 1474 12.7 2.8 15.2 1481 7.3 1.6 8.7 1482 14.6 3.2 17.4 1487 21.7 4.8 25.9 226.3c 4.88.51488 28.7 6.3 34.2 226.3c 3.66.51489 226.3c 1494 649.7c 1495 649.7c 1496 649.7c 1497 372.6c 1498 29.7 6.6 35.4 372.6c 5.710.31499 372.6c 1500 372.6c Notes: aMilitary expeditions; bLoot from Asilah (Renault 1959:71); cEntries of gold in the Lisbon mint from the GoldCoast only (Vogt 1979:2179). Vogt's series goes from 1481 to 1572 and is more precise for later years. Early yearscalculated by averaging the total quantity of gold that the head of the Lisbon mint received over his mandate (34 years).
Table 4: Forced loans by the late Tudors and early StuartsAmount Interest rate
1598 £20,000 ?1600 £23,200 ?16045 £111,891 1016112 £116,381 101617 £96,466 101625 £60,000 8
Sources: North and Weingast (1989:820); Dietz (1964:64).
Table 5: Cost of the East India Company voyages in the �rst 15 yearsVoyage #
Shipssent out
Cost of Shipsand Victuals
DiscountedCost (1601)
1601 1 4 £39,771 £39,7711604 2 4 £48,150 £36,1761607 3 3 £28,620 £16,1551608 4 2 £14,000 £7,4921609 5 1 £6,000 £2,7991610 6 3 £32,200 £13,6561611 7 4 £42,500 £16,3861612 8 4 £48,700 £17,0691612 9 1 £5,300 £1,858161316* 1013 29 £272,544 £75,700Totals 14 55 £538,385 £227,062
Source: Hunter (1919:291, 307)Note:*First joint stock, as opposed to the prior system of separate voyages.
32
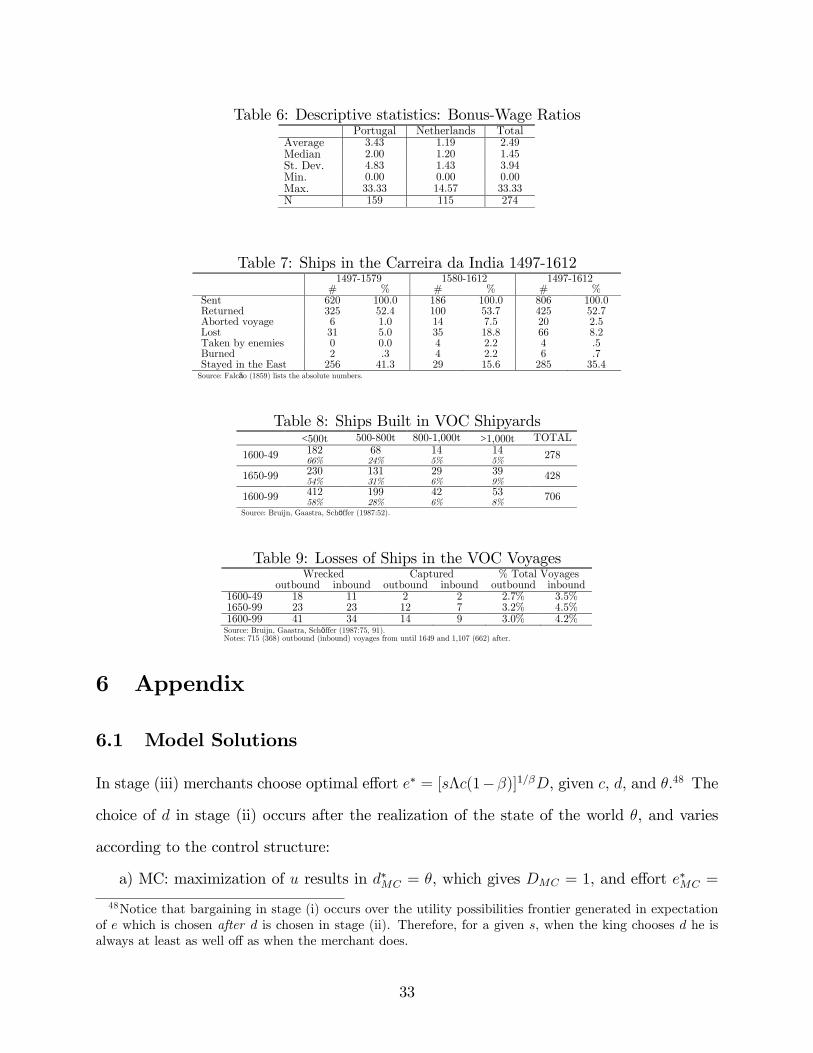
Table 6: Descriptive statistics: Bonus-Wage RatiosPortugal Netherlands Total
Average 3.43 1.19 2.49Median 2.00 1.20 1.45St. Dev. 4.83 1.43 3.94Min. 0.00 0.00 0.00Max. 33.33 14.57 33.33N 159 115 274
Table 7: Ships in the Carreira da India 1497-161214971579 15801612 14971612
# % # % # %Sent 620 100.0 186 100.0 806 100.0Returned 325 52.4 100 53.7 425 52.7Aborted voyage 6 1.0 14 7.5 20 2.5Lost 31 5.0 35 18.8 66 8.2Taken by enemies 0 0.0 4 2.2 4 .5Burned 2 .3 4 2.2 6 .7Stayed in the East 256 41.3 29 15.6 285 35.4
Source: Falcão (1859) lists the absolute numbers.
Table 8: Ships Built in VOC Shipyards<500t 500800t 8001,000t >1,000t TOTAL
160049 182 68 14 14 27866% 24% 5% 5%
165099 230 131 29 39 42854% 31% 6% 9%
160099 412 199 42 53 70658% 28% 6% 8%
Source: Bruijn, Gaastra, Schöffer (1987:52).
Table 9: Losses of Ships in the VOC VoyagesWrecked Captured % Total Voyages
outbound inbound outbound inbound outbound inbound160049 18 11 2 2 2.7% 3.5%165099 23 23 12 7 3.2% 4.5%160099 41 34 14 9 3.0% 4.2%
Source: Bruijn, Gaastra, Schöffer (1987:75, 91).Notes: 715 (368) outbound (inbound) voyages from until 1649 and 1,107 (662) after.
6 Appendix
6.1 Model Solutions
In stage (iii) merchants choose optimal e¤ort e� = [s�c(1��)]1=�D, given c, d, and �.48 The
choice of d in stage (ii) occurs after the realization of the state of the world �, and varies
according to the control structure:
a) MC: maximization of u results in d�MC = �, which gives DMC = 1, and e¤ort e�MC =
48Notice that bargaining in stage (i) occurs over the utility possibilities frontier generated in expectationof e which is chosen after d is chosen in stage (ii). Therefore, for a given s, when the king chooses d he isalways at least as well o¤ as when the merchant does.
33

[s�c(1� �)]1=�. Utilities for merchants and king are u�MC =�1�� [s�c(1� �)]
1=�, and v�KC =
1�ss(1��) [s�c(1� �)]
1=� + �;
b) KC: maximization of v results in d�KC = � + s(1��)(1�s)[s�c(1��)]1=� > � = d�MC , generat-
ing a distorted value of DKC = 1 � 2s2(1��)22(1�s)2[s�c(1��)]2=� , which gives e¤ort e
�KC = [s�c(1 �
�)]1=� � 2s2(1��)22(1�s)2[s�c(1��)]1=� . Utilities for merchants and king are u
�KC =
�1�� [s�c(1� �)]
1=� � 2s2�(1��)
2(1�s)2[s�c(1��)]1=� , and v�KC =
1�ss(1��) [s�c(1� �)]
1=� + 2s(1��)2(1�s)[s�c(1��)]1=� + �.
Varying s will change e�, d�, and the utility pair (u�; v�) which result in a concave frontier
for each control structure, as shown in Figure 3 for all interior solutions e > 0.49
Figure 3: Utility Possibilities Frontiers
u
MC
KC
v
Only the decreasing portions of either frontier are relevant to the analysis as they con-
stitute the set of pareto dominating sharing rules: increasing the share of any given party
increases its utility without raising the other party�s. Also pareto-dominated is the decreas-
ing portion of MC (KC) that lies below KC (MC). Therefore the dashed portions are dropped
from the analysis in section 2.
The merchants�share s, increases as we move to the right on either frontier, increasing49Parameter values: � = 2, c = 1, � = :5, = :26 and � = :7.
34

e� and also u: the rise in share of output more than compensates merchants�disutility of
e¤ort. Moving up on either frontier increases the king�s share (1� s), and despite the lower
e¤ort level e� (@e=@s > 0 merchants have little incentive to work hard the higher the share
going to the king) the king gets better o¤: the increase in the king�s share compensates the
lower output under MC, while under KC the king is getting utility from increased d.
It can be shown that u = �1��e
� under either control structure, so if e�MC > e�KC then
u�MC > u�KC , that is, merchants are always better o¤ under MC, which is visible in Figure
2. On the other hand, because d�KC > d�MC , the king is always better o¤ when in control
v�KC > v�MC , despite the lower level of output under this control structure. The consequences
of control allocation have tangible impacts on the venture�s business decisions d (such as the
size of ships), on how much the merchants get invested in the venture e (and on the venture�s
viability � as a consequence), and also on the generated social surplus u+ v.
6.2 Voyage Requirements
The voyage from Lisbon to Ceuta lasted 28 days, but chroniclers are imprecise about other
numbers involved in this conquest. Serrão (1980:22), for example, reports 225 ships, and
45,000 men, which would give an average of 200 men per ship �possibly more, as several
ships could have been employed in food storage, quite common practice in long voyages
and/or large crews. However, two hundred men per ship is likely to be an overstatement for
two reasons: (1) caravels, very much used in the 1400s, had modest crews of 20 to 40 men
(Martinez-Hidalgo 1966). This lower crew size, however, may have been rule in discovery
voyages, but not necessarily in military ventures; (2) Hunter (1919:159-161) provides numbers
for military operations in the Indian Ocean in the sixteenth century. By then ships had
increased in size and crews could be as large as 700 men per ship in larger vessels (Marsden
2003). In all battles for which Hunter provides numbers for ships as well as men, the average
is 50 to 75 men per ship. Evidence from shipping technology and other battles seems to
dismiss the idea of a large army of 45,000 men in the conquest of Ceuta. Taking the upper
35

bound of the caravel crew (40 men), I multiply it by the 225 ships reported in the chronicle
(probably also overstated) to get a total of 9,000 men involved in this particular venture,
surpassing all but one of the numbers provided by Hunter.
In the case of exploration voyages, historical records often report only number and type
� barca or caravel � of ship.50 Because barcas were larger than caravels (Elbl 1994:92), I
assume a crew size of 60 (40 for caravels). Exploration voyages pre-1471 (until the Gulf of
Guinea) were of pure exploration with very uncertain return, for which the monarch would
send only one barca, such as in the 1419 voyage to the Madeira islands. Voyages after 1471,
were directly engaged in the search for the Eastern passage, in which case I assume they
were of the same size as Da Gama�s voyage in 1498 �170 men and four ships. Da Gama�s
expedition returned to Lisbon with only two ships and �fty-�ve (very sick) men on board.
My calculations, however, take into account the full original investment, that is costs of men
and ships sent.
6.3 Labor Share Calculations
Portuguese India ship, 1615
1. New ship (11,150$000 reis) in the India trip and associated cost of wages and victuals
(2,100$000 reis - four months, or 525$000 reis a month) for a crew of 123 (Falcão 1859:205).
2. Assuming each round-trip to India lasted twenty-four months (Steensgaard 1965)51
I then multiply the monthly value of wages and victuals by 24 months and calculate total
labor cost wL1615 for the India trip as 12,600$000.
3. Assuming each ship made only four round trips (Phillips 1994:102, Steensgaard 1965)
50For instance, the Madeira islands were discovered in 1419 by a single barca, originally sent to explorethe African coast, but there is no information on the labor requirement for this expedition (Barros 1988).51In theory, the round-trip to India could take less than two years given that the outward trip to Asia
lasted 6-8 months and 7-9 months home (Steensgaard 1965). The weather conditions, however, dictated theoptimal times of departure (from Europe in April, and from India in December) in order to avoid winters onthe Cape and monsoons in the Indian Ocean. The time of absence of the ships was also a¤ected by politicalissues such as the need of �eets to �ght in the Indian Ocean. Steensgaard (1965) notes a decline (below 24months) in the time of absence of Dutch ships only after 1640.
36

to India I divide the original capital cost by four and calculate the capital cost rK1615 for a
ship in the India trip as 2,787$500.
4. Plugging the values for wL1615 and rK1615 in the labor share formula we get �1615 =
1
1+ 2;787$50012;600$000
= :8188.
5. I omit the value of cargo because I am measuring the cost of �fteenth century explo-
ration voyages, in which ships were not loaded with bullion.
Portuguese ships to Brazil, 1633 and 1580-1640
Costa�s detailed study on Portuguese Atlantic transportation to Brazil provides speci�ed
costs for the production of a 600 ton ship in 1633 and also estimated daily costs for the same
type ship in the periods 1580-1601, 1602-1614, 1615-1623, and 1624-1640 (Costa 2002:866).
For the 1633 ship the values are:
1. Wages and victuals for 210 days: 994$980 reis = wL1633.
2. Cost of the ship and artillery: 2,460$000 reis.
3. Again assuming a life time for the ship of 4 round-trips rK1633 = 615$000 reis.
4. Labor share yields �1633 = 1
1+ 615$000994$980
= :6180.
Table 10: Labor share: Portuguese shipping to BrazilWages and victualsa Shipb Ship
(1 voyage) α15801601 2$106 4$210 1$052.5 .666816021614 1$600 3$210 0$802.5 .666016151623 2$887 5$790 1$447.5 .666116241640 2$671 5$420 1$355.0 .6634
Source: Costa (2002:367) reports a and b.Note: Costa does not take into account fixed capital depreciation: labor share calculations with the total value of the shipfor the periods of analysis yield the same as the calculations with the total value for the 1633 episode. I therefore dividethe value of the ship by four, since the reported cost of ships and victuals is for the 210 day voyage.
Using daily costs per 600 ton ship and making the necessary adjustments, the estimated
costs are 9 to 31 times smaller than the given revenues, perhaps re�ecting shorter duration
of seventeenth century trips. Return ratios would even be more magni�ed had I de�ated
seventeenth century numbers.
37

English Merchant ship, 1693
Table 11: Labor cost calculation: English merchant shipBoatsmarins 35Gunners 30Carpenters 60Coopers 10Cooks 25Cash for beer and water 105Provisions for 100 men for 24 months 1900
Cost of Labor per trip (wL) £2,165
Table 12: Capital cost calculation: English merchant shipShip 300 tons 1800New ropes and store of others 560Rigging and two suits of sails 325Blockmaker 35Long boat 30Sheathing 150Nails 176Iron work 45Anchors and spare 10020 guns 96Iron crows 2020 barrels 70Small arms for 100 men 100Dry casks 35Brazer for hearth and bell 65Other costs 30River clearing at launch and stock to sea 200
Cost of capital per trip (rK) £984.25Source: Manuscript: Charles Blunt of London: Account book (16841722) available in the British National Archives (Ref.PRO, C114/165).Note: In the cost of capital per trip I assume that each merchant ship makes four round trips only.
�1693 =1
1+$984:25$2;165
= :6875.
38
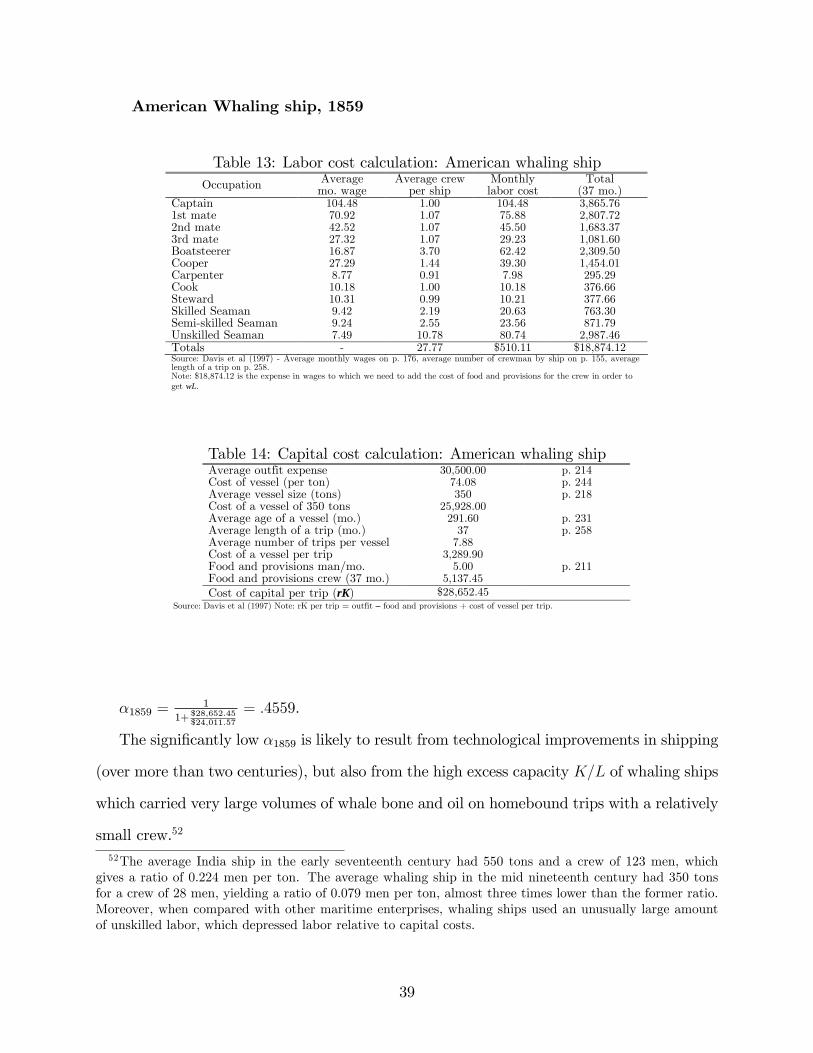
American Whaling ship, 1859
Table 13: Labor cost calculation: American whaling shipOccupation
Averagemo. wage
Average crewper ship
Monthlylabor cost
Total(37 mo.)
Captain 104.48 1.00 104.48 3,865.761st mate 70.92 1.07 75.88 2,807.722nd mate 42.52 1.07 45.50 1,683.373rd mate 27.32 1.07 29.23 1,081.60Boatsteerer 16.87 3.70 62.42 2,309.50Cooper 27.29 1.44 39.30 1,454.01Carpenter 8.77 0.91 7.98 295.29Cook 10.18 1.00 10.18 376.66Steward 10.31 0.99 10.21 377.66Skilled Seaman 9.42 2.19 20.63 763.30Semiskilled Seaman 9.24 2.55 23.56 871.79Unskilled Seaman 7.49 10.78 80.74 2,987.46Totals 27.77 $510.11 $18,874.12Source: Davis et al (1997) Average monthly wages on p. 176, average number of crewman by ship on p. 155, averagelength of a trip on p. 258.Note: $18,874.12 is the expense in wages to which we need to add the cost of food and provisions for the crew in order toget wL.
Table 14: Capital cost calculation: American whaling shipAverage outfit expense 30,500.00 p. 214Cost of vessel (per ton) 74.08 p. 244Average vessel size (tons) 350 p. 218Cost of a vessel of 350 tons 25,928.00Average age of a vessel (mo.) 291.60 p. 231Average length of a trip (mo.) 37 p. 258Average number of trips per vessel 7.88Cost of a vessel per trip 3,289.90Food and provisions man/mo. 5.00 p. 211Food and provisions crew (37 mo.) 5,137.45
Cost of capital per trip (rK) $28,652.45Source: Davis et al (1997) Note: rK per trip = outfit – food and provisions + cost of vessel per trip.
�1859 =1
1+ $28;652:45$24;011:57
= :4559.
The signi�cantly low �1859 is likely to result from technological improvements in shipping
(over more than two centuries), but also from the high excess capacity K=L of whaling ships
which carried very large volumes of whale bone and oil on homebound trips with a relatively
small crew.52
52The average India ship in the early seventeenth century had 550 tons and a crew of 123 men, whichgives a ratio of 0.224 men per ton. The average whaling ship in the mid nineteenth century had 350 tonsfor a crew of 28 men, yielding a ratio of 0.079 men per ton, almost three times lower than the former ratio.Moreover, when compared with other maritime enterprises, whaling ships used an unusually large amountof unskilled labor, which depressed labor relative to capital costs.
39

6.4 Other Countries
Denmark
Chartered in 1616, the Danish East India Company had very limited trade within Asia,
when compared to the English or the Dutch counterparts, since it was centered mainly on
the south coast of India and Ceylon.
Similar to the EIC, the Danish company was chartered after a proposal was brought
before the king by two Dutch merchants, with the objective of competing with the EIC and
the VOC. The company faced capital problems from the start and the monarch had to exert
royal pressure to furnish the �rst share of capital (180,000 rd.), which was subscribed to by
about 300 shareholders. The royal family contributed with 12.5%, the nobility with 15.5%,
citizens of Copenhagen and the university with 35%, citizens of other towns of Denmark with
29.5% and foreign capital 7.5% (Feldbaek 1981:139-140). The monopoly of trade between
Denmark and Asia was chartered to the company for a period of twelve years.
Initially the company was very much in�uenced by its Dutch counterpart as opposed to
the English: intra-Asian (rather than Euro-Asian) trade dominated the administration of the
company (Subrahmanyam 1989). The king�s role was decisive in maintaining the company
alive in the 1630s-40s after the ruinous Danish participation in the Thirty Years�War, a
major disturbance in the company�s operations. By 1630, the king owned half of the shared
capital and e¤ectively controlled the company: not only did the board of directors function
practically as a group of civil servants, but also the original shareholders withdrew and were
substituted by others on whom the king could exert investment pressure (Feldbaek 1981).
In the reorganization of the company according to the French model in 1670, again the king
was the chief supplier of capital, while insisting on the support of Copenhagen merchants
(Furber 1976).
The Danish case o¤ers a hybrid situation. The �nancial constraint of the king is evident
as he encouraged or forced private investment in the company. According to the model, the
40

disagreement point lies somewhere in the segment ((0; �c); (�c; 0)) and any organizational
form is possible: history shows the Danish king franchising out long-distance trade, but still
able to control the company for periods of time.
France
The French Company was chartered in 1664 to direct French trade with the Eastern Hemi-
sphere. The government not only took part in the foundation (sometimes even the initiative),
but also recruited members, named directors and procured the capital needed (Coornaert
1967). There was never a body of directors, and high ranked o¢ cials were appointed by the
ministries. The initial capital stock of 15 million livres was in fact a forced loan launched by
the royal subscription of 3 million �total subscriptions amounted only to 8,179,885 livres,
in which merchants were a feeble minority �only 650,000 livres subscribed by the Parisian
mercantile community (Furber 1976:203).
The Company�s monopoly of French trade with the East was leased to groups of mer-
chants, whose contracts were initially valid for single voyages and later for periods of three
and ten years, whereas the company�s charter was valid for a period of �fty years (Manning
1996).
The king was such a central �gure in the company that this organizational form is some-
where in the middle of the two extreme cases of private and crown monopoly. Private
merchants were allowed to freight goods from the Indies on the company�s ships or on their
own, which proved to be a successful fund-raising method for the company.
The continuous mixture of private and royal interests can also be seen in other episodes of
the company�s history, such as the case of the drained �nances due to participation in the war
of Spanish succession when the company turned to the Crown for a loan. The king agreed
with the condition that the directors each put up a certain amount and the stockholders
50% of the value of their holdings (Furber 1976:207).
France o¤ered special conditions that allowed for this hybrid case to persist overtime:
41

on the one hand, private merchants were reluctant to invest in a company they could never
control as there were no shareholder meetings; on the other, the French state was su¢ ciently
decentralized, which inhibited the merge of the company into a department of state as in
the Portuguese case (Manning 1996:24).
The involvement of the king in the private enterprise is unusual from the standpoint of
the franchised structure. Similar to the Danish case in which the king could not initially
supply all capital for the enterprise but had to raise the rest through forced loans, the French
monarch was also indeed capital constrained. As a result, long-distance trade was franchised
out. France o¤ers another hybrid result because the king was able to exert some control over
the destinies of the company even if not owning the monopoly.
The Netherlands
Since 1595, Dutch merchants were organized in small companies, which sent ships to the
East in order to break the Portuguese 100-year monopoly of Indian spices in Europe. Even
though the �rst voyage was not a commercial success, it showed that Dutch shipping to Asia
via the Portuguese controlled cape-route was possible �a big achievement, compared to the
failed attempts of other merchants in the search for the passage to Asia via the North Arctic
Ocean (Jacobs 1991). Between 1595 and 1601 eight di¤erent companies dispatched �eets
to the East, some being extremely successful, others complete failures. The success soon
turned against Dutch entrepreneurs. On the supply side, competition among Dutch ships
was e¤ectively rising Asian spice prices whereas in Europe, prices were falling due to too
much quantity available. The small companies came to a merger agreement encouraged by
the government of the Dutch republic �the States-General.
Founded in 1602 the VOC o¤ered a slightly di¤erent organization form from the EIC�s.
There was no body of company shareholders distinct from the chambers�shareholders, which
would give no power to smaller shareholders. The main contributions of capital came from
the chambers of Amsterdam (57.2%) and Zeeland (20.2%) and therefore these two chambers
42

dominated the decisions of the company (Furber 1976:188).
The VOC had a central management unit of seventeen delegates, coming from all six
chambers. These delegates e¤ectively governed the company. According to the 1602 charter,
if the assembly (of the chambers) did not come to an agreement on a question, this was to
be decided by the States General (Glamann 1981).
The 1602 charter was conceded for a period of twenty-one years. A renewal was granted
in 1623 for another twenty-one years, but afterwards the renewal periods were extended: in
1647 the charter was renewed for twenty-�ve years and in 1696 for forty years. With the
exception of 1623, each renewal corresponded to a payment to the Government, which was
considered the price for the monopoly of the India trade even though the Company paid an
annual amount to the Government in the form of convoy and license money for the protection
it enjoyed in times of war by convoying (Glamann 1981:6-7). The initial payment of 25,000
�. (0.4% of the initial capital stock) was waived by the Government as the state�s modest
contribution to the assets of the company (Glamann 1981:6).
The very small participation of the Government in the initial venture may be indicative
of its cash constraint, which is not surprising in light of the Eighty Years War (1566-1648)
between Spain and the United Provinces, from which the independent Netherlands emerged.
The subsequent payments to the Government for the renewal of the charter (1.5 million �.
in 1647 and 3 million �. in 1696) continue to indicate a constrained central power. The
model implication of franchise follows naturally in the Dutch case.
Sweden
From its start, the Swedish East India venture was pressed by �nancial constraints. As early
as 1626, a merchant obtained a charter to trade with the East for a period of twelve years.
But the Swedish entry into the Thirty Years�War in 1630, consumed all the kingdom�s
available resources. After the peace treaty of Westphalia in 1648, new attempts were made
to re-launch the Swedish Asian trade, but again armament was given priority over trade
43

(Hermansson 2004:9). The constant participation of Sweden in armed con�icts over the late
seventeenth and early eighteenth centuries (coinciding with the belligerent reign of Charles
XII, 1697-1718) made it di¢ cult to engage in overseas trade.
A few petitions for charters of Eastern trade were �led by merchants in the decade
after Charles�death, but all were refused by the Parliament �capital was still insu¢ cient
(Hermansson 2004:10). Only in 1731 was a petition successful, when a number of �nanciers
shifted their money away from the discharged Ostende Company dissolved that same year.53
The charter was valid for a period of �fteen years and granted the company the sole right
to carry Swedish trade and shipping to the east of Cape of Good Hope. It was subsequently
renewed four times for periods of twenty years (Koninckx 1999).
There were no restrictions on foreign capital �nancing the company, but board members
were required to be "Swedish citizens of Protestant faith" (Hermansson 2004:30).54 The
board was composed by 4 directors (two of French and Scottish origin), one of which had
previously worked for the Ostende Company, showing capital was in fact very much circu-
lating throughout Europe at this time: even a small and remote kingdom like Sweden could
attract foreign capital with the purpose of Eastern trade.
The Swedish Company was a late comer into Eastern trade, only launched in the eigh-
teenth century, when all its counterparts emerged in the seventeenth. This factor together
with the willingness to overlook citizenship in the higher interest of attracting capital seem
to indicate that the whole kingdom was cash constrained, therefore making the franchising
of long-distance trade the best option for the Swedish monarch.
53This episode shows not only that merchant capital was pretty much circulating in Europe by the eigh-teenth century, but also that kings were relatively more abundant giving them less bargaining power, whichwould con�rm the predictions of the model.54Swedish citizenship could be arranged if the person resided in Sweden, was interested, and had the
su¢ cient requisite knowledge and capital.
44

Figure4:PortugueseMerchantEmpireintheSixteenthCentury
45