title: introducing a 2100-0530 watershed on tv …...1 title: introducing a 2100-0530 watershed on...
TRANSCRIPT

1
Title: Introducing a 2100-0530 watershed on TV advertising of HFSS (food and drink that are High in Fat, Salt and Sugar) products and similar protection for children viewing adverts online IA No: 13013 RPC Reference No: N/A Lead department or agency: Department for Digital, Culture, Media & Sport Other departments or agencies: Department for Health and Social Care
Impact Assessment (IA) Date: 14/03/2019
Stage: Development/Options
Source of intervention: Domestic
Type of measure: Updates to industry co-regulation system Contact for enquiries: Childhood Obesity Team Email: [email protected]
Summary: Intervention and Options RPC Opinion: Not Applicable
Cost of Preferred (or more likely) Option Total Net Present Value
Business Net Present Value
Net cost to business per year(EANDCB in 2016 prices)
One-In, Three-Out
Business Impact Target Status
£2.7bn -£70m £4m N/A 21 What is the problem under consideration? Why is government intervention necessary? Childhood obesity is one of the biggest health problems this country faces. Obesity is a major cause of ill health in the UK, increasing the risk of developing heart disease, stroke, type II diabetes and cancer. Relatively small but consistent levels of excessive calorie consumption is the key driver of obesity. Evidence shows that children’s food preferences, purchases and consumption can be influenced by advertising.
What are the policy objectives and the intended effects? The policy aims to influence children’s consumption behaviour, by reducing the amount of advertising that they see for HFSS products on television and online, therefore reducing the likelihood of them consuming excess amounts of HFSS products, purchasing these products directly or influencing family purchases of these products. By limiting when HFSS products can be marketed, the proposed policy options aim to reduce children’s exposure to HFSS advertisements and provide incentives to food and drink manufacturers to advertise healthier products within their ranges or reformulate their products to be healthier.
What policy options have been considered, including any alternatives to regulation? Please justify preferred option (further details in Evidence Base)
The consultation document outlines three proposed policy options to restrict HFSS advertising on broadcast and four for online. These options could be implemented in several different combinations. For this IA we have modelled four possible combinations. We are seeking further views and evidence on all options, with the intention to model all options fully at final stage. The modelled options are as follows: Option A - ‘Do nothing’ - Retain current set of food advertising restrictions for broadcast TV and online. Option B - Advertising restriction on HFSS products in scope of the Soft Drinks Industry Levy (SDIL), and PHE’s Sugar and Calorie Reduction Programmes, applied on broadcast TV only, via a 2100-0530 watershed. Option C - Advertising restriction on HFSS products in scope of the SDIL, and PHE’s Sugar and Calorie Reduction Programmes. Applied via a 2100-0530 watershed on broadcast TV and online. Option D - Advertising restriction on HFSS products in scope of the SDIL, and PHE’s Sugar and Calorie Reduction Programmes. Retain the current restrictions for broadcast TV and introduce a 2100-0530 watershed online. The Government has no preferred option. The choice will be informed by the consultation exercise. For the purposes of this document only, option C is presented as the preferred option.
Will the policy be reviewed? Yes If applicable, set review date: 2024
Does implementation go beyond minimum EU requirements? N/A
Are any of these organisations in scope? Micro Yes
Small Yes
Medium Yes
Large Yes
What is the CO2 equivalent change in greenhouse gas emissions? (Million tonnes CO2 equivalent)
Traded:
Non-traded:
I have read the Impact Assessment and I am satisfied that, given the available evidence, it represents a reasonable view of the likely costs, benefits and impact of the leading options.

2
Signed by the responsible :
Date: 14 March 2019

3
Summary: Analysis & Evidence Policy Option B Description: Advertising restriction on HFSS products in scope of the SDIL, and PHE’s Sugar and Calorie Reduction Programmes, applied on broadcast TV only, via a 2100-0530 watershed. FULL ECONOMIC ASSESSMENT
Price Base Year
PV Base Year
Time Period Years
Net Benefit (Present Value (PV)) (£m)
2016 2017 25 Low: 1,840 High: 2,320 Best Estimate: 2,080
COSTS (£m) Total Transition (Constant Price) Years
Average Annual (excl.Transition)(Constant Price)
Total Cost (Present Value)
Low 0.5 1 79 1,330 High 1.5 1 160 2,700 Best Estimate 1 1 116 1,960 Description and scale of key monetised costs by ‘main affected groups’
Over 25 years broadcasters costs from lost HFSS advertising revenue are £1.9bn, and advertising agencies are expected to lose commission of £26m. Costs to manufacturers and retailers from reduced HFSS sales are around £27m. The transition costs are £1m and fall mainly to TV broadcasters, ad agencies, retailers and manufacturers and regulators.
Other key non-monetised costs by ‘main affected groups’ Other businesses indirectly affected by the losses to broadcasters, advertising agencies and manufacturers / retailers. For example, businesses employed to film or produce HFSS TV adverts. There may also be transition costs specific to broadcasters such as scheduling changes or cancelled contracts with advertising agencies.
BENEFITS(£m) Total Transition (Constant Price) Years
Average Annual (excl.Transition)(Constant Price)
Total Benefit (Present Value)
Low Optional Optional 3,170 High Optional Optional 5,010 Best Estimate N/A N/A 4,040 Description and scale of key monetised benefits by ‘main affected groups’ Lower calorie consumption by children over their lifetimes is expected to generate health benefits – estimated at around £1.4bn. There would be additional health benefits to the population from reinvesting cost savings back into the NHS, these are estimated to be worth around £0.6bn. Social care savings are estimated at around £40m and reduced premature mortality would be expected to deliver an additional £31m of economic output. Other forms of media are also expected to gain £1.6bn worth of additional revenue due to advertising being displaced from TV. Likewise HFSS retailers and manufactures are expected to gain £0.3bn in advertising cost savings. Other key non-monetised benefits by ‘main affected groups’ Children will experience additional health benefits associated with reduced obesity related ill health and from lower salt, sugar and fat consumption. Reformulation of HFSS products may result in additional nutritional benefits for the population. Adults might also experience significant health benefits from reduced exposure.
Key assumptions/sensitivities/risks Discount rate (%) 3.5/1.5% Key assumptions in the analysis include that HFSS advertising is displaced to other media and manufacturers/retailers are expected to experience cost savings from no longer advertising on TV. Health benefits require the direct impacts of the intervention to be maintained and are based on laboratory studies investigating the impact of HFSS TV advertising exposure on children's consumption. A discount rate of 1.5% is applied to health impacts and 3.5% to all other monetised impacts. The total broadcasting revenue at risk is from HFSS advertising on channels that reach over 1% of the UK child audience (this threshold is applied to TV only) during 0530 to 2100. Online HFSS spend and impacts have been scaled using data from Comscore. BUSINESS ASSESSMENT (Option B)
Direct impact on business (Equivalent Annual) £m: Score for Business Impact Target (qualifying provisions only) £m:
Costs: Benefits: Net: 115 112 3 16

4
Summary: Analysis & Evidence Policy Option C Description: Advertising restriction on HFSS products in scope of the SDIL, and PHE’s Sugar and Calorie Reduction Programmes. Applied via a 2100-0530 watershed on broadcast TV and online. FULL ECONOMIC ASSESSMENT
Price Base Year
PV Base Year
Time Period Years
Net Benefit (Present Value (PV)) (£m)
2016 2017 25 Low: 2,400 High: 3,010 Best Estimate: 2,730
COSTS (£m) Total Transition (Constant Price) Years
Average Annual (excl.Transition)(Constant Price)
Total Cost (Present Value)
Low 0.5 1 102 1,700 High 1.5 1 205 3,450 Best Estimate 1 1 149 2,500 Description and scale of key monetised costs by ‘main affected groups’
Over 25 years Broadcasters costs from lost HFSS advertising revenue are £1.9bn and advertising agencies are expected to lose commission of £35m. Cost to manufacturers and retailers from reduced HFSS sales are £35m. Transition costs are estimated at £1m and fall mainly to TV broadcasters, advertising agencies, retailers and manufacturers and regulators and online platforms. Costs to online platforms and advertising intermediaries are £0.5bn in total.
Other key non-monetised costs by ‘main affected groups’ Other businesses indirectly affected by the losses to broadcasters, online platforms, advertising agencies and manufacturers / retailers. For example, businesses employed to film or produce HFSS TV adverts. There may also be transition costs specific to broadcasters such as scheduling changes.
BENEFITS(£m) Total Transition (Constant Price) Years
Average Annual (excl.Transition)(Constant Price)
Total Benefit (Present Value)
Low Optional Optional 4,100 High Optional Optional 6,460 Best Estimate N/A N/A 5,240 Description and scale of key monetised benefits by ‘main affected groups’ Lower calorie consumption by children over their lifetimes is expected to generate health benefits – estimated at around £1.9bn. There would be additional health benefits to the population from reinvesting cost savings back into the NHS, these are estimated to be worth around £0.8bn. Social care savings are estimated at around £52m and reduced premature mortality would be expected to deliver an additional £41m of economic output. Other forms of media are expected to gain £2bn worth of revenue due to HFSS advertising being displaced from TV and online. Likewise HFSS retailers and manufactures are expected to gain £0.5bn in advertising cost savings. Other key non-monetised benefits by ‘main affected groups’ Children will experience additional health benefits associated with reduced obesity related ill health and from lower salt, sugar and fat consumption. Reformulation of HFSS products may result in additional nutritional benefits for the population. Adults might also experience significant health benefits from reduced exposure.
Key assumptions/sensitivities/risks Discount rate(%) 3.5 / 1.5% Key assumptions in the analysis include that HFSS advertising is displaced to other media and manufacturers/retailers are expected to experience cost savings from no longer advertising on TV or online. Health benefits require the direct impacts of the intervention to be maintained and are based on laboratory studies investigating the impact of HFSS TV advertising exposure on children's consumption. A discount rate of 1.5% is applied to health impacts and 3.5% to all other monetised impacts. The total broadcasting revenue at risk is from HFSS advertising on channels that reach over 1% of the UK child audience (this threshold is applied to TV only) during 0530 to 2100. Online HFSS spend and impacts have been scaled using data from Comscore. BUSINESS ASSESSMENT (Option C)
Direct impact on business (Equivalent Annual) £m: Score for Business Impact Target (qualifying provisions only) £m:
Costs: Benefits: Net: 147 143 4 21

5
Summary: Analysis & Evidence Policy Option D Description: Retain the current set of food advertising restrictions for broadcast TV and introduce an online advertising restriction on HFSS products in scope of the SDIL, and PHE’s Sugar and Calorie Reduction Programmes, applied via a 2100-0530 watershed. FULL ECONOMIC ASSESSMENT
Price Base Year
PV Base Year
Time Period Years
Net Benefit (Present Value (PV)) (£m)
2016 2017 25 Low: 290 High: 360 Best Estimate: 340
COSTS (£m) Total Transition (Constant Price) Years
Average Annual (excl.Transition)(Constant Price)
Total Cost (Present Value)
Low 0.5 1 25 430 High 1.4 1 51 870 Best Estimate 1 1 32 540 Description and scale of key monetised costs by ‘main affected groups’
Over 25 years online platforms are expected to lose £0.5bn in HFSS advertising revenue and advertising agencies are expect to lose £7m in commission. Cost to manufacturers and retailers from reduced sales are £5m. Transition costs of £1m are expected to fall across online platforms, advertising agencies, regulators, retailers and manufacturers.
Other key non-monetised costs by ‘main affected groups’ Other businesses indirectly affected by the losses to online platforms, advertising agencies and manufacturers / retailers. For example, businesses or people employed to produce HFSS online adverts. There may also be transition costs specific to online platforms such as cancelled contracts with advertising agencies. BENEFITS (£m) Total Transition
(Constant Price) Years Average Annual
(excl.Transition)(Constant Price) Total Benefit (Present Value)
Low Optional Optional 720 High Optional Optional 1,230 Best Estimate N/A N/A 880 Description and scale of key monetised benefits by ‘main affected groups’ Lower calorie consumption by children over their lifetimes is expected to generate health benefits – estimated at £240m over the 25-year assessment period. There would be additional health benefits to the population from reinvesting cost savings back into the NHS, these are estimated to be worth around £100m. Social care savings would amount to £6m and reduced premature mortality would be expected to deliver an additional £5m of economic output. Other forms of media are also expected to gain £0.4bn worth of additional revenue due to HFSS advertising being displaced from online platforms. Likewise HFSS retailers and manufactures are expected to gain around £100m in advertising cost savings. Other key non-monetised benefits by ‘main affected groups’ Children will experience additional health benefits associated with a reduction in obesity related ill health and from lower salt, sugar and fat consumption. Reformulation of HFSS products may result in additional nutritional benefits for the population. Furthermore, adults reduction in HFSS advertising exposure has the potential to generate significant population wide health benefits.
Key assumptions/sensitivities/risks Discount rate(%) 3.5%/1.5% Key assumptions in the analysis include that HFSS advertising is displaced to other media and manufacturers/retailers are expected to experience cost savings from no longer advertising online. Health benefits require the direct impacts of the intervention to be maintained and are based on laboratory studies investigating the impact of HFSS TV advertising exposure on children's consumption. A discount rate of 1.5% is applied to health impacts and 3.5% to all other monetised impacts. Online HFSS spend and impacts have been scaled using data from Comscore. BUSINESS ASSESSMENT (Option D)
Direct impact on business (Equivalent Annual) £m: Score for Business Impact Target (qualifying provisions only) £m:
Costs: Benefits: Net: 32 31 1 4

6
Contents Impact Assessment (IA) 1
Summary: Analysis & Evidence Policy Option B 3
Summary: Analysis & Evidence Policy Option C 4
Summary: Analysis & Evidence Policy Option D 5
Executive Summary 9
A. Overview 12
A(i). Problem under consideration 12
A(ii). Rationale for intervention 13
A(iii). Policy Objective 14
B. Policy context 15
B(i). Childhood obesity: a plan for action 15
B(ii). The evidence for action 16
B(iii). Children’s media consumption 21
B(iv). Current Food Advertising Regulations 23
B(v). Industry overviews 28
C. Options overview 34
C(i). Options considered 34
C(ii). Alternative Options Considered 36
C(iii). Assessing the impact on the broadcasting sector 40
C(iv). Assessing the impact on online platforms 41
D. Cost and Benefits methodologies 42
D(i). Overall Methodology 42
D(ii). Costs Calculation Methodology 43
D(iii). Health Benefits Methodology 51
E. Options Assessment 63
E(i)A: Option A - No additional regulation. Retain current set of HFSS advertising restrictions for broadcast TV and online. 63
E(ii)B: Option B - Advertising restriction on HFSS products within the SDIL, Sugar and Calorie Reduction Programmes, applied on broadcast TV only, via a 2100-0530 watershed. Retain current regulations online. 65
Costs to Business 65
Transition Costs 65
Lost Sales Revenue 66
Health Benefits 73
Unmonetised Benefits 76
Benefits to Business 76

7
Summary of costs and benefits 77
E(iii) Option C - Advertising restriction on HFSS products in scope of the SDIL, and PHE’s Sugar and Calorie Reduction Programmes. Applied via a 2100-0530 pre-watershed on broadcast TV and online. 78
Costs to Business 78
Transition Costs 78
Lost Sales Revenue 79
Health Benefits 81
Unmonetised Benefits 84
Benefits to Business 84
Summary of costs and benefits 84
E(iv) Option D - Advertising restriction on HFSS products in scope of the SDIL, and PHE’s Sugar and Calorie Reduction Programmes. Applied via a 2100-0530 pre-watershed online only. Retain current TV advertising restrictions. 86
Costs to businesses 86
Transition Costs 86
Lost Sales Revenue 86
Health Benefits 87
Unmonetised benefits 88
Benefits to Business 89
Summary of costs and benefits 89
E(v) Options summary table and cost-benefit ratios. 90
F. Special IA Sections 91
F(i) Critical value analysis 91
F(ii) Sensitivity and risk analysis 91
F(iii) Equivalent Annual Net Direct Cost to Business 94
F(iv) Specific Impact Tests 95
Small and Micro Business Assessment 95
Equality Test 100
Inequalities Test 101
Competition Test 102
Sustainability Test 103
Environmental Test 103
Human Rights Assessment 103
Rural Proofing 103
Justice Impact Test 103
Annexes 104
Annex A – Further Evidence and International Evidence 104
Annex B – HFSS Food Definition 113

8
Annex C - Impact Assessment Specific Questions 116
Annex D – Kantar Consulting - HFSS Advertising Analysis: Methodology summary 121
Annex E – DHSC Calorie Model V2 132

9
Executive Summary Problem and justification for action 1. Childhood obesity is one of the biggest health problems this country faces. Around one fifth of children
in England are obese or overweight by the time they start primary school aged five, and this rises to more than one third by the time they leave aged 11.1
2. Obesity is a major determinant of ill health.2 This imposes a substantial burden on the NHS, with
overweight and obesity estimated to have cost the health service £6.1bn in 2014/153 . Obesity causes further costs to society through premature mortality, increased sickness absence and additional benefit payments.
3. It’s clear from the evidence that marketing and TV advertising can be effective at influencing children's food and drink consumption, preferences and purchases.4 Although food habits are not perfectly stable over life, there is potential scope for influencing lifetime habits by intervening in childhood.5
Policy Objective 4. The overarching objective of Chapter 2 of the Government’s Childhood Obesity Plan is to halve
childhood obesity and significantly reduce the gap in obesity prevalence between children from the most and least deprived areas by 2030.6
5. The primary objective of this consultation is to gather views on reducing children’s exposure to HFSS
advertising, in order to reduce children’s overconsumption of HFSS products. We also want to drive reformulation of these products by manufacturers.
Policy Options 6. The consultation document outlines three proposed policy options to restrict HFSS advertising on
broadcast TV and four for online. These options could be implemented in several different combinations. For this IA we have modelled four possible combinations. We are seeking further views and evidence on all options, with the intention to model all options fully at final stage. The modelled options are as follows:
● Option A - ‘Do nothing’ - Retain current set of food advertising restrictions for broadcast TV and online.
● Option B - Advertising restriction on HFSS products in scope of the Soft Drinks Industry Levy (SDIL), and PHE’s Sugar and Calorie Reduction Programmes, applied on broadcast TV only, via a 2100-0530 watershed.
● Option C - Advertising restriction on HFSS products in scope of the SDIL, and PHE’s Sugar and Calorie Reduction Programmes. Applied via a 2100-0530 watershed on broadcast TV and online.
● Option D - Advertising restriction on HFSS products in scope of the SDIL, and PHE’s Sugar and Calorie Reduction Programmes. Retain the current set of HFSS food advertising restrictions for broadcast TV and introduce a 2100-0530 watershed online.
1 NHS Digital (2018) National Child Measurement Programme 2017/18 2 Guh et al. (2009) The incidence of co-morbidities related to obesity and overweight: A systematic review and meta-analysis, BMC Public Health 3 Public Health England. (2018). Health Matters: Obesity and the food environment. Available at: https://www.gov.uk/government/publications/health-matters-obesity-and-the-food-environment/health-matters-obesity-and-the-food-environment--2 (accessed 06/02/2019) 4 Cairns, G., Angus, K., Hastings, G. & Caraher, M. (2013). Systematic reviews of the evidence on the nature, extent and effects of food marketing to children. A retrospective summary. Appetite, 62, pp. 209-215. 5 Hursti UK. Factors influencing children's food choice. Annals of medicine. 1999 Jan 1;31(sup1):26-32. 6 Childhood obesity: a plan for action, chapter 2. Available from: https://www.gov.uk/government/publications/childhood-obesity-a-plan-for-action-chapter-2 (accessed 06/02/2019)
10
7. For the purposes of this impact assessment only, to aid clarity and allow comparison against a single option, Option C is presented as the preferred option. The final policy proposal is subject to the feedback received during this consultation.
Costs and benefits of options 8. The benefits of introducing further restrictions on HFSS food and drink advertising are expected to be
a reduction in obesity prevalence and obesity related morbidity and mortality.
9. The main categories of costs are transition costs associated with familiarisation with the new regulations, lost advertising revenue for broadcasters, online platforms and advertising agencies and a reduction in profits for retailers and manufacturers of HFSS products.
Option B 10. Under Option B transition costs are estimated to be around £1m across all impacted groups:
broadcasters, ad agencies, regulators, manufacturers and retailers.
11. Broadcasters are estimated to lose around £111.6m in advertising revenue per year and advertising agencies are expected to lose up to £1.5m per year in commission. Furthermore, our estimates suggest that retailers and manufacturers of HFSS products will see their profits reduce by on average £0.6m and £0.2m per year, respectively.
12. The health benefits to our cohort of children from Option B are estimated to be around 64,000 Quality
Adjusted Life Years, or a present value of £1.4bn when monetised. There would be additional health benefits to the population from reinvesting cost savings back into the NHS; these are estimated to be worth around £0.6bn. Social care savings would amount to £40m and reduced premature mortality would be expected to deliver an additional £31m of economic output.
13. Other forms of media are also expected to gain £1.6bn worth of additional revenue over the appraisal period due to HFSS advertising being displaced from TV. Likewise HFSS retailers and manufacturers are expected to gain £0.3bn in advertising cost savings.
Option C 14. Under Option C transition costs are estimated to be around £1m and include online platforms.
15. Broadcasters are estimated to lose around £111.6m in advertising revenue per year and online
media £31.1m per year. Advertising agencies are expected to lose up to £2m per year in commission. Furthermore, our estimates suggest that retailers and manufacturers of HFSS products will see their profits reduce by on average £0.8m and £0.3m per year respectively.
16. The health benefits to our cohort of children from Option C are estimated to be around 84,000 Quality Adjusted Life Years, or a present value of £1.9bn when monetised. There would be additional health benefits to the population from reinvesting cost savings back into the NHS; these are estimated to be worth around £0.8bn. Social care savings would amount to £52m and reduced premature mortality would be expected to deliver an additional £41m of economic output.
17. Other forms of media are also expected to gain £2bn worth of additional revenue over the appraisal period due to HFSS advertising being displaced from TV and online. Likewise HFSS retailers and manufacturers are expected to gain £0.5bn in advertising cost savings.
Option D 18. Under Option D transition costs are estimated to be around £1m.
19. Online media is estimated to lose around £31.1m in advertising revenue per year and advertising
agencies are expected to lose up to £0.4m per year in commission. Furthermore, our estimates

11
suggest that retailers and manufacturers of HFSS products will see their profits reduce by on average £0.1m and £0.04m per year respectively.
20. The health benefits to our cohort of children from Option D are estimated to be around 10,000 Quality
Adjusted Life Years, or a present value of £0.2bn when monetised. There would be additional health benefits to the population from reinvesting cost savings back into the NHS; these are estimated to be worth around £0.1bn. Social care savings would amount to £6m and reduced premature mortality would be expected to deliver an additional £5m of economic output.
21. Other forms of media are also expected to gain £0.4bn worth of additional revenue over the appraisal period due to HFSS advertising being displaced from online. Likewise HFSS retailers and manufacturers are expected to gain £0.1bn in advertising cost savings.
Unmonetised Costs and Benefits 22. Children will experience additional health benefits associated with reduced obesity related ill health
and from lower salt, sugar and fat consumption. It’s possible that overweight and obese children will experience a higher calorie reduction and therefore greater benefits than the population average. Reformulation of HFSS products may result in additional nutritional benefits and adults might also experience significant health benefits from reduced exposure to HFSS advertising.
23. Other businesses may be indirectly affected by the losses to broadcasters, online platforms,
advertising agencies and HFSS manufacturers and retailers. For example, businesses employed to film or produce HFSS adverts. There may also be additional transition costs to broadcasters and online media, such as scheduling changes or cancelled contracts with advertising agencies.
Critical Value Analysis 24. It is possible that wider factors, such as changes to retailer and manufacturers promotional strategies,
could offset the expected calorie reduction from this policy. To assess the impact of this, we consider the degree of offsetting required to result in a neutral net present value.
25. Our central estimate for Option C suggested the total benefits of the policy to be £5.2bn. Total costs are valued at £2.5bn in the central scenario. This suggests that around 50% of the benefits of the policy would need to be offset for it not be deemed socially beneficial.
Net present value summary 26. The table below outlines the expected impacts of the different policy options over the appraisal
period. Option A represents the do-nothing scenario against which the other options are compared. As such, the costs and benefits of this option are zero by definition.
Table 1: Summary of the total cost and benefit estimates for the policy options7 Option Total Benefit (£m) Total Cost (£m) Net Present Value (£m)
A - Do nothing 0 0 0
Option B - TV pre-watershed £4,040 £1,960 £2,080
Option C - TV & Online pre-watershed £5,240 £2,500 £2,730
Option D - online pre-watershed £880 £540 £340
7 Figures in this table might not sum to the overall Net Present Value. This is due to rounding.

12
A. Overview
A(i). Problem under consideration
1. Childhood obesity is one of the biggest health problems this country faces. Around one fifth of children in England are obese or overweight by the time they start primary school aged five, and this rises to more than one third by the time they leave aged 11.8 This challenge disproportionately affects children in from the most deprived backgrounds, with those growing up in low income households more than twice as likely to be obese as those in higher income households.9 Children from black and minority ethnic families are also more likely than children from white families to be overweight or obese and this inequality gap is increasing.10
2. Obesity damages children’s mental health, with those who are overweight or obese more likely to
experience bullying, stigmatisation and low self-esteem.11 It also puts their physical health at risk. Overweight or obese children are more likely to develop Type 2 diabetes in childhood,12 and are far more likely to go on to become obese adults,13 with a higher risk of developing life-threatening conditions such as some forms of cancer, Type 2 diabetes, heart disease14 and liver disease.15
3. It is estimated that obesity-related conditions cost the NHS £6.1 billion in 2014/15.16 Additionally, the
total costs to society of these conditions have been estimated at around £27 billion per year17 with some estimates placing this figure much higher.18
4. We know that childhood obesity is a complex problem and is caused by many different factors. As a
result, no one policy and no one sector will reduce childhood obesity on its own. Therefore, the Government is committed to pursuing a wide set of actions to tackle childhood obesity.
5. Despite the complexity of its drivers, at its root obesity is caused by consistently consuming more
calories than we use to maintain our bodies and through activity. It is estimated that on average, compared with those of ideal body weights, overweight and obese children consume between 146 and
8 NHS Digital. (2018). National Child Measurement Programme 2017/18 9 NHS Digital. (2018). National Child Measurement Programme 2017/18 10 NHS Digital. (2018). National Child Measurement Programme 2017/18 11 Gatineau M, Dent M. (2011). Obesity and mental health. National Obesity Observatory: Oxford UK 12 Abbasi A, Juszczyk, D, et al. (2017). Body mass index and incident type 1 and type 2 diabetes in children and young adults: a retrospective cohort study. Journal of the Endocrine Society, 1(5), 524-537 13 Simmonds, M, Llewellyn et al. (2016). Predicting adult obesity from childhood obesity: a systematic review and meta analysis. Obesity reviews, 17(2), 95-107 14 Guh et al. (2009). The incidence of co-morbidities related to obesity and overweight: a systematic review and meta- analysis. BMC Public Health, 9(1), 88 15 Scheen, A J. (2002). Obesity and liver disease. Best Practice & Research Clinical Endocrinology and Metabolism, 14(4), 703-716 16 Public Health England. (2018). Health Matters: Obesity and the food environment. Available at: https://www.gov.uk/government/publications/health-matters-obesity-and-the-food-environment/health-matters-obesity-and-the-food-environment--2 (accessed 28/02/2019) 17 McPherson, K, Marsh, T. (2007). Modelling Future Trends in Obesity and the Impact on Health. Foresight Tackling Obesities: Future Choices. Available at: https://www.gov.uk/government/publications/reducing-obesity-modelling-future-trends (accessed 28/02/2019) 18 McKinsey Global Institute. (2014). Overcoming obesity: An initial economic analysis. Available at: https://www.mckinsey.com/~/media/McKinsey/Business%20Functions/Economic%20Studies%20TEMP/Our%20Insights/How%20the%20world%20could%20better%20fight%20obesity/MGI_Overcoming_obesity_Full_report.ashx (accessed 28/02/2019)
13
505 excess calories per day for boys and between 157 and 291 for girls, depending on their age.19 Taking action to help reduce this excess calorie consumption will decrease obesity prevalence and obesity related ill health.
6. A critical part of delivering this goal is reducing excessive calorie intake. We make numerous decisions
about the food we eat, and every day we are presented with encouragement and opportunity to eat the least healthy foods. This can be through: pricing; the advertisements our children see on TV and online; the range of foods sold in our local shops or delivered straight to our doors; and the food that is promoted in-store and online. All of this is intended to influence the choices we make about the food we buy our children and the purchasing choices children make themselves.
7. That is why in Chapter 2 of the Childhood Obesity Plan Government set out plans to consider further
advertising restrictions alongside a range of other policies to improve the food environment. Evidence commissioned for this consultation from Kantar shows that despite strict regulations already being in place to govern advertising around children’s programming, which have driven down exposure, children still see a significant volume of HFSS product advertising in the media that they engage with the most.
A(ii). Rationale for intervention
8. One reason a regulatory intervention would typically be justified is when there is a market failure to address. That is when a market, without regulation, leads to an inefficient or sub-optimal outcome from a societal perspective. Our rationale for intervention is based on market failure due to the negative externalities generated by excessive consumption of HFSS food and drinks.
9. Individuals only face some of the costs associated with ill health as universal health care ensures the financial costs are borne by the taxpayer. Consequently, the health costs associated with excess calorie consumption are passed on to society and are not just experienced by the individual. In economic terms, this is referred to as a negative externality.
10. An individual is likely to make decisions based only on the costs they face. Consequently, when a
negative externality is present, the market fails to operate efficiently because the social costs are greater than the personal costs and are not considered in an individual’s decision making at the margin. The overall cost of obesity to society has been estimated at around £27bn per year and has been predicted to reach around £50bn by 2050.20
11. Many different cues can affect food and drink purchases, including price, taste, parental and peer
influence, and public health campaigns. However, it is clear from academic evidence that marketing and TV advertising can also be effective at influencing preferences and purchases. The promotion of unhealthy, high calorie food has been identified as a contributory factor to the increasing prevalence of obesity around the world. Children are thought to be particularly vulnerable to marketing techniques, with academic evidence showing their food preferences, purchasing and consumption can be influenced by advertising.21
12. Around 16% of children aged 2-15 are considered obese, with a further 12% being overweight22. Obesity in childhood directly affects physical and mental health, and is associated with an increased
19 Calorie reduction: the scope and ambition for action, Public Health England, 2018: https://assets.publishing.service.gov.uk/government/uploads/system/uploads/attachment_data/file/685359/Calorie_reduction_The_scope_and_ambition_for_action.pdf (accessed 15/06/2018) 20McPherson, K, Marsh, T. (2007). Modelling Future Trends in Obesity and the Impact on Health. Foresight Tackling Obesities: Future Choices. Available at: https://www.gov.uk/government/publications/reducing-obesity-modelling-futuretrends (accessed 04/02/2019) 21 Cairns, G., Angus, K., Hastings, G. & Caraher, M. (2013). Systematic reviews of the evidence on the nature, extent and effects of food marketing to children. A retrospective summary. Appetite, 62, pp. 209-215. 22 Health Survey for England 2017, NHS Digital

14
risk of obesity in adulthood23 when the majority of overweight and obesity related ill health occurs. Although food habits are not perfectly stable over the life course, there is potential scope for influencing lifetime habits by intervening in childhood.24 Adjusting the consumption patterns of children by restricting their exposure to HFSS advertising therefore offers possible benefits in the long-term to both society and the individual.
13. It is difficult to associate the purchase of a single food item with excess calorie consumption. Individual products are not usually bought in an isolated decision-making process but as part of an overall attempt to satisfy a person’s dietary requirements. However, certain goods are associated with a greater propensity to create impulse purchases25 and act as a greater contributor to weight gain26.
14. Although some HFSS products will be purchased as part of a balanced diet and not contribute to obesity, they nevertheless represent the most focused group of adverts to target to reduce excess calorie consumption while minimising the impact on the wider market.
A(iii). Policy Objective
15. The overarching objective of Chapter 2 of the Government’s Childhood Obesity Plan is to halve childhood obesity and significantly reduce the gap in obesity between children from the most and least deprived areas by 2030.27 Further advertising restrictions are being considered alongside a range of other policies to ensure we are taking a comprehensive and ambitious approach to tackling childhood obesity.
16. The primary objective of this consultation is to gather views on lowering children’s exposure to HFSS
advertising, in order to reduce children’s overconsumption of HFSS products. We also want to drive reformulation by food and drink manufacturers to improve their nutritional content.
17. Furthermore, if subsequently implementing any restrictions, we want to ensure they are proportionate both to the scale of the childhood obesity challenge and economic impact. They should be targeted to the products most likely to contribute to childhood obesity. Our focus is limiting the advertising children see rather than that seen by adults. We also want to ensure that any potential restrictions can be easily understood by parents, so that they can be supported in making healthier choices for their families. Together, these objectives have informed our approach to key questions around the scope of the consultation.
23 Singh AS, Mulder C, Twisk JW, Van Mechelen W, Chinapaw MJ. (2008) Tracking of childhood overweight into adulthood: a systematic review of the literature. Obesity reviews. 2008 Sep 1;9(5):474-88. 24 Hursti UK. Factors influencing children's food choice. Annals of medicine. 1999 Jan 1;31(sup1):26-32. 25 Muruganantham G, Bhakat RS. (2013) A review of impulse buying behaviour. International Journal of Marketing Studies, 2013 Apr 22;5(3):149. 26 Mendoza JA, Drewnowski A, Christakis DA. (2007) Dietary energy density is associated with obesity and the metabolic syndrome in US adults. Diabetes care. 2007 Apr 1;30(4):974-9. 27 Childhood obesity: a plan for action, chapter 2 https://www.gov.uk/government/publications/childhood-obesity-a-plan-for-action-chapter-2 (accessed 06/03/2019)
15
B. Policy context
B(i). Childhood obesity: a plan for action
18. The proposed advertising restrictions are part of a wider set of policies included in the Government’s: Childhood obesity: a plan for action – Chapter 2.28 The proposals outlined in Chapter 2 include consulting on mandatory calorie labelling in the out-of-home sector, ending the sales of energy drinks to children, encouraging further action in local areas and in schools and restrictions on HFSS product location and volume promotions in the retail and out of home sectors. The proposed policies will help parents make the best decisions for their families by changing the food environment, so that healthier choices become the easiest choices.
19. These proposals are in addition to the measures launched in the first chapter, published in August 2016.29 Key measures in Chapter 1 included a Soft Drinks Industry Levy (SDIL), a sugar reduction programme which challenged the food and drink industry to remove 20% of sugar from product categories that contribute significantly to children’s sugar intakes and where there is scope for substantial reformulation and/or portion size reduction. It also featured a commitment to helping children enjoy an hour of physical activity every day.
20. The SDIL has been designed to incentivise reformulation and is charged on drinks with a total sugar content of 5 grams or more per 100 millilitres, with a higher charge for drinks that contain 8 grams or more sugar per 100 millilitres. The levy came into force in April 2018 and has already resulted in over 50% of manufacturers reducing the sugar content of their drinks, equivalent to 45 million kilogrammes of sugar every year.30
21. As part of the wider reformulation programme, in August 2017 Public Health England announced an extensive calorie reduction programme.31 This programme aims to remove excess calories from foods that children eat most, helping to make the healthier choice the easy choice for consumers. The calorie reduction programme challenges the food industry to achieve a 20% reduction in calories by 2024 in product categories that contribute significantly to children’s calorie intakes and where there is scope for substantial reformulation and/or portion size reduction. The products covered by the programme include ready meals, pizzas, meat products, savoury snacks, sauces and dressings, prepared sandwiches and other “on the go” foods.
22. A range of policies are being proposed because the “causes of obesity are embedded in an extremely complex biological system, set within an equally complex societal framework”32 to which there is no single, simple solution. There is evidence that the size of the problem has led to its normalisation and the inability of many people to judge their own weight accurately. A survey of obese adults in Great Britain found that only 58.6% of women with a BMI of 35+ (morbidly obese) identified themselves as ‘very overweight’ or ‘obese’, with just 42.4% of equivalent men doing so.33
28 Childhood obesity: a plan for action, chapter 2 https://www.gov.uk/government/publications/childhood-obesity-a-plan-for-action-chapter-2 (accessed 06/02/2019) 29 DHSC (2016) Childhood obesity: a plan for action, https://assets.publishing.service.gov.uk/government/uploads/system/uploads/attachment_data/file/546588/Childhood_obesity_2016__2__acc.pdf (accessed 10/09/2018) 30 https://www.gov.uk/government/news/soft-drinks-industry-levy-comes-into-effect (accessed 11/01/2019) 31 Public Health England (2018) Calorie reduction: The scope and ambition for action. https://www.gov.uk/government/publications/calorie-reduction-the-scope-and-ambition-for-action (accessed 14/09/2018) 32 Government Office for Science (2007) Tackling Obesities: Future Choices – Project report, https://www.gov.uk/government/publications/reducing-obesity-future-choices (accessed 08/09/2018) 33 Do weight perceptions among obese adults in Great Britain match clinical definitions? Analysis of cross-sectional surveys from 2007 and 2012, Johnson et al, BMJ Open 2014
16
23. Although people have difficulty identifying obesity as an issue at a personal level, the public recognises the problem at a national level. Obesity is reported as the second biggest health problem facing people today, with 33% of people identifying it as an issue – only 2% less than cancer. Additionally, 19% of people now report diabetes as a major issue – up from just 10% in 2010.34
24. The evidence shows that children in the UK have unbalanced diets, consuming too many calories35, more sugar than recommended36 and not enough portions of fruit and vegetables37. In particular, children between 11-18 years old consume up to three times the recommended maximum amount of sugar.38 There is a clear link between high sugar intake and excess calorie consumption, which increases the risk of weight gain and obesity.39 Taking action to improve children's diets will decrease obesity prevalence and obesity related ill health.
B(ii). The evidence for action
25. In the section below, we review the evidence on how this advertising may affect children’s food and drink behaviours. We have mainly focused on the UK based literature, especially where social context is particularly important, such as when looking at observational real-world studies. Some international evidence is considered here and further evidence is included in Annex A.
Social-cognitive theory 26. Social-cognitive theories suggest that the effects of food advertising are subtle, yet have impacts on
eating behaviours that may be outside the participants’ awareness through ‘priming’.40 27. Priming studies have demonstrated that complex social and physical behaviours can be
subconsciously activated through external stimuli. This is to say, many of the messages delivered through advertisement may not affect conscious decision-making behaviour, but will act in the subconscious.
28. The implication of this is that if advertising were to act on the subconscious through ‘priming’, then children may not even be aware of the effect advertising is having on their food preferences.
Impact of unhealthy food advertising on children’s calorie consumption 29. This is supported by laboratory experiments showing exposure to food advertising triggers an impact
on children’s food consumption. Harris et al.41 present the hypothesis that television food advertising can act as a “real-world prime”. Their experiment showed children in the US aged 7-11 who saw food advertising consumed 45% more calories than their peers who saw non-food advertising. Similar
34 Public Perceptions of the NHS and Social Care - Winter 2014: Ipsos MORI report for the Department of Health, https://www.gov.uk/government/publications/public-perceptions-of-the-nhs-and-social-care-winter-2014 (accessed 14/09/2018) 35 Calorie reduction: The scope and ambition for action, Public Health England, 2018. Available at: https://assets.publishing.service.gov.uk/government/uploads/system/uploads/attachment_data/file/685359/Calorie_reduction_The_scope_and_ambition_for_action.pdf (accessed 06/02/2019) 36 Sugar Reduction: The evidence for Action, Public Health England, 2015. Available at: https://assets.publishing.service.gov.uk/government/uploads/system/uploads/attachment_data/file/470179/Sugar_reduction_The_evidence_for_action.pdf (accessed 06/02/2019) 37 Health Survey for England 2017, NHS Digital 38 Sugar Reduction: The evidence for action - Annexe 4: An analysis of the role of price promotions on the household purchases of food and drinks high in sugar. Available at: https://www.gov.uk/government/publications/sugar-reduction-from-evidence-into-action (accessed 06/02/2019) 39 The Scientific Advisory Committee on Nutrition. (2015) Carbohydrates and Health. Available from: https://www.gov.uk/government/collections/sacn-reports-and-position-statements (accessed 06/02/2019) 40 Bargh JA, Morsella E. The unconscious mind. Perspectives on Psychological Science. 2008;3:73–79 41 Harris JL, Bargh JA, Brownell KD. Priming effects of television food advertising on eating behaviour. Health psychology. 2009 Jul;28(4):404.
17
studies conducted in the UK by Halford et al in the mid-2000s also found that children who saw food advertising consumed more calories. 42 43
30. A systematic review and meta-analysis found that advertising exposure had a statistically significant
effect on children's food intake, though no effect on adult intake.44 Boyland et al. in 2016 looked at the short-term impact of food advertising on calorie intake. After reviewing the results from 13 studies, the authors found that there was a moderate difference in food intake between those who were exposed to unhealthy food adverts and those who were not.
31. The Department of Health and Social Care commissioned the NIHR Obesity Policy Research Unit (OPRU) to review the evidence and quantify the effect of screen advertising on dietary intake in children. The authors rapid systematic review suggests that exposure to screen advertising for unhealthy food results in significant increases in dietary intakes among children. Furthermore, exposure to 4.4mins of food advertising was found to increase children’s consumption by around 60kcal on average.45
32. As well as looking at experimental studies with measured outcomes, the NIHR OPRU also conducted a separate analysis of non-experimental ‘real-world’ studies using reported outcomes. Overall, their meta-analysis of 16 real world studies found a ‘strong positive relationship between exposure to TV food advertising and dietary intake in children’. However, it’s important to note that these are often child- or parent-reported outcomes and do not allow for incremental measurements that would allow for a quantification of marginal calorie intake per minute of advertising exposure.
Advertising and long-term food preferences 33. In addition to the evidence showing the impact HFSS advertising can have on children's consumption,
there’s also evidence suggesting that advertising can alter their food preferences.
34. A systematic review of the literature in 2009, commissioned by the World Health Organization (WHO), concluded that on balance, the evidence indicates that food promotion has a modest impact on food preferences and consumption patterns resulting in associations between food promotion and adverse health outcomes.46 Other systematic reviews in the UK47 (2003) and the US48 (2006) have come to the same conclusion.
35. The specific findings of the WHO systematic review are discussed in more detail in Annex A. This review focuses mainly on US evidence (49) but also considers evidence from the UK (8), Australia (4), Canada (4) and other countries (24). The study recognises “creative strategies known to attract and engage children in the developed world…are found to be similarly employed in lower income countries.” The specific context of each country may have some impact on the results and the conclusions we can draw from this.
42 Halford JC et al. (2007). Beyond-brand effect of television (TV) food advertisements/commercials, in Public Health Nutrition 11(9):897-904 43 Halford JC, Gillespie J, Brown V, Pontin EE, Dovey TM. Effect of television advertisements for foods on food consumption in children. Appetite. 2004 Apr 1;42(2):221-5. 44 Boyland EJ, Nolan S, Kelly B, Tudur-Smith C, Jones A, Halford JC, Robinson E. Advertising as a cue to consume: a systematic review and meta-analysis of the effects of acute exposure to unhealthy food and nonalcoholic beverage advertising on intake in children and adults, 2. The American journal of clinical nutrition. 2016 Jan 20;103(2):519-33. 45 Russell, Simon J., Helen Croker, and Russell M. Viner. "The effect of screen advertising on children's dietary intake: A systematic review and meta‐analysis." Obesity Reviews(2018). 46 Cairns G, Angus K, Hastings G. The extent, nature and effects of food promotion to children: a review of the evidence to December 2008. World Health Organization, WHO Press; 2009. 47 Hastings G, Stead M, McDermott L, Forsyth A, MacKintosh AM, Rayner M, Godfrey C, Caraher M, Angus K. Review of research on the effects of food promotion to children. London: Food Standards Agency. 2003 Sep 22. 48 Kraak VI, Gootman JA, McGinnis JM, editors. Food marketing to children and youth: threat or opportunity?. National Academies Press; 2006 May 11.
18
Establishing a causal link between food advertising and children’s food preferences 36. Norman, Kelly, Boyland & McMahon49 concluded there is, “compelling evidence that the two [unhealthy
food marketing and childhood obesity] are causally linked”. Using Bradford-Hill Criteria50 they assessed the experimental and observational literature to evaluate the evidence of a causal relationship between food marketing on childhood obesity. Using mostly experimental evidence from the UK51, the authors concluded that the research satisfies all the key criteria commonly used to establish causal relationships in epidemiology.
37. The direct link between food marketing and obesity is difficult to measure and quantify due to obesity
being a multi-factorial condition. The authors believed it appropriate to investigate food behaviours (particularly calorie intake) to examine the causal relationship between unhealthy food marketing and children’s weight.
38. The WHO systematic review, discussed above, also found modest strength evidence that food promotion has a causal influence on food preferences and consumption behaviour. This is covered in further detail in Annex A.
Impact of online HFSS food and drink advertising 39. Most of the academic literature investigates television advertising, due to its popularity and the length
of time for which it has been around. Many of the hypotheses presented above are also likely to apply to online advertising, which aims to act on the same mechanisms as television advertisements – just through a different medium. However, online advertisements may impact on children’s food preferences in a different way. Online advertising can occur in many different settings and can often be targeted at individuals more effectively.
40. In 2016 the WHO produced a paper specifically looking at food marketing to children in a digital world (2016)52 that we have used to gain some preliminary insight in to the way online HFSS product marketing may impact children’s food preferences.
41. Evidence suggests that - across product classes - combining online marketing with traditional broadcast and cinema advertising amplifies the effectiveness. Econometric analysis of 455 campaigns in Western Europe found that combining online marketing with television and cinema magnified the returns by 70% and 71% respectively.53 Furthermore, social media platforms say social media marketing can amplify the effects of broadcast marketing through increasing target audience reach, ad memorability, brand linkage and likeability.54
49 Norman J, Kelly B, Boyland E, McMahon AT. The impact of marketing and advertising on food behaviours: Evaluating the evidence for a causal relationship. Current Nutrition Reports. 2016 Sep 1;5(3):139-49. 50 Bradford-Hill A (1965). The environment and disease: association or causation? Proceedings of the Royal Society of Medicine, 58:295–300. 51 Number of studies by country: UK (8), USA (3), Netherlands (5), Canada (4), Australia (1), Austria (1), Chile (1). 52 Tatlow-Golden, M, Boyland, EJ, Jewell, J, Zalnieriute, M, Handsley, E, Breda, J and Galea, G (2016) Tackling food marketing to children in a digital world: trans-disciplinary perspectives. 53 Exploring digital ROI for FMCG brands. New York, NY: Microsoft ; 2013 54 Brand awareness optimisation. In: Introducing new ways to buy, optimise and measure ads for a mobile world. Facebook website post, 30 September 2015 (https://en-gb.facebook.com/business/news/Ad-Week-UK).

19
42. Furthermore, advergaming has been shown to increase children’s food intake in the Netherlands with an effect size similar to that of television commercials in equivalent research.55 56 57 58 A separate paper, published by Public Health England59, identified a study that shows advergames were persuasive and highlights their action on the subconscious, stating that children as old as 15 do not recognise the advertising intent of advergames.60
43. Whilst this evidence suggests that digital marketing is likely to be impactful and cost effective, the
evidence only looks at individual campaigns, platforms, countries and time periods. Further evidence on the impact of online advertising is discussed in Annex A.
Children’s food choice autonomy and pester power 44. Many children, especially younger children, will have limited control over their food choices. So
regardless of how powerful advertising is, this will only impact a child’s calorie intake when they are able to influence what they consume and what is purchased by their parents. For this reason, we must use laboratory based estimates of increased calorie consumption with caution, as laboratory studies often represent a scenario where children have unlimited access to the food they want. This section explores how much autonomy children may have over their food choices.
45. While recognising that other lifestyle factors will influence children's food requests, such as
socioeconomic status and behaviour of peers, there are multiple studies showing food advertising increases children’s requests for advertised foods.61 Furthermore, there is evidence that parents are influenced by these food requests and change their purchases as a result. These studies come from a range of developed countries and the results are covered in more detail in Annex A.
46. A study into Australian parents’ experiences of food marketing, for example, found that most of the
items requested by children were HFSS products and 70% of parents purchased at least one food item requested during the shopping trip.62 Furthermore, parents may not fully realise the extent to which their purchases are driven by prompts from children. An observational study in Austria found that twice as many purchases are triggered by children than the parents were aware of.63
47. There is evidence to suggest that children hold significant influence over their parents spending decisions and their own dietary choices. However, based on the evidence we have assessed, it is not possible to quantify the percentage of calorie intake over which children have autonomy.
Longitudinal impacts of advertising on children’s preferences carried in to adulthood
55 Folkvord F, Anschütz DJ, Buijzen M, Valkenburg PM. The effect of playing advergames that promote energy-dense snacks or fruit on actual food intake among children. Am J Clin Nutr 2013;97:239–45. 56 Folkvord F, Anschütz DJ, Nederkoorn C, Westerik H, Buijzen M. Impulsivity, “advergames”, and food intake. Pediatrics 2014;133:1007–12 57 Folkvord F, Anschütz DJ, Wiers RW, Buijzen M. The role of attentional bias in the effect of food advertising on actual food intake among children. Appetite 2015;84:251–8. 58 Russell, Simon J., Helen Croker, and Russell M. Viner. "The effect of screen advertising on children's dietary intake: A systematic review and meta‐analysis." Obesity Reviews(2018) 59 Public Health England (2015) Sugar Reduction: The evidence for action Annexe 3: A mixed method review of behaviour changes resulting from marketing strategies targeted at high sugar food and non-alcoholic drink. 60 Nairn, A. and H. Hang, Advergames: "it's not an advert - it says play". 2012, Family and Parenting Institute: Bath, UK. 61 Cairns G, Angus K, Hastings G. The extent, nature and effects of food promotion to children: a review of the evidence to December 2008. World Health Organization, WHO Press; 2009. 62 Campbell S, James EL, Stacey FG, Bowman J, Chapman K, Kelly B. (2012) A mixed-method examination of food marketing directed towards children in Australian supermarkets. Health promotion international. 2012 Nov 15;29(2):267-77. 63 Ebster C, Wagner U, Neumueller D. Children’s influences on in-store purchases. Journal of Retailing and Consumer Services. 2009 Mar 31; 16(2):145-54.

20
48. To understand how advertising during childhood may change children’s long-term food preferences as they age in to adulthood, we have explored the literature around the longitudinal effects of advertising and whether food preferences are carried forward from childhood more generally.
The longitudinal impact of children’s unhealthy food advertising on dietary markers as adults 49. The National Institute for Health Research (NIHR) Obesity Policy Research Unit (OPRU) conducted a
rapid literature search to identify research that looked at how food advertising impacts child preferences over time, including as they progressed in to adulthood. The results we can draw from this literature search are limited. The primary reasons for this are: television viewing being used as a proxy for advertising exposure, low quality methodology, non-dietary markers as outcomes and not being conducted over a significant time period.
50. The rapid literature search did find four papers which demonstrated a longitudinal relationship between
television viewing in period 1 and BMI or another dietary marker in period 2. However, these studies ranged over 2-5 years and focused on television viewing being used as a proxy for advertising exposure. This means they can’t inform us on the specific impacts of advertising over time as television viewing will likely be associated with a complex set of social and behavioural factors affecting BMI unrelated to advertising.64 65 66 67
51. One study looking specifically at the impact of advertising between 1996 and 2000 for 3-11 year olds and 1997 to 1999 for 12-18 year olds found that an additional half hour of fast food advertising per week resulted in a significant increase in the probability of being overweight.68
52. Although the results we could draw from this literature search were limited, there is some evidence of longitudinal impacts of television viewing and advertising exposure on child adiposity and dietary markers. However, none of the studies found were conducted over a long enough time period to track these impacts from childhood into adulthood.
How children’s food preferences impact their adult food preferences 53. Given the limited evidence on the longitudinal impacts of unhealthy food advertising on dietary
behaviours, DHSC also commissioned the NIHR OPRU to undertake a further rapid search for evidence on food preferences tracking over time. However, again, the results we can draw from this literature search are limited.
54. One systematic review identified 11 studies and found all studies found positive correlations between
dietary behaviours in childhood and adulthood. However, these correlations ranged from very weak to reasonably strong (r = 0.009 to r = 0.66)69. Furthermore, a study in Canada over 20 years found statistically significant poor-to-fair tracking of dietary patterns in males and females (0.19-0.28).70 The
64 Barr-Anderson, D.J., Larson, N.I., Nelson, M.C. et al. (2009). Does television viewing predict dietary intake five years later in high school students and young adults? International Journal of Behavioral Nutrition & Physical Activity. 6. 7. 65 Falbe, J., Rosner, B., Willett, W.C. et al. (2013). Adiposity and different types of screen time. Pediatrics. 132. 1497-1505. 66 Falbe, J., Willett, W.C., Rosner, B. et al. (2014). Longitudinal relations of television, electronic games, and digital versatile discs with changes in diet in adolescents. American Journal of Clinical Nutrition. 100. 1173-1181. 67 Rutherford, L., Brown, J.E., Skouteris, H. et al. (2015). Screen media, parenting practices, and the family environment in Australia: A longitudinal study of young children's media use, lifestyles, and outcomes for healthy weight. Journal of Children and Media. 9. 22-39. 68 Beales, J. and Kulick, R. (2013). Does advertising on television cause childhood obesity? A longitudinal analysis. Journal of Public Policy & Marketing. 32. 185-194. 69Craigie, Angela M., et al. "Tracking of obesity-related behaviours from childhood to adulthood: a systematic review." Maturitas 70.3 (2011): 266-284. 70 Movassagh, Elham Z., et al. "Tracking dietary patterns over 20 years from childhood through adolescence into young adulthood: The Saskatchewan Pediatric Bone Mineral Accrual Study." Nutrients 9.9 (2017): 990.

21
dietary markers used were based on a Western diet and are similar to what we would expect in the UK.
55. A study carried out in Iceland focussing on the impact of diet in adolescence and adult breast cancer
risk also tracked individuals’ diets over time. The authors found that there were positive correlations for dietary intake between adolescence and mid-adulthood. Although it’s important to note that the dietary behaviours measured are not immediately relevant for obesity (e.g. bread, vegetables, milk and fruit).
56. As established previously, advertising has a role in setting children’s food preferences. Although the
results we could draw from this literature search were limited, there is some evidence of moderate tracking of dietary behaviours from childhood to adulthood. The implication of this is that unhealthy food advertising in childhood may affect long term dietary behaviours in to adulthood.
Impact of HFSS advertising on adults 57. Whilst the aim of the policy is to reduce children’s exposure, the proposed restrictions would also
significantly reduce adults’ exposure to HFSS advertising. 58. The evidence investigating the impact food advertising has on adults is far less developed than the
evidence base for children. Some individual studies did find that exposure to food and drink advertising increased adults’ calorie intakes.71 72 73 However, despite these laboratory-based studies, both a systematic review (2013)74 and a meta-analysis (2016)75 were unable to find a conclusive impact of HFSS advertising on adults’ food behaviour, attitudes or beliefs.
59. Furthermore, if HFSS advertising has a direct impact on adults’ food and drink purchases then it seems likely that these products would also find their way into children's diets, as children have limited purchasing power and rely on adults making food purchases on their behalf. Thus the purchasing decisions made by their parents/guardians will be an important determinant of the food and drink available for them to consume.
60. Due to a lack of conclusive evidence it has not been possible to draw firm conclusions on the impact of HFSS advertising on adults’ food preferences and purchasing behaviour..
B(iii). Children’s media consumption
Broadcast media habits 61. Despite a significant decline over recent years - children still spend a substantial amount of time
watching TV. This is particularly the case for younger age groups where it remains the main form of media. Ofcom research76 shows that children’s viewing peaks in the hours after school, with the largest number of child viewers concentrated around family viewing time, between 6pm and 9pm. In this period children are watching programming not specifically aimed at them, with viewing taking place during
71 Zimmerman FJ, Shimoga SV. The effects of food advertising and cognitive load on food choices. BMC Public Health. 2014 Dec;14(1):342. 72 Harris JL, Bargh JA, Brownell KD. Priming effects of television food advertising on eating behavior. Health psychology. 2009 Jul;28(4):404. 73 Koordeman R, Anschutz DJ, van Baaren RB, Engels RC. Exposure to soda commercials affects sugar-sweetened soda consumption in young women. An observational experimental study. Appetite. 2010 Jun 1;54(3):619-22. 74 Mills SD, Tanner LM, Adams J. Systematic literature review of the effects of food and drink advertising on food and drink‐related behaviour, attitudes and beliefs in adult populations. Obesity Reviews. 2013 Apr 1;14(4):303 -14. 75 Boyland EJ, Nolan S, Kelly B, Tudur-Smith C, Jones A, Halford JC, Robinson E. Advertising as a cue to consume: a systematic review and meta-analysis of the effects of acute exposure to unhealthy food and nonalcoholic beverage advertising on intake in children and adults, 2. The American journal of clinical nutrition. 2016 Jan 20;103(2):519-33. 76 Ofcom (2017). Children and Parents: Media Use and Attitudes report, fig A1.5

22
adult commercial programming where restrictions on HFSS advertising are weaker.
62. Although the TV set remains the home of broadcast TV, how children watch and what they watch is changing. As technology develops televisions can now be used to watch non-broadcast content, with many different services competing for viewers, including broadcast on demand players (BVoDs) like All4 or ITV Hub, subscription video on demand providers (SVoDs) like Netflix, and video sharing platforms (VSPs) such as Youtube.77 With TV content also available on smartphones, tablets and even watches, choice is proliferating, and so Government is clear that any action to reduce childhood exposure must reflect the new media landscape.
Online media habits 63. Such has been the pace of change in children's media us that Ofcom has found that children aged 12
to 15 now spend more time online than watching broadcast TV,78 and are now more likely to recognise the name ‘YouTube’ than ‘BBC’.79 96% of 5-15s had access to the internet at home in 2017, with 92% of this age group using the internet.80 Tablets are used by a large number of children (65% for 3-4s, 75% for 5-7s, 80% for 8-11s and 78% for 12-15s), while mobile phone use is also significant (68% for 5-15s).81
Figure 1. Estimated weekly hours of media consumption at home or elsewhere, among users, by age (Source: Ofcom (2017) Children and Parents Media Use and Attitudes Report).
77 Video Sharing Platforms have been defined by, and are in scope of, the revision of the Audiovisual Media Services Directive (which governs EU-wide coordination of national legislation on all audiovisual media), with the intention of creating a regulatory environment that is fairer for all players in the audiovisual sector. 78 Ofcom (2017). Children and Parents: Media Use and Attitudes report (p 21) 79 Ofcom (2017). Children and Parents: Media Use and Attitudes report (p 9) 80 Ofcom (2017). Children and Parents: Media Use and Attitudes report (p 39). 81 Ofcom (2017). Children and Parents: Media Use and Attitudes report (p 39).
23
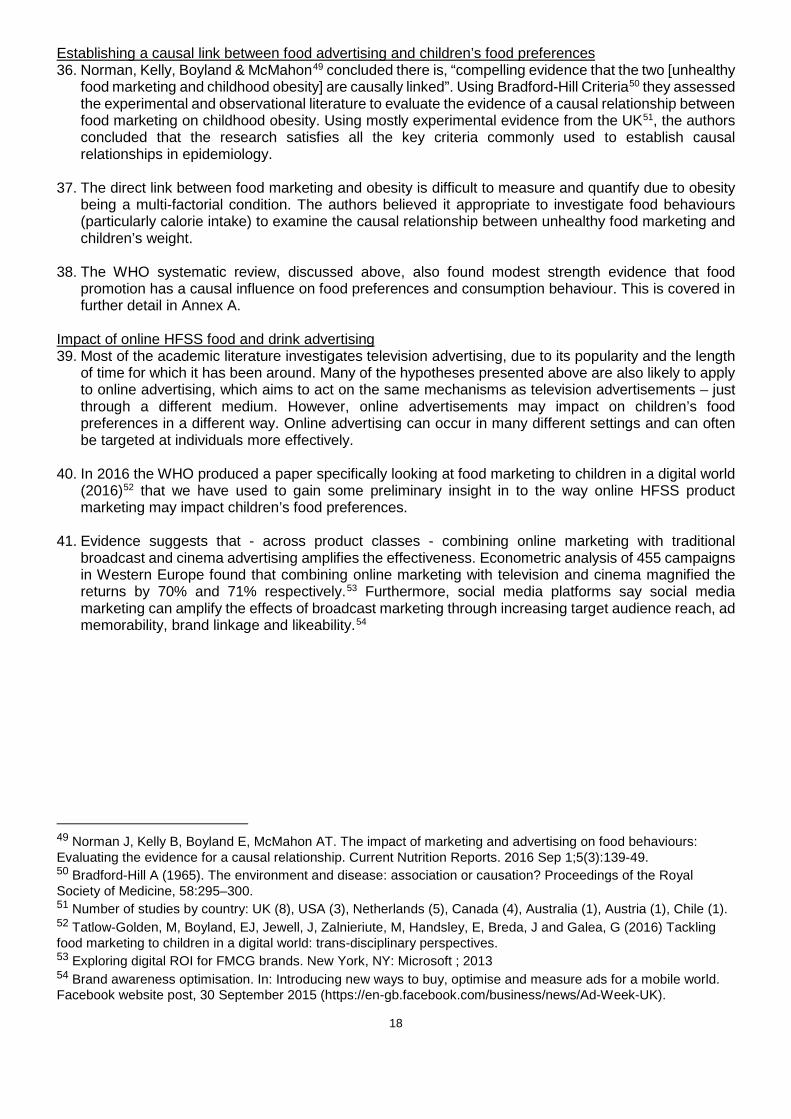
64. Children aged 5-15 who use the internet spend more than 15 hours per week online, and online time has increased significantly in the last 10 years.82 For comparison, this is now higher than television viewing on a television set, which averaged at 14h/week for 5-15 year olds. Ofcom’s Digital Day report (2016) found that 91% of children’s online activity occurs between 05:30 and 21:00.83
Figure 2: Children’s (6-15) internet activity by time of day
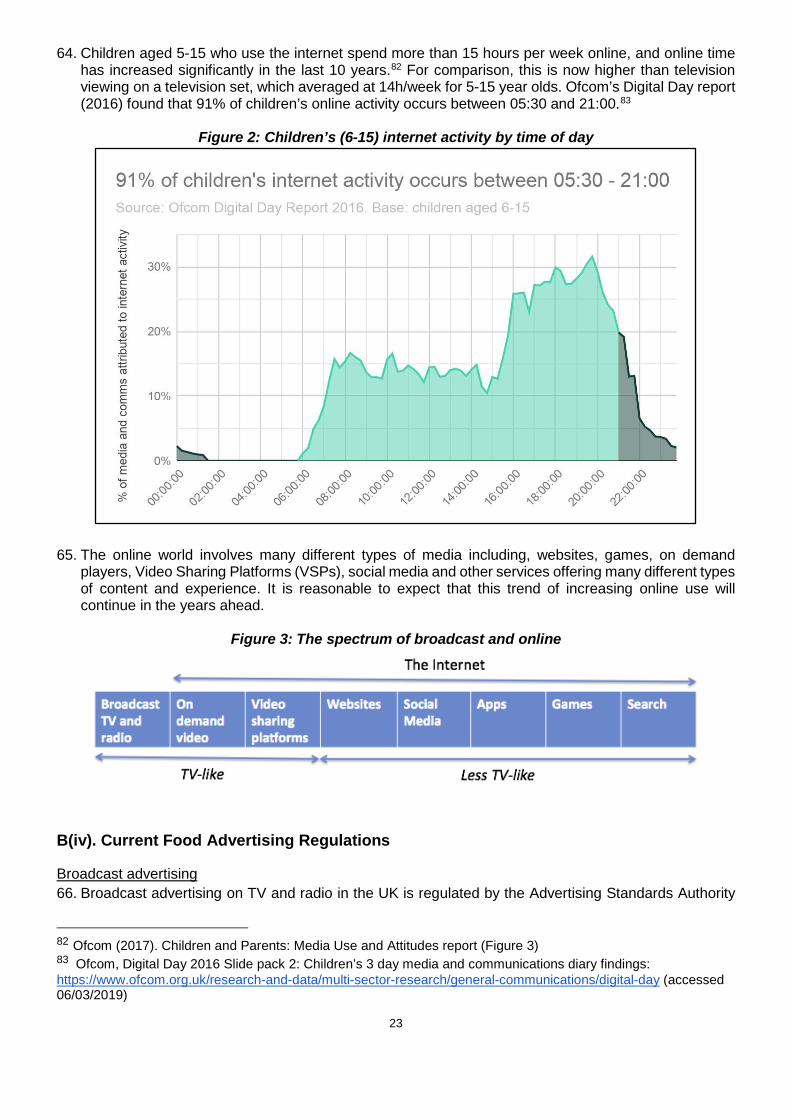
65. The online world involves many different types of media including, websites, games, on demand
players, Video Sharing Platforms (VSPs), social media and other services offering many different types of content and experience. It is reasonable to expect that this trend of increasing online use will continue in the years ahead.
Figure 3: The spectrum of broadcast and online
B(iv). Current Food Advertising Regulations
Broadcast advertising 66. Broadcast advertising on TV and radio in the UK is regulated by the Advertising Standards Authority
82 Ofcom (2017). Children and Parents: Media Use and Attitudes report (Figure 3) 83 Ofcom, Digital Day 2016 Slide pack 2: Children’s 3 day media and communications diary findings: https://www.ofcom.org.uk/research-and-data/multi-sector-research/general-communications/digital-day (accessed 06/03/2019)

24
(ASA), the industry’s independent regulator, through a system of co-regulation with Ofcom. The ASA enforces the UK Code of Broadcast Advertising (BCAP Code)84, which is drawn up, and regularly reviewed, by an industry committee and incorporates all relevant legislation. Overall, the BCAP Code sets standards for accuracy, honesty and social responsibility to which advertisers are expected to adhere.
67. Updates to the Code are subject to public consultation, consideration by an expert consumer advisory body, the Advertising Advisory Committee, and approval by Ofcom. If a complaint is made about an advert shown on TV, the ASA will consider that complaint against the Code and may subsequently require the broadcaster to withdraw, change or reschedule the advert. UK broadcasters are required by a condition of their broadcast licences to enforce ASA rulings. Broadcasters who do not comply may be referred to Ofcom who can impose fines and, in extreme cases, withdraw broadcast licences.
68. Since 2007, the scheduling of HFSS advertising around programming commissioned for or likely to appeal particularly to children has been prohibited. To determine whether a programme is likely to appeal particularly to children, broadcasters rely on ‘audience indexing’ in which BARB audience data is used to determine which programmes would attract a high percentage of children compared to the total audience watching. The ‘particular appeal’ prohibition applies throughout the broadcast day, including after 9pm. HFSS product placement in all TV programmes produced under UK jurisdiction is also prohibited by the Ofcom Broadcasting Code.
69. Where HFSS advertising is allowed, restrictions also limit the use of licensed characters (e.g. cartoon
characters created by a movie studio) and celebrities popular with children are not allowed to be used to promote HFSS products. Advertisers are also prohibited from appealing to various emotions, such as ‘pity, fear, loyalty or self-confidence’, when advertising food and drink products to children, and must avoid condoning or encouraging poor nutritional habits, the excessive consumption of any food, or otherwise unhealthy lifestyles.
70. However, despite this regulatory protection we know that children watch all types of TV programming, not just shows aimed directly at them. The current system of BARB audience indexing also only considers the proportion of the total audience that are children, rather than the total number of children watching. Furthermore, as noted above, children’s viewing time peaks between 6-9pm, when the programmes most likely to be broadcast are not children’s programming, but instead ‘family’ or adult programmes. This means that some of the shows most watched by children, such as X Factor, Saturday Night Takeaway, or Great British Bake Off, are not captured by the current restrictions.
Non-broadcast advertising 71. Non-broadcast advertising in the UK - including online, cinema, print, out of home and direct marketing
- is regulated by the ASA mainly through a system of self-regulation.85 The ASA enforces the UK Code of Non-broadcast Advertising, Sales Promotion and Direct Marketing (CAP Code) which sets out the advertising rules in the same way as the BCAP Code does for broadcast, though there are important structural differences in the overall system.86
72. From July 2017, following public consultation, the CAP Code introduced new HFSS rules which aligned
non-broadcast advertising with broadcast advertising. The new rules prohibit HFSS advertising in media of obvious appeal to children, or where more than 25% of the audience is under 16 years old.
84The BCAP Code, The UK code of Broadcast Advertising: https://www.asa.org.uk/uploads/assets/uploaded/526914b7-de7f-4cf6-86afe08684d22885.pdf (accessed 28/02/2019) 85 Video on Demand services regulated by Ofcom are subject to the same rules as other non-broadcast media, regulated by the ASA through self-regulation, and are also subject to additional rules reflecting legal requirements in the Communications Act 2003, which are regulated through the same system of co-regulation with Ofcom as TV. 86 Broadcast and non-broadcast advertising have significant regulatory differences. These include that: where broadcasters can be held liable for breaches of advertising rules, platforms do not have any liability as publishers; broadcast adverts are pre-cleared before transmission, whereas non-broadcast advertising generally is not; there are more restrictions on broadcast including rules on minutage; there are differences in maximum sanctions.
25
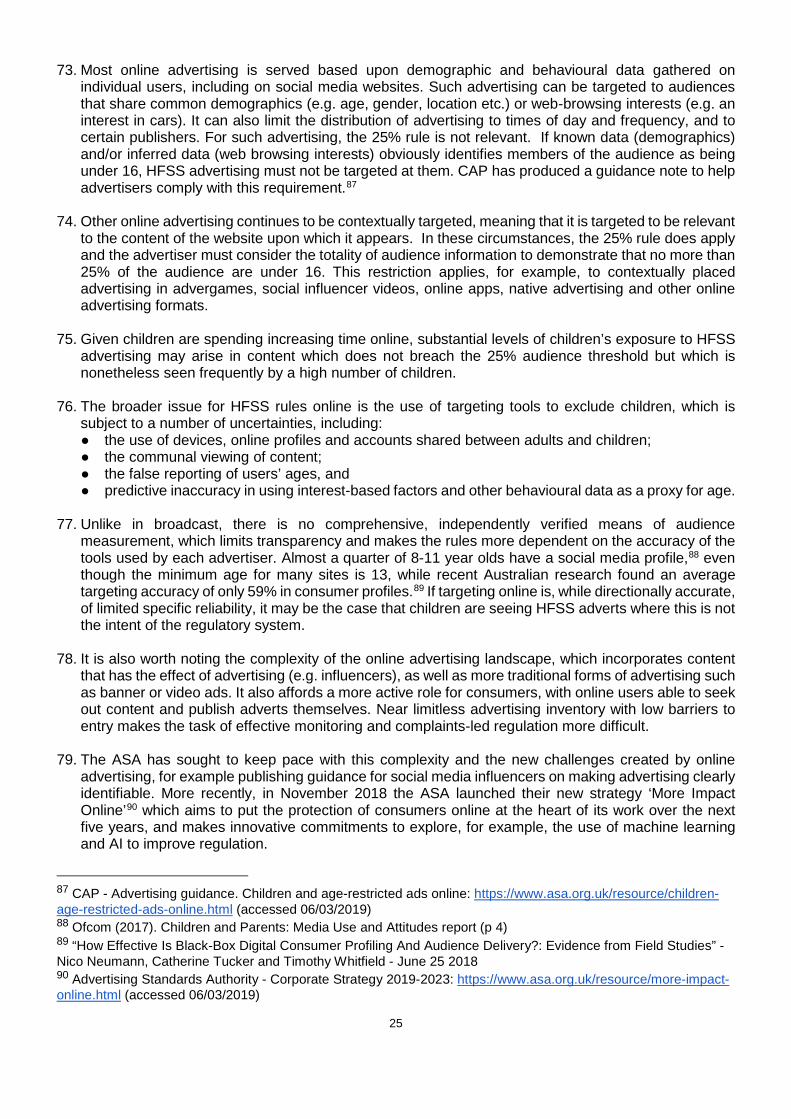
73. Most online advertising is served based upon demographic and behavioural data gathered on
individual users, including on social media websites. Such advertising can be targeted to audiences that share common demographics (e.g. age, gender, location etc.) or web-browsing interests (e.g. an interest in cars). It can also limit the distribution of advertising to times of day and frequency, and to certain publishers. For such advertising, the 25% rule is not relevant. If known data (demographics) and/or inferred data (web browsing interests) obviously identifies members of the audience as being under 16, HFSS advertising must not be targeted at them. CAP has produced a guidance note to help advertisers comply with this requirement.87
74. Other online advertising continues to be contextually targeted, meaning that it is targeted to be relevant
to the content of the website upon which it appears. In these circumstances, the 25% rule does apply and the advertiser must consider the totality of audience information to demonstrate that no more than 25% of the audience are under 16. This restriction applies, for example, to contextually placed advertising in advergames, social influencer videos, online apps, native advertising and other online advertising formats.
75. Given children are spending increasing time online, substantial levels of children’s exposure to HFSS
advertising may arise in content which does not breach the 25% audience threshold but which is nonetheless seen frequently by a high number of children.
76. The broader issue for HFSS rules online is the use of targeting tools to exclude children, which is
subject to a number of uncertainties, including: ● the use of devices, online profiles and accounts shared between adults and children; ● the communal viewing of content; ● the false reporting of users’ ages, and ● predictive inaccuracy in using interest-based factors and other behavioural data as a proxy for age.
77. Unlike in broadcast, there is no comprehensive, independently verified means of audience
measurement, which limits transparency and makes the rules more dependent on the accuracy of the tools used by each advertiser. Almost a quarter of 8-11 year olds have a social media profile,88 even though the minimum age for many sites is 13, while recent Australian research found an average targeting accuracy of only 59% in consumer profiles.89 If targeting online is, while directionally accurate, of limited specific reliability, it may be the case that children are seeing HFSS adverts where this is not the intent of the regulatory system.
78. It is also worth noting the complexity of the online advertising landscape, which incorporates content that has the effect of advertising (e.g. influencers), as well as more traditional forms of advertising such as banner or video ads. It also affords a more active role for consumers, with online users able to seek out content and publish adverts themselves. Near limitless advertising inventory with low barriers to entry makes the task of effective monitoring and complaints-led regulation more difficult.
79. The ASA has sought to keep pace with this complexity and the new challenges created by online advertising, for example publishing guidance for social media influencers on making advertising clearly identifiable. More recently, in November 2018 the ASA launched their new strategy ‘More Impact Online’90 which aims to put the protection of consumers online at the heart of its work over the next five years, and makes innovative commitments to explore, for example, the use of machine learning and AI to improve regulation.
87 CAP - Advertising guidance. Children and age-restricted ads online: https://www.asa.org.uk/resource/children-age-restricted-ads-online.html (accessed 06/03/2019) 88 Ofcom (2017). Children and Parents: Media Use and Attitudes report (p 4) 89 “How Effective Is Black-Box Digital Consumer Profiling And Audience Delivery?: Evidence from Field Studies” - Nico Neumann, Catherine Tucker and Timothy Whitfield - June 25 2018 90 Advertising Standards Authority - Corporate Strategy 2019-2023: https://www.asa.org.uk/resource/more-impact-online.html (accessed 06/03/2019)

26
Trends in children’s exposure to HFSS advertising since the regulations 80. Accurate measurement of children’s exposure to HFSS advertising on TV is hugely complex and
requires the marshalling of billions of data points from multiple datasets. Measurement needs to factor in the wide range of products on the market and the wide range of TV channels, and independent work to distinguish HFSS from non-HFSS product advertising and brand from product advertising. The identification of trends in children’s exposure is further complicated by changing viewing habits.
81. For these reasons, exposure has only been measured periodically since the introduction of the current restrictions. Ofcom’s final review of food advertising restrictions estimated that there were 12.1bn HFSS child impacts91 in 2005 (prior to advertising restrictions) and 7.7bn impacts in 2009 (shortly after restrictions were brought in).92 The Institute of Fiscal Studies’ analysis of HFSS advertising in 2015 estimated 5.7 billion HFSS child impacts, excluding supermarket and restaurant advertising.93
82. New research commissioned from Kantar to support this consultation, which has aimed to incorporate and categorise supermarket and restaurant advertising and re-evaluated the likely volume of advertising children see based on current TV advertising expenditure, suggests that there were 3.6 billion HFSS child impacts in 2017, of which around 2.6 billion were before the watershed.
Table 2: Overview of HFSS advertising studies, 2005-present
Study Period of
Review Estimated Child Food/Drink Impacts (bn)
Estimated Child HFSS Impacts (bn)
Estimated Weekly HFSS Advert Exposure per Child (mins)i
Ofcom 2005 15 12 9.1
Ofcomii 2009 13 7.7 5.8
Institute of Fiscal Studiesiii 2015 15 5.7 4.3
Kantariv 2017 8.5 3.6 2.7
I Assumes mean length of HFSS advertising at 21.3 seconds per impact, derived from Kantar analysis of 2017 advert lengths. Also assumes equal distribution across the child population, whereas in reality, obese children are likely to watch more TV than non-obese. ii Analysis of food advertising before and after the introduction of children’s TV HFSS restrictions, using proxy of Nutrient Profile Model. iii Analysis categorised products known to be HFSS based on Kantar World Panel data and Nutrient Profile Model, does not apply Nutrient Profile Model to supermarket or out-of-home market products or categorise them as HFSS. iv Analysis attempts to categorise supermarket and out-of-home market products using Nutrient Profile Model where possible.
83. While acknowledging the different methodologies used, the main conclusion we can draw from these
studies is that exposure levels have fallen significantly over time since restrictions were introduced. Although it’s important to note that the rate of decline has slowed and there are still billions of HFSS child impacts on TV each year.
84. Measurement of children’s exposure to online advertising is even more complex. Coupled with many of the same challenges that apply to measuring TV advertising, there is lower transparency in the system - reflecting the lack of comprehensive independent public data, widespread personalisation of advertising, and the sheer scale of the online advertising landscape. At the same time, given that HFSS
91 A child impact is defined as one view of an advert by one child. Therefore, ten impacts could be ten views by one child or one advert viewed by ten children. 92 Ofcom (2010) HFSS advertising restrictions - Final Review (p32) https://www.ofcom.org.uk/__data/assets/pdf_file/0024/31857/hfss-review-final.pdf (accessed 01/03/2019) 93 Institute for Fiscal Studies (2018) Children’s exposure to TV advertising of food and drink (Table 4.1) https://www.ifs.org.uk/uploads/BN238.pdf (accessed 01/03/2019)
27
restrictions only applied from July 2017, it is not possible to evaluate the effect of these restrictions on exposure.
85. Kantar’s research in seeking to quantify children’s HFSS advertising exposure online in the UK is largely unprecedented, and has been based principally on advertising expenditure. This research estimated 0.73bn HFSS child impressions94 online in 2017.
86. Establishing both the level and trend95 of online food advertising highlights the challenges of trying to measure activity in this market - more information on this is set out in section D(i). Nevertheless, Kantar’s findings and wider evidence sources, including Nielsen data (see Figure 4), indicate that the level of food advertising online is lower than on broadcast.
87. In its review of advertising restrictions in 2006, Ofcom judged that TV was the preferred channel for food and drink advertising for a number of reasons:
○ TV has near universal reach in the UK, which is important for mass-market advertisers such as manufacturers of fast moving consumer goods;
○ It has the ability to reach consumers rapidly, which is vital for manufacturers of goods that have a short shelf life or who want to build awareness of a product quickly;
○ The audio-visual environment offers powerful creative advertising possibilities for brand creation and strengthening;
○ There is a certain viewer attachment to it in the sense that TV content and advertising can be part of the discussion at work, home and school. Advertisers are able to benefit from such viewer attachment; and
○ As far as advertising targeted to children is concerned, TV is likely to be preferred to other media, both, because children are attracted to audio-visual content, and because they are not mature enough to respond to other media such as print advertising.96
88. Overall, the evidence base on online advertising of HFSS products is weaker than for broadcast. We
welcome further evidence on the scale of HFSS advertising online.
94 A child impression is the expression of online advertising exposure - similar to a child impact on TV. It denotes each time an advert is served and displayed on a website, regardless of whether or not it is seen or clicked on 95 ComScore data indicates that there has been a sharp reduction in food advertising online since 2015, from around 5bn to 1bn impacts, but due to the limited time series and coverage of the market, we do not judge this to be reliable evidence to establish a trend. 96 Ofcom (2006). Television advertising of food & drink products to children - Impact Assessment (p.76)

28
Figure 4. Breakdown of Nielsen advertising categories by media channel spend
B(v). Industry overviews
89. The following sectors have a direct relationship with HFSS advertising and will be impacted by any intervention.
Broadcasting 90. The UK is the main hub in Europe for audiovisual services. 1,203 TV channels are based in the UK,
out of 3,005 in the EU28, and about two-fifths of these channels established primarily target another market. The number of TV channels established outside the UK but targeting the UK is very small. About half of on-demand services established in the UK primarily target another market. The UK also has considerable export success: PACT, the production trade body, estimated revenue of £1.3bn in 2016 from the international sale of UK TV programmes and associated activities. Furthermore, DCMS economic estimates show that 194,000 people were employed in the UK’s wider audiovisual sector in 2016.97
91. The UK broadcasting sector is primarily driven by the public service broadcasters (PSBs), who together spent £2.6bn on original programming in the UK in 2016,98 and provide the central creative and economic impetus for a sector that also includes other commercial broadcasters, a growing presence of non-UK streaming services, and a vibrant independent production sector that generates revenues of c. £3bn a year.
92. The PSBs differ from other broadcasters in that they have set obligations to produce certain types of
content, including impartial national and local news, current affairs, and content that informs our understanding of the world, stimulates knowledge and learning, reflects the UK’s cultural identity and represents diverse and alternative views.99 As part of this, in the context of the UK’s obesity problem, PSBs have sought to use their reach with large audiences to promote healthy eating and physical
97 DCMS Economic Estimates: Employment, 2016 https://www.gov.uk/government/statistics/dcms-sectors-economic-estimates-2017-employment-and-trade (accessed 06/03/2019) 98 Ofcom PSB Annual Research Report 2017 (p3) 99 Ofcom review of public service television broadcasting, April 2004: https://www.ofcom.org.uk/__data/assets/pdf_file/0023/25655/psb.pdf (accessed 06/03/2019)

29
activity. For example, Channel 4’s recent healthy eating programming has included Food Unwrapped, Jamie's Sugar Rush, and Dispatches investigations into sugar and salt consumption, ITV Feel Good campaign which is designed to inspire people to eat better and move more, and Veg Power is a major new advertising campaign aimed at encouraging people to eat more vegetables.
93. The PSBs don’t just compete for viewers with a wide range of purely commercial channels, but now also with subscription video-on-demand services like Netflix and Amazon Prime Video (which are in a third of UK households100, and growing) as well as other online platforms such as Facebook and YouTube. Nine in ten people watched linear TV every week in 2017, for an average of 3 hours 23 minutes a day, but this was nine minutes less than in 2016.101 To mitigate the impact of this shift in viewing, the PSBs have taken steps including placing greater emphasis on their own on-demand players and developing their production businesses.
94. Just under a third of the UK television industry’s total revenue is generated by advertising, and this
proportion has remained steady from 2012 to 2017. Over the same time period, TV has accounted for just under a third of total display advertising spend in the UK.102 The main commercial TV broadcasters in the UK are ITV, which in 2017 had a 34.5% share of commercial impacts (SOCI), Sky with 25.5%, Channel 4 with 15.4%, and Channel 5 with 9.4%.103 The three main TV ad sales houses - run by ITV, Channel 4, and Sky - sell advertising on their own channels and on behalf of other broadcasters.
95. The television advertising market has seen some inconsistent growth this decade, in the face of increasing competition from online platforms. Revenue climbed from £4.71 billion in 2012 to £5.21 billion in 2016.104 It then fell to £4.9 billion in 2017. While figures for the first half of 2018 exceeded expectations105 the outlook is uncertain due to factors including the structural market changes (technological, competitive and audience changes) and wider economic uncertainty.
96. According to Nielsen data, food was the second largest advertising category on TV, spending £559 million in 2017 (down 11.4% on 2016). Given the importance of food advertising, and these wider market challenges, there is the potential that the commercially-funded PSBs may not be in a position to absorb lost revenue resulting from additional advertising restrictions while maintaining current levels of public service output, particularly when considered alongside the impact of new broadcast restrictions on gambling advertising announced recently by the gambling industry.
Online
97. Digital advertising is dominated by a small number of large companies (predominantly Google and Facebook, which generates over two thirds of UK digital advertising revenue), with 11 companies accounting for approximately 73% of the market; this is all concentrated in search engines, video sharing platforms and well-known social networks.106 In the UK, IAB/PwC Digital Adspend data show that mobile accounted for around 45% of total internet advertising in 2017, up from just 2% in 2010107. Online advertising grew by 11.3% in real terms in 2017 to £11.6bn and accounts for the majority of UK advertising spend (52%).
98. Although there may be a degree of substitution between traditional and online media, some of the growth in online advertising expenditure comes from new advertisers, which have never spent money on advertising before (a high proportion of these are small businesses). Consequently, a large part of
100 Ofcom Media Nations: UK 2018 p13 101 Ofcom Media Nations: UK 2018 p24 102 Ofcom Communications Market Report 2018 – p30 103 Channel 4 2017 Financial Report and Statements (p174) 104 Advertising Association/WARC Expenditure Report April 2018 105 Advertising Association/WARC Expenditure Report http://expenditurereport.warc.com/ (accessed 12/11/2018) 106 Digital advertising in the United Kingdom (UK), Statista, 2018 107 Ofcom, 2018 Communications Market Report (p53)
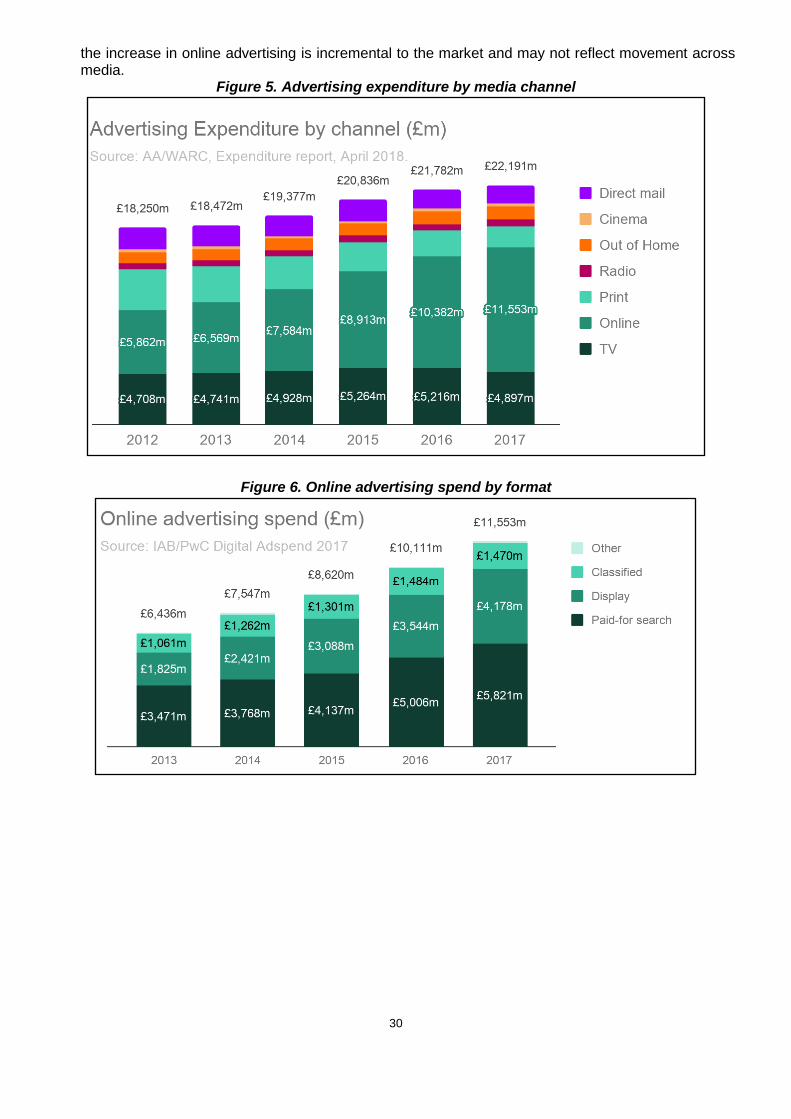
30
the increase in online advertising is incremental to the market and may not reflect movement across media.
Figure 5. Advertising expenditure by media channel
Figure 6. Online advertising spend by format

31
Figure 7. Online advertising spend by platform and format
Food and drink retailing and manufacturing
99. Many of the major supermarkets invest significant amounts of their promotional budgets in broadcast TV advertising, both to publicise their own brands and special offers they are running on other manufacturers products. This is particularly the case around national holidays, such as Easter and Christmas. The ‘Big Four’ retailers, Tesco, Asda, Sainsbury’s and Morrisons, account for the majority of GB grocery sales, capturing around 69% of the market in the 12 weeks ending 02/12/2018.108 In contrast, retailers outside the top 9 identified by Kantar account for less than 5% of the market.
Table 3: GB Grocery Market Shares, 12 weeks ending 02/12/2018109 Retailer Market Share
Tesco 27.6%
Sainsbury’s 16%
Asda 15%
Morrisons 10.5%
Aldi 7.6%
Co-op 6.2%
Lidl 5.6%
Waitrose 4.9%
Iceland 2.2%
Symbols and Independent 1.6%
Other 2.9%
108 GB Grocery Market Shares, Kantar Worldpanel: https://www.kantarworldpanel.com/en/grocery-market-share/great-britain (accessed 17/12/2018) 109 Figures might not sum to 100% due to rounding.
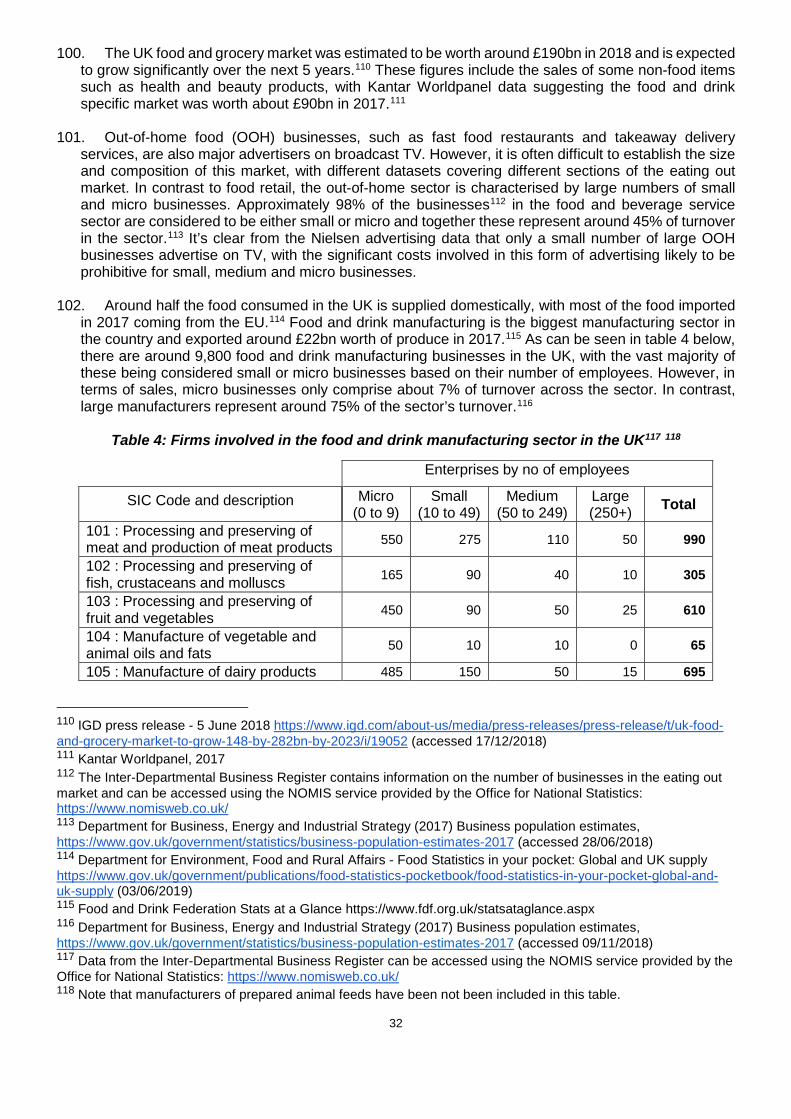
32
100. The UK food and grocery market was estimated to be worth around £190bn in 2018 and is expected to grow significantly over the next 5 years.110 These figures include the sales of some non-food items such as health and beauty products, with Kantar Worldpanel data suggesting the food and drink specific market was worth about £90bn in 2017.111
101. Out-of-home food (OOH) businesses, such as fast food restaurants and takeaway delivery
services, are also major advertisers on broadcast TV. However, it is often difficult to establish the size and composition of this market, with different datasets covering different sections of the eating out market. In contrast to food retail, the out-of-home sector is characterised by large numbers of small and micro businesses. Approximately 98% of the businesses112 in the food and beverage service sector are considered to be either small or micro and together these represent around 45% of turnover in the sector.113 It’s clear from the Nielsen advertising data that only a small number of large OOH businesses advertise on TV, with the significant costs involved in this form of advertising likely to be prohibitive for small, medium and micro businesses.
102. Around half the food consumed in the UK is supplied domestically, with most of the food imported in 2017 coming from the EU.114 Food and drink manufacturing is the biggest manufacturing sector in the country and exported around £22bn worth of produce in 2017.115 As can be seen in table 4 below, there are around 9,800 food and drink manufacturing businesses in the UK, with the vast majority of these being considered small or micro businesses based on their number of employees. However, in terms of sales, micro businesses only comprise about 7% of turnover across the sector. In contrast, large manufacturers represent around 75% of the sector’s turnover.116
Table 4: Firms involved in the food and drink manufacturing sector in the UK117 118
Enterprises by no of employees
SIC Code and description Micro (0 to 9)
Small (10 to 49)
Medium (50 to 249)
Large (250+) Total
101 : Processing and preserving of meat and production of meat products 550 275 110 50 990
102 : Processing and preserving of fish, crustaceans and molluscs 165 90 40 10 305
103 : Processing and preserving of fruit and vegetables 450 90 50 25 610
104 : Manufacture of vegetable and animal oils and fats 50 10 10 0 65
105 : Manufacture of dairy products 485 150 50 15 695
110 IGD press release - 5 June 2018 https://www.igd.com/about-us/media/press-releases/press-release/t/uk-food-and-grocery-market-to-grow-148-by-282bn-by-2023/i/19052 (accessed 17/12/2018) 111 Kantar Worldpanel, 2017 112 The Inter-Departmental Business Register contains information on the number of businesses in the eating out market and can be accessed using the NOMIS service provided by the Office for National Statistics: https://www.nomisweb.co.uk/ 113 Department for Business, Energy and Industrial Strategy (2017) Business population estimates, https://www.gov.uk/government/statistics/business-population-estimates-2017 (accessed 28/06/2018) 114 Department for Environment, Food and Rural Affairs - Food Statistics in your pocket: Global and UK supply https://www.gov.uk/government/publications/food-statistics-pocketbook/food-statistics-in-your-pocket-global-and-uk-supply (03/06/2019) 115 Food and Drink Federation Stats at a Glance https://www.fdf.org.uk/statsataglance.aspx 116 Department for Business, Energy and Industrial Strategy (2017) Business population estimates, https://www.gov.uk/government/statistics/business-population-estimates-2017 (accessed 09/11/2018) 117 Data from the Inter-Departmental Business Register can be accessed using the NOMIS service provided by the Office for National Statistics: https://www.nomisweb.co.uk/ 118 Note that manufacturers of prepared animal feeds have been not been included in this table.

33
106 : Manufacture of grain mill products, starches and starch products
95 25 25 10 155
107 : Manufacture of bakery and farinaceous products 1,875 745 165 55 2,840
108 : Manufacture of other food products 1,320 360 155 60 1,895
110 : Manufacture of beverages 1,935 245 70 20 2,265
Totals 6,925 1,990 675 245 9,820
103. It’s important to note that not all the food and drink manufacturers included in the table above will
produce HFSS products and therefore be impacted by these proposals. Furthermore, it's clear from the Nielsen data that only a small set of large food and drink manufacturers typically advertise their products on broadcast television, with the significant costs involved in this form of advertising being prohibitive for other smaller businesses.
104. Analysis by OC&C Strategy Consultants119 suggest that the UK’s ten largest food and drinks companies generate revenues of more than £22bn, with revenue growing by around 7.5% amongst the top producers in 2017. Ultimately, it is these large companies which market their products extensively on broadcast TV and online that are most likely to be impacted by any further advertising restrictions.
Figure 8: Top 10 food and beverage companies in the UK
119 OC&C Strategy Consultant’s 30th annual Food and Drink 150 report in collaboration with The Grocer.

34
C. Options overview
C(i). Options considered
105. The consultation document outlines three proposed policy options to restrict HFSS advertising on broadcast TV and four options for online.120 The fact that different regulations can be introduced on broadcast TV and online means these options could be implemented in several different combinations. For this IA, we have modelled four possible combinations. These are outlined in the table below. We are seeking further views and evidence on all options through the consultation process, which will help refine their design, evidence and parameters with the intention to model any options that we take forward more fully in the final stage Impact Assessment.
Table 5: Modelled policy options
Online options
Do nothing 21:00-05:30 watershed online
TV options
Do nothing Option A Option D
21:00-05:30 watershed on broadcast TV
Option B Option C
106. Option A. No additional regulation. This is the do-nothing scenario against which all other options
are compared. ● Option A assumes no changes in age-specific rates of overweight and obesity, but does
assume that the average BMI of cohorts of individuals increases over time as they age. This increase in average BMI has been based on modelled estimates of current experiences121.
● There was less food and drink advertising spend on television in 2017 than in the two preceding years, but a consistent trend in reduced HFSS spend over time could not be established. Time-series data for online advertising is also limited. As a result, the do-nothing scenario assumes that there is no change in the current levels of HFSS advertising spend. Although it is important to note that the advertising market may change significantly over time.
120 Insert condoc link when available 121 Ara et al. (2012) What is the clinical effectiveness and cost-effectiveness of using drugs in treating obese patients in primary care? A systematic review. Health technology assessment (Winchester, England);16(5):iii, https://www.ncbi.nlm.nih.gov/pubmed/22340890 (accessed 28/06/2018).
35
● However, there is substantial evidence that children are watching less broadcast television over time122, and are therefore seeing less HFSS advertising on this medium. Conversely, they are spending more time online123, potentially seeing more digital HFSS advertising. For comparison with other options, we have factored these trends into the estimated benefits by assuming that the gross level of children’s exposure to HFSS advertising would change in line with these media usage trends for the next five years, with a flat trajectory thereafter.
● Due to the large number of uncertainties which would need to be considered, the do-nothing scenario does not attempt to quantify the future impact of the policies already announced as part of the ‘Childhood Obesity: A Plan for Action124, or any other possible future actions by government.
107. Option B. Advertising restriction on HFSS products in scope of the SDIL, and PHE’s Sugar and
Calorie Reduction Programmes, applied on broadcast TV only, via a 2100-0530 watershed. Retain current regulations online.
● The restriction would be based on the 2004/2005 NPM, applied only to the products in scope of PHE's sugar125 and calorie reduction programmes126, and drinks in scope of the SDIL.127 This would target the products that are significant contributors to sugar and calories in children's diets, whilst ensuring that staples such as oil, butter and cheese are exempt.
● The TV option also contains an exemption for broadcast channels that have a low child audience of under 1% of UK children aged 4-15 (c.90,000 children). As mentioned in the consultation document, though a channel exemption has been modelled, we have asked whether such an exemption should apply at programme or channel level.
● Under this option the current HFSS advertising restrictions would be retained online. Government would welcome views and evidence on what further action could be taken by the sector or regulators in order to meet our objectives in this area.
108. Option C. Advertising restriction on HFSS products in scope of the SDIL, and Public Health
England’s (PHE’s) Sugar and Calorie Reduction Programmes. Applied via a 2100-0530 watershed on broadcast TV and online.
● This restriction would be based on the same categories of products outlined in ‘option B’. However, a 2100-0530 watershed would also be implemented online.
● For online platforms the consultation asks whether exemptions should be granted for sites that can demonstrate exceptionally high standards of evidence that children will not be exposed to HFSS advertising. However, for the purposes of modelling we have not applied an exemption.
● A watershed for HFSS advertising online would be a world first, and our starting point is that all categories of online advertising would be in scope of the restriction. However, we recognise that a watershed may be difficult to apply for particular types of advertising, for example in areas like viral marketing, some influencer marketing and advertising claims on advertisers'
122 Ofcom (2018), Media Nations. Available at: https://www.ofcom.org.uk/__data/assets/pdf_file/0014/116006/media-nations-2018-uk.pdf (accessed 05/02/2019) 123 Ofcom (2018), Media Nations. Available at: https://www.ofcom.org.uk/__data/assets/pdf_file/0014/116006/media-nations-2018-uk.pdf (accessed 05/02/2019) 124 DHSC (2018) Childhood obesity: a plan for action, chapter 2, https://www.gov.uk/government/publications/childhood-obesity-a-plan-foraction-chapter-2 (accessed 30/01/2019) and DHSC (2016) Childhood obesity: a plan for action, https://assets.publishing.service.gov.uk/government/uploads/system/uploads/attachment_data/file/546588/Childhood_obesity_2016__2__acc.pdf (accessed 30/01/2019) 125 Public Health England (2017). Sugar reduction: Achieving the 20%: https://www.gov.uk/government/publications/sugar-reduction-achieving-the-20 (accessed 01/03/2019) 126 Public Health England (2018). Calorie Reduction: The Scope and Ambition for Action: https://assets.publishing.service.gov.uk/government/uploads/system/uploads/attachment_data/file/685359/Calorie_reduction_The_scope_and_ambition_for_action.pdf (accessed 01/03/2019) 127 HMRC (2018), Check if your drink is liable for the Soft Drinks Industry Levy: https://www.gov.uk/guidance/check-if-your-drink-is-liable-for-the-soft-drinks-industry-levy (accessed 01/03/2019)

36
own websites and social media space. As part of this option, Government therefore welcomes views on scope of a time-based advertising restriction.
● As outlined in the consultation document, Government would welcome views on possible exemptions from an online watershed for advertising targeted at individual users based upon the use of behavioural data, and for advertising targeted at websites based upon the use of demographic data, where advertisers can demonstrate exceptionally high standards of evidence that children will not be exposed to HFSS advertising.
109. Option D. Retain the current set of food advertising restrictions for broadcast TV and introduce an
online advertising restriction on HFSS products in scope of the SDIL, and PHE’s Sugar and Calorie Reduction Programmes, applied via a 2100-0530 watershed.
● Under this option, we would retain the current regulatory environment on broadcast television, but would introduce a watershed restriction (as per ‘Option C’) for online only to address concerns over children’s exposure to HFSS advertising online and align with the shift of children's media habits.
C(ii). Alternative Options Considered
110. During the course of our work, a broader range of policy options, other than those set out above were considered and discounted. We recognise that advertising is just one of a range of factors that influence children’s HFSS consumption, and that any additional measures should be seen in the context of other interventions already in place or proposed. This includes current advertising and food restrictions, the other government measures proposed in the Childhood Obesity Plan, and voluntary interventions by broadcasters, advertisers and product manufacturers. Though we have not modelled cumulative impact here, it is likely that measures are complementary and the whole is greater than the sum of its parts.
111. Chapters 1 and 2 of the Childhood Obesity Plan also include interventions to deter children’s consumption of HFSS products; by limiting volume and location promotions of HFSS products, introducing mandatory calorie labelling on menus out-of-home and encouraging food and drink manufacturers to reformulate their products.
112. In light of policies that are in place or being developed as part of the Childhood Obesity Plan, we considered the following alternative options:
113. Further qualitative restrictions on advertising to children. As previously outlined, the CAP and BCAP codes also restrict the content used to promote HFSS products (e.g. using licensed characters or celebrities popular with children), so that they are not deliberately targeted at children or exploit their credulity, loyalty, vulnerability or lack of experience. We have seen limited evidence challenging the effectiveness of these restrictions covering the content of HFSS adverts, and as a result we are not seeking to revise these rules as part of this consultation.
114. Restrictions in other media. There is evidence that TV advertising is still the most effective and influential form of advertising, presenting a much higher return-on-investment (RoI) than other forms of media, estimated at £4.20 for every £1 invested. Print advertising (£2.43) and online video (£2.35) advertising present a distant second and third choice.128
Table 6. Return on Investment for Different Forms of Advertising (source: Ebiquity and Gain Theory, for Thinkbox)
128 Campaign - TV ads create 71% of advertising-generated profit: https://www.campaignlive.co.uk/article/tv-ads-create-71-advertising-generated-profit/1450314 (accessed 01/03/2019)

37
Form of advertising
% of total ad-generated profit (3yrs)
Average ad-generated total profit ROI
Total ad-generated profit likelihood
% of short-term profit (3-6 mths)
Average ad-generated short term profit ROI
Short-term ad-generated profit likelihood
All media 100% £3.24 72% 100% £1.51 58%
TV 71% £4.20 86% 62% £1.73 70%
Print 18% £2.43 78% 22% £1.44 61%
Online Video 4% £2.35 67% 5% £1.21 52%
Radio 3% £2.09 75% 5% £1.61 62%
Out of Home 3% £1.15 48% 3% £0.57 19%
Online Display 1% £0.84 40% 2% £0.82 37%
115. The distinction between print media of particular appeal to children is easier to define than in other media, so we assessed that inadvertent exposure or deliberate targeting are likely to be less common with HFSS advertising through print. Therefore, we have not suggested further restrictions in this medium. Digital advertising provides a lower return than TV, but children are spending more and more of their time online. Also, if the price of broadcast TV advertising were to increase, then that could lower the RoI for this category of advertising and create market conditions that displace HFSS advertising online. Online display advertising is also growing extremely fast and presents a likely future avenue for any displacement, although we note that Nielsen data suggests that food and drink advertising as a category currently remains less focused on online than other media.
This consultation does not propose further restrictions on other forms of advertising regulated by the BCAP (radio) and CAP Codes (print, outdoors, direct marketing and cinema). As committed to in Chapter 2, the NIHR Obesity Policy Research Unit will continue to review the evidence base of the effect of marketing and advertising on children, including in these areas.However, we also recognise the possibility that advertising restrictions for TV and online could displace advertising revenue to other channels, potentially weakening the effectiveness of the policy. On that basis, the consultation seeks views on whether additional advertising restrictions should also apply to any or all of these other media.
116. Applying restrictions to all food and drink advertising categories. We have assessed the
current baseline of HFSS advertising on broadcast TV and online, as well as the amount of advertising for each food/drink category. In Ofcom’s analysis (2006), they assessed that HFSS advertising was 80%-90% of all food and drink advertising, and concluded that a complete ban of food and drink advertising would restrict and reduce incentives for the marketing of healthy products, incur higher costs for businesses and harm reformulation efforts. Kantar assessed that HFSS advertising was closer to 45% of the food and drink advertising market in 2017.129 In light of Ofcom’s previous assessment, and the advertising market now containing a higher proportion of healthier products, we believe that applying restrictions to all food and drink would be inefficient and create negative policy outcomes.
117. Applying restrictions to all HFSS categories. We are proposing to use the Nutrient Profiling Model (NPM) 2004/05 as an evidence based tool to classify products as being HFSS or non-HFSS. The NPM was created by the Food Standards Agency, in collaboration with health NGOs, academics and the food and drink industry to determine which products are able to advertise during children’s programming. It has been used by advertisers since 2008 to implement BCAP and CAP Codes. The 2004/05 version is currently the most up to date published version of this model.
129 The modelling process Kantar used to estimate the proportion of advertising which is HFSS can be found in Annex D

38
118. Informed by Kantar’s (2018) research, we have considered options that restrict all HFSS advertising, and assessed that approximately 12% of advertising may influence adult obesity but have a negligible impact on children (e.g. cooking oils and low sugar dairy products). Restricting this advertising would also add considerable additional costs to broadcasters through lost advertising (Kantar estimate between £14-30m per annum). This would not deliver on our policy objectives of focusing on the products which contribute the most to childhood obesity and ensuring any economic impact is proportionate. Instead, in light of the wider work undertaken by PHE to categorise the food and drink products that are significant contributors of sugar and calories in children’s diets130 and the wider context of the Soft Drinks Industry Levy, we are proposing to only apply the 2004/05 NPM to products in scope of the SDIL and PHE’s sugar and calorie programmes. Please see table 7 below for a list of the product categories included.
130 Public Health England (2018) Calorie reduction: the scope and ambition for action https://www.gov.uk/government/publications/calorie-reduction-the-scope-and-ambition-for-action (accessed 30/01/2019) and Public Health England (2018) Sugar reduction: Achieving the 20% https://www.gov.uk/government/publications/sugar-reduction-achieving-the-20 (accessed 30/01/2019)

39
Table 7. Products within the scope of the Soft Drink Industry Levy and Public Health England’s Sugar and Calorie Reduction Programmes131
Products included in PHE reduction programmes and SDIL Please note the calorie categories are currently under informal consultation with Industry
and stakeholders and the list presented is the preliminary categories that were published in PHE’s calorie reduction: the scope and ambition for action. We are expecting PHE to publish the categories of food in scope in mid-2019 and this will inform our final policy position on
further advertising restrictions.
● Breakfast cereals ● Yoghurt and fromage frais ● Biscuits ● Cakes ● Morning goods ● Puddings ● Ice cream ● Sweet confectionary ● Chocolate confectionary ● Sweet spreads ● Milk based drinks and fruit juices which
are exempt from the SDIL ● Sugar sweetened beverages with more
than 5g added sugar per 100ml ● Bread with additions (e.g. olives, cheese
etc.) ● Crisps and savoury snacks ● Savoury biscuits, crackers and
crispbreads ● Potato Products (e.g. chips, croquettes,
mashed potato etc.)
● Meat, fish and vegetarian pastry pies and other pastry products
● Cooking sauces and pastes ● Table sauces and dressings ● Pasta/ rice/ noodles with added
ingredients and flavours ● Ready meals with carbohydrate
accompaniment (potato, rice, noodles, pasta, etc.) – fish, meat and meat alternatives
● Meal centres without carbohydrate accompaniment (potato, rice, noodles, pasta, etc.) – fish, meat and meat alternatives
● Prepared dips and composite salads as meal accompaniments (e.g. coleslaw, potato salad, guacamole, salsa etc.)
● Pizza ● Egg products/ dishes (e.g. quiche) ● Food to go e.g. sandwiches, boxed main
meals, salads etc. ● Sausages (raw and cooked) and
sausage meat products, frankfurters, hotdogs and burgers
119. Given the overall policy aims, and the evidence discussed above, we have assessed the options
against the following principles to ensure that they: ○ Focus on limiting HFSS advertising exposure to children; ○ Align with current restrictions and those being developed within the Childhood Obesity Plan; ○ Are time, rather than volume, based, in order to give clarity to parents; ○ Cover broadcast TV and online only; ○ Maintain the current qualitative rules around HFSS advertising.
131 The product categories to be included in the calorie reduction programme will be confirmed after engagement with stakeholders. However, Public Health England have indicated the product categories which will be included in the programme:https://www.gov.uk/government/publications/calorie-reduction-the-scope-and-ambition-for-action
40
C(iii). Assessing the impact on the broadcasting sector
120. Our assessment of the impact of HFSS advertising restrictions on broadcasters is based on several factors and assumptions, including:
○ The impact on broadcasters is dictated by whether food and drink manufacturers and retailers continue advertising on their channels, by either amending HFSS adverts or rescheduling them.
○ Based on the reported return on investment, we assume that food and drink advertisers value television advertising and will employ reasonable mitigations to continue advertising.
○ Advertising airtime is traded on the basis of how effectively it reaches its target audience. We assume that broadcasters are selecting and scheduling advertising to achieve optimal profit. Restricting what can be advertised and when it can be scheduled would lower the price broadcasters could charge and the revenue they could generate.
121. To assess the impact of HFSS advertising restrictions on broadcasters, it is important to consider
the operation of the TV advertising market. As Ofcom (2006)132 highlighted in its assessment of food advertising restrictions, the trading of commercial airtime is driven by the supply of broadcaster airtime and the demand by advertisers and media buyers. The demand side of this equation will vary depending on the nature of the product or service being marketed. Hence, the price of airtime is usually based on how effectively it reaches the advertiser’s target audience. This is typically measured by the number of times an advert is seen by this audience, known as commercial impacts. Therefore in assessing the costs to broadcasters, we do not assume that these result from HFSS advertising slots being vacant, but from broadcasters having to offer these slots to other advertisers for a lower price. A watershed may increase demand for unrestricted advertising airtime from 2100-0530 but, again, advertisers would only be willing to pay a premium if their adverts reach the right audience.
122. To evaluate each policy option it is necessary to: analyse the reasonable steps advertisers would take to continue advertising on television; determine changes to advertising pricing for advertising (HFSS, non-HFSS food/drink and other categories of advertising) pre and post watershed; determine the expected substitution of other advertising, and consider adjustments by broadcasters to reduce costs in light of a revenue loss.
123. However, the TV advertising market is complex and does not allow for a precise evaluation of the effects of a watershed for advertising HFSS products. There are hundreds of advertising campaigns on television, running across hundreds of channels, each seeking different target audiences, and it is not possible to provide a precise assessment of how the average price of advertising would change in the face of this type of restriction. This assessment will therefore assess the range of potential impacts on broadcasters based on assumptions about broadcaster/advertiser behaviour in reaction to a watershed. This analysis is described in detail in Annex D.
124. Demand for broadcast advertising is also dependent on the availability of alternative forms of advertising in other sections of the media and the returns they provide. Out-of-home, cinema, radio and online advertising have different prices and will have different effects on demand for broadcast space. The cost effectiveness of advertising on other media will likely determine how much displacement will take place and where it goes.
125. The impact on broadcasters is measured against a ‘do nothing’ benchmark, provided by Kantar. This benchmark assumes current market trends will continue and that there are no regulatory interventions - that is zero costs and benefits. However, this assessment considers trends in children’s use of media over the appraisal period, as children are watching less television, while spending more time online over time.
126. A negative impact on broadcasters may be mitigated by methods including lifting other regulatory burdens, or through the broadcasters themselves taking decisions to adapt. Broadcasters are subject
132 Ofcom (2006). Food Advertising Impact Assessment (p.80): https://www.ofcom.org.uk/__data/assets/pdf_file/0017/38222/annex6.pdf (accessed 01/03/2019)

41
to a broad range of regulatory interventions, including content and production requirements. However, these complex interventions have together been designed to help shape a carefully balanced broadcasting ecology that supports high quality public service content, a vibrant independent production sector, and a competitive and diverse market. As such, there are no easily identifiable regulatory mitigations at this stage. As a result, the focus here for likely mitigations is broadcasters making commercial decisions on where to cut costs.
C(iv). Assessing the impact on online platforms
127. Our assessment of the impact of HFSS advertising restrictions on online platforms is based on similar factors and assumptions to those used for the broadcast sector. The differences between our assessment of online platforms and our assessment for broadcasters are outlined below:
○ The online advertising market encompasses a wider range of different formats of advertising (classifieds, video, display, search, sponsored, native, etc). In assessing the scale of the online HFSS advertising market, we have accounted for the varying ‘cost per thousand impacts’ of different formats of online advertising.
○ Unlike for broadcast, we have not modelled an online de minimis audience exemption. With much of online advertising being behaviourally targeted, it is not possible to assess the efficacy of such an exemption. However, we are consulting on whether there should be any exemptions, where advertisers can provide strong evidence that they would still achieve our policy outcomes.
128. It is also our assessment that the established platforms are likely to cope better with any new regulatory changes than developing or newcomer counterparts. We are therefore seeking views on the likely impact on these respective groups.
C(v). Assessing the impact on food manufacturers, retailers and advertisers
129. To assess the impact of HFSS advertising restrictions on manufacturers, retailers and advertisers, it is important to account for other factors influencing the sector. Several measures, both voluntary and regulatory are either underway or will be consulted on in the future. The measures in the Government’s Childhood Obesity Plan are outlined in the Policy Context section above.
130. Furthermore, the Food & Drink Federation (FDF) has reported133 on the voluntary measures food manufacturers have taken to:
○ Reformulate– FDF soft drink companies have reduced sugars from their products by 19% between 2016-2018;
○ Encourage healthy eating and living through campaigns and activities134; and ○ Reduce portion sizes135
131. The effects of a watershed on HFSS TV advertising must be viewed in the context of this wide
range of Government intervention and industry voluntary action. These measures are not isolated from each other and as such it will be difficult to assess the individual effect of each measure. This, combined with the changing opinions towards HFSS foods, means that it is not possible to make a realistic quantitative assessment of this policy’s isolated effect on manufacturers, retailers and advertisers.
133 FDF Health Report - Feeding Change, May 2018, Food & Drink Federation 134 For example, Lucozade Ribena Suntory’s ‘Made to Move’ campaign https://www.lucozadesport.com/madetomove/ and Coca-Cola’s Parklives https://www.parklives.com/ 135 For example, Haribo have standardised their mini-packs to 18g and 25g, bringing their caloric content to below PHE’s target of 150kcal.
42
132. Product innovation and reformulation is driven by consumer demand. Restrictions on HFSS advertising may encourage manufacturers and retailers to develop new healthy products or reformulate existing products, allowing access to unrestricted advertising.
133. HFSS advertising restrictions may impact the opportunities for new companies or products to enter the HFSS market. Existing products which have built up awareness in the market may have their positions solidified due to the higher barrier for entry for new products.
134. However, there are a number of reasons to believe that the impact of further HFSS advertising restrictions would have a relatively modest impact in aggregate on manufacturers, retailers and advertisers:
○ while there are significant costs associated with reformulation, restrictions on advertising form only a small portion of the pressures driving reformulation efforts;
○ Not all HFSS products are advertised through TV and online channels; ○ the proposed restrictions only apply to the subset of HFSS foods which fall within PHE’s
calorie and sugar reduction categories; ○ these restrictions are not intended to eliminate HFSS advertising, but to significantly diminish
their exposure to children; ○ it may be possible for HFSS manufacturers and retailers to reformulate so that their products
do not fall under the scope of the restrictions; and ○ many HFSS manufacturers and retailers have broadened their product ranges to include non-
HFSS products136 in response to changing consumer demand. These manufacturers and retailers will have a greater opportunity to promote these products and mitigate the impact of HFSS restrictions.
135. Noting these factors and the landscape of the Government’s Childhood Obesity Plan, we believe
that the impact on manufacturers, retailers and advertisers will be relatively modest overall, particularly considered over time. This is due to the range of options available to mitigate the impact of restrictions, many of which are already occurring due to changing consumer preferences.
D. Cost and Benefits methodologies
D(i). Overall Methodology 136. The methodology used to derive cost-benefits for our options is illustrated in figure 9.
136 For example, The Coca-Cola Company has continued to put significant investment in its zero-calorie portfolio. Since Coke Zero’s relaunch, the product has become the UK’s fastest growing cola, growing by 41.3% on the previous year (FDF Health Report - Feeding Change, May 2018, Food & Drink Federation)

43
Figure 9. Estimating the costs and benefits of HFSS advertising restrictions
D(ii). Costs Calculation Methodology
137. This section summarises the methodology used to calculate the costs to broadcasters and online platforms. A full methodology note is included at Annex D. The calculations of costs to manufacturers and retailers are described in section D(ii), where individual options are evaluated.
Broadcaster Baseline
Creating a 2017 dataset of commercial TV impacts 138. Initially, 2017 TV spends for all food, drink and restaurants advertisers were sourced from Nielsen
using their Addynamix (reporting software). The Nielsen data provided the most detailed publicly available list of the food and drink products which were advertised on television in 2017 – accounting for £891m in reported TV spends. Data for alcohol and infant formula advertising was captured in this set but removed at the beginning of the analysis – reducing the total reported spends to £789m.
139. Further analysis of the Nielsen data revealed that 48% of the listed product adverts only represented 7.5% of market impacts. To expedite the analysis this “long tail” of values was separated out with Kantar focussing on pairing nutritional data to the remaining 52% of the reported 807 products, which represented 92.5% of the total market impacts. The observed nutritional composition of the 92.5% was later applied to the “long tail” of advertising.
140. Nielsen spend data was replaced with Broadcasters' Audience Research Board (BARB) actual (un-weighted) impacts for adults, children 4-15, children 4-6, children 7-10 and children 11-15. BARB data is the most robust source of TV viewing available and represents the UK industry standard for TV measurement. The data replacement was achieved by reporting all impacts for the same Nielsen-defined categories (food, drink, restaurants and bars) at a brand (product) level. Each line was manually checked – where BARB product attribution for impacts was unclear, investigation of creative (recorded by Nielsen), film titles and codes (recorded by BARB), product categorisation (recorded by

44
both) and campaign timings were used to attribute the correct BARB impacts to the Nielsen-defined advertisers.
Calculating time of day distribution of impacts (for TV) 141. HFSS impacts were distributed according to the time of day the HFSS advertising spend was
accrued, rather than solely assigning proportion of impacts based on how many children were watching at the time. This gives an estimated delivery of HFSS impacts by day time that takes into account the existing restrictions to HFSS products.
Calculating minutage 142. Kantar looked at the proportion of spend by time length for HFSS advertising within the Nielsen
dataset. The split for spend was applied to impacts to estimate the distribution of HFSS impacts by time length. Assuming each impact is a fully watched ad, Kantar multiplied impacts by time length to get total seconds and minutes of HFSS advertising seen by children in 2017. In summary: gross minutage = sum of (impacts x time-length).
Online Baseline Estimating total market spend online 143. Evidence of the volume of HFSS advertising online is limited. The most reliable and accessible
measure of what has been advertised and audience impacts, comes from ComScore. Their data covers display advertising on laptops and personal computers, which we estimate represents only 9% of the digital advertising market that would contain food and drink advertising.137
144. Kantar’s review of this data revealed that £2.3m of advertising spend was attributable to HFSS products, an estimated 8.3m commercial impacts delivered to children. We believe that this is a significant under-representation of the amount of HFSS advertising online. The digital display advertising market ComScore covers was valued at £894m, so - on these data - HFSS advertising spend represented only 0.3% of this market. Overall, digital display advertising does not appear to be a medium that is representative of online food advertising overall - based on reporting from Statista and Group M, the food advertising market was worth 5% of UK advertising spend in 2016, or £927m.138
137 Internet Advertising Bureau, the figure of 9% was calculated by assuming HFSS advertisements do not feature as Classifieds. 138 Industry sectors ranked by advertising expenditure in the United Kingdom (UK) in 2017, Statista: https://www.statista.com/statistics/452411/advertising-expenditure-by-industry-sector-in-uk/ (accessed 01/03/2019)
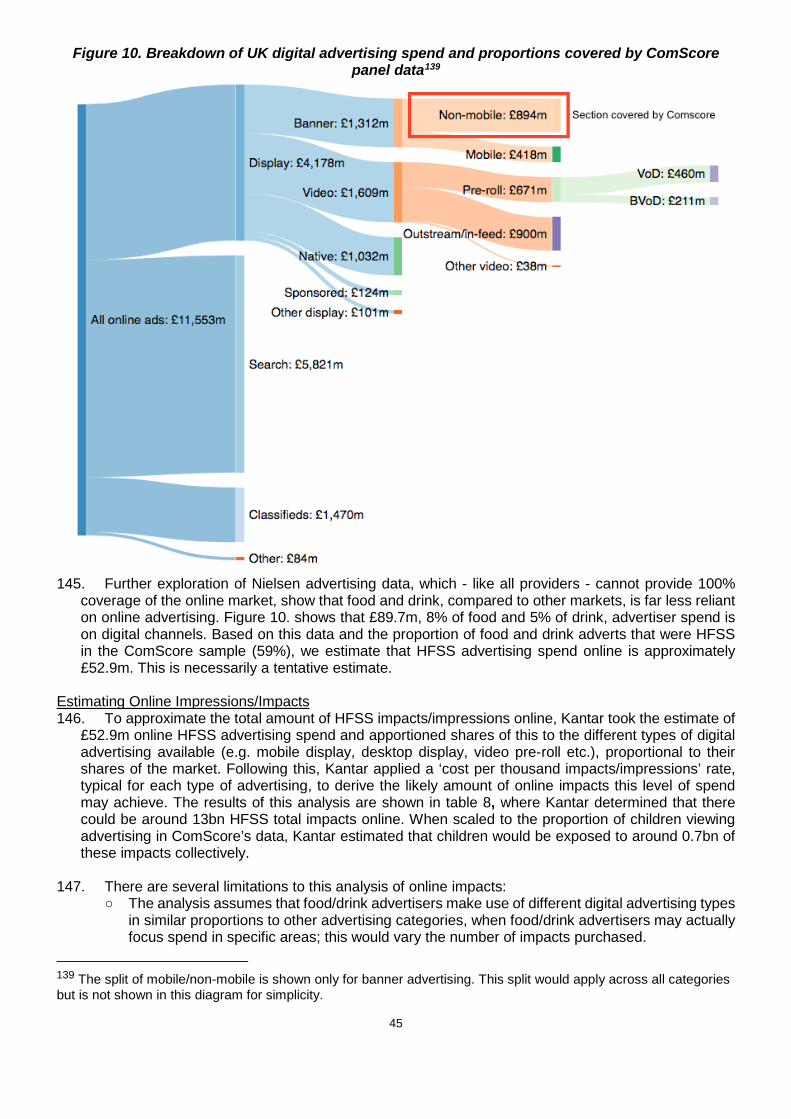
45
Figure 10. Breakdown of UK digital advertising spend and proportions covered by ComScore panel data139
145. Further exploration of Nielsen advertising data, which - like all providers - cannot provide 100%
coverage of the online market, show that food and drink, compared to other markets, is far less reliant on online advertising. Figure 10. shows that £89.7m, 8% of food and 5% of drink, advertiser spend is on digital channels. Based on this data and the proportion of food and drink adverts that were HFSS in the ComScore sample (59%), we estimate that HFSS advertising spend online is approximately £52.9m. This is necessarily a tentative estimate.
Estimating Online Impressions/Impacts 146. To approximate the total amount of HFSS impacts/impressions online, Kantar took the estimate of
£52.9m online HFSS advertising spend and apportioned shares of this to the different types of digital advertising available (e.g. mobile display, desktop display, video pre-roll etc.), proportional to their shares of the market. Following this, Kantar applied a ‘cost per thousand impacts/impressions’ rate, typical for each type of advertising, to derive the likely amount of online impacts this level of spend may achieve. The results of this analysis are shown in table 8, where Kantar determined that there could be around 13bn HFSS total impacts online. When scaled to the proportion of children viewing advertising in ComScore’s data, Kantar estimated that children would be exposed to around 0.7bn of these impacts collectively.
147. There are several limitations to this analysis of online impacts:
○ The analysis assumes that food/drink advertisers make use of different digital advertising types in similar proportions to other advertising categories, when food/drink advertisers may actually focus spend in specific areas; this would vary the number of impacts purchased.
139 The split of mobile/non-mobile is shown only for banner advertising. This split would apply across all categories but is not shown in this diagram for simplicity.
46
○ Search advertising contains a component of search-engine optimisation, which impacts the order of site search results and likelihood of directing children to HFSS advertisers, but does not constitute a HFSS advert. It has not been possible to estimate the child impressions associated with this form of spend.
○ We cannot assign accurate run-lengths to these advertisements to determine an effect on calorie consumption. We have assumed that online video advertisements run to similar lengths to their broadcast equivalents, but with a lower proportion being viewed in entirety.140
○ This data cannot take into account current CAP restrictions around advertising to children online, so this likely represents an upper bound of what HFSS advertising children see online (if we accept that the overall estimate of the volume of advertising is correct).
Table 8: Kantar estimates for all food and drink online advertising impressions
Proportion of Spend141
Digital Market
Spend £m
Digital Food/Drink Spend £m
Estimated Individual Impressions (m)
Display banners desktop 8.9% 894 8.0 994 Display banners mob 4.1% 418 3.7 465 Display video - pre roll 6.7% 671 6.0 271 Display video outstream 8.9% 900 8.0 1,601 Other display video 0.4% 38 0.3 34 Native 10.2% 1,032 9.2 18,361 Sponsored 1.2% 124 1.1 N/A Other display 1.0% 101 0.9 225 Search 57.7% 5,821 51.8 N/A Classified N/A 1,470 N/A N/A Other 0.8% 84 0.8 150 Total 11,553 89.7 21,951
148. Our estimates suggest that native online advertising represent around 80% of all online advertising
impacts. We have assumed that this is because this form of advertising is inexpensive and relatively ineffective. Native advertising is designed to resemble the format of the surrounding editorial content but paid for by the advertiser - e.g. posts or videos appearing within a user’s social media feed.
149. Our estimates suggest that around 51% of other online advertising impacts are for video adverts.
Using the process outlined above and assuming that the same proportion of native advertising impacts are from video adverts, we estimate that children are exposed to around 0.37bn video and 0.36bn display HFSS advertising impacts online each year.
Estimating child exposure online 150. ComScore, unlike BARB, cannot report advertising impacts for a given audience. Kantar
Consulting have therefore used a bespoke modelling tool – CrossMedia – to estimate levels of exposure for children based on the reported impacts for adults. Please see Kantar’s methodology at Annex D for more detail on the functionality of the CrossMedia tool.
Attributing Nutrient Profile Model Scores data to impacts for TV and online
140 Skipping Around the World: Optimizing Skippable Video, Magna Global, May 2018, p11, p14 https://magnaglobal.com/wp-content/uploads/2018/05/Magna-IPG-Lab-Skipping-Around-the-World.pdf (accessed 31/01/2019) 141 Based on pattern of spend observed across wider digital advertising categories.
47
151. NPM scores data was initially derived from existing Kantar Worldpanel datasets for 2017, and manually matched with impacts at a product level.
152. Kantar Worldpanel collect nutrition data from food labels on individual products via fieldworkers who visit retail stores on a rolling 4-6 monthly basis. This information is supplemented by products images from third party suppliers. Where nutrition data has not been collected for a product, Kantar Worldpanel imputes nutrition values based on similar products or with category averages. Fruit Vegetable and Nut scores are estimated at a category level, as this information is not captured in the Kantar Worldpanel data.
153. For this project, the nutrient values for September 2017 were used, with product level information provided where an advertisement was for a particular product. Where the advertisement covered a brand or range, so where a precise product is unidentifiable either a) an average of the real largest selling products has been used or b) a sales weighted average (for large ranges or manufacturers). This has been specified where a sales weighted average figure has been used rather than just an average of the range and will reflect an average for the 52 weeks.
154. Using this approach, Kantar Worldpanel were able to assign NPM scores to 316 products advertised on TV, out of a total of 428. This was done to expedite the categorisation process– these 316 products represented 91.5% of the total food and drink advertising impacts. For Online Advertisements 129 products were assigned an NPM score out of a total of 269 products/brands/ranges/manufacturers.
155. For products that had tracked advertising activity but did not sit on existing datasets, NPM classification was applied manually using publicly available nutrition data. Where relevant, the advertisement was viewed to help guide categorisation.
Broadcast restrictions modelling methodology Starting position 156. The starting position was to analyse how much advertising spend fell into the scope of the
watershed restriction and the amount of commercial impacts this represented. This was accomplished by removing impacts that were outside the scope of Public Health England’s Sugar and Calorie Reduction Programmes or the Soft Drink Industry Levy. This represented the highest amount of revenue and impacts within the scope of the restriction options.
De minimis channels 157. As part of the policy options, a de minimis exemption has been modelled for channels that reach
less than 1% of the UK child audience; these would be excluded from the regulation. The impact of doing this has been demonstrated in the analysis and all the figures presented. Please note that the consultation also proposes a de minimis, in and adjacent to programmes with under this 1% audience, but this has not been modelled.
Assumption that some advertisers would remove all their campaign spend on television 158. It should be noted that this scenario includes the assumption that some advertisers would remove
spend completely from TV (also applicable to the online modelling), not just from the pre-9pm watershed period. Kantar’s modelling of total revenue at risk works on this basis, because of its assessment of the fixed costs of broadcast advertising. There were a number of advertisers with small (<30%) levels of investment post-watershed. Where these advertisers are affected by the regulation they can keep, reduce, or increase their spend post-watershed, or remove the spend from TV completely. Kantar’s analysis assumes that even though the watershed allows advertisers to keep spending post 9pm, measurement of revenue at risk should include entire campaigns being removed, if over 50% of their advertising spend takes place between 0530-2100. This assumption is born from three considerations:
○ Restricting an HFSS advert between 0530-2100 reduces the audience for HFSS adverts by an average of 60%; and

48
○ The cost of producing a TV advertisement is a significant proportion of an advertising campaign’s cost, anywhere between 20-50% of the total cost of a TV campaign, with buying advertising space on TV accounting for the remaining spend;
○ An assumption that only campaigns that predominantly advertise from 2100-0530, could adapt to advertising during this time window and still reach their target audience.
159. The aforementioned factors would reduce the return on investment significantly; under a watershed restriction, advertisers would need to commit the same fixed cost to produce an advert that reaches only 40% of its pre-restriction audience. Using data cited earlier in the document, the estimated return on investment for television was £4.20 for every £1 invested, with print advertising (£2.43) and online video (£2.35) advertising providing the next best returns. Reducing the return on investment would make these other channels a more logical place to advertise. This is demonstrated clearly using a simple illustrative example:
○ Current advert: £90k to produce; £210k of media spend achieves (4.20) return of £882k (overall ROI with production costs 2.94);
○ Post-restrictions advert: £90k to produce, reduced £84k of media spend achieves (4.20) return of £353k (overall ROI with production costs 2.03);
○ Compared to a print advertising campaign: £5k (conservative design cost estimate) to produce, £33k for two national newspaper adverts to achieve return (2.43) of £80k (overall ROI with production costs 2.42).142
Possible mitigating options 160. There are several options available to advertisers which will mitigate the impact of any restriction.
Affected advertisers may choose to make changes to their products (i.e. reformulate their product), the construct of their advertising (i.e. advertise a substitute product or the overall brand, where, in line with existing ASA guidance, the latter is not synonymous with HFSS products), or the time of day in which they advertise (shift spend to post-watershed), to be able to keep advertising on TV or online before 9pm. The other option is that advertisers outside of the category (or indeed within the category but unaffected) will backfill the advertising space, and so therefore have a mitigating impact on the revenue drop for broadcasters.
161. Reformulate product: There are some campaigns where it will be possible for advertisers to reformulate their products, to meet the NPM restrictions (i.e. <4 for Food and <1 for Drink). There was limited evidence available on the cost and limitations to reformulation, so Kantar assumed that this would only be possible for products within one point of the NPM restrictions; a small subset of food products scoring NPM 4 and drink products scoring NPM 1. We recognise that this is a conservative estimate, however this was chosen due to the large variances in reformulation available to different product categories. The technical guidance on the Nutrient Profile Model (Annex B) illustrates the level of nutritional reformulation required to meet these criteria.
162. Advertise a substitute product or the overall brand: There are manufacturers who have a combination of products, some of which would or wouldn’t be considered HFSS by the NPM. Typically these include large supermarkets, brands and restaurants with a wide product portfolio of products. A good example of this would be a soft drinks manufacturer who has a full sugar option and a diet / light option. Supermarkets have the option to change their advertised product mix from HFSS to non-HFSS goods. For these examples, we have assumed that spend could shift from advertising HFSS products to either advertising non-HFSS products or advertising the overarching brand with no products featured. There are advertisers who could not shift to advertising the overarching brand, where the brand is synonymous with HFSS products, so these were excluded from this mitigation in the analysis. The analysis tries to replicate extant CAP/BCAP guidance on brand advertising, which would be retained in the policy options, but recognises that the CAP/BCAP clearance system for adverts may take a more robust approach.
142 Based on cost of two full page colour advertisements in The Sun - https://www.newsukadvertising.co.uk/CreateDisplayAd (accessed 02/01/2019)
49
163. Shift spend to post-watershed: There will be a number of advertisers who cannot or decide not to reformulate, substitute products or advertise their overarching brand. However, if these advertisers already spend a significant proportion (>50%) of their budget post-watershed (i.e. between 21.00 and 05.30) then we have assumed those advertisers will simply shift their budget from pre- to post-watershed. This assumption has been made based on Kantar’s industry knowledge and data, but does not imply that all advertisers with spend >50% will necessarily make this shift or vice versa.
164. Replacing lost HFSS advertising and cost mechanisms: In the event of advertising being pulled from television, broadcasters would still have the option to replace this with advertising non-HFSS products or non-food/drink categories. Based on the analysis Ofcom conducted during the last review of food advertising restrictions on television, we understand from broadcasters that securing a 100% replacement of lost advertising is unrealistic. Advertising rates may also change, as supply and demand for commercial impacts changes. Broadcasters trade in commercial impacts, rather than advertising space/slots and, under advertising restrictions, HFSS manufacturers may be able to reach less of their target audience if forced to advertise at different times of day, which would reduce the price they are prepared to pay for advertising, as it would now take more advertising to achieve the same number of impacts. Those purchasing advertising slots vacated by HFSS manufacturers, could also command a lower price, if the slot does not hit their target audience. Conversely, this option could create more demand for advertising after 2100, increasing prices at certain times (e.g. 2100-2200). The pricing mechanisms for advertising and the rates set by broadcasters are complex and subject to commercially sensitive information.
165. For these reasons, Kantar did not attempt a detailed quantification of the impact. Using Ofcom’s assumption, based on broadcaster feedback to its own impact assessment, Kantar modelled a 10, 20 and 30% substitution effect to form high, central and low estimates of advertising revenue that could be replaced under a 2100-0530 watershed. Ofcom’s analysis was conducted in 2006 and the advertising market is likely to be more competitive today, particularly with the ascent of digital advertising. However, the restriction proposed would be applied to a narrower set of products than Ofcom considered originally and there may be new advertisers in the market that would value the pre-watershed slots.
166. This assumption is predicated on alternative categories of advertising being available and demand to advertise on television. This could come from advertisers on television expanding their campaigns, advertisers on other media switching spend to television, or new advertisers buying inventory on television. In this analysis, Kantar assume that this backfill of advertising spend would come from other media channels (e.g. print, radio, outdoor advertising). Therefore, while HFSS advertising spend may displace to other channels from television, the analysis assumes that there would be some influx of non-HFSS (and non-food/drink) advertising spend away from these channels in response. We invite views on whether these assumptions are realistic.

50
Figure 11: Diagram showing backfill assumptions
Final results for broadcast TV 167. The final results have been presented as follows:
○ high risk is the aforementioned ‘starting position’ and demonstrates the point of highest risk; ○ low risk is the scenario where all possible mitigation has been taken as above; ○ mid risk represents a mid-point between these two options, understanding that both high and
low risk options are useful benchmarks but unrealistic in practice. Online modelling methodology 168. The online modelling methodology broadly follows the TV methodology outlined above, except that
there is no de minimis exemption, as explained earlier in the document. CAP code HFSS restrictions would remain in place after the watershed, prohibiting advertising directed at children or appearing on websites with child audience over 25%.
169. The online impacts (adult and child) and spend have been proportioned into those that: ○ Occur between 21:00-05:30; ○ Advertise HFSS products; ○ Have NPM scores >= 4 for food and >=1 for drink; ○ Fall within the SDIL, or PHE’s Sugar and Calorie Reduction programme.
170. To model the mitigations advertisers could pursue online, Kantar employed the same methodology
used in the television modelling, i.e.: ○ Re-formulate product

51
○ Advertise a substitute product or the overall brand ○ Shift spend to post-watershed ○ Substitution by other advertisers.
171. Due to there being a much smaller dataset for products advertised online, Kantar judged that it
would be more accurate to apply the proportion of mitigations observed on television to the online data. For example, if 5% of HFSS products advertised on television could be reformulated, then this same 5% proportion of reformulation was assumed online.
D(iii). Health Benefits Methodology
Quantifying the impact of HFSS advertising exposure on children's calorie consumption
172. To quantify the impact of exposure on children’s calorie consumption we have used the NIHR Obesity Policy Research Unit (OPRU) meta-analysis of experimental studies discussed earlier.143 The child- or parent-reported outcomes often used in the more ‘real-world’ studies do not allow us to estimate the calorie intake per minute of advertising exposure.
Calorie impact of HFSS food and drink television advertising on all children 173. As mentioned previously, the NIHR OPRU meta-analysis found that on average 4.4 minutes of
food advertising, compared to non-food advertising, is associated with an additional 60.0kcal consumption. The 95% confidence interval of this estimate is 3.1kcal – 116.9kcal. The wide confidence intervals represent the level of uncertainty around the estimates. This is due to the relatively small sample sizes of the included papers and varying measured effects.
174. The OPRU were not able to quantify whether there is a linear relationship between exposure and calorie consumption or not. That means, whilst their meta-analysis shows 4.4 minutes of food advertising results in an additional 60kcal of consumption, we cannot conclusively say what effect a single minute of exposure, or multiples, would have on kcal consumption based on their findings.
175. For the purposes of modelling, we have assumed the relationship to be linear. This is an assumption necessary to allow incremental modelling of the potential health benefits that could result from advertising restrictions.
Table 9: Additional calorie consumption per minute of food advertising exposure
Lower bound (95% confidence)
Central Estimate Upper bound (95% confidence)
Additional calorie consumption caused by 1 minute of food advertising 0.70 kcal 13.64 kcal 26.58 kcal
176. Whilst the study type did not significantly determine the scale of the effect, those studies that
allowed unconstrained eating for longer than 15 minutes observed much greater effect sizes. It is possible that these studies observing higher calorie intakes over 15 minutes are more reflective of the real world. However this will depend on a child’s autonomy over their food choices, and the duration of an advertising effect, and how much the short-term effect captured in the experiments is influenced by advertised foods being immediately available for consumption.
Calorie impact of food television advertising to overweight children
143 Russell, Simon J., Helen Croker, and Russell M. Viner. "The effect of screen advertising on children's dietary intake: A systematic review and meta‐analysis." Obesity Reviews (2018).
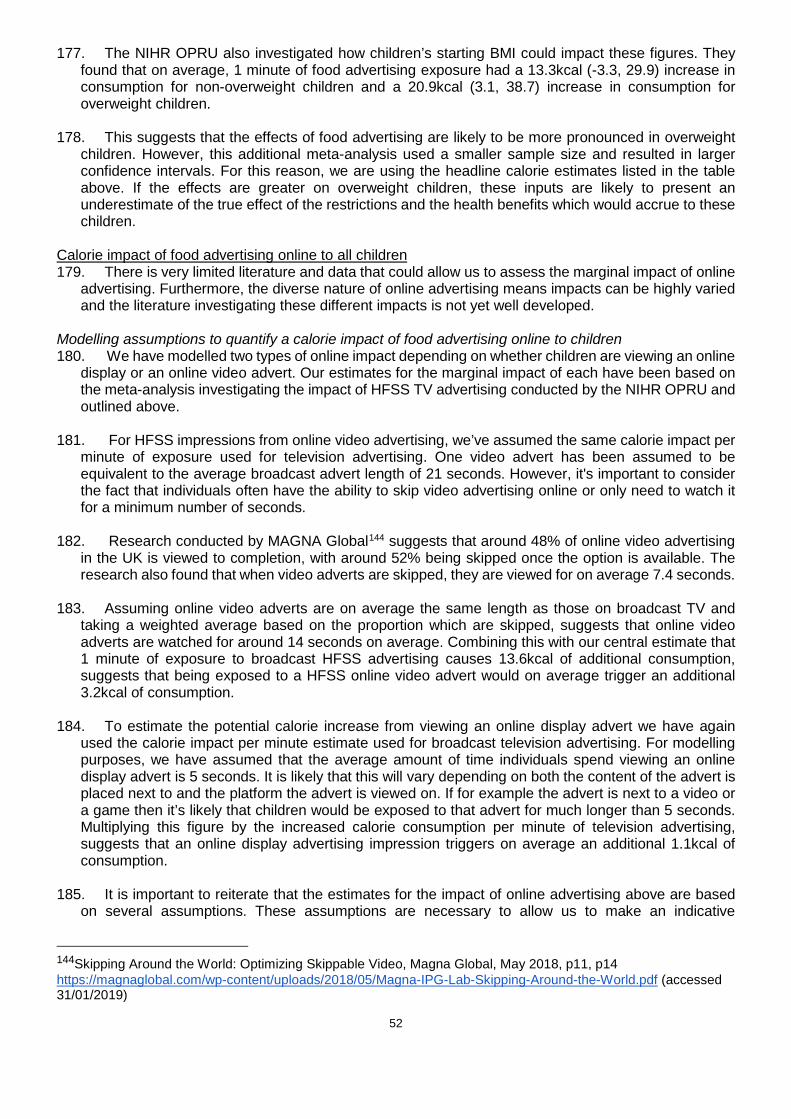
52
177. The NIHR OPRU also investigated how children’s starting BMI could impact these figures. They found that on average, 1 minute of food advertising exposure had a 13.3kcal (-3.3, 29.9) increase in consumption for non-overweight children and a 20.9kcal (3.1, 38.7) increase in consumption for overweight children.
178. This suggests that the effects of food advertising are likely to be more pronounced in overweight children. However, this additional meta-analysis used a smaller sample size and resulted in larger confidence intervals. For this reason, we are using the headline calorie estimates listed in the table above. If the effects are greater on overweight children, these inputs are likely to present an underestimate of the true effect of the restrictions and the health benefits which would accrue to these children.
Calorie impact of food advertising online to all children 179. There is very limited literature and data that could allow us to assess the marginal impact of online
advertising. Furthermore, the diverse nature of online advertising means impacts can be highly varied and the literature investigating these different impacts is not yet well developed.
Modelling assumptions to quantify a calorie impact of food advertising online to children 180. We have modelled two types of online impact depending on whether children are viewing an online
display or an online video advert. Our estimates for the marginal impact of each have been based on the meta-analysis investigating the impact of HFSS TV advertising conducted by the NIHR OPRU and outlined above.
181. For HFSS impressions from online video advertising, we’ve assumed the same calorie impact per
minute of exposure used for television advertising. One video advert has been assumed to be equivalent to the average broadcast advert length of 21 seconds. However, it's important to consider the fact that individuals often have the ability to skip video advertising online or only need to watch it for a minimum number of seconds.
182. Research conducted by MAGNA Global144 suggests that around 48% of online video advertising in the UK is viewed to completion, with around 52% being skipped once the option is available. The research also found that when video adverts are skipped, they are viewed for on average 7.4 seconds.
183. Assuming online video adverts are on average the same length as those on broadcast TV and taking a weighted average based on the proportion which are skipped, suggests that online video adverts are watched for around 14 seconds on average. Combining this with our central estimate that 1 minute of exposure to broadcast HFSS advertising causes 13.6kcal of additional consumption, suggests that being exposed to a HFSS online video advert would on average trigger an additional 3.2kcal of consumption.
184. To estimate the potential calorie increase from viewing an online display advert we have again used the calorie impact per minute estimate used for broadcast television advertising. For modelling purposes, we have assumed that the average amount of time individuals spend viewing an online display advert is 5 seconds. It is likely that this will vary depending on both the content of the advert is placed next to and the platform the advert is viewed on. If for example the advert is next to a video or a game then it’s likely that children would be exposed to that advert for much longer than 5 seconds. Multiplying this figure by the increased calorie consumption per minute of television advertising, suggests that an online display advertising impression triggers on average an additional 1.1kcal of consumption.
185. It is important to reiterate that the estimates for the impact of online advertising above are based on several assumptions. These assumptions are necessary to allow us to make an indicative
144Skipping Around the World: Optimizing Skippable Video, Magna Global, May 2018, p11, p14 https://magnaglobal.com/wp-content/uploads/2018/05/Magna-IPG-Lab-Skipping-Around-the-World.pdf (accessed 31/01/2019)

53
quantification of the potential benefits that may accrue from restricting online advertising. We welcome any comments on whether our estimates are reasonable and we hope to refine these assumptions during the consultation. Sensitivity analysis on these assumptions has been conducted to consider some of this uncertainty.
Impact of HFSS food advertising on adults’ consumption
186. As a £22bn industry in the UK, it is rational to assume that advertising should affect the purchasing decisions of adults. However, as outlined previously when summarising the academic literature, there is a lack of conclusive evidence on the impact HFSS advertising has on adults’ calorie consumption. Ultimately, this means we have been unable to quantify the impact these restrictions might have on adults’ calorie intakes or assign any health benefits to this group.
187. The proposed pre-watershed restrictions will mean adults are exposed to significantly fewer HFSS adverts both on TV and online. If this resulted in a behavioural change that lead to lower calorie consumption, then the health benefits estimated below would represent a significant underestimate and the cost to HFSS retailers and manufacturers from a reduction in sales would also be much higher. This has been discussed further in the unquantified health benefits section below.
188. Any underestimate in the health benefits to adults would also result in additional costs to retailers and manufacturers, with reduced calorie consumption leading to a reduction in food and drink sales. The options’ analysis shows that the net effect on food and drink manufacturers and retailers is relatively small compared to other costs. Advertising is also designed to drive brand loyalty, so reductions in HFSS advertising may result in a loss of adult market share among the impacted retailers and manufacturers, affecting their profitability.
Drawing conclusions from laboratory studies 189. Whilst the experimental studies used for quantification are conducted under laboratory conditions,
and we have already discussed how both the autonomy of decisions and long-term impact are just two of the ways in which experimental conditions may not apply in the real world, they serve as the only basis to allow for quantification of the marginal effect of advertising on calorie consumption.
190. Because food and drink advertising exposure is just one component in a complex adaptive system causing excess calorie consumption, it would be incredibly difficult to ascertain the marginal effect of HFSS advertising on dietary intake in an observational study.
191. Laboratory studies allow us to do this by isolating specific nodes of the system, with the notable
caveat that we cannot say with certainty how comparable they are to the real-world environment. However, whilst laboratory experiments only address immediate short-term consumption, the ‘non-experimental’ studies the NIHR OPRU analysed provide good evidence to suggest that TV food advertising is “positively associated with and predictive of dietary intake in children”.145
192. In the absence of longitudinal data on the long-term impact of advertising exposure, the modelling assumption has been made that individuals exposed to the proposed regulations throughout their childhood (defined as those aged between 4 and 15 years to be consistent with Kantar Consulting’s modelling of HFSS advertising exposure calculations) will maintain the same average calorie reduction as adults.
193. For children who are partially exposed to the policy in the 25-year window, a further assumption is required. In the absence of any evidence of long-term impact, we have assumed that children exposed to the policy for at least half of their childhood between the ages of 4-15 years (i.e. exposed for at least 6 years) will have the full benefits of the policy, and those exposed for less than this will receive no benefits from the policy.
145 Russell, Simon J., Helen Croker, and Russell M. Viner. "The effect of screen advertising on children's dietary intake: A systematic review and meta‐analysis." Obesity Reviews(2018).

54
194. This has been done for simplicity and is a necessary assumption for the modelling. Furthermore, it
seems reasonable to assume that children impacted for shorter amounts of time will receive fewer benefits, while each additional year of exposure to the policy would result in additional benefits. This would be complex to model, whereas taking the approach outlined above simplifies the modelling and results in approximately the same outcome.
Modelling the Health Benefits of Advertising Restrictions
Estimating a Reduction in Calorie Consumption 195. The methodology used to estimate the impact of the restrictions on children's calorie consumption
is outlined in Figure 12 below.
196. The first stage of this methodology involves calculating children’s reduction in HFSS advertising exposure across both broadcast TV and online media. This is done using the results from the analysis conducted by Kantar Consulting, which is outlined in Annex D.
197. However, as mentioned previously, children's media use is changing as they spend less time watching broadcast TV and more time online. To forecast how children's media use will change we use data from Ofcom’s ‘Children and Parents: Media Use and Attitudes Report’146 to establish the recent trend and project this forward for the next five years.
198. Once the expected reduction in HFSS advertising exposure has been calculated, we apply
assumptions for the impact this exposure has on children's consumption to estimate the average calorie reduction associated with each of the options.
Projecting children’s media use into the future 199. Children aged 4-15 watched approximately 43% less broadcast TV in 2017 than they did in 2010.147
At the same time they are spending an increasing proportion of their time online, with the pace of change being such that children aged between 12 and 15 now spend more time online than watching broadcast TV.148
146 Ofcom, Children's Media Use and Attitudes, 2017: https://www.ofcom.org.uk/research-and-data/media-literacy-research/childrens (accessed 20/12/2018) 147 Ofcom (2018). Media Nations, UK Figure 10: https://www.ofcom.org.uk/research-and-data/tv-radio-and-on-demand/media-nations (accessed 01/03/2019) 148 Ofcom (2017). Children and Parents: Media Use and Attitudes report (p 21): https://www.ofcom.org.uk/research-and-data/media-literacy-research/childrens/children-parents-2017 (accessed 01/03/2019)
55
200. These trends suggest that children’s exposure to HFSS food and drink advertising on broadcast TV is likely to decrease over the coming years, while HFSS advertising exposure online is likely to increase - subject to the efficacy of current online advertising restrictions. Unlike food and drink advertising spend, there appears to be a consistent trend in children’s media use and as a result we have attempted to take this into account in our modelling.
201. Using data on children’s media use over recent years from Ofcom’s ‘Children and Parents: Media Use and Attitudes Report’149 we have estimated the trend in their TV and online viewing. The results of this analysis suggest that TV viewing is set to decrease by around 6.8% each year for the foreseeable future and at the same time online media use is set to increase by 3.4% per year.
Figure 13: Projection of children’s TV and online media use
202. Like any forecast the further you project out into the future the more uncertain it becomes, with the
rapidly changing nature of the industry adding even more uncertainty. As a result, we have decided to project children’s TV viewing and online use for five years based on the trends above and assume a flat trajectory thereafter. If children’s TV viewing continues to decrease and this is not substituted by increased online media use then this would result in an overestimation of the benefits from the policy. We welcome any comments on whether his approach is reasonable and we hope to improve these assumptions during the consultation.
Taking into account advertising displacement
203. It is likely that some of the HFSS advertising spend removed from broadcast television and online platforms will be displaced to other forms of media. This displacement is likely to offset a proportion of the health benefits if it leads to an increase in children's exposure to HFSS advertising. In the short-term this shift is likely to be into video advertising in other sections of the media. However, in the long-term advertisers might decide not to invest in video advertising at all and switch their campaigns to
149 Ofcom (2017). Children and Parents: Media Use and Attitudes report: https://www.ofcom.org.uk/research-and-data/media-literacy-research/childrens/children-parents-2017 (accessed 01/03/2019)

56
different sections of the media, such as radio, out-of-home (e.g. billboards), newspapers, direct mail, online display and radio advertising. Alternatively, advertising spend removed from broadcast television and online platforms may be displaced into promotions or price reductions. This is discussed further in the Key Assumptions and Limitations of the Health Benefits Calculations section below.
204. The amount of displacement will depend on the combination of any restrictions introduced across
broadcast and online, with possible shifts in spending between TV and online video advertising. The impact of these shifts will depend on children's use of these other types of media and the effectiveness of advertising campaigns on these other platforms. If HFSS advertising spend were to shift from platforms children use extensively, such as TV and online, to those which they do not, such as print newspapers, then the impact of displacement on children’s exposure is likely to be small. Similarly if HFSS advertising spend were to shift from platforms where it is more effective to those where it is less effective then the impact of displacement on children's calorie consumption is likely to be smaller.
Impact of displacement on children's HFSS advertising exposure 205. TV and Online. The most popular devices children use are TV sets, mobile phones and tablets.
Around 77% of children aged 5-15 say they use a TV set every day and approximately half use mobile phones and tablets.150 We therefore assume that children will continue to be exposed to HFSS advertising were it to be displaced from broadcast television to online platforms or vice versa.
206. We have limited data on children’s HFSS advertising exposure from other forms of media. Kantar’s analysis estimated that there were 184m HFSS impacts in UK cinemas and 4.5bn impacts on radio, seen by children and adults in 2017. We cannot accurately estimate the impacts received by a child audience, but offer the following observations:
207. Cinema. BFI audience data suggests that 7-14 year olds made up 13.6% of cinema audiences.151 Based on this data and the existing food advertising restrictions, we estimate that were no greater than 25m HFSS impacts seen by children aged 7-14 in UK cinemas in 2017. Even extrapolating this data to cover 4-6 year olds (likely watching films where HFSS advertising is prohibited) and 15-16 year olds, this would be approximately 1% of the exposure calculated on television. Based on Kantar’s estimate of displacement, this market could experience a doubling of the amount of food/drink advertising revenue, if a watershed restriction was imposed, but this would still result in a negligible increase in children’s exposure relative to that estimated on television or online. We have assumed that the interaction of film classification with the Cinema Advertising Association’s system of pre-clearance of HFSS advertising in cinemas helps to account for this limited exposure.
208. Radio. Based on Ofcom's assessment of children's commercial radio usage, we estimate that
children make up a 6.2% share of HFSS impacts, which would result in 281m impacts in 2017.152 While our estimate is significantly higher than that for cinema, it is just 38% of the number of estimated impacts online, and 8% of the number of impacts on TV. Given that it is a non-visual medium which does not enjoy the same reach as online media,153 this suggests that displacement and significant child exposure may be a relatively low risk, but we have nonetheless taken account of it below.
209. Out of home (OOH) and direct mail advertising. We have been unable to find any data which would allow us to estimate children's exposure to HFSS advertising from OOH media or direct mail
150 Ofcom (2017) Children and Parents: Media Use and Attitudes Report (p40): https://www.ofcom.org.uk/research-and-data/media-literacy-research/childrens/children-parents-2017 (accessed 01/03/2019) 151 BFI Statistical yearbook Audiences 2016/17: https://www.bfi.org.uk/sites/bfi.org.uk/files/downloads/bfi-statistical-yearbook-audiences-2016-2017-09-27.pdf (accessed 01/03/2019) 152 Ofcom (2016) Digital Day (p9): https://www.ofcom.org.uk/__data/assets/pdf_file/0017/94013/Childrens-Digital-Day-report-2016.pdf (accessed 01/03/2019)) 153 https://www.radiocentre.org/74-of-9-14-year-olds-listen-to-radio-weekly/ (accessed 05/02/2019)

57
advertising. However, it seems likely that any shift towards these forms of advertising would increase children's exposure to HFSS advertising and, as a result, we have decided to take this into account in our calculations below.
210. Print media. Ofcom’s Digital Day report estimates that in 2016, 3% of 6-11 year olds read
magazines and 1% read newspapers each week (print and digital). For 11-15 year olds, 4% read magazines and 10% newspapers each week.154 It seems reasonable to assume that HFSS advertising shifting to newspapers or magazines would have relatively little impact on children’s advertising exposure. This is before taking account of CAP food advertising restrictions in publications that have a child audience of 25% or more, which would reduce HFSS exposure in print media further.
211. Table 10 below presents the degree of offsetting behaviour which has been estimated by Kantar for each of the modelled policy options and which sections of the media are assumed to have a direct impact on children’s HFSS advertising exposure.
Table 10: Displaced advertising spend and its impact on children’s HFSS advertising exposure
Direction of Displaced advertising spend
% displaced if there are restrictions on TV but none online (Option B)
% displaced if there are further restrictions on both TV and online (Option C)
% displaced if there are further restrictions online but none on TV (Option D)
Does it have an impact on children’s exposure?
TV 0% 0% 31%
Online 31% 0% 0%
Direct Mail 2% 3% 2%
Out of Home 18% 26% 18%
Print 13% 22% 13%
Radio 9% 15% 9%
Cinema 9% 15% 9%
Lost 18% 19% 18%
154 Ofcom (2016) Digital Day (page 17): https://www.ofcom.org.uk/__data/assets/pdf_file/0017/94013/Childrens-Digital-Day-report-2016.pdf (accessed 04/03/2019)

58
The impact of displaced advertising on children's consumption 212. As mentioned previously, the impact of advertising displacement on children’s consumption will
also depend on the effectiveness of these advertising campaigns in other forms of media. Our working assumption is that food and drink businesses current advertising campaigns on broadcast TV and online platforms have been planned to maximise their return on investment. As a result, it seems reasonable to assume that shifting these campaigns to other forms of media (e.g. radio, OOH and direct mail) will be less effective at the margin and therefore have a smaller impact on children's food behaviours.
213. The academic evidence investigating the impact of advertising on children’s food preferences and consumption is mainly focussed around TV, with a limited amount of evidence investigating online advertising. As a result, we have been unable to find any studies which would allow us compare the impact of advertising campaigns across different forms of media.
214. Following the logic above suggests that shifting these campaigns to other platforms will deliver somewhere between 0% and 100% of the impact on children's food behaviours they previously had on TV and online. Due to a lack of evidence we have decided to use the midpoint of this range in our calculations and assumed a 50% marginal reduction in their effectiveness.
215. It’s important to note that there is considerable amount of uncertainty around this assumption and it has a significant impact on the estimated health benefits. Sensitivity analysis using the maximum and minimum values in this range has been conducted to reflect this uncertainty. Furthermore, we would welcome any comments on whether the approach outlined above is reasonable as part of the consultation.
Estimating Health Benefits from a Calorie Reduction
216. The health benefits from a reduction in excess calorie consumption are calculated using the same basic modelling approach as the DHSC Calorie Model V1 used in the “Ending the sale of energy drinks to children”155, “Restricting promotions of food and drink that is high in fat, sugar and salt”156 and the “Calorie labelling for food and drink served outside of the home”157 consultations.
Figure 14: Illustration of modelling the health benefits resulting from a calorie reduction
217. However, it was necessary to make some changes to this modelling approach to allow us to estimate the health benefits that would specifically accrue to children.158 A writeup of the changes which have been made to create the DHSC Calorie Model V2 is included in Annex E.
155 Ending the sale of energy drinks to children consultation is available from: https://www.gov.uk/government/consultations/ending-the-sale-of-energy-drinks-to-children (accessed 30/01/2019) 156 Restricting promotions of food and drink that is high in fat, sugar and salt consultation is available from: https://www.gov.uk/government/consultations/restricting-promotions-of-food-and-drink-that-is-high-in-fat-sugar-and-salt (accessed 30/01/2019) 157 Calorie labelling for food and drink served outside of the home consultation is available from: https://www.gov.uk/government/consultations/calorie-labelling-for-food-and-drink-served-outside-of-the-home (accessed 30/01/2019) 158 DHSC Calorie Model: Technical consultation document. Available at: https://www.gov.uk/government/publications/department-of-health-and-social-care-dhsc-calorie-model (accessed 30/01/2019)
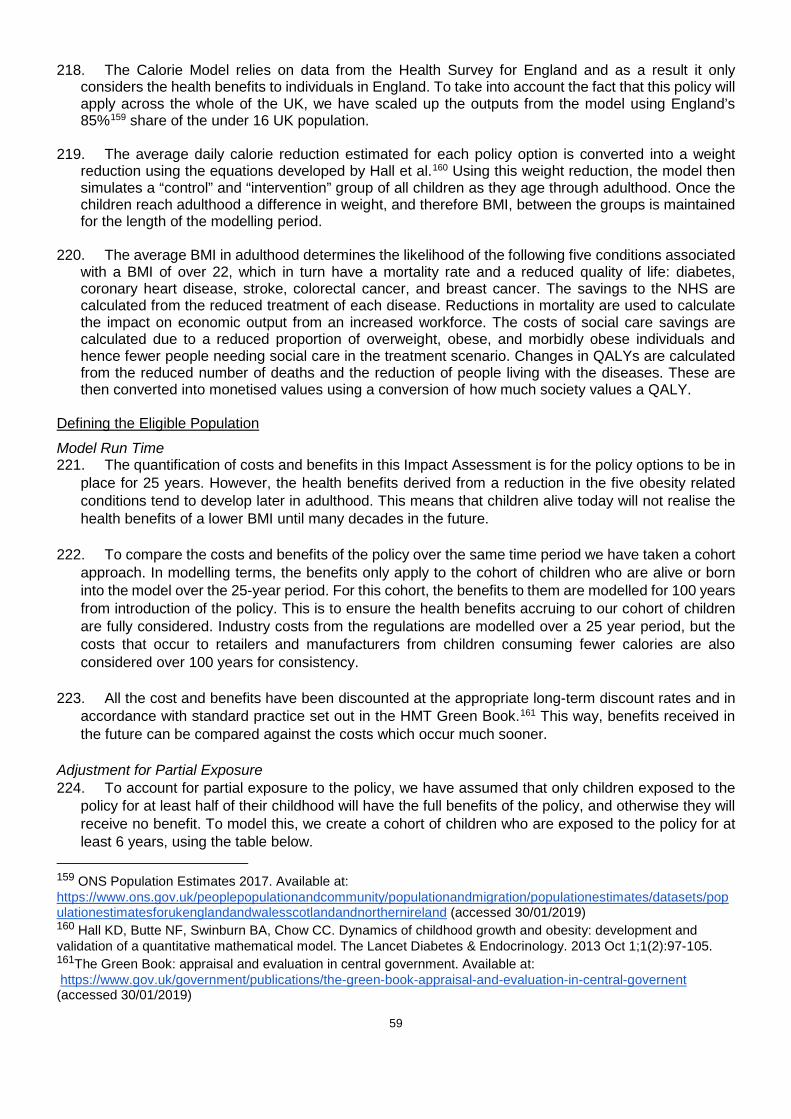
59
218. The Calorie Model relies on data from the Health Survey for England and as a result it only
considers the health benefits to individuals in England. To take into account the fact that this policy will apply across the whole of the UK, we have scaled up the outputs from the model using England’s 85%159 share of the under 16 UK population.
219. The average daily calorie reduction estimated for each policy option is converted into a weight reduction using the equations developed by Hall et al.160 Using this weight reduction, the model then simulates a “control” and “intervention” group of all children as they age through adulthood. Once the children reach adulthood a difference in weight, and therefore BMI, between the groups is maintained for the length of the modelling period.
220. The average BMI in adulthood determines the likelihood of the following five conditions associated with a BMI of over 22, which in turn have a mortality rate and a reduced quality of life: diabetes, coronary heart disease, stroke, colorectal cancer, and breast cancer. The savings to the NHS are calculated from the reduced treatment of each disease. Reductions in mortality are used to calculate the impact on economic output from an increased workforce. The costs of social care savings are calculated due to a reduced proportion of overweight, obese, and morbidly obese individuals and hence fewer people needing social care in the treatment scenario. Changes in QALYs are calculated from the reduced number of deaths and the reduction of people living with the diseases. These are then converted into monetised values using a conversion of how much society values a QALY.
Defining the Eligible Population Model Run Time 221. The quantification of costs and benefits in this Impact Assessment is for the policy options to be in
place for 25 years. However, the health benefits derived from a reduction in the five obesity related conditions tend to develop later in adulthood. This means that children alive today will not realise the health benefits of a lower BMI until many decades in the future.
222. To compare the costs and benefits of the policy over the same time period we have taken a cohort approach. In modelling terms, the benefits only apply to the cohort of children who are alive or born into the model over the 25-year period. For this cohort, the benefits to them are modelled for 100 years from introduction of the policy. This is to ensure the health benefits accruing to our cohort of children are fully considered. Industry costs from the regulations are modelled over a 25 year period, but the costs that occur to retailers and manufacturers from children consuming fewer calories are also considered over 100 years for consistency.
223. All the cost and benefits have been discounted at the appropriate long-term discount rates and in
accordance with standard practice set out in the HMT Green Book.161 This way, benefits received in the future can be compared against the costs which occur much sooner.
Adjustment for Partial Exposure 224. To account for partial exposure to the policy, we have assumed that only children exposed to the
policy for at least half of their childhood will have the full benefits of the policy, and otherwise they will receive no benefit. To model this, we create a cohort of children who are exposed to the policy for at least 6 years, using the table below.
159 ONS Population Estimates 2017. Available at: https://www.ons.gov.uk/peoplepopulationandcommunity/populationandmigration/populationestimates/datasets/populationestimatesforukenglandandwalesscotlandandnorthernireland (accessed 30/01/2019) 160 Hall KD, Butte NF, Swinburn BA, Chow CC. Dynamics of childhood growth and obesity: development and validation of a quantitative mathematical model. The Lancet Diabetes & Endocrinology. 2013 Oct 1;1(2):97-105. 161The Green Book: appraisal and evaluation in central government. Available at: https://www.gov.uk/government/publications/the-green-book-appraisal-and-evaluation-in-central-governent (accessed 30/01/2019)
60
225. Furthermore, to take into account children who are born into our cohort over 25 years, we multiply
ONS population estimates by single year of age for 4 to 15 year olds by the population growth projections for the 0-15 population.
Table 11: Children who will be included in the cohort by age and year of the policy.
226. This cohort of children is then fed in to the DHSC Calorie Model V2 to estimate the health benefits
over the appraisal period.
Key Assumptions and Limitations in the Health Benefits Calculations
Key Assumptions 227. There are a large number of assumptions that feed into the overall health benefit calculations. The
key assumptions are summarised below and more detail is provided in other parts of the document.
228. Calorie (kcal) impact per advert on broadcast. This is taken from a published meta-analysis162 which provides an expected value and 95% confidence intervals. The estimates for the impact of online advertising are also based on this study, plus several assumptions to adjust for the differences in the length of exposure to advertising impacts on the two different types of media. These assumptions are varied in the sensitivity analysis later in the document.
229. Individuals exposed to the regulations throughout their childhood (defined as those aged
4-15 years to be consistent with Kantar modelling) maintain the same average calorie reduction as adults. Although there is some limited longitudinal evidence linking advertising exposure to obesity related outcomes and of moderate tracking of dietary behaviours from childhood to adulthood, the long-term impact of the restrictions is a significant area of uncertainty in our analysis.
162 Russell, Simon J., Helen Croker, and Russell M. Viner. "The effect of screen advertising on children's dietary intake: A systematic review and meta‐analysis." Obesity Reviews(2018).

61
230. HFSS advertising campaigns displaced to other forms of media have 50% of the impact they previously did on broadcast TV or online. Food and drink businesses current advertising campaigns on broadcast TV and online are expected to maximise their return on investment. Therefore, it seems reasonable to assume that shifting this advertising to other forms of media will be less effective than it was previously. However, we have been unable to find any academic evidence comparing the effectiveness of advertising on different forms of media and, as a result, this remains a significant area of uncertainty in our analysis. This assumption has been varied in the sensitivity analysis later.
231. Parameters used to calculate the health benefits from a calorie reduction. There are a variety of assumptions including average height, population projections, mortality rates, and incidence rates which must be included in the model. These are all based on published academic papers and official statistics which are provided in the write-up163, but there are limitations to this modelling approach which are given below.
Key Limitations 232. There are multiple limitations, discussed below, that may result in either an under or over estimate
of the health benefits. It has not been possible to determine the total size of either of these impacts or whether one will outweigh the other.
Limitations that are expected to understate the benefits 233. Underestimate of the benefit accruing to overweight and obese children. As mentioned
previously, the NIHR OPRU meta-analysis164 suggests that overweight children consume 57% more calories than healthy weight children after being exposed to HFSS advertising. Due to the small sample sizes and wider confidence intervals we decided to use the headline average figures across all children. If overweight and obese children are more affected by advertising we will have significantly underestimated the benefits for these groups.
234. The DHSC Calorie Model only considers a narrow range of benefits. The DHSC Calorie Model V1 and V2 only considers benefits that accrue from obesity related instances of diabetes, stroke, chronic heart disease and colorectal and breast cancer. We know obesity causes a multitude of other conditions that will have associated health decrements, however these remain unmonetised for modelling simplicity and due to a lack of understanding of the interactions and comorbidities between conditions.
235. Improvements to productivity are not included. The economic benefits are derived only from additional economic output from having a larger population in the treatment group, due to fewer obesity related deaths. However, preventing obesity related ill health will also result in a healthier workforce, which is likely to be more productive and take fewer sick days. This impact is not estimated quantitatively in the model and as a result remains unmonetised.
236. The monetised health benefits are only based on reduced calorie consumption. The advertising proposals involve restricting the promotion of high fat, salt and sugar products. The modelling only considers the benefits from reduced calorie consumption and does not estimate any benefits that may accrue from reduced salt, sugar or fat intake. Too much salt consumption, for example, can raise blood pressure which increases the risk of heart disease and stroke.165 Because of this, it's been estimated that reducing excess salt consumption could prevent premature mortality
163 DHSC Calorie Model; Technical consultation document. Available from: https://www.gov.uk/government/publications/department-of-health-and-social-care-dhsc-calorie-model (accessed 30/01/2019) 164 Russell, Simon J., Helen Croker, and Russell M. Viner. "The effect of screen advertising on children's dietary intake: A systematic review and meta‐analysis." Obesity Reviews(2018). 165 Bibbins-Domingo K, Chertow GM, Coxson PG, Moran A, Lightwood JM, Pletcher MJ, Goldman L. Projected effect of dietary salt reductions on future cardiovascular disease. New England Journal of Medicine. 2010 Feb 18;362(7):590-9.

62
and save the NHS millions of pounds annually in treatment costs.166 These impacts, as well as the other significant benefits associated with reduced fat and sugar consumption, are not estimated in our model and have not been accounted for in our analysis.
237. There are no monetised benefits resulting from adults’ lower advertising exposure. Due to the inconclusive and undeveloped evidence base we have been unable to estimate any benefits which might accrue from reducing adults’ exposure to HFSS advertising. If this reduction in HFSS advertising were to result in a calorie reduction or improve nutritional intakes, then this would have large health benefits across the population occurring sooner in the appraisal period.
238. Reformulation of products may result in additional calorie reductions and nutritional benefits. If advertising restrictions are introduced; there will be an incentive for brands to reformulate their HFSS products so they can continue to be advertised. If calories are removed from products to allow them to be advertised, this would reduce the calorie intake of all adults and children consuming those products. This could result in significant health benefits that we have not accounted for. However, the costs and benefits of reformulation are uncertain, highly commercially sensitive and product specific. All of which makes any quantification difficult. For modelling the costs, Kantar assumed that a small number of HFSS products will be reformulated so they are still allowed to be advertised (those within one point of compliance with the NPM model). The nutritional benefits which are generated by this reformulation remain unquantified and are likely to be highly dependent on the incentives created by each policy option. This conservative threshold was chosen mindful that there are large variances between what is possible between product categories.
Limitations expected to overstate the benefits 239. Projecting children’s broadcast TV and online media use. Children's broadcast TV viewing is
declining over time and their online media use is increasing. To take this into account, we have projected children’s TV viewing and Online use for five years based on the trends above and assume a flat trajectory thereafter. If children’s TV viewing continues to decrease and this is not substituted by increased time spent online then this would represent an overstatement of the benefits from the policy.
240. Compensating behaviour by food and drink retailers and manufacturers. It’s possible that retailers and manufacturers might decide to invest their advertising budgets in alternative ways of promoting HFSS products. The way products are marketed to us can be split into several elements often known as the ‘four Ps’: product; price; place; and promotion. These proposals only restrict businesses’ ability to promote HFSS food and drinks on broadcast television/ online and leave open the possibility of increasing sales using other techniques, e.g. price promotions or reductions. Any compensating activity by retailers and manufacturers would offset the benefit of the policy and with it some of the lost profit to these businesses.
241. It’s important to note that Chapter 2 of the Government’s “Childhood Obesity: A plan for action”167 includes proposals to consult on restricting the use of volume and location promotions to promote HFSS products. If introduced, these proposals would significantly limit the number of alternative marketing strategies available and likely reduce the effectiveness of any compensating behaviour by business.
Assessing the overall level of uncertainty 242. Due to both the uncertainty around these figures and the long appraisal period, we have conducted
critical value and sensitivity analysis to illustrate the potential benefits required to make the policy cost effective, and the sensitivity of this to certain key assumptions. However, given the large number of assumptions and the significant limitations of the modelling, there are only illustrative and cannot
166 New PHE data on salt consumption levels, PHE press release 2016. Available at: https://www.gov.uk/government/news/new-phe-data-on-salt-consumption-levels accessed (02/01/2019) 167 DHSC (2018) Childhood obesity: a plan for action, chapter 2. https://www.gov.uk/government/publications/childhood-obesity-a-plan-for-action-chapter-2 (accessed 29/06/2018)

63
provide a complete picture of the uncertainty of the calculations. It should be recognised that all the estimates of health benefits included in this Impact Assessment are subject to a large degree of uncertainty and can only provide illustrative estimates of the costs and benefits based on plausible assumptions.
E. Options Assessment 243. As outlined previously a range of options have been proposed for restricting HFSS advertising on
broadcast TV and online. This creates 12 different combinations in which these options could be implemented. Due to several practical considerations and data limitations we have only been able to model 4 of these combinations in this IA. The policy options are outlined in more detail in the Options overview section above.
244. The benefits of introducing further restrictions on HFSS food and drink advertising are expected to
accrue through:
● A reduction in excess consumption of HFSS products, with a consequent reduction in obesity prevalence;
● A reduction in obesity-related morbidity and mortality, resulting in reduced costs for the NHS and an increase in economic output;
● The potential reformulation of HFSS products by food and drink manufacturers, leading to further health benefits.
245. The main categories of costs to be considered are:
● Transition costs associated with the familiarisation of new advertising restrictions on broadcasters, online platforms, advertising agencies, manufacturers/retailers and regulators;
● Loss of profit, as a result of reduced sales of HFSS products on manufacturers/retailers; ● Loss of sales revenue, as a result of lost advertising billings on broadcasters and
advertising agencies.
246. To outline the modelling process which has been used we have only provided a detailed description for Option B. The other options are all modelled using the same process, but with different reductions in advertising exposure and different levels of offsetting behaviour based on table 10 above.
247. The figures presented below are based on our central estimates of the costs to business and the health benefits these restrictions would generate. High and low estimates are considered in the sensitivity analysis section towards the end of this document. The net present values of the options are assessed over a period of 25 years, with the cohort modelling approach outlined above being used to estimate the health benefits accruing to children over their lifetimes and the estimated costs to retailers and manufacturers as a result of lower calorie consumption. All the cost and benefits are discounted at the appropriate long-term discount rates.168 This way, benefits received in the future can be compared against the costs which occur much sooner.
E(i)A: Option A - No additional regulation. Retain current set of HFSS advertising restrictions for broadcast TV and online.
248. Option A is the do-nothing scenario against which all other options are compared. The costs and benefits of this option are therefore zero by definition.
168The Green Book: appraisal and evaluation in central government. Available at: https://www.gov.uk/government/publications/the-green-book-appraisal-and-evaluation-in-central-governent (accessed 30/01/2019)

64
65
E(ii)B: Option B - Advertising restriction on HFSS products within the SDIL, Sugar and Calorie Reduction Programmes, applied on broadcast TV only, via a 2100-0530 watershed. Retain current regulations online.
Costs to Business
Transition Costs 249. The transitions costs (familiarisation of new regulations) will impact broadcasters, ad agencies,
regulators and retailers / manufacturers as they will need to understand how the new rules affect how their products can be marketed on TV. Based on industry stakeholder knowledge and previous regulations we believe it would take between 1 and 3 hours of a professional marketing manager's time to familiarise themselves with the regulations. This is estimated to result in a one-off cost of £960k.
250. Transition costs resulting from familiarisation and adjustment to new restrictions. Within this option, these costs fall primarily to: HFSS manufacturers, TV broadcasters, regulators and advertising agencies. It is important to note that the transition costs estimated here are based on a number of assumptions covering the time it will take and the level or grade of the staff with this responsibility. These costs would run through each of the restriction options, but would be of a lower scale if applied to a narrower set of stakeholders and businesses.
251. Manufacturers / retailers. We assume that on average, it would take a professional marketing
manager in a food/drink company between 1-3 hours to read and become familiar with the regulations, as well as assess their relevance to their marketing activities. This is a pragmatic assessment, noting that the option is an extension of existing advertising restrictions that companies are already familiar with. However, there may be companies that have devolved all responsibility for compliant marketing to advertising agencies and faced no previous challenges advertising in adult airtime; it is likely this will vary from one business to another. It might be expected, for example, that larger businesses will require more time as a range of stakeholders will need to be briefed. We would welcome any further evidence on this as part of the consultation. The median gross hourly wage rate for a professional in the UK is £19 per hour or £746 a week based on 2017 Annual Survey of Hours and Earnings (ASHE).169 This is uprated by 30% to £24 per hour to account for non-wage labour costs such as national insurance and pensions. The wage rate will also vary by business depending on the size and scale of the organisation. Based on the advertising baseline for 2017 and number of products in scope, we estimate that 9.8k individual manufacturers could be impacted by this policy. Therefore, we estimate the costs of familiarisation to be in the region of £238k-£714k and considered a one-time additional cost.
252. Advertising agencies. Advertising agencies act as the intermediary between manufacturers (their
clients) and broadcasters/publishers (suppliers), developing advertising campaigns and brokering the purchase of advertising impacts/impressions for their client. There are c. 10k registered ad agencies in the UK and we estimate transition costs between £242k-£727. This is based on the assumption of 1-3 hours spent familiarising new TV regulations for each firm by a professional using the same hourly wage assumptions above.
253. Regulators. Advertising in the UK is regulated by the Advertising Standards Authority (ASA), the industry’s independent regulator, who enforce the Advertising Codes through a system of self-regulation and co-regulation with Ofcom. The Advertising Codes are regularly reviewed and updated, and guidance to advertisers is routinely issued alongside the publication of new rules. We have assumed that the introduction of any further restrictions would be a small cost to regulators, or other bodies involved in advertising regulation, and that the implementation and enforcement of updates to the Advertising Codes could be factored into their business models. But we welcome views on this assumption and transition costs to regulators and other bodies involved in advertising regulation.
169 2017 Annual Survey of Hours and Earnings, ONS. Available from: https://www.ons.gov.uk/employmentandlabourmarket/peopleinwork/earningsandworkinghours/bulletins/annualsurveyofhoursandearnings/2018 (accessed 03/12/2018)
66
254. Broadcasters. Broadcasters provide the schedule capacity for advertising and would need to
comply with new restriction guidance; accommodate client/agency demand for commercial impacts outside the watershed; and make changes to their schedules and rate cards (costs per thousand impacts). However, in light of the large annual impact this restriction would have on advertising revenue, it has not been possible to determine the transition costs for broadcasters from these activities. We have estimated the familiarisation costs based on the assumption of 89 broadcasters being impacted by new TV broadcast rules under option B. These range between £2-£6k for all broadcasters based on 1-3 hours of a relevant professional reviewing the new rules.
Lost Sales Revenue
Broadcasters 255. Total advertising revenue at risk. Under Option B, Kantar (2018) drew on available independent
data (Nielsen) and assessed that £214.7m of advertising spend on broadcast television was for products considered to be HFSS by the 2004/05 NPM. Kantar’s analysis assumes that even though the watershed allows advertisers to keep spending post 2100, measurement of revenue at risk should include entire campaigns being removed, if over 50% of their advertising takes place between 0530-2100.
256. Splitting HFSS advertising by categories that contribute most to childhood obesity - Kantar estimated that £187.1m (87%) of this spend was for products that were HFSS and part of the SDIL, Sugar and Calorie Reduction Programmes; on these data, this represents the maximum advertising spend at risk for broadcasters.
257. De minimis exemption - Under Option B, we have modelled the exemption of channels with low
child audience reach, based on data readily available through Kantar’s analysis. We have provisionally set this threshold to channels that reach under 1% of the UK child viewing audience (circa 90k children), with ‘reach’ defined as children spending over 3 mins per week on that channel, a statistic readily available to broadcasters through BARB audience data. Under any de minimis exemption, we would still apply the current HFSS
258. restrictions covering children’s programming and programming of appeal to children, where broadcasters rely on ‘audience indexing’ in which BARB audience data is used to determine which programmes would attract a high percentage of children compared to the total audience watching. Though a channel-level exemption is modelled here, a programme-based child-audience threshold, restricting advertising in and around programmes, may be just as appropriate, as this aligns with current CAP and BCAP restrictions around food advertising restrictions - we ask about this in the consultation document. However, Kantar’s analysis does not measure child HFSS impacts at a programme level. We would welcome further evidence and views on this issue, and the likely impact of programme-based de minimis exemption compared with a channel-based de minimis exemption.
259. A review of data for 2017 indicates that this would exempt 73% of channels registered with BARB,
while - according to Kantar’s analysis - preserving 8.5% of all HFSS advertising spend (£15.9m) on television. The net effect is that, after this de minimis is applied, we assess that the overall spend at risk on broadcast to be reduced to £171.2m per annum. The intended beneficiaries of this exemption would be small channels, and channels with a high proportion of adults-to-children viewing. However, it may provide unintended advantages to large broadcasters operating a portfolio of channels, over those with a small number of heavily viewed channels. Something not included in this analysis is how a de minimis might encourage displacement of HFSS advertising toward channels with low child viewership, which would be in line with the policy outcome and may further decrease the amount of revenue at risk from HFSS manufacturers and broadcasters as a group, albeit at the expense of broadcasters with high child audiences or ones that operate a channel(s) with large UK audience share.

67
260. Mitigations available to broadcasters - Our evidence suggests that the majority of the costs associated with this option would fall to broadcasters. TV advertising provides a good return on investment for HFSS manufacturers, but they will have a range of options available to them to achieve similar commercial outcomes; they can advertise in different mediums, market alternative products or brand adverts that are compliant with this restriction, or invest in promotion at point of sale. In contrast, broadcasters will have limited options to mitigate lost advertising revenue: the main ones are by scheduling advertising outside of the restrictions or find alternative categories of advertising to fill their commercial breaks. As explained in the cost methodology section above, HFSS manufacturers would likely pursue the following actions to limit the impact of restrictions under ‘Option B’:
○ Reformulate the product to meet restriction guidelines - Kantar’s working assumption that food products with an NPM score of 4 and drinks with an NPM score of 1 would reformulate.
○ Replace their adverts - Manufacturers replacing their adverts for HFSS products with ones for non-HFSS products within their portfolio, or switching to a brand advert that is compliant with BCAP/CAP.
○ Switch advertising spend to watershed hours - Advertisers switch to campaigns that run solely between 2100 and 0530. Kantar's research assumes that advertisers committing most of their spend 2100-0530 could shift all their advertising to this time window.
○ Switch adverts to a different medium - If none of the mitigations above were viable, then the manufacturers may choose to invest in a different form of advertising or marketing at point of sale. Kantar assessed that there would be a limit on the amount of HFSS advertising displaced online, with much of the remaining advertising being displaced to channels such as print media, out of home, direct mail, radio and cinema. We do not believe that where this displacement occurs would affect the overall revenue lost by the broadcasters under this option, but it could have a subsequent effect on the returns HFSS manufacturers derive from their advertising investment.
261. The first three mitigations outlined above are not mutually exclusive; more than one could be applied to a HFSS advert to make it compliant with the proposed watershed restriction. Therefore, Kantar determined the total amount of advertising revenue that could be preserved through these steps combined, rather than individually, which amounted to £63.5m in total. The most common mitigation would be a shift to advertising a non-HFSS product or brand advert. The research estimated that around £53m of advertising spend could be mitigated through this route.
262. Based on these assumptions, Kantar assessed that of the £171.2m of advertising revenue at risk (after the de minimis was applied), up to £63.5m of this could also be mitigated if all HFSS manufacturers optimised their advertising to remain on television. However, we cannot be sure that HFSS manufacturers would base their investments on these assumptions and they may base decisions on other factors unique to their products and market. For the purposes of this analysis, we have therefore assumed a scenario where £31.7m of advertising revenue at risk is retained through aforementioned mitigating actions. This is halfway between manufacturers making no and the maximum mitigation possible to preserve their advertising spend on television; this would leave £139.5m at risk, before the final mitigation - replacing lost HFSS advertising. This represents the HFSS revenue that could displace to other advertising media or be retained by HFSS advertisers.
263. Replacing lost HFSS advertising and cost mechanisms - As explained in the methodology
section, Kantar assumed that 20% (as a central estimate) of lost HFSS advertising revenue could be backfilled by spend from other advertising categories. This analysis also assumes that this spend would come from other forms of advertising media. So while £139.5m of HFSS revenue may be displaced from television to other media, Kantar estimated that £27.9m of non-HFSS advertising spend would displace to television from other media in response. Overall, our final central estimate for advertising revenue lost by broadcasters is £111.6m per annum or £1.90bn over the 25 year appraisal period. Table 12 summarises the restriction steps of the option, mitigations and the impact on advertising revenue.

68
We welcome evidence to help refine these assumptions including those on the likely extent of: reformulation; switching products or brand; moving post 9pm; and backfill by other advertising.
Table 12. Effect of mitigation options for broadcast revenue
Restriction steps and mitigations Change to advertising revenue (£m)
Remaining revenue at risk (£m)
1. Baseline: All HFSS advertising on television N/A 214.7
2. Restricting HFSS categories that contribute most to childhood obesity (SDIL, Sugar & Calorie Reduction) 0530-2100 -27.6 187.1
3. Exempting channels with 1% UK child audience reach (90k) -15.9 171.2
4. 50% of advertiser mitigations taking place -31.7 139.5
5. 20% replacement of lost advertising revenue from other categories of advertising on other media -27.9 111.6
Total -103.1 111.6
264. Impact on broadcasters’ advertising revenue - £111.6m represented approximately 2.3% of UK
TV advertising revenue in 2017. Due to the de minimis exemption, channels with low child audiences would be less affected by revenue losses, and so commercial PSBs and larger multi-channel broadcasters may see a proportionately higher impact. As mentioned in the overview of the broadcasting industry section, these impacts would be against a backdrop of recent TV advertising market decline, increasing restrictions in other areas (i.e. gambling advertising) and economic and market uncertainty. To absorb these losses, commercial PSBs may therefore have to reduce their public service output.
Online Platforms 265. This option does not propose any regulatory changes to the online advertising market. However,
without an advertising restriction comparable to broadcast, HFSS advertising would likely displace online and to other unrestricted advertising mediums. In table 13, we outline Kantar’s assessment of how this displacement may take place, based on the return on investment achievable in other mediums and the relative size of the advertising market. This is captured in our assessment of benefits from the policy.
Table 13. Displacement of HFSS advertising in presence of different policy options, based on return-on-investment
Option B
Channel Displacement from TV
TV 0%
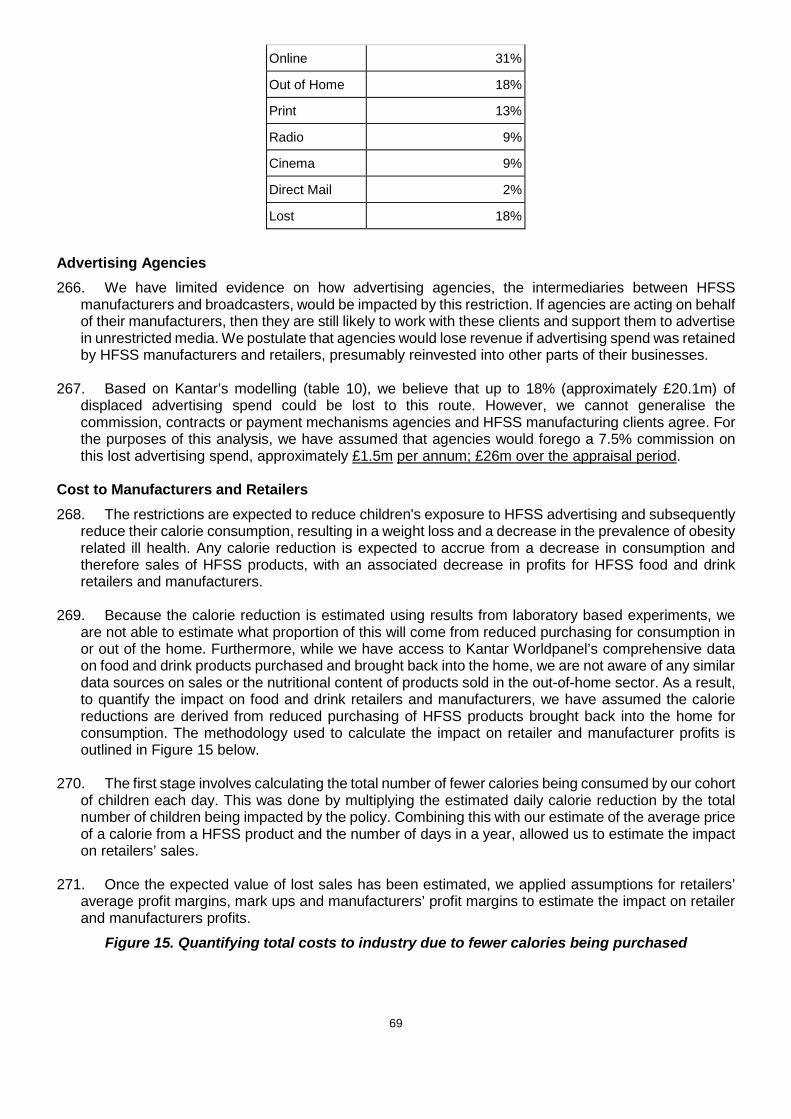
69
Online 31%
Out of Home 18%
Print 13%
Radio 9%
Cinema 9%
Direct Mail 2%
Lost 18% Advertising Agencies 266. We have limited evidence on how advertising agencies, the intermediaries between HFSS
manufacturers and broadcasters, would be impacted by this restriction. If agencies are acting on behalf of their manufacturers, then they are still likely to work with these clients and support them to advertise in unrestricted media. We postulate that agencies would lose revenue if advertising spend was retained by HFSS manufacturers and retailers, presumably reinvested into other parts of their businesses.
267. Based on Kantar’s modelling (table 10), we believe that up to 18% (approximately £20.1m) of displaced advertising spend could be lost to this route. However, we cannot generalise the commission, contracts or payment mechanisms agencies and HFSS manufacturing clients agree. For the purposes of this analysis, we have assumed that agencies would forego a 7.5% commission on this lost advertising spend, approximately £1.5m per annum; £26m over the appraisal period.
Cost to Manufacturers and Retailers 268. The restrictions are expected to reduce children's exposure to HFSS advertising and subsequently
reduce their calorie consumption, resulting in a weight loss and a decrease in the prevalence of obesity related ill health. Any calorie reduction is expected to accrue from a decrease in consumption and therefore sales of HFSS products, with an associated decrease in profits for HFSS food and drink retailers and manufacturers.
269. Because the calorie reduction is estimated using results from laboratory based experiments, we
are not able to estimate what proportion of this will come from reduced purchasing for consumption in or out of the home. Furthermore, while we have access to Kantar Worldpanel’s comprehensive data on food and drink products purchased and brought back into the home, we are not aware of any similar data sources on sales or the nutritional content of products sold in the out-of-home sector. As a result, to quantify the impact on food and drink retailers and manufacturers, we have assumed the calorie reductions are derived from reduced purchasing of HFSS products brought back into the home for consumption. The methodology used to calculate the impact on retailer and manufacturer profits is outlined in Figure 15 below.
270. The first stage involves calculating the total number of fewer calories being consumed by our cohort
of children each day. This was done by multiplying the estimated daily calorie reduction by the total number of children being impacted by the policy. Combining this with our estimate of the average price of a calorie from a HFSS product and the number of days in a year, allowed us to estimate the impact on retailers’ sales.
271. Once the expected value of lost sales has been estimated, we applied assumptions for retailers’ average profit margins, mark ups and manufacturers’ profit margins to estimate the impact on retailer and manufacturers profits.
Figure 15. Quantifying total costs to industry due to fewer calories being purchased
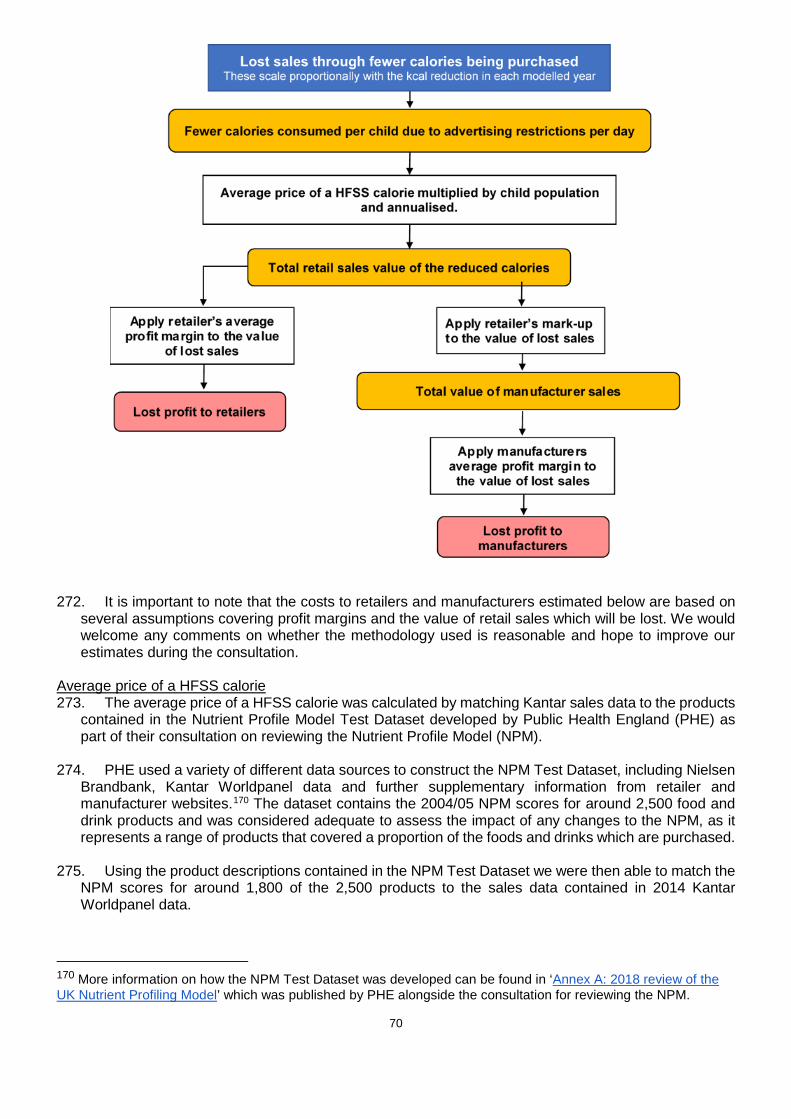
70
272. It is important to note that the costs to retailers and manufacturers estimated below are based on several assumptions covering profit margins and the value of retail sales which will be lost. We would welcome any comments on whether the methodology used is reasonable and hope to improve our estimates during the consultation.
Average price of a HFSS calorie 273. The average price of a HFSS calorie was calculated by matching Kantar sales data to the products
contained in the Nutrient Profile Model Test Dataset developed by Public Health England (PHE) as part of their consultation on reviewing the Nutrient Profile Model (NPM).
274. PHE used a variety of different data sources to construct the NPM Test Dataset, including Nielsen
Brandbank, Kantar Worldpanel data and further supplementary information from retailer and manufacturer websites.170 The dataset contains the 2004/05 NPM scores for around 2,500 food and drink products and was considered adequate to assess the impact of any changes to the NPM, as it represents a range of products that covered a proportion of the foods and drinks which are purchased.
275. Using the product descriptions contained in the NPM Test Dataset we were then able to match the
NPM scores for around 1,800 of the 2,500 products to the sales data contained in 2014 Kantar Worldpanel data.
170 More information on how the NPM Test Dataset was developed can be found in ‘Annex A: 2018 review of the UK Nutrient Profiling Model’ which was published by PHE alongside the consultation for reviewing the NPM.

71
276. Using this dataset we were able to derive the calories per pound of expenditure for each product by looking at the unit price and estimating the number of calories per pack. Using this information, we subsequently estimated that the average number of NPM failing calories that can be bought with £1 is around 900 kcal. This gave an average price of £0.0011 per HFSS calorie. For comparison, £1 spent on a non HFSS product will buy around 640 kcal, giving an average price of £0.0016 per NPM passing ‘non-HFSS’ calorie.
Table 14: Average price of a calorie summary table
Price per calorie
HFSS Product £0.0011
Non-HFSS Product £0.0016
Total value of lost retail sales 277. To estimate the retail sales value of the fewer calories being bought, we multiplied the estimated
daily calorie reduction (1.7kcal) by the price per NPM failing calorie (£0.0011), the number of people experiencing a calorie reduction in each year and 365 days. The result of this calculation suggests the value of lost retail sales averages around £10m per year.
278. The number of people in our calorie model varies over time. As children age and maintain their calorie reduction, the size of the cohort experiencing a calorie reduction increases. This increases industry costs also. As individuals in the cohort reach middle and older age the cohort reduces in size, decreasing industry costs at the end of the appraisal cycle. The cohort reaches its maximum size in year 14 and starts to decline steadily from then onwards, with the rate of this decline increasing from year 40.
Figure 16: The cohort population experiencing a calorie reduction
Lost profit to retailers 279. To work out the impact of this reduction on retailers’ profits we need to apply a profit margin.
Grocery and food retailing is a low margin, high volume business, with increased competition over

72
recent years meaning that profit margins for most grocery retailers’ are under pressure.171 For the purposes of this analysis we could use retailers gross or net profit margins.
280. The gross profit margin is the difference between total revenue and the cost associated with selling
products, such as the cost of purchasing the product from the supplier and transporting it to stores. As a result, using the gross margin would imply that these marginal costs associated with selling products decrease as revenue changes, but fixed costs remain constant.
281. In contrast, the net profit margin is the difference between total revenue and total operating costs.
This measure of profit also takes into account fixed costs and using it would imply that both marginal and fixed costs can be adjusted as revenue changes. It might be expected that retailers’ would be able to adjust their fixed costs in the long run.
282. Evidence suggests that food retailers net profit margins are around 2%172, with gross margins ranging from around 6% at Tesco and Sainsbury's to around 4% at Morrisons.173 Due to the uncertainty around retailers’ ability to adjust fixed costs, we decided to use gross profit margins for the purposes of this analysis. The impact of using a lower margin based on retailer’s net profit margins is explored in the sensitivity analysis.
283. Assuming gross margins are at the higher end of the range reported above and applying a 6%
margin to the value of the reduction in sales of HFSS food and drinks implies average annual lost profits to retailers of £0.6m per year.
Lost profit to food and drink manufacturers 284. We previously estimated that retail sale of the calories removed from children's diets averages
around £10m per year. UK supermarket mark-ups are estimated to be between 35% and 70%174 - assuming the mid-point of this range (52.5%) implies average lost manufacturer sales of £6.5m per year.
285. Over the past decade or so, food and drink producers’ profit margins have ranged between 5 and
7%.175 Assuming gross margins are at the upper end of this range and applying a profit margin of 7% implies average lost profits of around £0.5m per annum for manufacturers of HFSS products.
286. Food and drink manufacturing is a global industry, so we need to adjust our estimate for the impact
on UK shareholders. The true figure for the share of manufacturer profits retained in the UK requires further research, but for this consultation, we assume 49% of manufacturer profits are retained in the UK. This is based on the proportion of food that was supplied from within the UK in 2016.176
287. Adjusting for the total impact on UK shareholders results in a £0.2m reduction in annual profits for
HFSS food and drink manufacturers.
171 Food Standards Scotland (2017) Identifying and understanding the factors that can transform the retail environment to enable healthier purchasing by consumers, Leigh Sparks and Steve Burt, University of Stirling, https://www.foodstandards.gov.scot/downloads/FSS-_Final_Report_June_1st_2017.pdf (accessed 14/09/2018) 172 Food Standards Scotland (2017) Identifying and understanding the factors that can transform the retail environment to enable healthier purchasing by consumers, Leigh Sparks and Steve Burt, University of Stirling, https://www.foodstandards.gov.scot/downloads/FSS-_Final_Report_June_1st_2017.pdf (accessed 14/09/2018) 173 These figures are based on the amount of gross profit these retailers reported in their annual accounts. 174 USDA Foreign Agricultural Service (2011) UK Retail Foods 2010. http://gain.fas.usda.gov/Recent%20GAIN%20Publications/Retail%20Foods_London_United%20Kingdom_2-3-2011.pdf (accessed 28/02/2019) 175 OC&C/ The Grocer Food and Drink 150 (2018) 150 2018 Infographic, https://www.occstrategy.com/en/news-and-media/2018/09/occ-and-the-grocer-food-and-drink-150-2018 (accessed 23/10/2018) 176 Department for Environment, Food & Rural Affairs (2016) Food Statistics Pocketbook 2016, https://www.gov.uk/government/statistics/food-statistics-pocketbook-2016 (accessed 23/10/2018)
73
288. It is important to note that the costs estimated here are based on a number of assumptions covering profit margins and retailer mark-ups. We would welcome any comments on whether our estimated costs to businesses are reasonable and hope to improve these assumptions during the consultation.
Costs to Consumers 289. We do not expect there to be any costs to consumers of this policy. However, it is possible that
businesses could choose to pass on the costs of complying with restrictions by increasing the price of HFSS products.
Costs to Government 290. Depending on the outcome of the consultation, the Government has a number of implementation
routes available depending on the action taken. We are therefore not able at this stage to assess whether or not there would be any additional cost to Government.
Health Benefits Estimated reduction in HFSS advertising exposure 291. Under Option B, Kantar estimated that, after the de minimis exemption and advertiser mitigations
were considered, around 2.5bn child HFSS impacts would be prevented on broadcast television. 292. As outlined previously when estimating the impact on broadcasters, there are a number of different
decisions food and drink manufacturers could make to continue advertising before 9pm on TV. If manufacturers choose to reformulate their products so they are no longer considered HFSS, switch to advertising other non-HFSS products in their portfolio or switch to advertising their non-HFSS brand then this will have a material impact on the costs of the policy, but not the benefits.
293. However, if food and drink manufacturers decide to move their advertising to a post-watershed slot
this would offset some of the decrease in children’s HFSS advertising exposure. Kantar’s analysis estimated that after taking this into account around 0.58bn of the HFSS child impacts removed could still take place post-watershed. This represents the maximum number of impacts which could be shifted to a post-watershed slot, with 0.29bn being used as our central estimate. Subtracting this from Kantar’s estimate that around 2.79bn impacts would be prevented after only taking into the impact of the de minimis exemption, suggests that around 2.5bn child HFSS impacts on broadcast television would be prevented under this option.
Taking into account children’s changing media consumption
294. As mentioned previously, children's television viewing is on a downward trend and as a result their exposure to HFSS adverts on this form of media is expected to decrease over the next few years. In contrast, the amount of time children spend online has been increasing rapidly.
295. Using the projections for children's media use outlined in figure 13, we expect the amount of time
children spend watching television to decrease by around 6.8% annually and their online media use to increase by around 3.4% per year. Taken over five years this suggests that children's exposure to HFSS advertising will decrease by around 30% on TV.
296. Applying these adjustments to the exposure figures noted above suggests children will see 1.76bn
fewer HFSS adverts on TV annually, in five years’ time. Estimating children's reduction in calorie consumption
297. Using the average length of an advertising slot on television we can convert advertising impacts into minutes of HFSS advertising exposure. The research conducted by Kantar177 suggests that the
177A write up of the methodology used by Kantar can be found in Annex D.
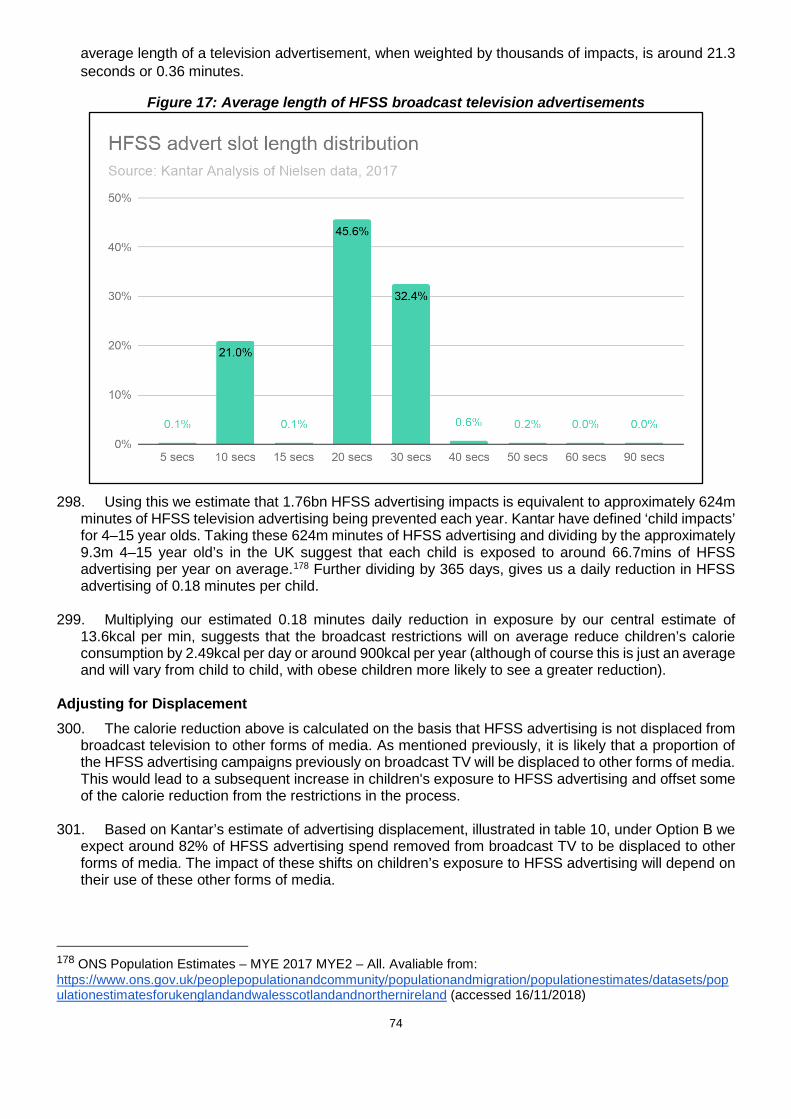
74
average length of a television advertisement, when weighted by thousands of impacts, is around 21.3 seconds or 0.36 minutes.
Figure 17: Average length of HFSS broadcast television advertisements
298. Using this we estimate that 1.76bn HFSS advertising impacts is equivalent to approximately 624m
minutes of HFSS television advertising being prevented each year. Kantar have defined ‘child impacts’ for 4–15 year olds. Taking these 624m minutes of HFSS advertising and dividing by the approximately 9.3m 4–15 year old’s in the UK suggest that each child is exposed to around 66.7mins of HFSS advertising per year on average.178 Further dividing by 365 days, gives us a daily reduction in HFSS advertising of 0.18 minutes per child.
299. Multiplying our estimated 0.18 minutes daily reduction in exposure by our central estimate of
13.6kcal per min, suggests that the broadcast restrictions will on average reduce children’s calorie consumption by 2.49kcal per day or around 900kcal per year (although of course this is just an average and will vary from child to child, with obese children more likely to see a greater reduction).
Adjusting for Displacement 300. The calorie reduction above is calculated on the basis that HFSS advertising is not displaced from
broadcast television to other forms of media. As mentioned previously, it is likely that a proportion of the HFSS advertising campaigns previously on broadcast TV will be displaced to other forms of media. This would lead to a subsequent increase in children's exposure to HFSS advertising and offset some of the calorie reduction from the restrictions in the process.
301. Based on Kantar’s estimate of advertising displacement, illustrated in table 10, under Option B we
expect around 82% of HFSS advertising spend removed from broadcast TV to be displaced to other forms of media. The impact of these shifts on children’s exposure to HFSS advertising will depend on their use of these other forms of media.
178 ONS Population Estimates – MYE 2017 MYE2 – All. Avaliable from: https://www.ons.gov.uk/peoplepopulationandcommunity/populationandmigration/populationestimates/datasets/populationestimatesforukenglandandwalesscotlandandnorthernireland (accessed 16/11/2018)
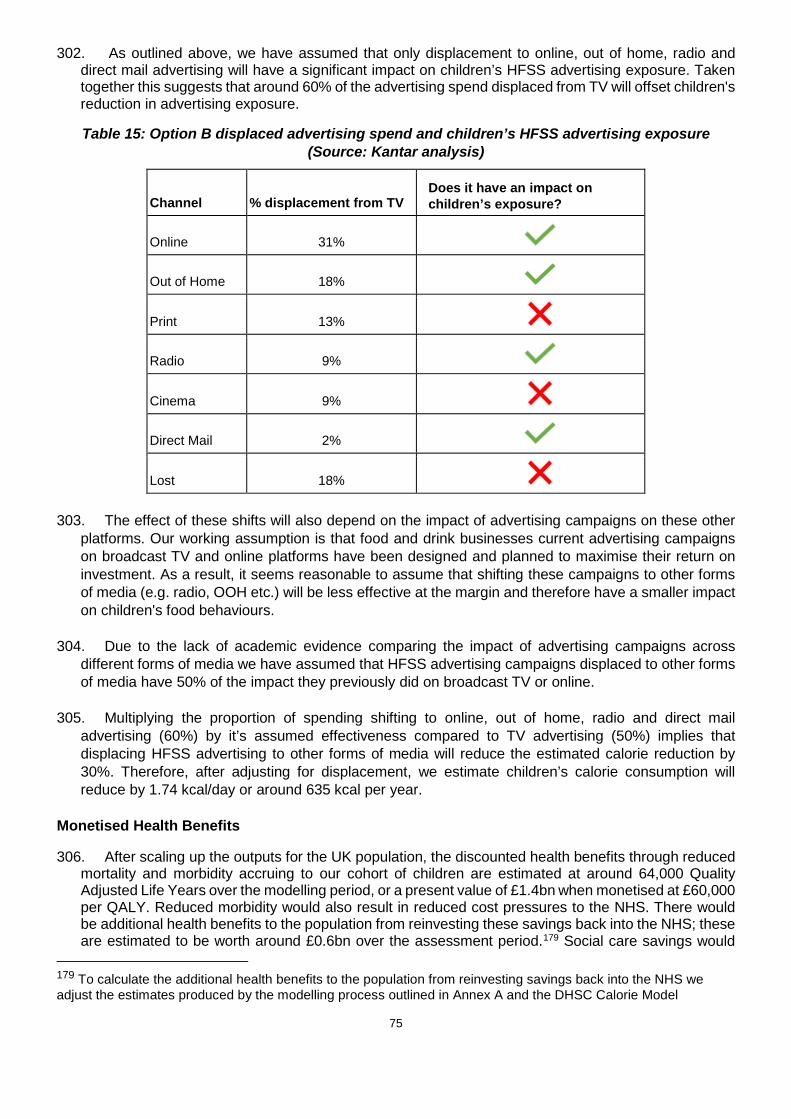
75
302. As outlined above, we have assumed that only displacement to online, out of home, radio and direct mail advertising will have a significant impact on children’s HFSS advertising exposure. Taken together this suggests that around 60% of the advertising spend displaced from TV will offset children's reduction in advertising exposure.
Table 15: Option B displaced advertising spend and children’s HFSS advertising exposure (Source: Kantar analysis)
Channel % displacement from TV Does it have an impact on children’s exposure?
Online 31%
Out of Home 18%
Print 13%
Radio 9%
Cinema 9%
Direct Mail 2%
Lost 18% 303. The effect of these shifts will also depend on the impact of advertising campaigns on these other
platforms. Our working assumption is that food and drink businesses current advertising campaigns on broadcast TV and online platforms have been designed and planned to maximise their return on investment. As a result, it seems reasonable to assume that shifting these campaigns to other forms of media (e.g. radio, OOH etc.) will be less effective at the margin and therefore have a smaller impact on children's food behaviours.
304. Due to the lack of academic evidence comparing the impact of advertising campaigns across different forms of media we have assumed that HFSS advertising campaigns displaced to other forms of media have 50% of the impact they previously did on broadcast TV or online.
305. Multiplying the proportion of spending shifting to online, out of home, radio and direct mail
advertising (60%) by it’s assumed effectiveness compared to TV advertising (50%) implies that displacing HFSS advertising to other forms of media will reduce the estimated calorie reduction by 30%. Therefore, after adjusting for displacement, we estimate children’s calorie consumption will reduce by 1.74 kcal/day or around 635 kcal per year.
Monetised Health Benefits
306. After scaling up the outputs for the UK population, the discounted health benefits through reduced mortality and morbidity accruing to our cohort of children are estimated at around 64,000 Quality Adjusted Life Years over the modelling period, or a present value of £1.4bn when monetised at £60,000 per QALY. Reduced morbidity would also result in reduced cost pressures to the NHS. There would be additional health benefits to the population from reinvesting these savings back into the NHS; these are estimated to be worth around £0.6bn over the assessment period.179 Social care savings would
179 To calculate the additional health benefits to the population from reinvesting savings back into the NHS we adjust the estimates produced by the modelling process outlined in Annex A and the DHSC Calorie Model

76
amount to £0.04bn and reduced mortality would be expected to deliver an additional £0.03bn of economic output through additional labour force participation.
Table 16: Option B: Displacement adjusted benefit figures
Benefit Displacement adjusted Present Value Benefits
Quality Adjusted Life Years 64,000
Monetised health benefit £1.4bn
NHS savings £0.6bn
Social care savings £0.04bn
Economic output £0.03bn
Total benefits180 £2.1bn
Unmonetised Benefits 307. There are additional benefits that, owing to the limitations of the modelling, have not been
monetised. These include:
○ Preventing obesity-related ill health that is likely to occur in addition to the 5 obesity-related health conditions included in the model.
○ Nutritional benefits from consumers making healthier choices in addition to reduced calorie consumption.
○ There may be additional benefits from adults’ lower exposure to HFSS advertising. ○ Reformulation of products may result in additional calorie reductions and nutritional benefits. ○ Improvements to economic productivity resulting from a healthier workforce are not included.
308. However, there are significant uncertainties in all the estimated benefits, including some factors
which have been identified as potential overestimates (see Key Assumptions and Limitations in the Health Benefits Calculations section above). For this reason, the unmonetised benefits need to be understood in the context of the very significant uncertainty in the estimate of benefits.
309. Due to both the uncertainty around these figures and the long appraisal period, we have conducted critical value and sensitivity analysis to illustrate the potential benefits required to make the policy cost effective.
Benefits to Business 310. As outlined in table 10, Kantar assessed that 82% of advertising revenue moving from television
would displace to less-restricted advertising channels, such as online, print media and outdoor advertising. Under option B, Kantar estimated that businesses in these sectors would have benefited from £91.5m of investment by HFSS advertisers annually, based on 2017 data; £1.56bn over the course of the appraisal period.
Technical Consultation Document accompanying this publication. At the margin, it is estimated that the NHS can purchase a QALY for £15,000, which in turn is then valued at £60,000 by society. Therefore, dividing the yearly NHS savings by this figure and multiplying by society’s valuation of a QALY allows us to estimate additional health benefits these savings generate. 180 Figures might not sum to total due to rounding.

77
311. Because the spend on food and drink advertising on television is large compared to other marketing channels, there is likely to be a limit to how much television advertising could be displaced. Under option B, Kantar estimated that £20.1m of advertising spend would be retained by HFSS manufacturers and retailers annually, based on 2017 data; £343m over the appraisal period. We are not able to assess how this would be reinvested.
Summary of costs and benefits 312. It has not been possible to quantify every aspect of the proposed policy. We will continue to work
on the unquantified areas during the consultation to create robust estimates. The table below outlines the expected influence of the policy, with quantifications where currently possible, as estimated over a 25-year assessment period.
313. Furthermore, as mentioned previously due to the considerable number of uncertainties our calculations do not consider the future impact of the policies already announced as part of the ‘Childhood obesity: A plan for action’ or any other possible future actions by government.
Table 17: Summary of costs and benefits – Option B
Group affected
Impact Present value, £m
Displacement adjusted
Costs
Broadcasters Transition Costs 0
HFSS Advertising Revenue Lost 1,904
Retailers and Manufacturers of HFSS products
Transition Costs 0
HFSS profit lost 27
Advertising agencies Transition costs 0
HFSS advertising revenue lost 26
Present Value Costs 1,957
Benefits
Other forms of media Additional revenue from adverts displaced from restricted media
1,561
Retailers and Manufacturers of HFSS products
Unspent advertising budgets retained by manufacturers and retailers
343
Government
NHS Savings 613
Social Care Savings 40

78
Consumers Health Benefits 1,449
Economic Benefits 31
Consumer Surplus 0
Present Value Benefits 4,037
Total Net Present Value 2,080
E(iii) Option C - Advertising restriction on HFSS products in scope of the SDIL, and PHE’s Sugar and Calorie Reduction Programmes. Applied via a 2100-0530 pre-watershed on broadcast TV and online.
Costs to Business
Transition Costs 314. The transition costs for manufacturers/retailers, broadcasters and advertising agencies would be
comparable to ‘Option B’. However, under this option online platforms would also be impacted, and the regulator may face different challenges beyond the adjustments required to regulate a broadcast watershed.
315. Regulators. The ASA requires compliance with its rulings and also does a limited amount of
proactive monitoring of advertisers affected by its rulings to help ensure continuing compliance. Given this, the absence of a dedicated pre-clearance system for online advertising, the near limitless advertising inventory and the unprecedented nature of an online watershed, the ASA may face a significant additional administrative burden in adapting to the regulation of an online watershed.
316. Online Platforms. Though they fulfil a similar role to broadcasters in providing space for
advertising, the transition costs for these parties would vary. Unlike in broadcast, where broadcasters can share liability with advertisers, online platforms do not bear responsibility and advertisers are solely responsible for compliance with advertising rules. At the same time, while online advertising can be traded in the traditional manner - manufacturer-(agency)-publisher - programmatic advertising (the use of automated systems and processes to buy and sell advertising space online) which accounts for upwards of 80% of the display market181, involves a far more complex supply chain where inventory is sold by advertising intermediaries rather than the platforms (though some of the larger publishers operate at multiple levels of the supply chain).
317. Therefore, we expect online transition costs to principally fall on manufacturers, retailers and these intermediary advertising agencies. We do not have evidence on how long it would take to develop time-based restrictions online nor the administrative resource needed to monitor such a system, though it is worth noting that programmatic advertising can already be limited to specific times of day, so we believe implementation for this part of the market to be relatively straightforward.
318. Online platforms may also face further challenges under this option, particularly given that there are currently no time-based content restrictions online for advertising. The digital advertising landscape is much more complicated than broadcast, both in terms of the variety of advertising format and delivery, and in terms of the sometimes blurred line between editorial content and advertising, and this may present additional challenges beyond adapting the delivery of programmatic advertising to ensure
181 2017 IAB/PWC Digital Adspend Study
79
compliance with the requirements of a watershed, which may fall principally on the publishers rather than the advertisers or advertising intermediaries.
319. At this time, we do not have a reliable estimate on the number of people that would need to enact changes online, so cannot offer a transition cost.
Lost Sales Revenue
Broadcasters 320. Total advertising revenue at risk. This option restricts broadcasters in the same way as ‘Option
B’, so the same amount of advertising revenue is at risk (£111.6m).
Online Platforms 321. Evidence of the volume of HFSS advertising online is limited. The most reliable and accessible
measure of advertising spend and audience impacts, comes from ComScore. Their data covers display advertising on laptops and personal computers, which we believe to represent only 9% of the digital market that would contain food and drink advertising.182 Kantar’s review of this data revealed that £2.3m of advertising spend was attributable to HFSS products and estimated there were around 8.3m commercial impacts delivered to children. We believe that this is a significant under-representation of the amount of HFSS advertising online. The digital display advertising market ComScore covers was valued at £894m, so - on these data - HFSS advertising spend represented only 0.3% of this market. Overall, digital display advertising does not appear to be a medium that is representative of online food advertising overall - based on reporting from Statista and Group M, the food advertising market was worth 5% of UK advertising spend in 2016, £927m.183
322. Further exploration of Nielsen advertising data, which - like all providers - cannot provide 100% coverage of the online market, show that food and drink, compared to other markets, is far less reliant on online advertising. Figure 18. shows that £89.7m, 8% of food (£74m based on 2016 data) and 5% of drink (£15.7m based on 2016 data), advertiser spend is on digital channels. Based on this data and proportion of food and drink adverts that were HFSS in the ComScore sample (59%), we estimate that HFSS advertising spend online is approximately £52.9m. This is necessarily a tentative estimate.
323. As noted earlier in the document, we have not proposed or modelled and online de minimis exemption, as proposed for broadcast television. CAP code HFSS restrictions would remain in place after the watershed, prohibiting advertising directed at children or appearing on websites with child audience over 25%.
182 Internet Advertising Bureau, the figure of 9% was calculated by assuming HFSS advertisements do not feature as Classifieds. 183 Industry sectors ranked by advertising expenditure in the UK 2017, Statista: https://www.statista.com/statistics/452411/advertising-expenditure-by-industry-sector-in-uk/ (accessed 04/03/2019)

80
Figure 18. Breakdown of Nielsen advertising categories by media channel spend
324. As with the broadcast option, we have applied the following assumptions around mitigation and
advertising substitution:
○ That the proportion of HFSS advertising that falls within SDIL and PHE reduction programmes was broadly comparable to that seen on broadcast television (87%) £46.1m at risk;
○ Similar mitigations would be available to HFSS manufacturers to retain their advertising online (circa 15% of spend retained) £38.9m at risk;
○ As per broadcast television, online platforms could substitute 20% of their HFSS advertising with non-HFSS variants £31.1m at risk.
325. Based on the aforementioned assumptions, online platforms could lose around £31.1m of advertising revenue per annum if an online watershed was introduced.
326. Adverts displaced to different mediums. Unlike Option B, Option C does propose comparable advertising restrictions online as on broadcast. As a result, its likely that HFSS advertising would be displaced from online and broadcast to other unrestricted advertising mediums and not between the two. In table 18, we outline Kantar’s assessment of how this displacement may take place, based on the return on investment achievable in other mediums and the relative size of the advertising market. This is captured in our assessment of benefits from the policy.
Table 18. Displacement of HFSS advertising, based on return-on-investment.
Option C
Channel Displacement from TV and Online
Displacement from Online
TV 0% 0%
Online 0% 0%
Out of Home 26% 26%
Print 22% 22%
Radio 15% 15%
81
Cinema 15% 15%
Direct Mail 3% 3%
Lost 19% 19% Advertising Agencies 327. We apply the same assumptions as ‘Option B’, where advertisers would lose commission based
on net advertising spend lost across all media channels. The estimated displacement under this option is shown in table 18. Under ‘Option C’, we believe that the amount of advertising revenue lost would increase from approximately £20.1m to £27.1m. Again, we have assumed that agencies would forego a 7.5% commission on this lost advertising spend, approximately £2m per annum.
Cost to Manufacturers and Retailers
Total lost retail sales value 328. Here we apply the same methodology as ‘Option B’. However, under this option we estimate that
children would consume 2.3 fewer calories per day, equating to an average annual lost retail sales of around £12.9m.
Lost profit to retailers and manufacturers 329. Using the same methodology and assumptions in ‘Option B’, we assess that the net present value
lost profit to retailers and manufacturers over the full appraisal cycle would be £25.2m and £9.5m respectively.
Costs to consumers 330. As per ‘Option B’, we do not expect there to be any costs to consumers of this policy. However, it
is possible that businesses could choose to pass on the costs of complying with restrictions by increasing the price of HFSS products.
Costs to Government 331. Depending on the outcome of the consultation, the Government has a number of implementation
routes available depending on the action taken. Therefore at this stage we are not able to assess whether or not there would be any additional cost to Government.
Health Benefits Estimated reduction in HFSS advertising exposure 332. Under Option C, Kantar Consulting estimated that, after the de minimis exemption and advertiser
mitigations were considered, around 2.5bn child HFSS impacts would be prevented on broadcast television. While online, a further 0.57bn child HFSS impacts would be prevented.
333. Broadcast Impacts. Option C reduces broadcast TV impacts to the same extent as Option B and follows the same methodology and assumptions as that option. This suggests that around 2.5bn child HFSS impacts on broadcast television would be prevented under this option.
334. Online Impacts. As part of Option C we are also proposing to introduce the same pre-watershed restrictions to online HFSS food and drink advertising. As explained in our methodology, we estimate that children were exposed to approximately 0.7bn HFSS online advertising impacts in total.

82
335. Under an online watershed restriction, we estimate that around 91% of the online HFSS impacts would be prevented. This is because according to the Ofcom ‘Digital Day’184 around 91% of the time children spend online takes place between 05:30 and 21:00. Applying the same assumptions around advertising switching to post watershed slots as broadcast suggests that an online watershed would reduce children's exposure by around 0.57bn HFSS impacts. Multiplying by 51% suggests this made up of around 0.29bn video impacts and 0.28bn display impacts.
Taking into account children’s changing media consumption
336. Applying the same adjustments for media consumption as Option B suggests children would see 1.76bn fewer HFSS adverts on TV and 0.34bn fewer online video and 0.33bn fewer online display adverts in five years’ time.
Estimating children's reduction in calorie consumption
Calorie impact of reduced exposure on TV 337. Following the same methodology outlined in Option B, we estimate that the broadcast restrictions
will reduce children's calorie consumption by around 2.5kcal per day. Calorie impact of reduced exposure online 338. Taking the estimated 0.34bn online video and 0.33bn online display HFSS impressions and
dividing by the approximately 9.3m 4–15 year old’s in the UK suggest that each child is exposed to around 37 online video and 35 online display HFSS impacts per year on average.185 Further dividing by 365 days, gives us an average daily reduction in HFSS advertising impressions of around 0.1 online video adverts and 0.1 online display adverts per child.
339. We previously estimated that viewing a HFSS online video advert would trigger an additional
3.2kcal of consumption and an online display advertising impression triggers an additional 1.1kcal of consumption. Multiplying these figures by children's estimated daily reduction in online HFSS advertising impacts, suggests that the online restrictions will reduce their calorie consumption by an additional 0.4kcal per day.
340. This leads to a total reduction across online and television of around 2.9 kcal/day or 1,070 kcal/year.
Adjusting for Displacement 341. Again, it is likely that some of the HFSS advertising spend displaced from broadcast television and
online platforms will switch to other forms of media. Offsetting some of the health benefits from the restrictions in the process.
342. Under Option C we expect around 81% of HFSS advertising spend removed from broadcast TV
and online would be displaced to other forms of media.
184 Ofcom, Digital Day 2016 Slide pack 2: Children’s 3 day media and communications diary findings: https://www.ofcom.org.uk/research-and-data/multi-sector-research/general-communications/digital-day (accessed 04/03/2019) 185 ONS Population Estimates – MYE 2017 MYE2 – All. Available from: https://www.ons.gov.uk/peoplepopulationandcommunity/populationandmigration/populationestimates/datasets/populationestimatesforukenglandandwalesscotlandandnorthernireland (accessed 16/11/2018)

83
Table 19: Option C displaced advertising spend and children’s HFSS advertising exposure
Channel % displacement from TV and online
Does it have an impact on children’s exposure?
TV 0%
Online 0%
Out of Home 26%
Print 22%
Radio 15%
Cinema 15%
Direct Mail 3%
Lost 19% 343. Following the same assumptions used for Option B suggests implies that displacing HFSS
advertising to other forms of media will reduce the estimated calorie reduction by 22%. After adjusting for this displacement, we estimate children’s calorie consumption will reduce by 2.28 kcal/day or around 830 kcal/year.
Monetised Health Benefits
344. After scaling up the outputs from our model for the UK population, the discounted health benefits through reduced mortality and morbidity accruing to our cohort of children are estimated at around 84,000 Quality Adjusted Life Years over the modelling period, or a present value of £1.9bn when monetised at £60,000 per QALY. Reduced morbidity would also result in reduced cost pressures to the NHS. There would be additional health benefits to the population from reinvesting these savings back into the NHS; these are estimated to be worth around £0.8bn over the assessment period.186 Social care savings would amount to £0.05bn and reduced premature mortality would be expected to deliver an additional £0.04bn of economic output through additional labour force participation.
Table 20: Option C: Displacement adjusted benefit figures
Benefit Displacement adjusted Present Value Benefits
Quality Adjusted Life Years 84,000
186 To calculate the additional health benefits to the population from reinvesting savings back into the NHS we adjust the estimates produced by the modelling process outlined in Annex A and the DHSC Calorie Model Technical Consultation Document accompanying this publication. At the margin, it is estimated that the NHS can purchase a QALY for £15,000, which in turn is then valued at £60,000 by society. Therefore, dividing the yearly NHS savings by this figure and multiplying by society’s valuation of a QALY allows us to estimate additional health benefits these savings generate.

84
Monetised health benefit £1.9bn
NHS savings £0.8bn
Social care savings £0.05bn
Economic output £0.04bn
Total benefits £2.8bn
Unmonetised Benefits 345. As discussed under Option B, there are multiple factors that may result in an under or overestimate
of the health benefits resulting from this policy. However, due to the uncertainties surrounding these factors, it has not been possible to determine the size of either of these impacts or whether one will outweigh the other.
346. Due to both the uncertainty around these figures and the long appraisal period, we have conducted
critical value and sensitivity analysis to illustrate the potential benefits required to make the policy cost effective.
Benefits to Business
347. As outlined in table 19, Kantar assessed that 81% of advertising revenue moving from television and online would displace to less-restricted advertising channels, such as print media and outdoor advertising. Under option C, Kantar estimated that businesses in these sectors would have benefited from £115.9m of investment from HFSS advertisers, based on 2017 data; £1.98bn over the appraisal period.
348. Under option C, Kantar estimated that £27.2m of advertising spend would be retained by HFSS manufacturers and retailers, based on 2017 data; £464m over the appraisal period.
Summary of costs and benefits 349. It has not been possible to quantify every aspect of the proposed policy. We will continue to work
on the unquantified areas during the consultation to create robust estimates. The table below outlines the expected influence of the policy, with quantifications where currently possible, as estimated over a 25-year assessment period.
350. Furthermore, as mentioned previously due to the considerable number of uncertainties our
calculations do not consider the future impact of the policies already announced as part of the ‘Childhood obesity: A plan for action’ or any other possible future actions by government.
Table 21: Summary of costs and benefits – Option C
Group affected
Impact Present value, £m
Displacement adjusted
Costs
Broadcasters Transition costs 0
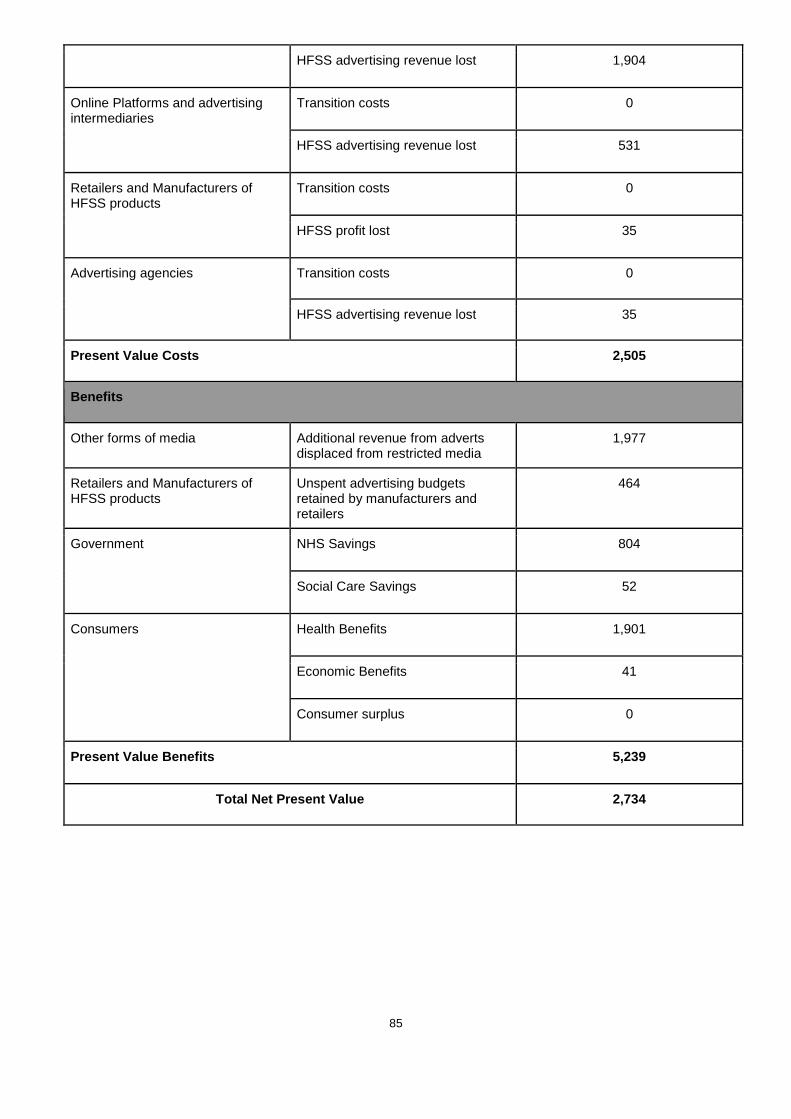
85
HFSS advertising revenue lost 1,904
Online Platforms and advertising intermediaries
Transition costs 0
HFSS advertising revenue lost 531
Retailers and Manufacturers of HFSS products
Transition costs 0
HFSS profit lost 35
Advertising agencies Transition costs 0
HFSS advertising revenue lost 35
Present Value Costs 2,505
Benefits
Other forms of media Additional revenue from adverts displaced from restricted media
1,977
Retailers and Manufacturers of HFSS products
Unspent advertising budgets retained by manufacturers and retailers
464
Government NHS Savings 804
Social Care Savings 52
Consumers Health Benefits 1,901
Economic Benefits 41
Consumer surplus 0
Present Value Benefits 5,239
Total Net Present Value 2,734

86
E(iv) Option D - Advertising restriction on HFSS products in scope of the SDIL, and PHE’s Sugar and Calorie Reduction Programmes. Applied via a 2100-0530 pre-watershed online only. Retain current TV advertising restrictions.
Costs to businesses
Transition Costs 351. The transition costs for manufacturers/retailers, advertising agencies and regulators would be as
described in ‘Option C’. However, under this option only those companies involved in digital advertising campaigns and online platforms would be impacted.
Lost Sales Revenue Broadcasters 352. Total advertising revenue at risk. This option places no additional restrictions on broadcasters.
Kantar also assessed that there would be some displacement from online to broadcast television, but due to the lower return on investment observed through online advertising and most large food and drink advertisers already being on television, there would be a limit to the amount of online spend moving into television. Kantar assessed that 31% of online spend could displace to television, so broadcasters could experience a net increase in HFSS advertising revenue under this option.
Online Platforms 353. This option proposes the same online watershed restriction as ‘Option C’. Again, we assess that
online platforms could lose around £31.1m of advertising revenue per annum if this was introduced.
354. Adverts displaced to different mediums. We believe that there would be some displacement of HFSS advertising from online to broadcast television. We would also likely see displacement of online advertising to other media channels. Kantar’s assessment on the level of displacement can be found in table 22.
Table 22. Displacement of HFSS advertising in presence of different policy options, based on return-on-investment.
Option D
Channel Displacement from Online
TV 31%
Online 0%
Out of Home 18%
Print 13%
Radio 9%
Cinema 9%
Direct Mail 2%
Lost 18% Advertising Agencies 355. We apply the same assumptions as ‘Option B’ and ‘Option C’, where advertisers would lose
commission based on net advertising spend lost across all media channels. Under ‘Option D’, we believe that the amount of advertising revenue lost would be approximately £5.6m. Again, we have
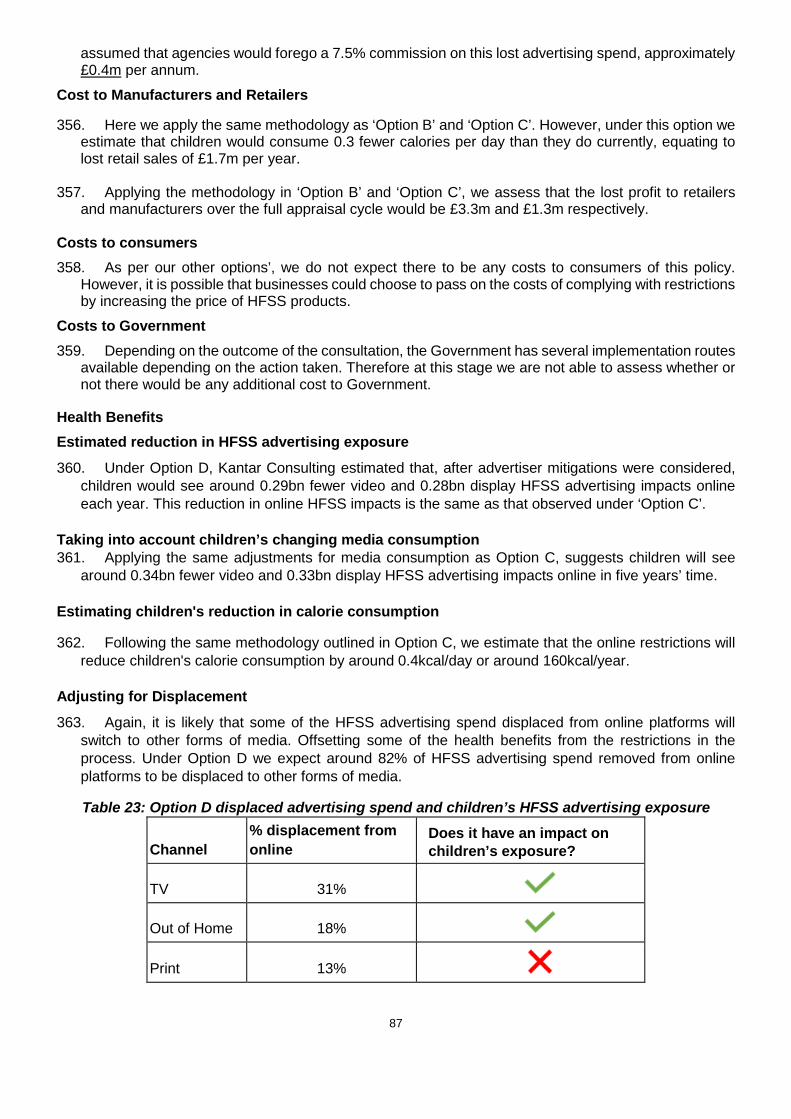
87
assumed that agencies would forego a 7.5% commission on this lost advertising spend, approximately £0.4m per annum.
Cost to Manufacturers and Retailers
356. Here we apply the same methodology as ‘Option B’ and ‘Option C’. However, under this option we estimate that children would consume 0.3 fewer calories per day than they do currently, equating to lost retail sales of £1.7m per year.
357. Applying the methodology in ‘Option B’ and ‘Option C’, we assess that the lost profit to retailers
and manufacturers over the full appraisal cycle would be £3.3m and £1.3m respectively.
Costs to consumers 358. As per our other options’, we do not expect there to be any costs to consumers of this policy.
However, it is possible that businesses could choose to pass on the costs of complying with restrictions by increasing the price of HFSS products.
Costs to Government 359. Depending on the outcome of the consultation, the Government has several implementation routes
available depending on the action taken. Therefore at this stage we are not able to assess whether or not there would be any additional cost to Government.
Health Benefits Estimated reduction in HFSS advertising exposure 360. Under Option D, Kantar Consulting estimated that, after advertiser mitigations were considered,
children would see around 0.29bn fewer video and 0.28bn display HFSS advertising impacts online each year. This reduction in online HFSS impacts is the same as that observed under ‘Option C’.
Taking into account children’s changing media consumption 361. Applying the same adjustments for media consumption as Option C, suggests children will see
around 0.34bn fewer video and 0.33bn display HFSS advertising impacts online in five years’ time. Estimating children's reduction in calorie consumption
362. Following the same methodology outlined in Option C, we estimate that the online restrictions will reduce children's calorie consumption by around 0.4kcal/day or around 160kcal/year.
Adjusting for Displacement 363. Again, it is likely that some of the HFSS advertising spend displaced from online platforms will
switch to other forms of media. Offsetting some of the health benefits from the restrictions in the process. Under Option D we expect around 82% of HFSS advertising spend removed from online platforms to be displaced to other forms of media.
Table 23: Option D displaced advertising spend and children’s HFSS advertising exposure
Channel % displacement from online
Does it have an impact on children’s exposure?
TV 31%
Out of Home 18%
Print 13%

88
Radio 9%
Cinema 9%
Direct Mail 2%
Lost 18% 364. Following the same assumptions used for Option B suggests that displacing HFSS advertising to
other forms of media will reduce the estimated calorie reduction by 30%. Therefore, after adjusting for this displacement, we estimate children’s calorie consumption will reduce by 0.3 kcal/day or around 110 kcal/year.
Monetised Health Benefits
365. After scaling up the outputs from our model for the UK population, the discounted health benefits through reduced mortality and morbidity accruing to our cohort of children are estimated at around 10,000 Quality Adjusted Life Years over the modelling period, or a present value of £0.2bn when monetised at £60,000 per QALY. Reduced morbidity would also result in reduced cost pressures to the NHS. There would be additional health benefits to the population from reinvesting these savings back into the NHS; these are estimated to be worth around £0.1bn over the assessment period.187 Social care savings would amount to around £6m and reduced premature mortality would be expected to deliver an additional £5m of economic output through additional labour force participation
Table 24: Option D: Displacement adjusted benefit figures Benefit Displacement adjusted
Present Value Benefits
Quality Adjusted Life Years 10,000
Monetised health benefit £0.2bn
NHS savings £0.1bn
Social care savings £0.006bn
Economic output £0.005bn
Total benefits £0.35bn
Unmonetised benefits 366. As discussed under Option B, there are multiple factors that may result in an under or overestimate
of the health benefits resulting from this policy. However, due to the uncertainties surrounding these
187 To calculate the additional health benefits to the population from reinvesting savings back into the NHS we adjust the estimates produced by the modelling process outlined in Annex A and the DHSC Calorie Model Technical Consultation Document accompanying this publication. At the margin, it is estimated that the NHS can purchase a QALY for £15,000, which in turn is then valued at £60,000 by society. Therefore, dividing the yearly NHS savings by this figure and multiplying by society’s valuation of a QALY allows us to estimate additional health benefits these savings generate.

89
factors, it has not been possible to determine the size of either of these impacts or whether one will outweigh the other.
367. Due to both the uncertainty around these figures and the long appraisal period, we have conducted
critical value and sensitivity analysis to illustrate the potential benefits required to make the policy cost effective.
Benefits to Business 368. As outlined in table 23, Kantar assessed that 82% of advertising revenue moving from online
would displace to less-restricted advertising channels, such as print media and outdoor advertising, but not onto television, under the assumption that a HFSS advertiser would already be advertising on television if possible, due to the higher returns on investment or find the entry costs to television advertising prohibitive. Under option D, Kantar estimated that businesses in these sectors would have benefited from £25.5m of investment from HFSS advertisers, based on 2017 data; £435m over the appraisal period.
369. Under option C, Kantar estimated that £5.6m of advertising spend would be retained by HFSS manufacturers and retailers, based on 2017 data; £96m over the appraisal period.
Summary of costs and benefits 370. It has not been possible to quantify every aspect of the proposed policy. We will continue to work
on the unquantified areas during the consultation to create robust estimates. The table below outlines the expected influence of the policy, with quantifications where currently possible, as estimated over a 25-year assessment period.
371. Furthermore, as mentioned previously due to the considerable number of uncertainties our calculations do not consider the future impact of the policies already announced as part of the ‘Childhood obesity: A plan for action’ or any other possible future actions by government
Table 25: Summary of costs and benefits – Option D
Group affected
Impact Present value, £m
Displacement adjusted
Costs
Broadcasters Transition costs 0
HFSS advertising revenue lost 0
Online Platforms Transition costs 0
HFSS advertising revenue lost 531
Retailers and Manufacturers of HFSS products
Transition costs 0
HFSS profit lost 5
Advertising agencies Transition costs 0
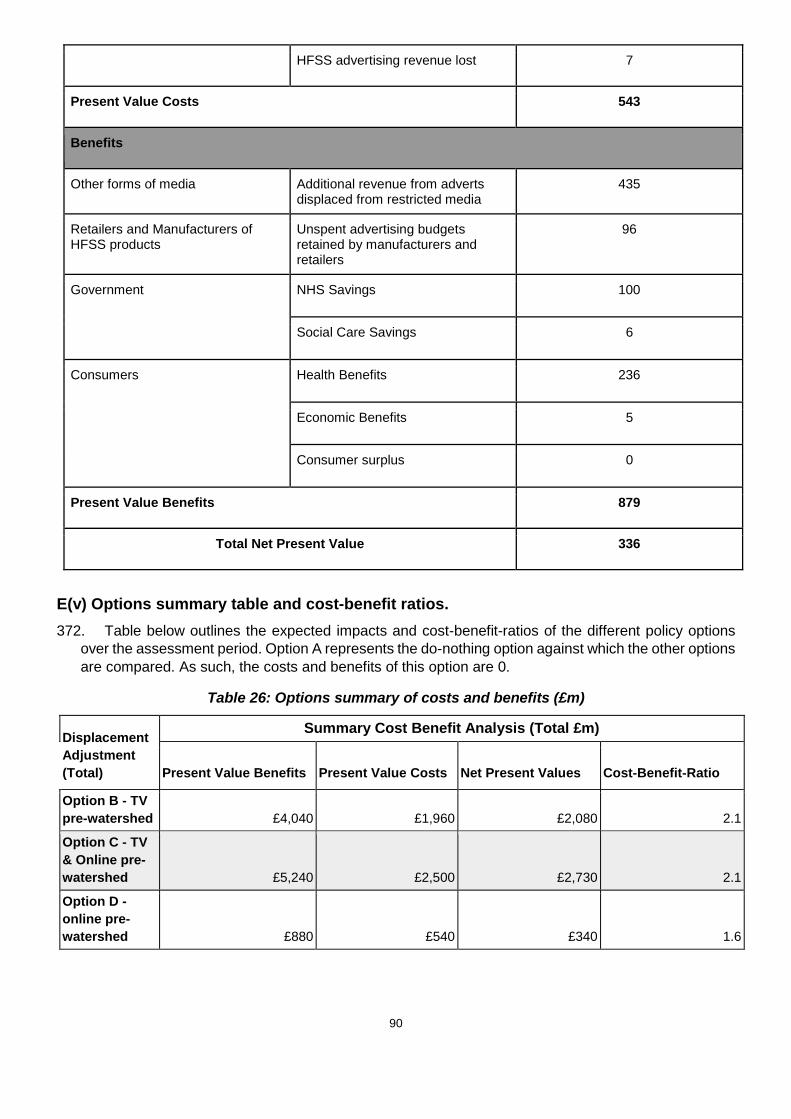
90
HFSS advertising revenue lost 7
Present Value Costs 543
Benefits
Other forms of media Additional revenue from adverts displaced from restricted media
435
Retailers and Manufacturers of HFSS products
Unspent advertising budgets retained by manufacturers and retailers
96
Government NHS Savings 100
Social Care Savings 6
Consumers Health Benefits 236
Economic Benefits 5
Consumer surplus 0
Present Value Benefits 879
Total Net Present Value 336
E(v) Options summary table and cost-benefit ratios. 372. Table below outlines the expected impacts and cost-benefit-ratios of the different policy options
over the assessment period. Option A represents the do-nothing option against which the other options are compared. As such, the costs and benefits of this option are 0.
Table 26: Options summary of costs and benefits (£m)
Displacement Adjustment (Total)
Summary Cost Benefit Analysis (Total £m)
Present Value Benefits Present Value Costs Net Present Values Cost-Benefit-Ratio
Option B - TV pre-watershed £4,040 £1,960 £2,080 2.1
Option C - TV & Online pre-watershed £5,240 £2,500 £2,730 2.1
Option D - online pre-watershed £880 £540 £340 1.6

91
F. Special IA Sections
F(i) Critical value analysis 373. As mentioned previously, it is possible that wider factors, such as changes to retailer and
manufacturers’ promotional strategies, could offset the expected calorie reduction from this policy. To assess the impact of this, we consider the degree of offsetting required to result in a neutral net present value.
374. Our central estimate for Option C suggests the total benefits of the policy to be £5.2bn. Total costs are valued at £2.5bn in the central scenario. This suggests that around 50% of the direct benefits of the policy would need to be offset for the policy to not be deemed socially beneficial.
F(ii) Sensitivity and risk analysis 375. It should be recognised that the estimates included in this Impact Assessment are subject to a
large degree of uncertainty and can only provide illustrative estimates of the costs and benefits based on plausible assumptions.
376. The specific judgements made to decide each parameter can have a substantial impact on the final estimates. Therefore, we have selected a number of variables for sensitivity analysis based on the degree of uncertainty, and the extent to which they determine the direction and magnitude of the policy’s net present value. These are separated into the assumptions driving costs and health benefits separately.
377. These variables are: Costs
○ The total value of broadcaster revenue at risk as a result of a watershed:
i. Low scenario: assuming advertisers take all possible steps188 to keep advertising spend in the system and there is 30% backfill from advertisers in non-affected industries. All options exclude channels with <1% of child audience (de minimis).
ii. Mid scenario: assuming half of advertising spend is kept in the system with advertisers partly taking steps to mitigate impacts, and there is 20% backfill from advertisers in non-affected industries. All options exclude channels with <1% of child audience (de minimis).
iii. High scenario: assuming no advertisers take steps to keep advertising spend in the system, and there is 10% backfill from advertisers in non-affected industries. All options exclude channels with <1% of child audience (de minimis).
○ The total value of online platform revenue at risk as a result of a watershed:
i. Low scenario: assuming advertisers take all possible steps to keep advertising spend in the system and there is 30% backfill from advertisers in non-affected industries.
ii. Mid scenario: assuming half of advertising spend is kept in the system with advertisers partly taking steps to mitigate impacts, and there is 20% backfill from advertisers in non-affected industries
iii. High scenario: assuming no advertisers take steps to keep advertising spend in the system, and there is 10% backfill from advertisers in non-affected industries.
○ The total value of manufacturer and retailer profits at risk
188 Possible steps include reformulating products to pass restrictions, substituting non-restricted products into adverts, advertising the overarching brand if that brand is not overly connected to high fat, salt, sugar, and where advertisers have significant spend post-watershed, simply moving spend from pre- to post- watershed (for more detail see methodology document).
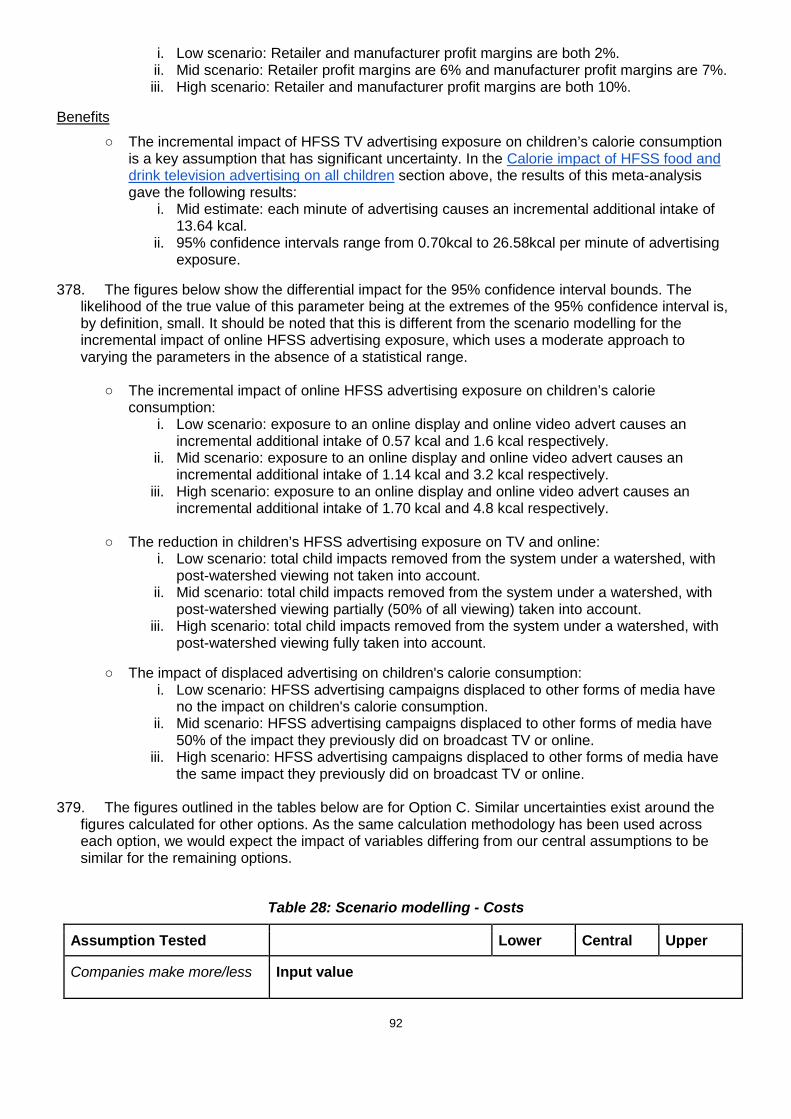
92
i. Low scenario: Retailer and manufacturer profit margins are both 2%. ii. Mid scenario: Retailer profit margins are 6% and manufacturer profit margins are 7%. iii. High scenario: Retailer and manufacturer profit margins are both 10%.
Benefits ○ The incremental impact of HFSS TV advertising exposure on children’s calorie consumption
is a key assumption that has significant uncertainty. In the Calorie impact of HFSS food and drink television advertising on all children section above, the results of this meta-analysis gave the following results:
i. Mid estimate: each minute of advertising causes an incremental additional intake of 13.64 kcal.
ii. 95% confidence intervals range from 0.70kcal to 26.58kcal per minute of advertising exposure.
378. The figures below show the differential impact for the 95% confidence interval bounds. The likelihood of the true value of this parameter being at the extremes of the 95% confidence interval is, by definition, small. It should be noted that this is different from the scenario modelling for the incremental impact of online HFSS advertising exposure, which uses a moderate approach to varying the parameters in the absence of a statistical range.
○ The incremental impact of online HFSS advertising exposure on children’s calorie consumption:
i. Low scenario: exposure to an online display and online video advert causes an incremental additional intake of 0.57 kcal and 1.6 kcal respectively.
ii. Mid scenario: exposure to an online display and online video advert causes an incremental additional intake of 1.14 kcal and 3.2 kcal respectively.
iii. High scenario: exposure to an online display and online video advert causes an incremental additional intake of 1.70 kcal and 4.8 kcal respectively.
○ The reduction in children’s HFSS advertising exposure on TV and online: i. Low scenario: total child impacts removed from the system under a watershed, with
post-watershed viewing not taken into account. ii. Mid scenario: total child impacts removed from the system under a watershed, with
post-watershed viewing partially (50% of all viewing) taken into account. iii. High scenario: total child impacts removed from the system under a watershed, with
post-watershed viewing fully taken into account.
○ The impact of displaced advertising on children's calorie consumption: i. Low scenario: HFSS advertising campaigns displaced to other forms of media have
no the impact on children's calorie consumption. ii. Mid scenario: HFSS advertising campaigns displaced to other forms of media have
50% of the impact they previously did on broadcast TV or online. iii. High scenario: HFSS advertising campaigns displaced to other forms of media have
the same impact they previously did on broadcast TV or online.
379. The figures outlined in the tables below are for Option C. Similar uncertainties exist around the figures calculated for other options. As the same calculation methodology has been used across each option, we would expect the impact of variables differing from our central assumptions to be similar for the remaining options.
Table 28: Scenario modelling - Costs
Assumption Tested Lower Central Upper
Companies make more/less Input value

93
effective investment decisions to advertise during restrictions.
Broadcaster revenue at risk £75.4m £111.6m £154.1m
Reduction in calories have more/less impact on manufacturer and retailer profits.
Input values
Manufacturer’s profit margin 2% 7% 10%
Retailer’s profit margin 2% 6% 10%
Output Value
Total retailer and manufacturer lost profits
£11m £35m £50m
Size of online HFSS advertising market affected by a watershed restriction.
Input values
Online platform revenue at risk £15.8m £22.8m £28.5m
Table 29: The incremental impact of HFSS TV advertising exposure on children’s calorie
consumption (95% confidence intervals from the Russell et al189. paper) Assumption Tested 95% CI
Lower Bound
Central 95% CI Upper Bound
The incremental impact of HFSS TV advertising exposure on children’s calorie consumption
Input value
kcal/min of HFSS advertising 0.70 13.64 26.58
Output value190
Total health benefits from reduced exposure on broadcast TV (£)
0.1bn 2.4bn 4.7bn
Table 30: Scenario modelling - Benefits
Assumption Tested Lower Central Upper
Input value
189 Russell, Simon J., Helen Croker, and Russell M. Viner. "The effect of screen advertising on children's dietary intake: A systematic review and meta‐analysis." Obesity Reviews(2018). 190 Note that the total benefit figures here are based on the calorie reduction from the broadcast restrictions only.

94
The reduction in children's HFSS advertising exposure on TV and online
Number of fewer impacts in 2017: TV Online
2.2bn
0.49bn
2.5bn
0.57bn
2.8bn
0.61bn
Output value
Total health benefits (£) 2.5bn 2.8bn 3.1bn
The incremental impact of online HFSS advertising exposure on children’s calorie consumption
Input value
Kcal/impression: Online Display Online Video
0.6 1.6
1.1 3.3
1.7 4.9
Output value191
Total health benefits from reduced exposure online (£)
0.2bn 0.4bn 0.6bn
The impact of displaced advertising on children's calorie consumption
Input value
Impact of displaced advertising compared to broadcast TV and online
0% 50% 100%
Output value
Total health benefits (£) 3.6bn 2.8bn 2.0bn
F(iii) Equivalent Annual Net Direct Cost to Business 380. Only direct impacts on business should be counted in the Equivalent Annual Net Direct Cost to
Business calculations. Lost profits to advertisers, broadcasters and retailers and manufacturers due to reduced consumption of HFSS products are considered a direct impact on business. For broadcasters, the direct impact is considered to be the net change in sales revenue once broadcasters have adjusted advertising schedules. Although there is a change in the source of sales, from HFSS items to healthy items, because these sales are retained within the same firm we consider the change to be appropriate.
381. For manufacturers of HFSS food and drink, a “GDP approach” is adopted to assess the direct impact on UK-based activities. This requires an assessment of the proportion of the gross value added by an activity that is undertaken by businesses based in the UK. For manufacturers, we assume that 49% value added is UK based, with this being the proportion of food that was supplied domestically in 2016.192
382. We present estimates of the total Equivalent Annual Net Direct Cost to Business (EANDCB) for all
options (see table below). Work will continue during the consultation to refine and extend the scope of this estimate.
Table 30: Direct impact on business (Equivalent Annual) £m 191 Note that the total benefit figures here are based on the calorie reduction from the online restrictions only. 192 Department for Environment, Food & Rural Affairs (2016) Food Statistics Pocketbook 2016: https://www.gov.uk/government/statistics/food-statistics-pocketbook-2016 (accessed 23/10/2018)
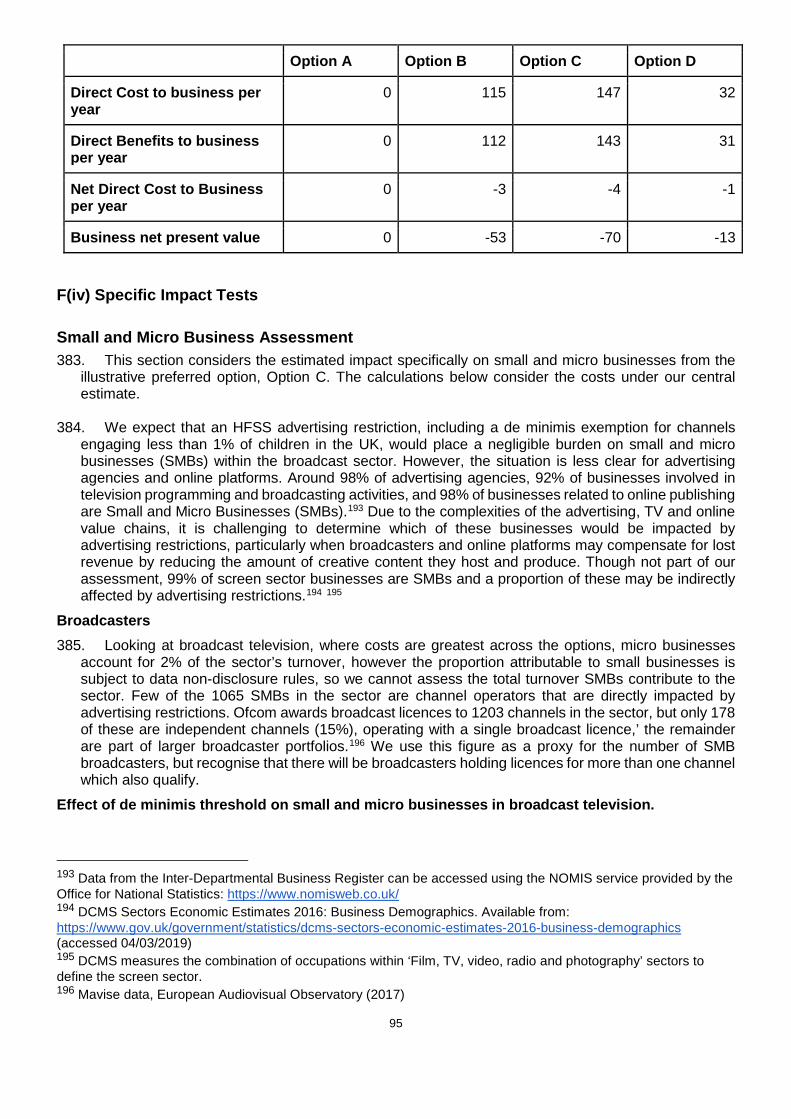
95
Option A Option B Option C Option D
Direct Cost to business per year
0 115 147 32
Direct Benefits to business per year
0 112 143 31
Net Direct Cost to Business per year
0 -3 -4 -1
Business net present value 0 -53 -70 -13
F(iv) Specific Impact Tests
Small and Micro Business Assessment 383. This section considers the estimated impact specifically on small and micro businesses from the
illustrative preferred option, Option C. The calculations below consider the costs under our central estimate.
384. We expect that an HFSS advertising restriction, including a de minimis exemption for channels engaging less than 1% of children in the UK, would place a negligible burden on small and micro businesses (SMBs) within the broadcast sector. However, the situation is less clear for advertising agencies and online platforms. Around 98% of advertising agencies, 92% of businesses involved in television programming and broadcasting activities, and 98% of businesses related to online publishing are Small and Micro Businesses (SMBs).193 Due to the complexities of the advertising, TV and online value chains, it is challenging to determine which of these businesses would be impacted by advertising restrictions, particularly when broadcasters and online platforms may compensate for lost revenue by reducing the amount of creative content they host and produce. Though not part of our assessment, 99% of screen sector businesses are SMBs and a proportion of these may be indirectly affected by advertising restrictions.194 195
Broadcasters 385. Looking at broadcast television, where costs are greatest across the options, micro businesses
account for 2% of the sector’s turnover, however the proportion attributable to small businesses is subject to data non-disclosure rules, so we cannot assess the total turnover SMBs contribute to the sector. Few of the 1065 SMBs in the sector are channel operators that are directly impacted by advertising restrictions. Ofcom awards broadcast licences to 1203 channels in the sector, but only 178 of these are independent channels (15%), operating with a single broadcast licence,’ the remainder are part of larger broadcaster portfolios.196 We use this figure as a proxy for the number of SMB broadcasters, but recognise that there will be broadcasters holding licences for more than one channel which also qualify.
Effect of de minimis threshold on small and micro businesses in broadcast television.
193 Data from the Inter-Departmental Business Register can be accessed using the NOMIS service provided by the Office for National Statistics: https://www.nomisweb.co.uk/ 194 DCMS Sectors Economic Estimates 2016: Business Demographics. Available from: https://www.gov.uk/government/statistics/dcms-sectors-economic-estimates-2016-business-demographics (accessed 04/03/2019) 195 DCMS measures the combination of occupations within ‘Film, TV, video, radio and photography’ sectors to define the screen sector. 196 Mavise data, European Audiovisual Observatory (2017)
96
386. The de minimis exemption proposed for broadcast would bring into scope any channel or programme (though we have only modelled a channel exemption in this IA) that reaches less than 1% of the UK child audience. According to BARB data on audience reach, a de minimis would exempt an estimated 220 channels, 73% of those they measured. This does not include non-BARB registered channels, which have low viewership and cannot justify the investment in BARB monitoring. Aligning this with Kantar’s analysis of channels that carry HFSS advertising, this would mean retaining 9% of children’s HFSS advertising exposure and spend.
387. It is highly likely that the de minimis exemption would cover the 15% of broadcast channels that are representative of SMBs, as well as channels where few children are watching, due to content of low child appeal.
388. Considering the Kantar’s analysis showed that the large commercial broadcasters accounted for 90% of HFSS advertising impacts, therefore this de minimis threshold is likely to exempt broadcasters and channels that are operated not only by SMBs but medium-sized businesses in the sector too.
Online Platforms
389. We assess that 98% of the businesses associated with the hosting, placement and dissemination of digital advertising are SMBs.197 However, due to the complexities of the digital advertising supply chain, we have not been able to determine the number of SMBs impacted by online advertising restrictions.
390. Much like broadcast, we have limited evidence of how revenue reductions may impact smaller businesses that serve advertising to these platforms or develop content for them, the latter could be perceived as monetised channels in their own right. Due to the limited information available on where exactly children see HFSS impacts, it is challenging to propose exemption measures that would safeguard SMBs, while minimising children’s HFSS exposure. In principle, a de minimis exemption online could be based on child audience reach, and by association content/themes with limited appeal to children, but it is unclear how low that could be set, how it could be monitored or enforced. An online de minimis would also be difficult to articulate when a lot of advertising is personalised and delivered by algorithms on different sites and channels, at different times. Given the concentration of digital advertising spend generally, an effective way of achieving the policy outcome, could be to exempt any SMB from the restriction, unless they were already in breach of current CAP food advertising restrictions with a 25% child audience.
Advertising Agencies 391. We have limited evidence on how many of the agencies, with billings for HFSS products and
brands, could be characterised as micro or small businesses. A Nielsen review of the advertising agencies by billings, indicates that the majority of HFSS brands are represented by the largest agencies.198 However, we do not have details of the size of intermediaries and buying agents involved.
Table 32: Businesses involved in broadcast television and online advertising of food and drink in
the UK199
197 DCMS Sectors Economic Estimates: Business Demographics 2017. Available from: https://www.gov.uk/government/statistics/dcms-sectors-economic-estimates-2017-business-demographics (accessed 04/03/2019) 198 Campaign School Report 2017 - https://www.campaignlive.co.uk/article/top-100-agencies/1427521 (accessed November 2018) 199 Data from the Inter-Departmental Business Register can be accessed using the NOMIS service provided by the Office for National Statistics: https://www.nomisweb.co.uk/ =

97
Enterprises by no. of employees
SIC Code and description Micro (0 to 9)
Small (10 to
49)
Medium (50 to 249)
Large (250+) Total
6020: Television programming and broadcasting activities
1,015 55 25 10 1,105
7311: Advertising agencies
14,760 1,290 270 55 16,375
6311: Data processing; hosting and related activities
2,730 305 75 20 3,130
6312: Web portals
1,165 105 20 5 1,295
6391: News agency activities
525 25 5 5 560
6399: Other information service activities n.e.c
3,075 130 10 5 3,220
Totals 23,270 1,910 405 100 25,685
Table 33: Turnover in broadcast television, advertising and online publishing sectors
Turnover in £m Micro (<10)
Small (10-49)
Medium (50-249)
Large (250+)
Total
Television programming and broadcasting activities 321 * * * 14,168
% of total 2% * * *
Advertising and market research 3,585 5,142 7,010 11,469 27,205
% of total 13% 19% 26% 42%
Data processing; hosting and related activities; web
portals
506 937 1,202 7,556 10,200
% of total 5% 9% 12% 74%
Other information service activities 419 464 * 2,730 3,974
% of total 11% 12% 8% 69%
Manufacturers and Retailers
392. Symbols and Independents’ and ‘other outlets’ have been identified as accounting for 3.4%200 of GB grocery sales. Not all this market share will be accounted for by small businesses, with certain large retailers falling under these categories. However, considering impacts on these two categories
200 GB Grocery Market Shares, Kantar Worldpanel. https://www.kantarworldpanel.com/en/grocery-market-share/great-britain (accessed 17/12/2018)

98
can give an estimate of the potential impact on small retailer profits. In contrast, ONS retail sales data201 find that 9.2% of sales in non-specialised food stores in 2016 occurred in ‘small businesses’. We therefore consider the impact on profits under both market shares.
393. Assuming the loss in retailer profits from this restriction falls proportionately on the 3.4/9.2% section of the market identified above suggests that small retailers would on average experience reduced profits of between £0.03m and £0.07m per year.
394. The Inter-Departmental Business Register (IDBR) contains detailed information on the number of different businesses, described as enterprises in the data, in the food and drink manufacturing sector in the UK. It also provides breakdowns by the number of employees and turnover information. Table 34 below presents the number of enterprises for the SIC codes thought most likely to fall in scope of the policy.
Table 34: Firms involved in the food and drink manufacturing sector in the UK202
Enterprises by no of employees
SIC Code and description Micro (0 to 9)
Small (10 to 49)
Medium (50 to 249)
Large (250+) Total
101 : Processing and preserving of meat and production of meat products
550 275 110 50 990
102 : Processing and preserving of fish, crustaceans and molluscs
165 90 40 10 305
103 : Processing and preserving of fruit and vegetables
450 90 50 25 610
104 : Manufacture of vegetable and animal oils and fats
50 10 10 0 65
105 : Manufacture of dairy products
485 150 50 15 695
106 : Manufacture of grain mill products, starches and starch products
95 25 25 10 155
107 : Manufacture of bakery and farinaceous products
1,875 745 165 55 2,840
108 : Manufacture of other food products
1,320 360 155 60 1,895
110 : Manufacture of beverages
1,935 245 70 20 2,265
Totals 6,925 1,990 675 245 9,820
395. As can be seen in the table above, around 90% of food and drink manufacturers would be
considered either small or micro businesses based on their number of employees. However, in terms of sales, small and micro businesses only comprise about 7% of turnover across the sector. In contrast, large manufacturers comprise around 75% of turnover across the sector.
Table 35: Turnover in the food & beverage manufacturing sector in the UK by business size203
201 Retail Sales Index, ONS. Available from: https://www.ons.gov.uk/businessindustryandtrade/retailindustry/datasets/retailsalesindexreferencetables (accessed 11/12/2018) 202 Data from the Inter-Departmental Business Register can be accessed using the NOMIS service provided by the Office for National Statistics: https://www.nomisweb.co.uk/ 203 Business population estimates 2017, BEIS. Available from: https://www.gov.uk/government/statistics/business-population-estimates-2017 (accessed 09/11/2018)

99
Turnover in £m Micro (<10)
Small (10-49)
Medium (50-249)
Large (250+)
Total
Food manufacturers 1,918 4,558 15,011 59,363 80,850
Beverage manufacturers 402 723 2,461 14,010 17,596
% of Food and beverage manufacturing sector turnover
2% 5% 18% 75% 100%
396. Food and drink manufacturing SMBs are unlikely to advertise on television or online, but many
may be suppliers to larger companies that do. We would expect only large food and drink manufacturers to typically advertise their products on broadcast television, with the significant costs involved in this form of advertising being prohibitive for small, medium and micro businesses. The exception to this may be smaller and regional channels, which can feature less prominent brands. The inclusion of a de minimis threshold would likely allow SMB HFSS businesses to continue advertising through these channels.
397. Assuming the loss in manufacturer profits from this restriction falls proportionately on the 7% section of the market identified above suggests that small food and drink manufacturers would experience on average reduced profits of around £0.02m per year.
Table 36: SMB Mitigations
SMB Mitigation Consideration
Full exemption Considered, but because the policy targets where advertising is shown, therefore, the only SMBs that would we could guarantee exemption from restrictions would be SMBs that sell advertising space on broadcast and online; not SMB intermediaries in the supply chain that sell advertising to large broadcasters.
Partial exemption The 1% child reach de minimis is a form of partial-exemption. We have assessed that this covers a wide range of SMBs, while preserving the policy outcome of reducing children’s HFSS advertising exposure.
Extended transition period
As with other SMB exemptions, they would only help support channels and websites that host advertising, which are already covered by a 1% child de minimis threshold.
Temporary exemption Not applicable, as a long-standing partial exemption is already proposed.
Different requirements by firm size
The 1% child de minimis threshold is a way of treating businesses differently that is intrinsically linked to firm size. However, the exemption is also designed to support firms that have minimal impact on children’s exposure to HFSS advertising.
Information Depending on the option chosen, there is a case to provide guidance on any exemptions to policy restrictions, which would need to reach SMBs. This would likely be delivered through existing regulatory bodies.
Financial aid Not considered. As options are already targeted to minimise impact on SMBs.

100
Opt-in and voluntary solutions
SMBs could be given the option opt-in to HFSS advertising restrictions, should it suit their company ethos and simplify their planning. However, we have not proposed this as a part of our options.
Table 37: Summary costs to small and micro businesses £m
Group affected Micros SMBs All businesses
% Micros % SMBs
Television programming and broadcasting activities 1
0 0 1911 0% 0%
Advertising and market research
5 12 35 13% 33%
Data processing; hosting and related activities; web portals
19 53 382 5% 14%
Other information service activities
16 18 149 11% 12%
Retailers 1 to 2 25 27% 47%
Food and drink manufacturers
0 1 10 2% 7%
Total 40 86 2,513
1 Assumes de minimis threshold is applied to broadcast
Equality Test 398. A separate Equality Analysis has been conducted to assess the potential impact of the policy on
groups with protected characteristics as part of the Government’s duties under the Equality Act 2010.204 Since this was published we have identified three potential issues of this policy relating to the Public Sector Equality Duty.
○ The first is to small minority ethnic channels and a concern that they may be negatively affected by loss of advertising revenue, which may impact on the equality of opportunity in relation to race.
○ The second is to Public Service Broadcasters where there is a concern is that further restrictions on the PSBs may impact on their ability to meet cultural obligations on
204 Childhood obesity plan for action chapter 2: equality assessment. Available from: https://www.gov.uk/government/publications/childhood-obesity-plan-for-action-chapter-2-equality-assessment (accessed 30/01/2019)

101
programming, which may in turn negatively impact on fostering good relations and promoting understanding between groups of people of different race within the UK.
○ The third is in relation to people living with Phenylketonuria (PKU). Exposure to aspartame may negatively impact on people living with this genetic condition, which may negatively impact on disability as a protected characteristic.
The equality analysis will be kept under review. We invite views on steps government can take to mitigate the impact of the policy on these issues and to identify any further potential issues that should be taken into account.
Inequalities Test 399. Included in Childhood Obesity, a plan for action: Chapter 2, is a commitment to significantly reduce
the gap in obesity between children from the most and least deprived areas. The best data source for inequalities in childhood obesity is the National Child Measurement Programme, which measures children’s weight and height in Reception and Year 6. The latest data shows us that obesity rates are significantly higher in more deprived areas of the UK at Reception and Year 6. Furthermore, the obesity rate inequality gap grows as children move from Reception to Year 6 and these gaps in prevalence have significantly increased over the last 10 years.
Figure 19: Childhood obesity prevalence by deprivation205
400. The impact of restricting HFSS advertising on inequalities will depend on how exposure and the
impact of advertising varies by deprivation. If those in lower socioeconomic groups have higher levels of HFSS advertising exposure or their consumption is more influenced by advertising, we may expect the benefits of this policy to accrue disproportionately to those who are most deprived. This would reduce the inequalities gap.
401. Evidence from Ofcom’s ‘Children and Parents: Media Use and Attitudes Report’ suggests that
children from low socio-economic groups are less likely than average to be aware of sponsored links on digital advertising.206 Furthermore, there is some evidence to suggest that less affluent viewers are
205 National Child Measurement Programme - England, 2015-16, NHS Digital. 206 Ofcom (2017): Children and Parents: Media Use and Attitudes Report (p161)

102
exposed to more HFSS food advertising on TV compared to the most affluent viewers.207 This is supported by evidence from Ofcom which suggests that children in less affluent households (NRS social grade DE) spend more time watching TV on a TV set and more time online than those in more affluent households (social grade AB)208.
402. Research conducted by Cancer Research UK found that individuals from deprived communities have a higher recall of unhealthy food advertising, with those recalling watching television adverts every day found to be 40% more likely to be from the most deprived group compared to the least deprived.209 This suggests that individuals in more deprived communities may be more affected by unhealthy food advertising on TV. This is in addition to children from low income households being twice as likely to be obese than those from high income households.
403. As part of the commitment to reduce the gap in obesity between children from the most and least
deprived areas by 2030, the post-implementation review will gather evidence of impact and will consider evidence of any differential impact by deprivation.
Competition Test 404. Does the proposal:
○ Directly limit the number or range of suppliers? i. The proposal places no direct limit on the number of businesses that can operate in the
market. ○ Indirectly limit the number or range of suppliers?
i. The costs to individual businesses may vary, for example depending on their current levels of HFSS advertising which would be affected by the options. These costs are unlikely to be prohibitively high for individual businesses.
○ Limit the ability of suppliers to compete? i. HFSS advertising restrictions may impact the opportunities for new companies or
products to enter the HFSS market. Existing products which have built up awareness in the market may have their positions solidified due to the higher barrier for entry for new products.
ii. The proposed options safeguard channels with low overall child audiences by volume (a child audience advertising restriction already exists). This means that broadcasters with audiences spread over a wide portfolio of channels, may be given market advantage over broadcasters whose audience is concentrated on fewer channels or have programming that attract a large audience.
iii. The proposed options would likely incur high costs to broadcasters and online platforms, while allowing other less-restricted forms of advertising (e.g. print, radio) to continue marketing HFSS products, giving them a competitive advantage.
iv. There is a modest impact to food/drink manufacturer and retailer profits, but there would be a disproportionate impact on suppliers whose revenue is derived from HFSS products, providing a competitive advantage to those selling non-HFSS products.
○ Reduce suppliers’ incentives to compete vigorously? i. The proposal does not exempt suppliers from general competition law, introduce or
amend intellectual property regime or increase the costs to customers of switching between suppliers.
207 Adams J, Tyrrell R, Adamson AJ, White M. Socio-economic differences in exposure to television food advertisements in the UK: a cross-sectional study of advertisements broadcast in one television region. Public health nutrition. 2012 Mar;15(3):487-94. 208 Ofcom (2017): Children and Parents: Media Use and Attitudes Report (p31) 209 Thomas, F. Hooper, L. Petty, R. Thomas, C. Rosenberg, G. Vohra, J. (2018) “A Prime Time for Action: New evidence on the link between television and on-demand marketing and obesity” Policy Centre for Cancer Prevention, Cancer Research UK

103
Sustainability Test
405. There is no evidence to suggest that a restriction on HFSS advertising will have an impact on the sustainability of the market.
Environmental Test 406. There is no evidence to suggest that a restriction on HFSS advertising will have a significant impact
on the environment.
Human Rights Assessment 407. Options B-D raise potential issues in relation to freedom of expression (Article 10 European
Convention on Human Rights) and peaceful enjoyment of possessions (Article 1 Protocol 1 to the Convention). We will need to ensure that any ultimate policy proposals that we adopt following this consultation are compatible with the Human Rights Act. We welcome submissions as to how to address this.
Rural Proofing 408. There is no evidence to suggest that a restriction on HFSS advertising will have a significant impact
on those living in rural areas.
Justice Impact Test 409. If relevant, a full justice impact test for this proposal will be carried out after the consultation has
been completed and the policy details have been finalised.

104
Annexes Annex A – Further Evidence and International Evidence
1. In addition to the main body of evidence discussed in the impact assessment, there is also further evidence, including international evidence. This is intended to be read alongside the main impact assessment, where it specifically refers to this Annex.
2. Whilst the international evidence is of less direct relevance than UK specific evidence, we have assumed many of the advertising techniques and social norms are shared across the Western and developed world. Whilst it should be considered how relevant international evidence is on a case-by-case basis, it provides context to the evidence discussed in the impact assessment.
3. The evidence discussed here is generally in concurrence with the main body of evidence and has been annexed to provide clarity when reading the impact assessment.
Online Advertising Exposure
Additional contextual online exposure evidence 4. Most Internet locations visited by children are not child-specific.210 Younger children (9-11)
in Europe go on the Internet mainly to view videos, on platforms such as YouTube. Older children (13-16 year olds) primarily use the Internet for social media.211
5. Children engage with and enjoy digital marketing, although evidence is limited. In the UK, 73% of 1000 13-17 year olds reported following brands they like on social media, 62% click on ads and 57% make in-app or in-game purchases.212 Nielsen data suggests over half of adolescents in the US “always” or “sometimes” look at mobile ads.213
6. There is some international evidence of high exposure among children to HFSS advertising
online. The rules in place concerning online advertising vary by country, with restrictions in the UK put in place by the Committee of Advertising Practice in 2017. Nonetheless:
● An Australian study found 23% of children had been exposed to food and drink brands on YouTube, with 97.9% of those being able to name one specific brand. The brands most likely to be mentioned, in order of popularity, were Coke, McDonald’s and Red Bull. This same study found 47.5% of children “liked” a food or drink company on Facebook.
● A US study found young people to be inundated with shared posts and sponsored messages. Two hypothetical child profiles who had “liked” HFSS brands on Facebook received approximately 130 HFSS brand messages over 2 weeks.214
210 Tatlow-Golden, M, Boyland, EJ, Jewell, J, Zalnieriute, M, Handsley, E, Breda, J and Galea, G (2016) Tackling food marketing to children in a digital world: trans-disciplinary perspectives. 211 Sozio ME, Ponte C, Sampaio IV, Senne F, Ólafsson K, Alves SJ, et al. (2015). Children and Internet use: a comparative analysis of Brazil and seven European countries. London: London School of Economics, EU Kids Online; 2015 (http://www.lse.ac.uk/media@lse/research/EUKidsOnline/ParticipatingCountries/PDFs/BR-FullReportBrazilNCGM.pdf). 212 The age of digital enlightenment. Realtime generation report 2016. Slough, Berkshire: Logicalis; 2016 (http://www.uk.logicalis.com/globalassets/united-kingdom/microsites/real-time-generation/realtime-generation-2016-report.pdf). 213 Gibs J, Bruich S. Advertising effectiveness: understanding the value of a social media impression. A Nielsen/Facebook report. New York, NY; 2010 (http://www.nielsen.com/us/en/insights/news/2010/nielsenfacebook-ad-report.html). 214 Harris JL, Heard A, Kunkel D. Marketing unhealthy foods to children on Facebook. Social policy and public health concerns. In: Dimofte CV, Haugtvedt CP, Yalch RF, editors. Consumer psychology in a social media world. New York, NY: Routledge; 2016:239–53.
105
● A Canadian study investigating children’s exposure to food marketing on social media apps found that children were exposed to unhealthy food and drink marketing on these platforms even when logged into their personal accounts.215
● In New Zealand, for 20 “liked” food brands on Facebook, researchers documented 78 promotions per week, averaged over 6 weeks.216
7. The foods being advertised online to children in these examples are typically unhealthy. ● A study in the USA looked at websites popular with children found that 60-84% of advertised
products were HFSS foods or met the Institute of Medicine criteria for “foods to avoid”.217 218
● 90% of 281 foods marketed to children online were identified to be unhealthy by the WHO Regional Office for Europe’s nutrient profile model.219 The study noted this is only indicative, because children are unlikely to frequent brand’s websites.
Impact of Advertising on Children’s Preferences
Advertising and long-term food preferences 8. The key findings of the WHO systematic review that concluded on balance, the evidence indicates
that food promotion has a modest impact on food preferences are outlined below.
9. Descriptive studies demonstrate children have extensive recall of food advertising.220 Hitchings & Moynihan found 9-10 year old English children could recall adverts in the past two weeks in seven different food product categories.221 Batada et al. found half of children could accurately match from memory, without prompting, at least half of logos/characters from TV breakfast cereal advertisements.222 Chamberlain, Wang & Robinson found that there was an association between children’s screen media time and requests for advertised foods 7-20 months later after adjusting for socio-demographic factors.223
215 Potvin Kent M, Pauzé E, Roy EA, de Billy N, Czoli C. Children and adolescents' exposure to food and beverage marketing in social media apps. Pediatric obesity. 2019 Jan 28:e12508. 216 Tatlow-Golden, M, Boyland, EJ, Jewell, J, Zalnieriute, M, Handsley, E, Breda, J and Galea, G (2016) Tackling food marketing to children in a digital world: trans-disciplinary perspectives. 217 Lingas EO, Dorfman L, Bukofzer E. Nutrition content of food and beverage products on websites popular with children. Am J Public Health 2009;9:5. 218 Ustjanauskas, AE, Harris, JL, Schwartz, MB. Food and beverage advertising on children’s web sites. PedObes 2014;9:362–72. 219 Nutrient profile model. Copenhagen: WHO Regional Office for Europe; 2015 (http://www.euro.who.int/__data/assets/pdf_file/0005/270716/Nutrient-Profile-Model_Version-forWeb.pdf?ua=1, accessed 19 October 2015) 220 Cairns G, Angus K, Hastings G. The extent, nature and effects of food promotion to children: a review of the evidence to December 2008. World Health Organization, WHO Press; 2009. 221 Hitchings E, Moynihan PJ (1998). The relationship between television food advertisements recalled and actual foods consumed by children. Journal of Human Nutrition and Dietetics, 11(6):511–517. 222 Batada A, Borzekowski D (2008). Snap! Crackle! What? Recognition of cereal advertisements and understanding of commercials' persuasive intent among urban, minority children in the US. Journal of Children and Media, 2(1):19-36. 223 Chamberlain LJ, Wang Y, Robinson TN (2006). Does children's screen time predict requests for advertised products? Cross-sectional and prospective analyses. Archives of Pediatrics & Adolescent Medicine, 160(4):363-368.

106
10. Television advertising increases children’s liking for advertised products.224 Dixon et al225 and Marshall, O’Donohoe & Kline226 found TV advertisements increases the liking and acceptability of advertised products.
11. Self-reporting suggests advertising affects children’s decisions.227 Carruth, Goldberg &
Skinner found 8% of North American students reported seeing a food advert made them want to get something to eat ‘every day’, 66% less frequently and 27% ‘never’. Marshall, O’Donohoe & Kline228 found children reported watching food adverts made them ‘feel hungry’ and increases purchase desire. Maryam et al.229 found over 90% of Iranian students reported they selected foods “under the influence of advertised products”. Olivares et al.230 found that half of 6-8 year olds and two thirds of 9-11 year olds had consumed food and drink that had been advertised in the previous day. Olivares, Yanez and Diaz231 later found that 40% of children interviewed had consumed advertised products.
12. Conclusions from interviews and self-reporting must be used cautiously, especially with
young children, as the results can vary significantly depending on the collection design. Establishing a causal link between food promotion and children’s food preferences
13. The WHO systematic review232 found modest strength evidence that food promotion influences food preferences and consumption behaviour. They reviewed the more complex studies in their systematic review to infer causality and demonstrate association between food promotion and children’s attitudes, behaviours and health status.
14. After reviewing 29 experimental studies, 1 quasi-experimental study, 13 cross-sectional studies
and 3 observational studies deemed to be sufficiently complex to infer causality using Bradford-Hill’s principles.233 The results are mixed with some finding statistically insignificant or unclear associations. However on balance they concluded that there is modest strength evidence that food promotion influences preferences and consumption behaviour.
The impact of food advertising compared to other factors
13. This is not covered in the main body of the impact assessment and serves as additional context. The evidence is derived from the WHO systematic review already discussed.
224 Cairns G, Angus K, Hastings G. The extent, nature and effects of food promotion to children: a review of the evidence to December 2008. World Health Organization, WHO Press; 2009. 225 Dixon HG et al. (2007). The effects of television advertisements for junk food versus nutritious food on children's food attitudes and preferences. Social Science & Medicine, 65(7):1311-1323. 226 Marshall D, O'Donohoe S, Kline S (2007). Families, food, and pester power: beyond the blame game? Journal of Consumer Behaviour, 6(4):164-181 227 Cairns G, Angus K, Hastings G. The extent, nature and effects of food promotion to children: a review of the evidence to December 2008. World Health Organization, WHO Press; 2009. 228 Marshall D, O'Donohoe S, Kline S (2007). Families, food, and pester power: beyond the blame game? Journal of Consumer Behaviour, 6(4):164-181 229 Maryam A et al. (2005). Food advertising on Iranian children’s television: A content analysis and an experimental study with junior high school students. Ecology of Food and Nutrition, 44(2):123–133. 230 Olivares SC et al. (1999). Publicidad televisiva y preferencias alimentarias en escolares de la Región Metropolitana (Television publicity and food preferences of school age children of the Metropolitan Region). Revista médica de Chile, 127:791-799. 231 Olivares S, Yáñez R, Díaz N (2003). Publicidad de alimentos y conductas alimentarias en escolares de 5° a 8° básico (Food advertising and food behavior in school age children from 5th to 8th grade). Revista chilena de nutrición, 30(1):36–42. 232 Cairns G, Angus K, Hastings G. The extent, nature and effects of food promotion to children: a review of the evidence to December 2008. World Health Organization, WHO Press; 2009. 233 Bradford-Hill A (1965). The environment and disease: association or causation? Proceedings of the Royal Society of Medicine, 58:295–300.
107
14. The WHO systematic review also looked at 8 cross-sectional studies investigated the magnitude of food promotion or television viewing compared with other potential influencing factors on children’s dietary status.
15. This evidence consistently indicated that advertising and food promotion were significant influencers of children’s food behaviours.234 They were found to be of similar or greater magnitude to the other effects investigated, although many of the studies reviewed did not provide sufficient data to quantitatively assess the relative influences.
16. Parental supervision and control of children’s exposure to food advertising was not found to have a statistically significant impact on diet. Friendship and weight status were also found to have no correlation.
17. Parental dietary behaviours, parental food provision, taste and peer behaviour were all found to
have statistically significant effects on children’s food behaviours.
Impact of online HFSS food advertising to children 18. The direct return for online advertising for Coca-Cola and Cadbury was reported to be four times
greater than for television campaigns in France and the USA. For example, for a Coca-Cola campaign in France, Facebook accounted for 2% of marketing cost, but 27% of incremental sales.235
The longitudinal impact of children’s unhealthy food advertising on dietary markers as adults
19. DHSC commissioned the NIHR Obesity Policy Research Unit (OPRU) to conduct a rapid literature search to identify research that looked at how food advertising impacts child preferences over time, including as they progressed in to adulthood.
20. Papers were sourced from Medline, Psycinfo, Epistamonikas and DopHER databases between 2008 and 2018. The search returned 696 results, then filtered down to 16 articles, 5 of which
234 Cairns G, Angus K, Hastings G. The extent, nature and effects of food promotion to children: a review of the evidence to December 2008. World Health Organization, WHO Press; 2009. 235 Exploring digital ROI for FMCG brands. New York, NY: Microsoft ; 2013 (http://tinyurl.com/ozekqyv).

108
specifically looked at the longitudinal impacts of food adverts rather than general television exposure.236 237 238 239 240 241 242 243 244 245 246 247 248 249 250 251
21. The results we can draw from this literature search are limited. The primary reasons for this are: television viewing being used as a proxy for advertising exposure, low quality methodology, non-dietary markers as outcomes and not being conducted over a significant time period.
22. Four papers demonstrated a longitudinal relationship between television viewing in period 1 and BMI or another dietary marker in period 2. However, these studies ranged over 2-5 years and focused on television viewing rather than advertising. This means they can’t inform us on the
236 Aires, L., Andersen, L., Mendonca, D. et al (2010). A 3-year longitudinal analysis of changes in fitness, physical activity, fatness and screen time. Acta Paediatrica. 99. 140-144. 237 Andreyeva ,T., Kelly, I.R. and Harris, J.L. (2011). Exposure to food advertising on television: Associations with children's fast food and soft drink consumption and obesity. Economics and Human Biology. 9. 221–233. 238 Barlett, N.D., Gentile, D.A., Barlett, C.P. et al (2012). Sleep as a mediator of screen time effects on US children's health outcomes: A prospective study. Journal of Children and Media. 6. 37-50. 239 Barr-Anderson, D.J., Larson, N.I., Nelson, M.C. et al. (2009). Does television viewing predict dietary intake five years later in high school students and young adults? International Journal of Behavioral Nutrition & Physical Activity. 6. 7. 240 Beales, J. and Kulick, R. (2013). Does advertising on television cause childhood obesity? A longitudinal analysis. Journal of Public Policy & Marketing. 32. 185-194. 241 Busse, P. and Piotrowski, J.T. (2017). Assessing the longitudinal relationship between Peruvian children's TV exposure and unhealthy food consumption. Journal of Children and Media. 11. 180-197. 242 Chou, S.Y., Rashad, I. and Grossman, M. (2008). Fast-Food Restaurant Advertising on Television and Its Influence on Childhood Obesity. The Journal of Law and Economics. 51. 4. 599-618. 243 Falbe, J., Rosner, B., Willett, W.C. et al. (2013). Adiposity and different types of screen time. Pediatrics. 132. 1497-1505. 244 Falbe, J., Willett, W.C., Rosner, B. et al. (2014). Longitudinal relations of television, electronic games, and digital versatile discs with changes in diet in adolescents. American Journal of Clinical Nutrition. 100. 1173-1181. 245 Folkvord, F., Anschutz, D.J. and Buijzen, M. (2016). The association between BMI development among young children and (un)healthy food choices in response to food advertisements: a longitudinal study. International Journal of Behavioral Nutrition & Physical Activity.13. 16. 246 Gebremariam, M.K., Bergh, I.H., Andersen, L.F. et al. (2013). Are screen-based sedentary behaviors longitudinally associated with dietary behaviors and leisure-time physical activity in the transition into adolescence? The International Journal of Behavioral Nutrition and Physical Activity. 10. ID9. 247 Jayawardene, W.P. (2015). Accumulation of obesogenic and health-promoting behaviors in young adulthood: A theory-driven analysis of associations and sequences. Dissertation Abstracts International: Section B: The Sciences and Engineering. 75. 248 Notten, N., Kraaykamp, G. and Tolsma, J. (2013). Parents, television and children's weight status: On lasting effects of parental television socialization in the Netherlands. Journal of Children and Media. 7. 235-252. 249 Olafsdottir, S., Eiben, G., Prell, H. et al. (2014). Young children's screen habits are associated with consumption of sweetened beverages independently of parental norms. International Journal of Public Health. 59. 67-75. 250 Rutherford, L., Brown, J.E., Skouteris, H. et al. (2015). Screen media, parenting practices, and the family environment in Australia: A longitudinal study of young children's media use, lifestyles, and outcomes for healthy weight. Journal of Children and Media. 9. 22-39. 251 Veerman, J.L., Van Beeck, E.F., Barendregt, J.J. et al. (2009). By how much would limiting TV food advertising reduce childhood obesity? European Journal of Public Health. 19. 4. 365-369.

109
specific impacts of advertising over time as television viewing will likely be associated with a complex set of social and behavioural factors affecting BMI unrelated to advertising.252 253 254 255
23. One study looked specifically at the impact of advertising between 1996 and 2000 for 3-11 year olds and 1997 to 1999 for 12-18 year olds found that an additional half hour of fast food advertising per week resulted in a significant increase in the probability of being overweight.256
Table A1: Impact of an additional half hour of fast food advertising per week on overweight status
% point change in the probability of being overweight
% change in the number of overweight children in a fixed
population
Boys 3-11 2.2% 15%
12-18 2.5% 17%
Girls 3-11 1.6% 12%
12-18 0.6% 4%
24. One study showed no relationship between television viewing in period 1 and BMI in period 2 (5
years later). However, there was a relationship between current television viewing and BMI. For the reasons described above this tells us little about advertising specifically, but it may suggest that current exposure is more important than past exposure.257
25. The remaining studies from the NIHR OPRU literature search were discounted for varying reasons; including low quality methodology, non-dietary markers as outcomes and not being conducted over a significant time period.
How children’s food preferences impact their adult food preferences
252 Barr-Anderson, D.J., Larson, N.I., Nelson, M.C. et al. (2009). Does television viewing predict dietary intake five years later in high school students and young adults? International Journal of Behavioral Nutrition & Physical Activity. 6. 7. 253 Falbe, J., Rosner, B., Willett, W.C. et al. (2013). Adiposity and different types of screen time. Pediatrics. 132. 1497-1505. 254 Falbe, J., Willett, W.C., Rosner, B. et al. (2014). Longitudinal relations of television, electronic games, and digital versatile discs with changes in diet in adolescents. American Journal of Clinical Nutrition. 100. 1173-1181. 255 Rutherford, L., Brown, J.E., Skouteris, H. et al. (2015). Screen media, parenting practices, and the family environment in Australia: A longitudinal study of young children's media use, lifestyles, and outcomes for healthy weight. Journal of Children and Media. 9. 22-39. 256 Chou, S.Y., Rashad, I. and Grossman, M. (2008). Fast-Food Restaurant Advertising on Television and Its Influence on Childhood Obesity. The Journal of Law and Economics. 51. 4. 599-618. 257 Beales, J. and Kulick, R. (2013). Does advertising on television cause childhood obesity? A longitudinal analysis. Journal of Public Policy & Marketing. 32. 185-194.
110
26. DHSC also commissioned the NIHR OPRU to undertake a further rapid evidence search for evidence on food preferences tracking over time. The NIHR OPRU search generated 560 results, with 8 papers presented to DHSC after screening.258 259 260 261 262 263 264 265[1][2][3][4][5][6][7][8]
27. Six of these were discounted due to: low reliability methods, such as self-reporting diet from fifty
years ago; or due to not measuring individual dietary patterns, but generic population indicators such as average intake of sugar between childhood and adulthood.
28. One systematic review identified 11 studies and found all studies found positive correlations
between dietary behaviours in childhood and adulthood. The correlations ranged from very weak to reasonably strong (r = 0.009 to r = 0.66).266
29. A study in Canada over 20 years found statistically significant poor-to-fair tracking of dietary patterns in males and females (0.19-0.28).267 The dietary markers used were based on a Western diet and are similar to what we would expect in the UK. The cultural context of dietary behaviours over time may be different in Canada meaning we should use these results with caution.
Impact of Advertising on Calorie Intakes
30. There are multiple studies showing food advertising increases children’s requests for advertised foods.
● Yavas & Abdul-Gader found children asked their parents to buy food they had seen advertised.268 The WHO review on food promotion269 reported a further nine studies that found parents believed their children were influenced by food promotion to request specific foods.
● A US study randomly assigned mothers and children to view a cartoon with or without food advertising. Overall, the study found that children exposed to the food advertising made more requests for the advertised products when shopping.270
258 Craigie, Angela M., et al. "Tracking of obesity-related behaviours from childhood to adulthood: a systematic review." Maturitas 70.3 (2011): 266-284. 259 Haraldsdottir, Alfheidur, et al. "Dietary habits in adolescence and midlife and risk of breast cancer in older women." PloS one 13.5 (2018): e0198017. 260 Bolt-Evensen, Kathrine, et al. "Consumption of sugar-sweetened beverages and artificially sweetened beverages from childhood to adulthood in relation to socioeconomic status–15 years follow-up in Norway." International Journal of Behavioral Nutrition and Physical Activity 15.1 (2018): 8. 261 Movassagh, Elham Z., et al. "Tracking dietary patterns over 20 years from childhood through adolescence into young adulthood: The Saskatchewan Pediatric Bone Mineral Accrual Study." Nutrients 9.9 (2017): 990. 262 McCourt, Hannah J., et al. "Dietary patterns and cardiovascular risk factors in adolescents and young adults: the Northern Ireland Young Hearts Project." British Journal of Nutrition 112.10 (2014): 1685-1698. 263 Winpenny, Eleanor Margaret, et al. "Changes in consumption of added sugars from age 13 to 30 years: a systematic review and meta‐analysis of longitudinal studies." Obesity Reviews 18.11 (2017): 1336-1349. 264 Winpenny EM, Penney TL, Corder K, White M, Sluijs EM. Change in diet in the period from adolescence to early adulthood: a systematic scoping review of longitudinal studies. International Journal of Behavioral Nutrition and Physical Activity. 2017 Dec;14(1):60. 265 “Changes in diet through adolescence and early adulthood: longitudinal trajectories and association with key life transitions” by Winpenny et al., 2018. 266 Craigie, Angela M., et al. "Tracking of obesity-related behaviours from childhood to adulthood: a systematic review." Maturitas 70.3 (2011): 266-284. 267 Movassagh, Elham Z., et al. "Tracking dietary patterns over 20 years from childhood through adolescence into young adulthood: The Saskatchewan Pediatric Bone Mineral Accrual Study." Nutrients 9.9 (2017): 990. 268 Yavas U, Abdul-Gader A (1993). Impact of TV commercials on Saudi children’s purchasing behaviour. Marketing Intelligence and Planning, 11(2):37–43. 269 Cairns G, Angus K, Hastings G. The extent, nature and effects of food promotion to children: a review of the evidence to December 2008. World Health Organization, WHO Press; 2009. 270 Brody GH, Stoneman Z, Lane TS, Sanders AK. Television food commercials aimed at children, family grocery shopping and mother-child interactions. Family Relations. 1981 Jul 1:435-9.

111
31. Research has found that parents are influenced by these food requests and change their purchases as a result.
● A survey of 348 mothers found 33% reported their children requested food products advertised on TV during TV viewing, 40% requested products during shopping trips and 9% reported that refusal would provoke arguments or crying.271 272
● Musaiger et al. found that children request food products they’d seen advertised, and that mothers in lower socioeconomic groups were more responsive to their children’s requests.273
● A review of the literature by McDermott et al. found strong evidence that food promotion does encourage children to pester their parents and that it results in parents buying less healthy products.274 275
● 70% of parents purchased at least one food item requested during a shopping trip and most of the items requested by children were for unhealthy foods.276
● The WHO review on food promotion also reported from the nine studies considered above that most parents accede to their children’s requests at least sometimes.277
● A natural experiment between English-speaking and French-speaking in children in Quebec found that French-speaking children were more likely to watch French-language Quebec TV; which had a ban on advertisements targeting children. This meant despite still having access to American TV, they were less likely to be exposed to advertising for children’s cereals. Regression analysis found that exposure to American television was significantly associated with increased household purchase of the advertising cereals, independent of income and language variables.278 279
32. Children can make some of their own purchasing decisions. Olivares, Yanez & Diaz found that 34% of children ‘always’ had the money to buy whatever food and drink products they wished and 64% said they ‘sometimes’ had the money – although this study was not from the UK.280 281
Calorie impact of food advertising online to all children
271 Cairns G, Angus K, Hastings G. The extent, nature and effects of food promotion to children: a review of the evidence to December 2008. World Health Organization, WHO Press; 2009. 272 Aktas Arnas Y (2006). The effects of television food advertisement on children's food purchasing requests. Pediatrics International, 48(2):138-45. 273 Musaiger AO et al. (1986/4). Children’s response to television food advertising in Bahrain. Hygie, V:30–35. 274 Cairns G, Angus K, Hastings G. The extent, nature and effects of food promotion to children: a review of the evidence to December 2008. World Health Organization, WHO Press; 2009. 275 McDermott L, O’Sullivan T, Stead M, Hastings G. International food advertising, pester power and its effects. International Journal of Advertising. 2006 Jan 1;25(4):513-39. 276 Campbell S, James EL, Stacey FG, Bowman J, Chapman K, Kelly B. A mixed-method examination of food marketing directed towards children in Australian supermarkets. Health Promotion International. 2012 Nov 15;29(2):267-77. 277 Cairns G, Angus K, Hastings G. The extent, nature and effects of food promotion to children: a review of the evidence to December 2008. World Health Organization, WHO Press; 2009. 278 Goldberg ME (1990). A quasi-experimental assessing the effectiveness of TV advertising directed to children. Journal of Marketing Research, 27(4):445–454. 279 Cairns G, Angus K, Hastings G. The extent, nature and effects of food promotion to children: a review of the evidence to December 2008. World Health Organization, WHO Press; 2009. 280 Cairns G, Angus K, Hastings G. The extent, nature and effects of food promotion to children: a review of the evidence to December 2008. World Health Organization, WHO Press; 2009. 281 Olivares S, Yáñez R, Díaz N (2003). Publicidad de alimentos y conductas alimentarias en escolares de 5° a 8° básico (Food advertising and food behavior in school age children from 5th to 8th grade). Revista chilena de nutrición, 30(1):36–42.

112
33. There is very limited literature that could allow us to assess the full marginal impact of online advertising. However, the NIHR OPRU conducted a meta-analysis282 on five studies from the same author investigating the impact of children’s exposure to food adverts in advergames.
34. It was not possible to calculate the advert duration as unhealthy food images were present for the duration of the game. Children exposed to food adverts in advergames were found to consume on average an additional 53.2kcal (31.5 – 74.9 at a 95% confidence interval).
35. This is a specific example and is not representative of all food advertising online. However, it does suggest that the constant exposure could have a strong effect on children’s food preferences.
282 Russell, Simon J., Helen Croker, and Russell M. Viner. "The effect of screen advertising on children's dietary intake: A systematic review and meta‐analysis." Obesity Reviews(2018).
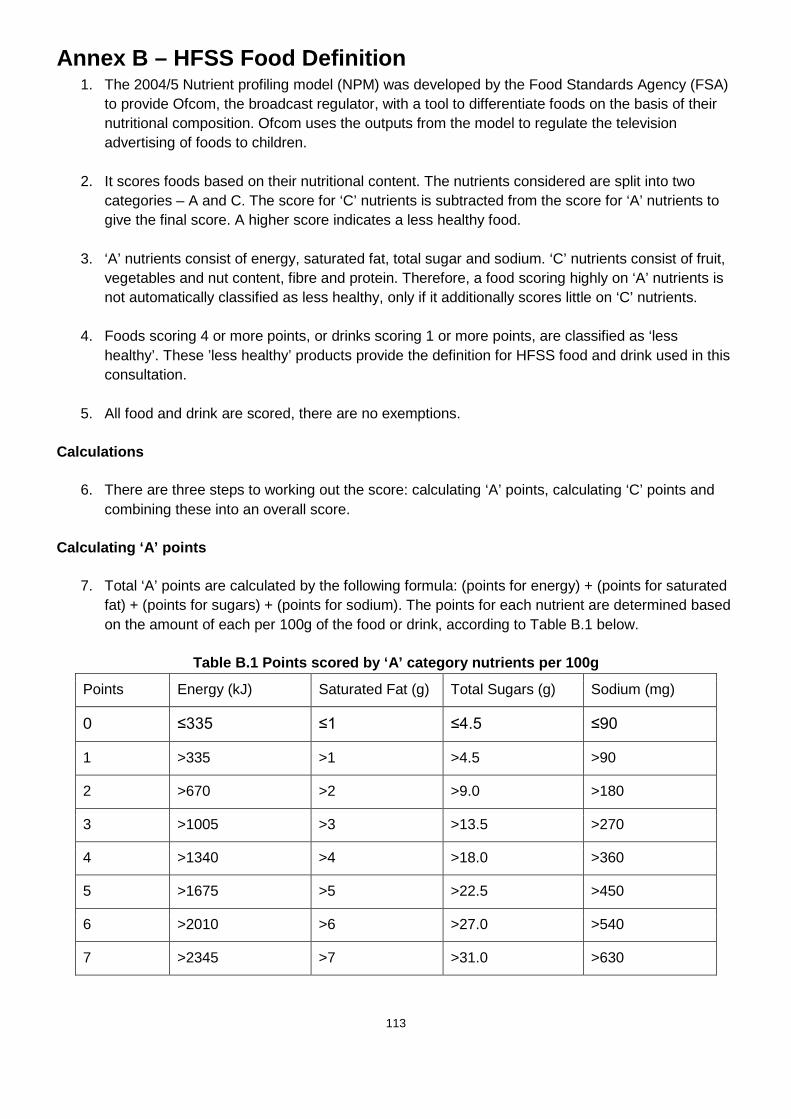
113
Annex B – HFSS Food Definition 1. The 2004/5 Nutrient profiling model (NPM) was developed by the Food Standards Agency (FSA)
to provide Ofcom, the broadcast regulator, with a tool to differentiate foods on the basis of their nutritional composition. Ofcom uses the outputs from the model to regulate the television advertising of foods to children.
2. It scores foods based on their nutritional content. The nutrients considered are split into two categories – A and C. The score for ‘C’ nutrients is subtracted from the score for ‘A’ nutrients to give the final score. A higher score indicates a less healthy food.
3. ‘A’ nutrients consist of energy, saturated fat, total sugar and sodium. ‘C’ nutrients consist of fruit, vegetables and nut content, fibre and protein. Therefore, a food scoring highly on ‘A’ nutrients is not automatically classified as less healthy, only if it additionally scores little on ‘C’ nutrients.
4. Foods scoring 4 or more points, or drinks scoring 1 or more points, are classified as ‘less healthy’. These ’less healthy’ products provide the definition for HFSS food and drink used in this consultation.
5. All food and drink are scored, there are no exemptions.
Calculations
6. There are three steps to working out the score: calculating ‘A’ points, calculating ‘C’ points and combining these into an overall score.
Calculating ‘A’ points
7. Total ‘A’ points are calculated by the following formula: (points for energy) + (points for saturated fat) + (points for sugars) + (points for sodium). The points for each nutrient are determined based on the amount of each per 100g of the food or drink, according to Table B.1 below.
Table B.1 Points scored by ‘A’ category nutrients per 100g
Points Energy (kJ) Saturated Fat (g) Total Sugars (g) Sodium (mg)
0 ≤335 ≤1 ≤4.5 ≤90
1 >335 >1 >4.5 >90
2 >670 >2 >9.0 >180
3 >1005 >3 >13.5 >270
4 >1340 >4 >18.0 >360
5 >1675 >5 >22.5 >450
6 >2010 >6 >27.0 >540
7 >2345 >7 >31.0 >630

114
8 >2680 >8 >36.0 >720
9 >3015 >9 >40.0 >810
10 >3350 >10 >45.0 >900
8. A maximum of ten points can be awarded for each nutrient.
Calculating ‘C’ points
9. Total ‘C’ points are calculated by the formula: (points for %fruit, veg and nut content) + (points for fibre [either NSP or AOAC]) + (points for protein). The points for each nutrient are determined based on the amount of each nutrient per 100g/percentage nutrient component of the food or drink, according to Table B.2 below.
Table B.2 Points scored by ‘C’ category nutrients per 100g
Points Fruit, Vegetable and Nuts (%)
NSP Fibre (grams) (a)
or AOAC Fibre (grams) (a)
Protein (grams) (b)
0 ≤40 ≤0.7 ≤0.9 ≤1.6
1 >40 >0.7 >0.9 >1.6
2 >60 >1.4 >1.9 >3.2
3 - >2.1 >2.8 >4.8
4 - >2.8 >3.7 >6.4
5 >80 >3.5 >4.7 >8.0
(a) NSP fibre information should be used if possible. However, if this is not available then AOAC fibre information should be used. (b) If a food or drink scores 11 or more points for ‘A’ nutrients then it cannot score points for protein unless it also scores 5 points for fruit, vegetables and nuts.
10. A maximum of five points can be awarded for each nutrient/food component. Note the restrictions on points for protein.
Combining points into an overall score
11. Overall score for a food is dependent on how many ‘A’ points it scores and how many points for fruit, veg and nuts it scores. There are three possible situations.
Less than 11 ‘A’ points
12. If a food satisfies this criterion then the overall score is calculated as follows:
Total ‘A’ points minus total ‘C’ points = (energy + saturated fat + sugars + sodium) – (fruit, veg and nuts + fibre + protein)

115
11 or more ‘A’ points and 5 points for fruit, vegetables and nuts
13. If a food satisfies this criterion then the overall score is calculated as the above case.
11 or more ‘A’ points and less than 5 points for fruit, vegetables and nuts
14. If a food satisfies this criterion then the overall score is calculated as follows:
Total ‘A’ points minus points for fruit, veg and nuts and points for fibre = (energy + saturated fat + sugars + sodium) – (fruit, veg and nuts + fibre)
15. Note that in this case foods are not allowed to score for protein.

116
Annex C - Impact Assessment Specific Questions
1. Do you have any additional evidence that would improve our understanding of how and where household spend on HFSS products may be displaced?
Yes/No
If you answered yes, please provide additional evidence
2. Our estimates of the impact on retailer and manufacturer profits are based on several assumptions around profit margins and retailer mark-ups. Can you provide us with any evidence that would help to improve these calculations?
Yes/No
If you answered yes please provide any additional evidence.
3. Do these calculations reflect a fair assessment of the transition costs that would be faced by your organisation?
Yes/No
If you answered no, please explain your reasons and provide additional evidence.
4. If your industry faces revenue or sales loses from these interventions, how long do you expect these to last?
5 years/10 years/15 years/other (please specify)
5. We have estimated that a significant proportion of HFSS advertising on broadcast TV or online will be displaced to other forms of media. As an advertiser do you think the level of displacement for radio, print and out of home is correct?
Yes/No
If you answered no, please provide any additional evidence.
6. We have assumed that HFSS advertising campaigns displaced to non-video forms of advertising (e.g. radio, billboards and direct mail) will have less impact on children’s calorie consumption. Do you agree with this assumption?

117
Yes/No
If you answered no, please provide additional evidence to improve our understanding of how HFSS advertising in non-video media may affect children’s food consumption, behaviours and preferences?
7. For all our options we anticipate minimal additional regulatory burdens from further advertising restrictions in terms of regulatory ongoing compliance for broadcasters, advertisers and manufacturers / retailers. Does this assessment seem reasonable?
Yes/No
If you answered no, please provide any additional evidence.
8. We have assumed that advertising agencies would receive lower commissions if manufacturers and retailers spent less on their advertising campaigns, but not if they shift their campaigns to other advertising media. Do you agree with this assumption?
Yes/No
If you answered no, please provide additional evidence to improve our understanding of how advertising agencies revenue may be impacted by further advertising restrictions
9. Do you have any additional evidence that would improve our understanding of the impacts on businesses? Please provide evidence especially for small and micro businesses.
Yes/No
If you answered yes, please provide any additional evidence.
10. Do you have any further evidence or data on the health benefits you wish to submit for us to consider for our final impact assessment?
No/Yes – Please note that this data may be used to in our final impact assessment that will be published.
Please provide a short summary of the evidence, data, methodology or assumption your response relates to and upload evidence to support your response.
11. Do you have any additional evidence or data that would help us improve our estimates for the additional calorie consumption caused by HFSS product advertising?
118
Yes/No
If you answered yes, please provide any additional evidence.
12. Do you have any additional evidence or data that would help us improve our assumptions on the levels of HFSS product advertising and its impact on children’s food behaviours and preferences?
Yes/No
If you answered yes, please provide any additional evidence.
13. Are you able to provide any additional evidence which would improve our understanding of the long-term impact of HFSS advertising exposure during childhood on food behaviours and preferences later in life?
Yes/No
If you answered yes, please provide any additional evidence.
14. To quantify the impact on food and drink retailers and manufacturers, we have assumed that the calorie reductions are derived from reduced purchasing of HFSS products brought back into the home for consumption. Do you have any evidence or data that can help understand whether a proportion of this reduction would be from consumed outside the home and what impact this would have on the out-of-home sector?
Yes/No
If you answered yes, please provide any additional evidence providing details of the information contained in the data set and the provider.
15. Do you have any additional evidence that could improve our assessment of how these restrictions may impact HFSS manufacturers and retailers? Particularly learning from the experience of current children’s HFSS advertising restrictions.
Yes/No
If you answered yes, please provide any additional evidence.
16. Do you have any evidence or data to suggest how advertising restrictions may impact HFSS product sales of small and micro-businesses?
119
Yes/No
If you answered yes, please provide details of the information contained in the data set and the provider.
17. Do you have any evidence or data to suggest what proportion of the fewer HFSS calories purchased due to advertising restrictions may be removed from small and micro-businesses?
Yes/No
If you answered yes, please provide details of the information contained in the data set and the provider.
18. Do you have any additional evidence or data that could improve our estimates of how much HFSS advertising is present, across various online platforms and formats (e.g. desktop, mobile, video pre-roll, native, search, sponsorship, other video and other display) and children’s exposure to these adverts online?
Yes/No
If you answered yes, please provide any additional evidence.
19. Our evidence on the impact of HFSS advertising on adults is inconclusive. Do you have any additional evidence which would improve our understanding of the impact HFSS advertising has on adult’s food consumption, behaviours and preferences and purchases (either for themselves or their children)?
Yes/No
If you answered yes, please provide any additional evidence.
20. Can you provide us with any additional evidence to improve our understanding of how the pricing of advertising may change under our proposed options?
Yes/No
If you answered yes, please provide any additional evidence.
21. We have assumed that businesses could partially mitigate the impact of advertising restrictions by shifting to brand advertising, reformulating products, or promoting healthier

120
alternatives in the brand. Do you agree with our assessment of the impact on broadcasters and likely mitigations?
Yes/No
If you answered no, please outline your reasons and provide any supporting additional evidence.
22. What mitigating actions would your business most likely pursue?
Shift to brand advertising/reformulate/shift to advertising healthier products/ Will not take any mitigating action/ other - please specify
23. The Department of Culture Media and Sport and the Department of Health and Social Care would welcome any further comments regarding;
• The calculations conducted in the Impact assessment;
• The assumptions made in the Impact assessment.

121
Annex D – Kantar Consulting - HFSS Advertising Analysis: Methodology summary About Kantar Consulting Kantar Consulting is part of Kantar, one of the world's largest insight, information and consultancy groups, and the data investment management division of WPP. Kantar has over 1,000 analysts and own market-leading assets including PoweRanking, GrowthFinder, Global Monitor, RetaiI IQ, RichMix, XTEL and Marketing, Insights and Purpose 2020. They track 1,200 retailers globally, have purchase data on over 200 million shoppers and forecast social, cultural and consumer trends across the world. Kantar Consulting has co-ordinated best-in-class analytics and modelling resource and assets within the group, tailored to the specific objectives of this engagement. A technical advisory panel comprised of representatives from Department for Digital, Culture, Media and Sport, Department of Health and Social Care, Public Health England, Behavioural Insights Team and the Office for National Statistics provided technical advice and scrutiny of the research methodology. 1. BASELINING METHODOLOGY The data sources used: Nielsen (TV spends and categorisation) Nielsen measures more than half of the world’s total broadcast, print and online advertising. In Europe, advertising spend is a multi-billion pound industry spanning TV, print, online display, radio, out-of-home, direct mail and cinema advertising. They provide advertisers, agencies and media owners with a picture of the competitive landscape in Europe by measuring who advertised, on which medium, how much was spent by campaign, how many ads and ad formats. They can then break this down further by key industry sector and individual advertiser. BARB (TV impacts) BARB is responsible for delivering the UK’s television audience measurement currency. They commission research companies Ipsos MORI, Kantar Media and RSMB to collect data that represent the viewing behaviour of the UK’s 27 million TV households. Each year, £7.5 billion is invested in the production and distribution of programme and commercial content, which is guided and accounted for by BARB data. ComScore (Online spends and impressions) ComScore is a global media measurement and analytics company providing marketing data and analytics to enterprises; media and advertising agencies; and publishers. In the UK, their work is accredited by the Audit Bureau of Circulations (ABC) and UK Online Measurement (UKOM). As their advertising dataset only tracks online display, other sources of data have been used to create estimate the total size of the market (explained in more detail later in this section).
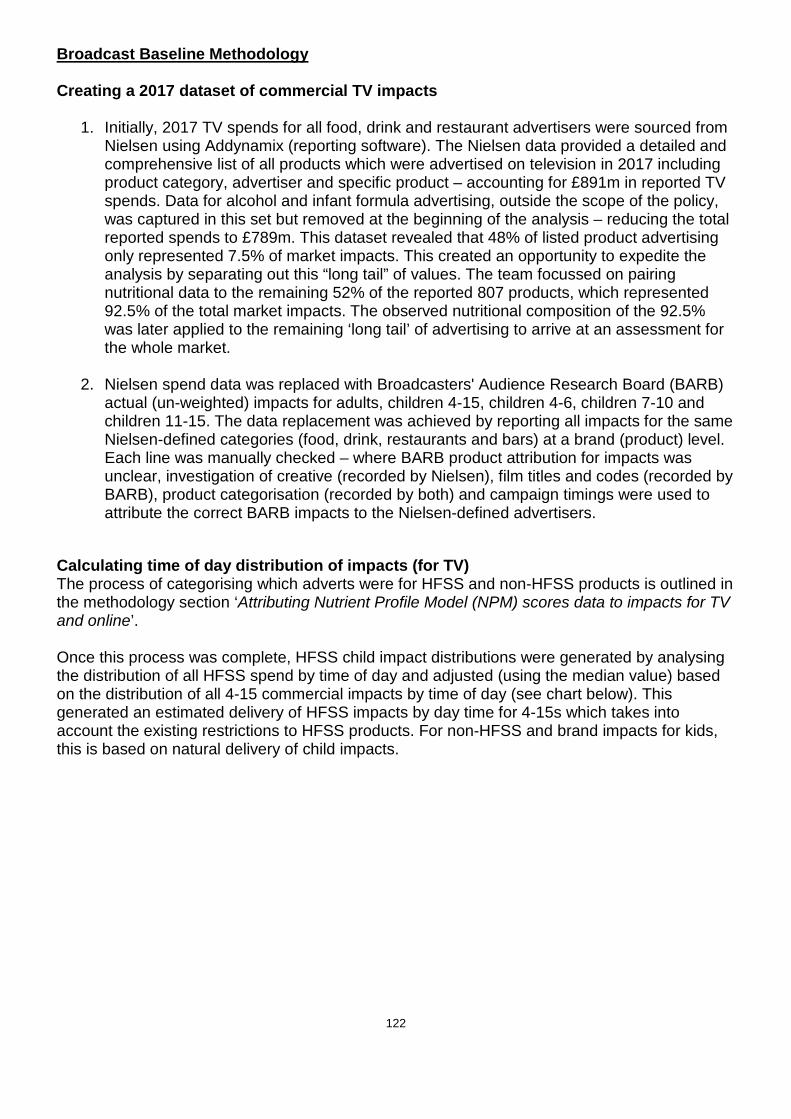
122
Broadcast Baseline Methodology Creating a 2017 dataset of commercial TV impacts
1. Initially, 2017 TV spends for all food, drink and restaurant advertisers were sourced from Nielsen using Addynamix (reporting software). The Nielsen data provided a detailed and comprehensive list of all products which were advertised on television in 2017 including product category, advertiser and specific product – accounting for £891m in reported TV spends. Data for alcohol and infant formula advertising, outside the scope of the policy, was captured in this set but removed at the beginning of the analysis – reducing the total reported spends to £789m. This dataset revealed that 48% of listed product advertising only represented 7.5% of market impacts. This created an opportunity to expedite the analysis by separating out this “long tail” of values. The team focussed on pairing nutritional data to the remaining 52% of the reported 807 products, which represented 92.5% of the total market impacts. The observed nutritional composition of the 92.5% was later applied to the remaining ‘long tail’ of advertising to arrive at an assessment for the whole market.
2. Nielsen spend data was replaced with Broadcasters' Audience Research Board (BARB) actual (un-weighted) impacts for adults, children 4-15, children 4-6, children 7-10 and children 11-15. The data replacement was achieved by reporting all impacts for the same Nielsen-defined categories (food, drink, restaurants and bars) at a brand (product) level. Each line was manually checked – where BARB product attribution for impacts was unclear, investigation of creative (recorded by Nielsen), film titles and codes (recorded by BARB), product categorisation (recorded by both) and campaign timings were used to attribute the correct BARB impacts to the Nielsen-defined advertisers.
Calculating time of day distribution of impacts (for TV) The process of categorising which adverts were for HFSS and non-HFSS products is outlined in the methodology section ‘Attributing Nutrient Profile Model (NPM) scores data to impacts for TV and online’. Once this process was complete, HFSS child impact distributions were generated by analysing the distribution of all HFSS spend by time of day and adjusted (using the median value) based on the distribution of all 4-15 commercial impacts by time of day (see chart below). This generated an estimated delivery of HFSS impacts by day time for 4-15s which takes into account the existing restrictions to HFSS products. For non-HFSS and brand impacts for kids, this is based on natural delivery of child impacts.

123
Calculating minutage We looked at the proportion of spend by time length for HFSS advertising within the Nielsen dataset. The split for spend was applied to impacts to estimate the distribution of HFSS impacts by time length. Assuming each impact is a fully watched ad, we multiplied impacts by time length to get total seconds and minutes of HFSS advertising seen by children in 2017. In summary: Gross minutage = sum of (impacts X time length)
Creating a realistic dataset for TV spends To add another level of accuracy to Nielsen reported spends for the food and drink category, we were able to recalibrate the reported data based on actual market spend data. When an advertiser books airtime for a TV campaign it is preceded by a series of negotiations (usually conducted on their behalf by a specialist buying agent). These negotiations usually result in a discount versus “station” or “rate card” price. It is understood that Nielsen reporting does not factor in trading discounts that will apply to most advertisers in this category (trading at up to an estimated 65% from station price), and that their methodology makes assumptions about the application of premium trading audiences, that do not always apply in reality. Nielsen spends are therefore likely to be more representative of the station price rather than the actual traded price and could represent an incorrect level of revenue to broadcasters. We compared actual and reported total TV spends for a representative sample drawn from 50+ food and drink advertisers that represented an estimated 16-20% of the total category TV spend in 2017.
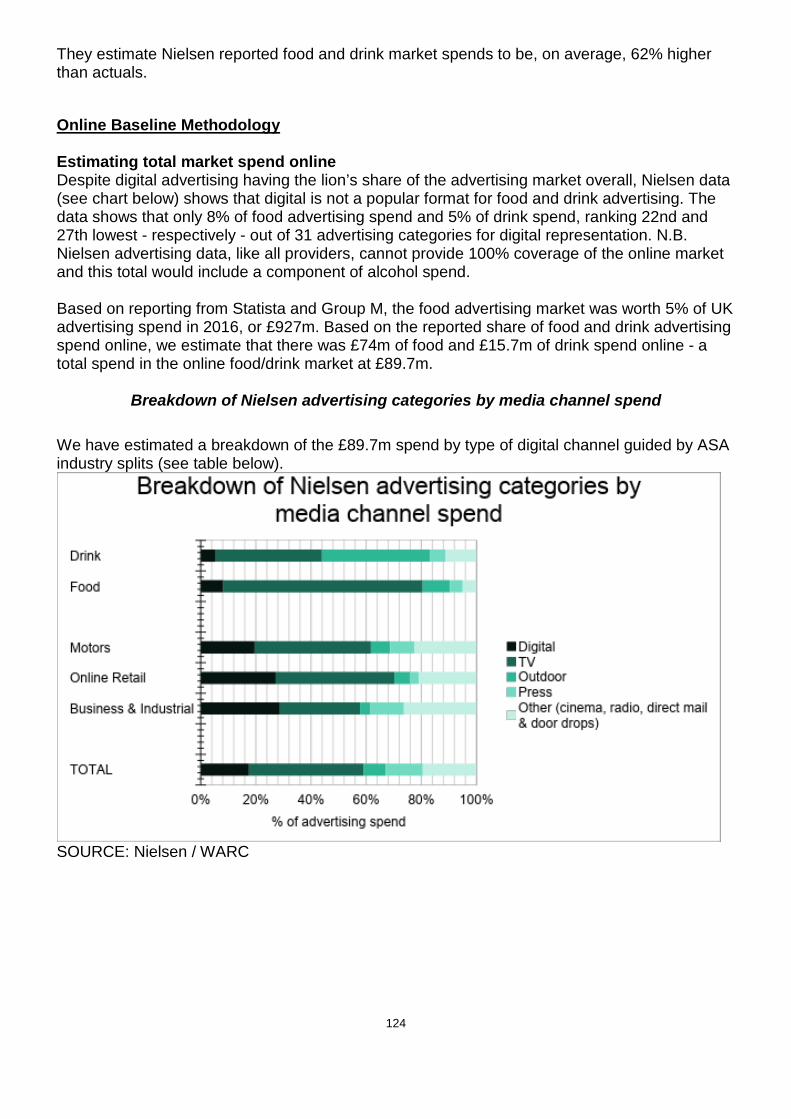
124
They estimate Nielsen reported food and drink market spends to be, on average, 62% higher than actuals.
Online Baseline Methodology Estimating total market spend online Despite digital advertising having the lion’s share of the advertising market overall, Nielsen data (see chart below) shows that digital is not a popular format for food and drink advertising. The data shows that only 8% of food advertising spend and 5% of drink spend, ranking 22nd and 27th lowest - respectively - out of 31 advertising categories for digital representation. N.B. Nielsen advertising data, like all providers, cannot provide 100% coverage of the online market and this total would include a component of alcohol spend. Based on reporting from Statista and Group M, the food advertising market was worth 5% of UK advertising spend in 2016, or £927m. Based on the reported share of food and drink advertising spend online, we estimate that there was £74m of food and £15.7m of drink spend online - a total spend in the online food/drink market at £89.7m.
Breakdown of Nielsen advertising categories by media channel spend We have estimated a breakdown of the £89.7m spend by type of digital channel guided by ASA industry splits (see table below).
SOURCE: Nielsen / WARC

125
Breakdown of UK digital advertising spend and proportions covered by ComScore panel data
Using a set of estimated industry cost per thousand advertising impressions from GroupM investment, we were able to convert estimated spends into all individual impressions for desktop and mobile display, video and native advertising. Other channels where there are estimated spends (digital sponsorship, search and classified) cannot be expressed in terms of impressions as they are not measured or traded on this metric.
Estimates for all food and drink online advertising impressions
Proportion of
Spend Digital Market
Spend £m Digital Food/Drink
Spend £m Estimated Individual
Impressions (m) Display banners desktop 8.9% 894 8.0 994
Display banners mob 4.1% 418 3.7 465
Display video - pre roll 6.7% 671 6.0 271
Display video outstream 8.9% 900 8.0 1,601
Other display video 0.4% 38 0.3 34
Native 10.2% 1,032 9.2 18,361 Sponsored 1.2% 124 1.1 N/A

126
Other display 1.0% 101 0.9 225 Search 57.7% 5,821 51.8 N/A Classified N/A 1,470 N/A N/A Other 0.8% 84 0.8 150 Total 11,553 89.7 21,951 This led us to a total estimated figure of 22bn total individual impressions for food, drink and restaurant advertising across desktop and mobile display, video and native advertising. Estimating HFSS splits online Detailed listings of online impressions at a product level are required to classify online ads using the Nutrient Profile Model (NPM). The best available data with this granularity comes from ComScore (a UKOM accredited global online measurement organisation https://www.comscore.com/About/Third-Party-Review). Unfortunately, ComScore is only able to track desktop display advertising (approx. 9% of all online spend) and the level of coverage delivered is not available. ComScore reports 238m adult impressions for food, drink and restaurant advertisers on desktop display in 2017. A review of this data revealed that £2.3m of advertising spend was attributable to HFSS products, with an estimated 8.3m commercial impressions being delivered to children. We assume that this does not represent full coverage of all HFSS advertising online, but instead have used it as a representative sample to derive HFSS splits. Following the same categorisation process as TV, NPM scores were applied to the identified products. The proportion of food and drink adverts that were HFSS in the ComScore sample was found to be 59%; this proportion was extrapolated to determine the estimated HFSS commercial impressions - adults and children - (13bn of the 22bn) and advertising revenue (£52.9m of the £89.7m). 63 out of 263 products identified on ComScore were international products that are not widely available in the UK. (i.e whilst they may be purchasable via global online retailers (like Amazon), they are not stocked by UK-based retailers). The advertising inventory reported is likely to be part of an international ad buy that delivers impressions across global media platforms – to access markets where their products are stocked, these advertisers may be accepting wasted inventory in markets where they are not stocked. Estimating child exposure online ComScore, unlike BARB, cannot report advertising impressions for a given audience. Kantar Consulting have therefore used a bespoke modelling tool – CrossMedia – to estimate levels of exposure for children based on the reported all adult impressions. Please see more detail on the functionality of the CrossMedia tool below. The team used the sample of all adult impressions derived from ComScore and split these according to nutrient value to model the equivalent exposure to children. It is important to note that this tool estimates relative potential exposure and cannot take into account the existing regulations for HFSS products online. It therefore represents an upper-bound estimate of the potential reach for HFSS advertised products online (assuming that these estimates accurately capture the market).

127
The team have assumed that the same split of HFSS advertising observed in the desktop display sample applies to all other impact-bearing digital channels (desktop and mobile display, video and native advertising).
About CrossMedia (A Kantar Consulting bespoke tool) CrossMedia is a GroupM planning tool which allows planners to look at the levels of exposure received by a given audience, based on a given weight of advertising. The tool uses a modelling approach called agent-based modelling. Agents in the model are entities which represent actual people using media in their everyday lives. Agents are created based on respondent-level answers to surveys asking about socio-demographic features and media behaviour patterns. On a day-to-day basis, the tool is fuelled by LIVE Panel survey data, which reports media and touchpoint consumption for over 30 countries and 35 paid, owned and earned touchpoints. Applying agent based modelling to this data, and calibrating it with local media measurement sources, allows for the sophisticated prediction of campaign exposure on multiple touchpoints in a single market. The LIVE Panel hub data is based on all adults but the tool has been adapted to report against children too. Individual media consumption data from the YouthTGI survey (https://www.kantarmedia.com/uk/our-solutions/consumer-and-audience-targeting/tgi-survey-data) and BARB data was ported into the system to allow reporting of child audiences 4+. The idea for the simulation algorithm remains the same, regardless of the data source used. The tool randomly assigns each planned impression to agents; the probability of receiving a single impression is proportional to the average daily time an agent spends using a particular touchpoint. Once a single set of impressions is evaluated multiple times, the results are aggregated across all iterations and all respondents into a coherent results, representing cross-media reach of multiple touchpoints. The team input all the reported impressions, which the tool was then able to convert to an equivalent level of child impressions based on the modelling method applied above.
Attributing Nutrient Profile Model (NPM) scores data to impacts for TV and online NPM score data was initially derived from existing Kantar Worldpanel datasets for 2017, and manually matched with impacts at a product level. The Kantar Wordpanel data sets contain full nutritional data and NPM score for selected products. Kantar Worldpanel collect nutrition data from food labels on individual products via fieldworkers who visit retail stores on a rolling 4-6 monthly basis. This information is supplemented by product images from third party suppliers. Where nutrition data has not been collected for a product, Kantar Worldpanel imputes nutrition values based on similar products or with category averages. The NPM scores are calculated using the 2004/05 NPM calculations as reported in the Government Nutrient Profile Model Technical Guidance 2011. Fruit Vegetable and Nut scores are estimated at a category level because these are not captured in the Kantar Worldpanel data. The categorisation approach follows a methodology used in similar analysis conducted by the Institute of Fiscal Studies. However, 89% of the products advertised saw no alteration in NPM score on the basis of FVN. The remaining 11% of products had NPM scores, which were comfortably above or below the NPM pass threshold, to the point where errors in FVN calculation would not have a bearing on their HFSS (or non-HFSS status).

128
For this project, the nutrient values for September 2017 were used, with product level information provided where an advertisement was for a particular product. Where the advertisement covered a brand or range, and a precise product is unidentifiable either a) an average of the real largest selling products has been used or b) a sales weighted average (for large ranges or manufacturers). This has been specified where a sales weighted average figure has been used rather than just an average of the range and will reflect an average for the 52 w/e Sep 2017. Kantar Worldpanel assigned NPM scores to 316 products advertised on TV, out of a total of 428. For online advertisements 129 products were assigned an NPM score out of a total of 269 products / brands / ranges / manufacturers. In some cases NPM scores could not be assigned, these were often adverts focusing on supermarket brand building or other general brand building without a direct focus on specific food or drink products. For products that had tracked advertising activity but did not sit on existing datasets, NPM score classification was applied manually by the wider team using publicly available nutrition data. Where relevant, the advertising creative was viewed to help guide categorisation. All products that could not be directly matched to an existing NPM dataset were categorised using the following decision tree:
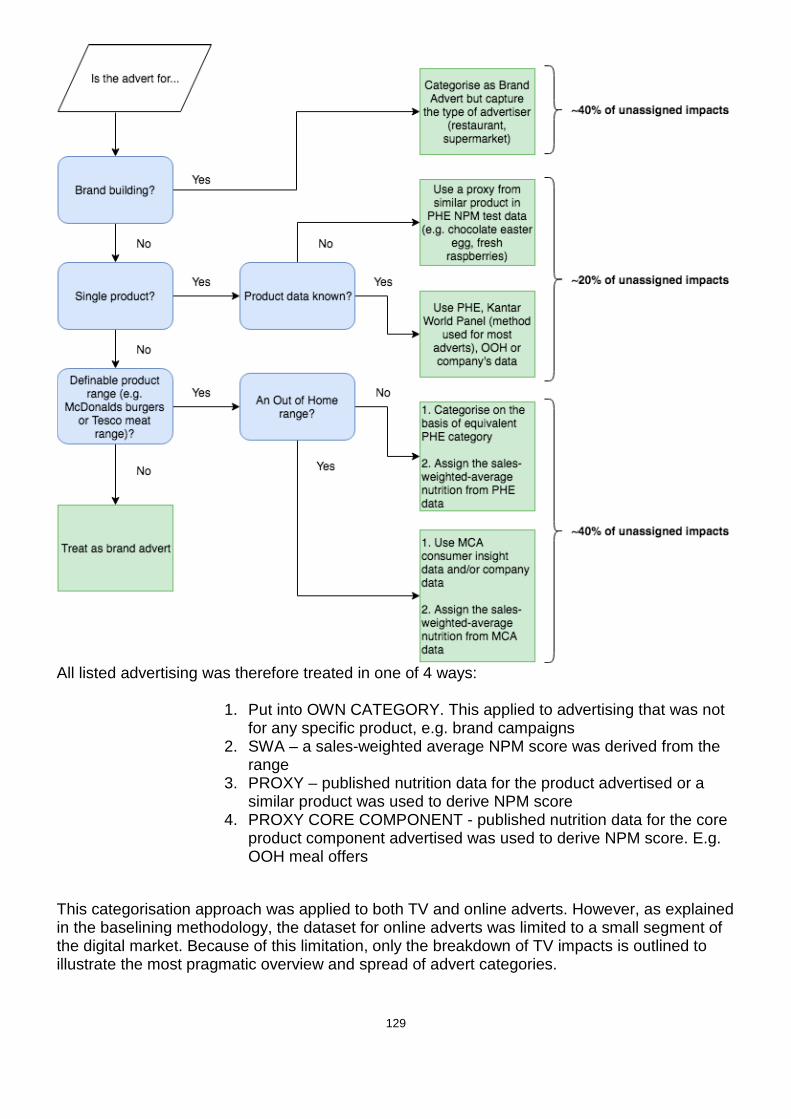
129
All listed advertising was therefore treated in one of 4 ways:
1. Put into OWN CATEGORY. This applied to advertising that was not for any specific product, e.g. brand campaigns
2. SWA – a sales-weighted average NPM score was derived from the range
3. PROXY – published nutrition data for the product advertised or a similar product was used to derive NPM score
4. PROXY CORE COMPONENT - published nutrition data for the core product component advertised was used to derive NPM score. E.g. OOH meal offers
This categorisation approach was applied to both TV and online adverts. However, as explained in the baselining methodology, the dataset for online adverts was limited to a small segment of the digital market. Because of this limitation, only the breakdown of TV impacts is outlined to illustrate the most pragmatic overview and spread of advert categories.

130
Summary of TV impacts by treatment type Treatment No
Advertisers % All Child Impacts
Example
NPM Score Applied
151 32% Cadbury’s dairy milk, where all nutritional data and product size is known.
Own Category (Brand)
49 20% Just Eat, food delivery service advert. Tesco advert, featuring no discernible product range.
Proxy 133 25% No product data for Iceland seasonal advert - ‘Luxury Gilded Turkey’. ‘Whole Turkey’ data used as proxy.
Proxy Core Component (OOH)
36 9% Limited data available on a Burger King Whopper, supermarket equivalent used, where NPM score is known (N.B. both considered HFSS by score)
SWA 51 14% Lindt - Excellence Chocolate Range. SWA of top seven bestselling products in range used.
Examples of adverts that could not be matched to specific products Example 1: Aldi – Food & Drink Range 20s spot Treatment: Brand Ad (own category)
Whilst food products are featured, it is a range that is shown throughout the ad. Neither a single product nutrient score, or an average would be representative. The voice-over is brand-led and contains no reference to product or call to action. Therefore, it was appropriate to classify this as a brand ad.

131
Example 2: Papa John’s – Deep Crust Pizza 20s spot
Treatment: Proxy NPM used Pizza is clearly prominent in the creative but no specific product is identified. Given the prominence of the pizza it would not have been appropriate to classify this a brand ad. Therefore, the best available representative proxy was used.
Example 3: Coca Cola – Coke Range 20s spot Treatment: SWA for range applied
This advert features the Coca Cola range – Original, Diet and Zero. It was therefore appropriate to apply the SWA nutrient profile score for the range.
132
Annex E – DHSC Calorie Model V2 Introduction
1. DHSC has previously published a Technical Consultation Document283 of the DHSC Calorie Model. The purpose of the DHSC Calorie Model is to model the long-term benefits (in terms of health outcomes and savings to the NHS and social care costs) of policies aiming to reduce the calorie imbalance at a population level.
2. The old model focuses on changes in weight from a predetermined kcal reduction during adulthood. However, the previous write-up discussed that future versions of the model intended to stratify the population by age rather than grouped ages. This would allow the effects of a calorie reduction in children (alongside adults) to be modelled.
3. The DHSC Calorie Model 2.0 has now been developed with this addition. The core structure of
the new Calorie Model is the same: the population is simplified into the average for their group, their BMI is forecast with and without a policy intervention, and the change in BMI forecast is used to consider the differences in the population with health conditions related to excess weight. These differences are then monetised in the same way as the old model: monetised savings to the NHS, economic benefits, savings to social care, and monetised QALYs.
4. This document will discuss the changes made in the new model, but should be read alongside the original Technical Consultation Document to gain a full understanding of the model.
Differences in the Calorie Model V2
Implementation of the Model
5. The original model was implemented using Microsoft Excel. The Calorie Model V2 has been rewritten using the R programming language284. This has allowed various improvements on the structure of the model to be made:
a. There are an increased number of groups considered in the model. b. There is an increased timescale of the economic analysis. c. We can use dynamic models of weight loss/gain which were previously approximated in
the old model.
BMI Forecast
6. The previous model assumed that an adult would lose 0.042 kg of body weight per 1 kcal change in diet – a necessary simplification of the research of Hall et al285. The previous model also assumed weight would be lost linearly: 33% in the first year, 66% in the second year, and 100% from year 3 onwards.
283 DHSC, DHSC Calorie Model, August 2018. [Online]. Available: https://assets.publishing.service.gov.uk/government/uploads/system/uploads/attachment_data/file/736417/dhsc-calorie-model-technical-document.pdf 284 “The R Project for Statistical Computing”. [Online]. Available: https://www.r-project.org/ 285 Hall KD, Sacks G, Chandramohan D, Chow CC, Wang YC, Gortmaker SL, Swinburn BA. Quantification of the effect of energy imbalance on bodyweight. The Lancet. 2011 Aug 27;378(9793):826-37.

133
7. We now model an individual’s weight using the differential equations from Hall et al.286. This approach assumes an individual’s weight to consist of body fat, and fat-free mass (summed together to give the total body weight). The BMI projection through life is done by considering the imbalance between energy in and energy out, and by assuming that an individual will remain on the same BMI percentile through life.
8. It should be noted that the Calorie Model V1 used research from Ara et al.287 to model how the BMI of the control group would change over time. This evidence is based on an overweight and obese population. Due to a lack of any further available evidence, this same research has again been used in the Calorie Model V2, even though the new model includes a population with a healthy BMI.
9. The differential equations were implemented in the model using the deSolve288 package in R. The equations used in the previous model were based on these differential equations but had been simplified to give the single reduction in body weight mentioned in paragraph 6.
10. The original model predicted the same weight loss per kcal reduction regardless of original body weight, which was discussed in the write-up to be a simplification of the model. The use of the differential equations in the new model forecasts a greater reduction in body weight per kcal reduction in diet in individuals with more excess weight.
11. These updates allow us to model changes in weight that occur in childhood. The equations include a growth term which tends to zero at age 18, meaning the model naturally transitions from childhood into adulthood.
12. There exists no evidence to link excess weight to the modelled conditions during childhood and hence no health benefits have been modelled during childhood. If any undiscovered associations exist, this would imply our calculations underestimate the benefits.
Groups considered 13. The previous model splits the population by age category (4-10 years, 11-18 years, 19-64 years,
and 65+ years), sex, and 3 BMI categories: overweight, obese, and very obese.
14. The new model splits the population by age, sex, and 5 BMI categories: underweight, healthy weight, overweight, obese, and very obese.
15. The use of the additional categories allows us to consider the health benefits that occur in adults that are not overweight, but have a BMI greater than 22 kg/m2. As mentioned in the technical document for the old model, the risk of the 5 conditions modelled increase linearly with a BMI level of 22 onwards, and so including a healthy weight group allows the extra benefits to be modelled. Underweight was modelled as a separate group to ensure that no health benefits were being assigned to the underweight population and the mean BMI used in the healthy weight category was not brought down by the lower BMIs of the underweight category.
286 Hall KD, Butte NF, Swinburn BA, Chow CC. Dynamics of childhood growth and obesity: development and validation of a quantitative mathematical model. The lancet Diabetes & endocrinology. 2013 Oct 1;1(2):97-105. 287 Ara, R., L. Blake, L. Gray, M. Hernández, M. Crowther, A. Dunkley, F. Warren et al. "What is the clinical effectiveness and cost-effectiveness of using drugs in treating obese patients in primary care? A systematic review." Health technology assessment (Winchester, England) 16, no. 5 (2012) 288 “deSolve: Solvers for Initial Value Problems of Differential Equations”. [Online]. Available: https://cran.r-project.org/web/packages/deSolve/index.html
134
16. The use of additional age categories means that age-specific parameters (such as mortality rate, or incidence of a condition) will be applied at the correct time. A limitation of the old model was that by using the average age of a population, the timings of the benefits would have been inaccurate. The new model ensure benefits are occurring at the correct time in an individual’s life.
17. The starting population is defined by the user, meaning a policy can be considered that only applies a calorie reduction to children, to children and adults, or only applies to adults.
18. The new model utilises Markov modelling to calculate the transitions of the population between states, where states are defined as healthy, having a condition (where each condition is a separate state), or deceased. The Markov modelling was handled by the heemod289package in R.
19. The probabilities of being in a state are used as inputs into the heemod package, which can then simulate how the states will develop over time, starting the model with 100% of the population in the healthy state.
20. For every cycle of the Markov model (equivalent to one year), the model calculates what proportion of the population will be in each state using the predicted probabilities (which as in the original model, are BMI-dependent). This gives a trajectory of the proportion of the total population in each state every year.
21. The previous model considered the possibility of people living with one condition, but dying of another. This version of the model has made the simplification that people have no more than one condition given there is currently a lack of evidence on the health effects of having several of these conditions.
Increased Timescale
22. The health problems associated with obesity do not tend to arise until later in life. Given this model includes the benefits of a reduction in calories on children, an even longer timescale is necessary for these benefits to arise, i.e. we need to model long enough for the children to become adults and old-aged.
23. The new model can run for a longer time-period, and based on ONS population projections, will add new children each year who will be born into the model. This means a policy that runs for multiple years can be modelled on children who will be born during the duration of the policy.
24. Once a policy has finished running, the model will stop adding new children to the population. However, it will continue to model benefits on the existing population for as long as the user defines. This allows the benefits that do not occur until much later in life to be modelled over the lifetime of the population.
Quality Assurance
289 “heemod: Markov Models for Health Economic Evaluations”. [Online]. Available: https://cran.r-project.org/web/packages/heemod/index.html
135
25. As with the first model, the quality assurance (QA) was carried out in line with the principles set out in the Government Aqua book290. Due to the increased complexity of this model, extra QA was needed.
26. The QA was divided into several sections and split between analysts in the Department of Health and Social Care and Public Health England, with the inputs to the model, R code and the Hall et al. research all being checked and reviewed.
290 HM Treasury, “The Aqua Book: guidance on producing quality analysis for government,” 26 March 2015. [Online]. Available: https://www.gov.uk/government/publications/the-aqua-book-guidance-on-producing-quality-analysis-for-government