title i schools and strategies that work
TRANSCRIPT

Brandman University Brandman University
Brandman Digital Repository Brandman Digital Repository
Dissertations
Summer 7-1-2020
Title I Schools and Strategies That Work Title I Schools and Strategies That Work
Michelle Manriquez
Follow this and additional works at: https://digitalcommons.brandman.edu/edd_dissertations
Part of the Curriculum and Instruction Commons, Educational Leadership Commons, Educational
Methods Commons, Elementary and Middle and Secondary Education Administration Commons,
Elementary Education Commons, and the Elementary Education and Teaching Commons

Title I Schools and Strategies That Work
A Dissertation by
Michelle Manriquez
Brandman University
Irvine, California
School of Education
Submitted in partial fulfillment of the requirements for the degree of
Doctor of Education in Organizational Leadership
June 2020
Committee in charge:
Carlos V. Guzman, PhD, Committee Chair
Timothy McCarty, EdD
Jeffery Lee, EdD

BRANDMAN UNIVERSITY
Chapman University System
Doctor of Education in Organizational Leadership
The dissertation of Michelle Manriquez is approved.
June 2020

iii
Title I Schools and Strategies That Work
Copyright © 2020
by Michelle Manriquez

iv
ACKNOWLEDGEMENT
I would like to first say thank you to my husband, Constanzo Manriquez,
for supporting me through this journey. He helped me to maintain life/work
balance and supported me through all the nights and weekends of coursework and
dissertation writing. Brandman University is a great program and I would not
recommend anywhere else for an EdD. I would also like to thank my mother,
Rachel Phillips, for encouraging me to keep going and inspiring me daily.
I also want to acknowledge the amazing Delta Monterey Cohort (Delta
Ducks). They were inspirational in finishing the coursework. I knew they would
be available for me when I needed support. I especially want to thank Larry and
Marcie for seeing me through the dissertation process. They are amazing. I do
not know what I would have done without them. Thank you for all your
encouragement and support.
The demands of writing a dissertation are extensive. The thought process
and different way of writing made me stretch my learning and increase
expectations for myself. I am inspired to continue researching and understanding
how I can be part of a solution in the educational field.

v
ABSTRACT
Title I Schools and Strategies That Work
by Michelle Manriquez
Purpose: The purpose of this study was to identify and describe the strategies
principals of Title I schools perceived as most effective in improving English
language arts (ELA) scores by at least 10 points, through the lens of WestEd’s
Four Domains of Rapid School Improvement.
Methodology: This study utilized a qualitative methodology to gather data via the
California Dashboard and semi-structured interviews of 11 principals from 11
different sites in northern California that showed at least 10-point growth on the
Smarter Balanced Assessment Consortium (SBAC) standardized test. The
interview questions were based on the Four Domains for Rapid School
Improvement: A Systems Framework from WestEd (2018). Interview responses
were recorded and reviewed. In addition, artifacts were used to attain
triangulation.
Findings: Examination of the qualitative data from the 11 elementary school
principals participating in this study resulted in five key findings and 16 themes.
First was that implementation of professional learning communities (PLCs) and
support through a teacher on special assignment (TOSA) support positive change
in struggling schools. Second, collaboration among administrators, TOSAs, and
teachers in professional development and classroom support directly impacted
change and led to success in struggling schools. Third was that ongoing data
review with the support of a TOSA in the classroom and for intervention helped

vi
teachers increase student outcomes in struggling schools. The fourth finding was
implementation of a new curriculum and common schedules brough consistency
to the site and reinforced collaboration between teachers and administrators in
struggling schools. Finally, principals recommended goals for students be set and
monitored to promote student achievement in struggling schools.
Conclusions: The study supported the conclusion that implementation and
practice of the key findings could result in an increase of at least a 10-point
growth on the California state assessment in ELA.
Recommendations: Further research is recommended to apply this study for
other curricular areas in Title I schools, as well as non-Title I schools.

vii
TABLE OF CONTENTS
CHAPTER I: INTRODUCTION .............................................................................1
Background ....................................................................................................... 2
Title I ............................................................................................................2
Local Control Funding Formula and Local Control Accountability Plan ...2
The California Dashboard ............................................................................3
Smarter Balanced Assessment and Assessment of Student Performance
and Progress .................................................................................................4
Statement of the Research Problem .................................................................. 5
Purpose Statement ............................................................................................. 6
Research Questions ........................................................................................... 6
Research Sub-Questions ..............................................................................6
Significance of the Study .................................................................................. 7
Definitions......................................................................................................... 8
Delimitations ................................................................................................... 10
Organization of the Study ............................................................................... 10
CHAPTER II: REVIEW OF THE LITERATURE ...............................................11
History of Funding for Public Schools ........................................................... 11
The Elementary and Secondary Education Act .........................................15
Title I ..........................................................................................................15
Local Control Funding Formula and Local Control Accountability Plan .20
Populations Focused on for LCFF/LCAP ..................................................21
Funding for California Schools ..................................................................24
Smarter Balanced Assessment Consortium ...............................................28
The California Dashboard ............................................................................... 28
Theoretical Framework ................................................................................... 30
Summary ......................................................................................................... 38
CHAPTER III: METHODOLOGY .......................................................................39
Purpose Statement ........................................................................................... 39
Research Questions ......................................................................................... 39
Research Sub-Questions ............................................................................39
Research Design.............................................................................................. 40
Population ....................................................................................................... 41
Target Population .......................................................................................42
Sample............................................................................................................. 43
Instrumentation ............................................................................................... 44
Interview Questions ...................................................................................44
Researcher as an Instrument ......................................................................46
Expert Adviser ...........................................................................................47
Credibility ..................................................................................................47
Validity and Reliability ................................................................................... 48
Validity ......................................................................................................48
Reliability ...................................................................................................49

viii
Data Collection ............................................................................................... 51
Field Test ...................................................................................................54
Artifact Protocol.........................................................................................55
Data Analysis .................................................................................................. 55
Limitations ...................................................................................................... 56
Summary ......................................................................................................... 57
CHAPTER IV: RESEARCH, DATA COLLECTION, AND FINDINGS...........58
Purpose Statement and Research Questions ................................................... 58
Research Methods and Data Collection Procedures ....................................... 59
Population ....................................................................................................... 59
Sample............................................................................................................. 60
Demographic Data .......................................................................................... 60
Presentation and Analysis of Data .................................................................. 61
Data Preparation.........................................................................................61
Findings for Research Sub-Question 1 ......................................................63
Findings for Research Sub-Question 2 ......................................................65
Findings for Research Sub-Question 3 ......................................................70
Findings for Research Sub-Question 4 ......................................................74
Summary of Major Themes and Patterns........................................................ 78
CHAPTER V: FINDINGS, CONCLUSIONS, AND RECOMMENDATIONS .80
Methodology Review ...................................................................................... 80
Key Findings ................................................................................................... 81
Unexpected Findings ...................................................................................... 85
Conclusions ..................................................................................................... 86
Implications for Action ................................................................................... 91
Recommendations for Further Research ......................................................... 94
Concluding Remarks and Reflections ............................................................. 95
REFERENCES ......................................................................................................97
APPENDICES .....................................................................................................106

ix
LIST OF TABLES
Table 1. Sample from One LCAP ......................................................................... 55
Table 2. Participants Demographics ..................................................................... 61
Table 3. Overall Themes, Participants, and Frequency of Responses .................. 62
Table 4. Frequency of Responses for Research Sub-Question 1 .......................... 63
Table 5. Frequency of Responses for Research Sub-Question 2 .......................... 66
Table 6. Frequency of Responses for Research Question 3.................................. 70
Table 7. Frequency of Responses for Research Sub-Question 4 .......................... 75

x
LIST OF FIGURES
Figure 1. Four Domains of Rapid School Turnaround ......................................... 31
Figure 2. California Department of Education Regional Assessment Network ... 43
Figure 3. Proportion of Responses Aligned with the Four Domains. ................... 78

1
CHAPTER I: INTRODUCTION
For many decades, the government and public schools have been looking for
ways to improve student achievement. The focus started in the 1970s with school reform
being a topic of interest. In the 1980s, policies were initiated by the federal government
to hold states accountable for students performing at predetermined grade level
proficiency on state standardized tests. The issue of school reform and accountability has
remained a critical part of education policy-making since the early days (Elmore, 2004).
When President George W. Bush announced No Child Left Behind (NCLB) in
2001, there was a push for every child to succeed on a single assessment testing student
performance relative to standards adopted state-by-state. Scores were disaggregated
showing minority students were underperforming in comparison to their peers
(Muhammad & Hollie, 2012). Despite efforts of policymakers, school districts,
administrators, and teachers, schools still struggle to produce more significant numbers of
minorities and socioeconomically disadvantaged students that excel on state assessments.
The focus of reform efforts has been on districts, principal leadership and management,
and teacher professional development (Waldron & McLeskey, 2010).
According to the National Center for Education Statistics (NCES; 1996), U.S. 4th
and 9th grade students are competitive with most other countries, but according to the
National Assessment of Educational Progress (NAEP), U.S. students are significantly
lower in terms of their performance on state standardized assessments. The statistics
showed the numbers drastically decrease for Hispanic and Black students, and even more
so if the parents did not attend college (Muhammad & Hollie, 2012). These students are
often classified as Title 1 students, which means they are at-risk or low income. Federal

2
money has been given to schools with these populations to help students meet state
standards since 1965 when the Elementary and Secondary Education Act (ESEA) was
enacted into law. According to the U.S. Department of Education (ED; 2018), the gap
between White and Hispanic students is closing slowly but still exists. Despite extra
effort and money, the nation still struggles to close the achievement gap.
Background
Title I
ESEA was established in 1965 to ensure students with disabilities or otherwise
disadvantaged would be able to accelerate their academic achievement and increase their
performance on standardized tests (ED, 2004). ESEA allowed federal money to be given
to states to provide individual schools with students that met the criteria of disadvantaged
allocated funds to support such students. They called this initiative and distribution of
money Title I.
With the initiative came increased awareness of student achievement in public
schools. Traditionally, Title I schools had a large number of students who meet the
criteria of being at risk of not performing at grade level and living at or close to the
poverty line. The result was schools received more money to assist them in their efforts
to increase student achievement and help Title I students reach grade-level standards.
Between 2009-10, the federal government assisted 56,000 public schools. Annually, the
government spends over $14 billion to assist Title I schools (Malburg, n.d.).
Local Control Funding Formula and Local Control Accountability Plan
On July 1, 2013, Governor Jerry Brown signed into law the Local Control
Accountability Act. This Act initiated the implementation of the Local Control Funding

3
Formula (LCFF), which represented a new way of distributing state and federal money
and funding schools. LCFF changed the 40-year practice of money distribution and
school accountability, which previously focused on the Academic Performance Index
(API). LCFF includes parents and community members in the planning process and
requires a focus on eight areas for student success.
From LCFF came the Local Control Accountability Plan (LCAP). Districts
submit each school’s LCAP to the state. These plans follow a state template to indicate
how money given to them using the LCFF will be spent and how use of funds will be
measured. According to the California Department of Education (CDE; 2017) plans
needed to measure five areas beginning in the 2017-18 school year:
Achievement as measured by proficiency based on annual state assessments
Four-year cohort graduation rates for high schools
Another academic indicator for elementary and middle schools (e.g., growth)
Progress in English language proficiency for English language learners
At least one other statewide indicator of school quality or student success that
is valid, reliable, and comparable, such as postsecondary readiness or student
engagement
The California Dashboard
In 2017, the California Dashboard was released to report the results of the
measures. Five status levels are reported on the California Dashboard as determined by
using the following process:
The current year data (or results) for each indicator are collected for all LEAs
and charter schools statewide

4
These results are ordered from highest to lowest
Four cut scores are established based on the percentile distributions to create
five status levels (CDE, 2017)
The five status levels are very high, high, medium, low, and very low. In addition
to measuring the status level of the schools, the Dashboard calculates a change level. The
five change levels are increased significantly, increased, maintained, declined, and
declined significantly. These levels are established through the following process:
The difference in performance is calculated for all LEAs and charter schools
statewide-using prior year and current year data
The calculated results are grouped into two separate distributions:
o Positive change (arranged from highest to lowest)
o Negative change (arranged from highest to lowest)
The two distributions, both positive and negative are combined
Four cut scores are established to create five change levels based on percentile
distributions (CDE, 2017)
The Dashboard is accessible to the general population. It is a public website
where people can research school performance, much like the public exposure of the API
for individual schools was during the era of API rankings.
Smarter Balanced Assessment and Assessment of Student Performance and
Progress
In 2015, California implemented the use of the Smarter Balance Assessment
Consortium (SBAC) standardized test (CDE, n.d.). SBAC consists of adaptive English
language arts (ELA) and math tests, and ELA and math performance tasks. The tasks

5
require students to explain their problem-solving thinking processes. Tests are
administered to 3rd through 5th grade and 11th grade students. The assessments are based
on the Common Core State Standards (CCSS), which California adopted in 2010. The
SBAC scores are reported on the California Dashboard, indicating status levels and
changes over time (CDE, n.d.).
Statement of the Research Problem
Traditionally, schools with high populations of English language learners and
high poverty underperformed compared to other schools in the same districts (Dynarski
& Kainz, 2015). California tried multiple ways to intervene to change the outcomes of
standardized test scores for these populations. Implementation of the LCAP has been in
place for six years as of now. Multiple articles report difficulties regarding county
offices and stakeholder involvement; results showed implementation was difficult for
some districts with regard to the process (Blum & Knudson 2016; Garcia, 2015;
Knudson, 2014, 2016; Koppich, Humphrey, & Marsh, 2015). Parents and other
community members are to be a part of the goal-setting process, but many districts found
it difficult to involve more community members. Another finding was some districts had
a difficult time interpreting the procedure itself as some goals were not clear in the
beginning (Knudson, 2014; Koppich et al., 2015; Warren & Carrillo, 2015). No studies
examined the impact of changes made because 2016-17 was the first school year data
were analyzed to calculate change. One goal the LCAP intended was to positively
impact target populations, such as socioeconomically disadvantaged and English
language learners. California has focused on improving the success on statewide
standards for underserved population since 1996. According to the CDE (2018), schools

6
must do more with less because of cuts to funding; despite this challenge, public schools
are expected to increase student performance on standardized tests.
Purpose Statement
The purpose of this descriptive qualitative study was to identify and describe the
strategies principals of Title I schools perceive as most effective in improving ELA
scores by at least 10-point growth, through the lens of WestEd’s Four Domains of Rapid
School Improvement.
Research Questions
The central research question guiding this study was: What strategies do
principals of Title I schools perceive as most effective in improving ELA scores by at
least 10 points, through the lens of WestEd’s Four Domains of Rapid Improvement?
Research Sub-Questions
1. What strategies do principals in schools with 75% or higher Title I
populations perceive are most effective in rapid improvement, based on
WestEd’s Domain I – Turnaround Leadership?
2. What strategies do principals in schools with 75% or higher Title I
populations perceive are most effective in rapid improvement, based on
WestEd’s Domain II – Talent Development?
3. What strategies do principals in schools with 75% or higher Title I
populations perceive are most effective in rapid improvement, based on
WestEd’s Domain III – Instructional Transformation?

7
4. What strategies do principals in schools with 75% or higher Title I
populations perceive are most effective in rapid improvement, based on
WestEd’s Domain IV – Cultural Shift?
Significance of the Study
This study was significant because the success of English language learners,
foster youth, and low-socioeconomic students has been a topic of concern for the United
States (Heilig, Romero, & Hopkins, 2017; Heilig, Ward, Wiseman, & Cole, 2014; Rose
& Weston, 2013). The top-down approach to school reform has not worked in the past.
The government put policies into place and allocated money to ensure students had every
opportunity to succeed (Malburg, n.d.). One such area was Title I. Title I funding in
California is now distributed based on the LCFF. Because of local control, school
districts are given the ability to implement more diverse strategies to meet the needs of
their students.
LCFF began in the 2013-14 school year; therefore, it has been six years since its
implementation. According to Fullan (2017), it takes two to three years to implement
innovations. Because LCFF and SBAC are relatively recent initiatives, few studies were
conducted on the topic of SBAC scores in relation to LCFF as implemented in schools
with a high Title I population. The Dashboard was established in 2017; therefore, student
SBAC scores and score changes over time became available after implementation of
LCFF. Implementation of these new processes is the latest effort for California to affect
change in public schools.
With implementation of the LCFF and California Dashboard, limited research
examined whether this process is effective for Title I schools. In the past, there was a

8
lack of accountability for the effectiveness of school plans coupled with a lack of increase
in test scores. Title I students consistently underperformed in comparison to other
students on standardized tests. Millions of dollars were infused into school budgets to
address the needs of English language learners, socioeconomically disadvantaged
students, and foster youth with the intent of providing more interventions and resources
for qualified students. In the past, these methods were ineffective. LCAP was put into
place to hold all local educational agencies (LEAs) accountable for meeting the goals set
in their plans and execution of those plans for their districts.
This study focused on elementary schools in which 75% of the school’s
demographic includes students who qualify for Title I assistance. Looking at the LCAP
implementation specifically on this population gave a clear picture of whether changes
executed by the state affected the outcomes of these students in comparison to previous
years, as measured by SBAC results available on the California Dashboard. This study
was significant because the generated data were important for Title I recipients. Because
the Dashboard became easier to navigate, many more schools are using it to identify the
successes and gaps in their instruction. Using the Dashboard as a tool for this study, the
research highlighted the strategies implemented by consistently lower-performing schools
to allow for other low performing schools to duplicate.
Definitions
Achievement Gap. The gap between Caucasian students on the state test as
compared to those of another race.
Culture Shift. Engaging teachers, parents, and students in student learning by
focusing on learning and goals established to show academic growth.

9
Every Student Succeeds Act (ESSA). A law signed by President Obama in
2015 to ensure equal opportunity education to all students for success in college and
career.
Instructional Transformation. Stakeholders create the best learning
opportunities for students through curriculum, differentiation, and removing barriers.
Local Control Accountability Plan (LCAP). A tool for LEAs to set goals, plan
actions, and leverage resources to improve student outcomes.
No Child Left Behind (NCLB). A law signed in 2002 bringing accountability to
the nation’s schools and exposing the achievement gap.
Smarter Balanced Assessment System (SBAC). A system of computer-based
tests and performance tasks allowing students to show what they know and can to do. It
is based on the CCSS for ELA and mathematics and has three components designed to
support teaching and learning throughout the year: summative assessments, interim
assessments, and the digital library of formative assessment tools.
Strategies. Actions implemented in a school setting involving administrators,
teachers, students, and stakeholders to help all students be successful in school.
Student Success. The overall performance of students based on the SBAC
assessment given to 3-5th grade students; success is based on the average scores as
determined by the CDE.
Talent Development. Supporting and training teachers on the best ways to
instruct students.
Title I. Established in 1965, this Act placed federal focus and funds for closing
the achievement gap.

10
Turnaround Leadership. Leaders who creates change in their sites by
implementing strategies that support learning.
Delimitations
The study was delimited to principals of K-5 public schools in northern California
with schoolwide Title I programs that experienced a gain of at least 10 points on the
SBAC standardized test.
Organization of the Study
Chapter I introduced the overall topic of the study and its intended framework.
Chapter II takes an in-depth look at literature regarding the implementation of LCFF,
LCAP, and SBAC. Chapter II also investigates the population of Title I students who
comprise at least 75% of the school’s population. The review of literature was used to
discuss student performance trends on the California ELA SBAC assessment among Title
I schools and preparation strategies impacting improvement. Chapter III encompasses
the methodology of the study. It includes the research design, data collection process,
population, sample, and data analysis procedures. It also exposes the limitations of the
study. In Chapters IV and V, the researcher reports data found during the study. After
collecting the data, they were analyzed conclusions were drawn. The results determined
final summaries, conclusions, and recommendations for future research. References and
appendices are provided at the end.

11
CHAPTER II: REVIEW OF THE LITERATURE
This chapter reviews the literature related to this study. This section discusses
eight different areas. The first section examines the history of public education,
including the Elementary and Secondary Education Act (ESEA), Every Student Succeeds
Act (ESSA), and Title I, which was put into place to ensure equal education for all
students. The second section discusses the Local Control Funding Formula (LCFF),
which is the formula California uses to determine the funding given to districts, and the
Local Control Accountability Plan (LCAP), which school districts are required to
complete with the input of several stakeholders. The third section examines three
populations upon which the study is based and their performance; these are qualified
Title I students classified as English language learners, foster youth, and/or
socioeconomically disadvantaged students. The fourth section lists some of the strategies
often implemented in a district’s LCAP. The fifth section discusses the history of
educational funding in California public schools and the State’s contributions. The sixth
section explores the California standards assessments and implementation of the Smarter
Balanced Assessment Consortium (SBAC) standardized test. The seventh section
introduces the new California Dashboard as a way of reporting and analyzing data based
on district administration of the SBAC. The last section discusses the theoretical
framework used for the study. The selected framework for this study, Four Domains for
Rapid School Improvement, is a product of researchers at WestEd (2018).
History of Funding for Public Schools
The U.S. public school system is in crisis (Friedman & Mandelbaum, 2011).
Students are performing far below the national average, yet more money is being spent

12
on education (Lips, n.d.). Low performance and an increasing gap between Caucasians
and ethnic minorities added to America’s education crisis (Friedman & Mandelbaum,
2011). The U.S. needs a new vision for success to overcome its lagging performance
(Freidman & Mandelbaum, 2011).
The beginning of public education started in the 1600s as religious institutions
aimed to indoctrinate children to the ways of the church. However, during the 1700s,
Thomas Jefferson and other education reformers pushed for a more secular model of
education. Jefferson suggested two educational tracks, one for scholars and one for
laborers. Under these two tracks, those who showed academic potential were educated
formally in schools, whereas the less academically inclined received a different kind of
education focused on factory work and vocational education (Bosse, 2013; Goldsmith, &
Speckart, 2017). In the 1800s, the prominent citizens of the time (e.g., Guggenheim,
Rockefeller, Morgan) started to realize they needed to educate the masses to instill a
proper work ethic and sense of civil loyalty that would ultimately benefit their companies
(Goldsmith & Speckart, 2017). Schools during this time were called charity schools and
sponsored by the elite (Goldsmith & Speckart, 2017). Some of the influential educational
reformers of the times had hopes of creating a place whereby the diverse population
could understand each other and communicate better with each other (Wisconsin
Department of Public Instruction [DPI], 2017). By the 1900s, rural areas had little
money to fund schools and private schools were being maintained by the tuitions
provided by wealthy parents (DPI, 2017). The general population went to school to show
they could get through the mundane, rote recitation of facts and would be able to work in
factories or perform other types of repetitive manual labor (Goldsmith & Speckart, 2017).

13
Since the advent of organized schooling, teachers continuously tested students in
both formal and informal ways (Goldsmith & Speckart, 2017). Teachers designed
opportunities for students to meet expectations set by parents and the community. In
addition to providing teacher feedback about student performance, tests also served a
broader managerial purpose. From the perspective of school reformers, tests helped hold
all schoolmasters accountable for the learning of their students; they provided a way to
ensure appropriate learning was happening in the schools (Goldsmith & Speckart, 2017).
One early school reformer who significantly influenced the phenomenon of
standardized testing within the American school system was Horace Mann (DPI, 2017).
He got the idea for implementing a standardized testing system by visiting Europe. Mann
proposed to train and hire more female teachers, hire a superintendent to monitor the
schools, and use the results from the standardized assessments to promote and retain
teachers (DPI, 2017). The first tests were paper- and pencil-based and intended to show
the performance of students in public schools (Kaestle, n.d.). When the population
started to change and more immigrants entered the United States, the focus on testing
increased. In the military, IQ tests were used to inform recruiters about which men
would be good soldiers. Many of the officers in the military were against this type of
testing because they feared the tests would reflect negatively on their intelligence
(Kaestle, n.d.).
Eventually, the military stopped using the IQ test in favor of other forms of
testing aligned with the targeted needs of the military (Kaestle, n.d.). However, the
public school system continued to use IQ tests to categorize and classify students. A
heavy influx of immigrants began attending schools and officials wanted to ensure

14
students met at least minimum requirements for learning. At higher levels, IQ tests were
administered by colleges that wanted to extract highly intelligent students from the
general population to educate a cadre of elite minds. In 1908, the first standardized
achievement test was created. This achievement test assessed math performance skills.
Shortly after this math test was developed, a handwriting test and spelling test were
developed. Then, many more achievement tests followed. Each subject had its own
instrument by which to measure whether students were meeting performance
expectations. Because of the diverse range of criteria tested and many data points subject
area assessments offered, IQ tests quickly lost traction in the educational setting. By the
1920s, the achievements tests, which were multiple choice and could quickly be analyzed
by experts, were the preferred instrument for measuring learning (Kaestle, n.d.). In the
1940s, after World War II, many more students enrolled in high schools across the
nation, and by the 1950s, an increase in demand for a more rigorous education was called
for by government leaders due to the launch of Sputnik, a Soviet feat many attributed to a
superior education system, especially in the area of math and science (Herpin, 2014).
During the Civil Rights Movement in the United States in the 1950s, assessments
were critiqued because of the poor results of oppressed classes of students, especially
students of color. Initially, the tests were used to place students with poor scores into a
track, including a track for mentally retarded students developed for those who scored
poorly. Soon after, Public Law 94-142, the Education of All Handicapped Children Act,
was adopted, which focused on assessment outcomes. A distinct gap was apparent
between Caucasian students and students of color. A primary focus of the education
system during the 1960s was closing the achievement gap between upper-socioeconomic

15
Caucasian students and lower-socioeconomic ethnic minorities. In 1965, ESEA and Title
I were passed. The educational focus on closing the achievement gap coincided with the
push for integration on the social front.
The Elementary and Secondary Education Act
ESEA was passed for federal money to be given to schools to address disparities
of the achievement gap so low socioeconomic and minority students would perform at
the same level as their peers (Standerfer, 2006). During the 1960s, the country was in
transition with the sociopolitical focus being on civil rights and equality for all
backgrounds. The country fought for the end of segregation, especially for African
American students, and for equal rights for children with differing abilities. The political
environment of the time added pressure for policymakers to enact changes in society and
education. During Lyndon Johnson’s presidency, several initiatives were developed,
including Head Start, Medicare, and Medicaid. Education was included in the civil rights
law (McClure, 2008). Workforce training and low-income neighborhoods were
beneficiaries of the new legislation, as well as students who did not speak English at
home. ESEA directed Title I funding toward these targeted populations.
Title I
The policy of Title I, Improving the Academic Achievement of the
Disadvantaged, was implemented in 1965 (McClure, 2008). The purpose of Title I
remains to provide students a fair and equal opportunity a high-quality education (ED,
2004). Title I schools are those with many students at risk of not performing at grade
level and/or living close to the poverty line. Schools in which most students meet this
description are given federal money to help provide the means to influence academic

16
success. The federal government started to recognize public schools needed financial
support in 1965 when they established ESEA. This Act intended to ensure disabled and
disadvantaged students would be able to meet the requirements of all other students.
Title I funding is one of the longest-lasting interests of the federal government. Title I
was passed with the following purposes:
Ensuring high-quality academic assessments, accountability systems, teacher
preparation and training, curriculum, and instructional materials are aligned
with challenging academic standards so students, teachers, parents, and
administrators can measure progress against common expectations for student
academic achievement
Meeting the educational needs of low-achieving children in high-poverty
schools, limited English proficient children, migratory children, children with
disabilities, Indian children, neglected or delinquent children, and young
children in need of reading assistance
Closing the achievement gap between high- and low-performing children,
especially the achievement gaps between minority and non-minority students
and between disadvantaged children and their more advantaged peers
Holding schools, local educational agencies (LEAs), and states accountable
for improving the academic achievement of all students and identifying and
turning around low-performing schools that failed to provide a high-quality
education to their students, while providing alternatives to students in such
schools to enable the students to receive a high-quality education

17
Distributing and targeting resources sufficiently to make a difference to LEAs
and schools where needs are greatest
Improving and strengthening accountability, teaching, and learning by using
assessment systems designed to ensure students are meeting challenging
academic achievement and content standards, and increasing achievement
overall, but especially for the disadvantaged
Providing greater decision-making authority and flexibility to schools and
teachers in exchange for greater responsibility for student performance
Providing children an enriched and accelerated educational program,
including the use of schoolwide programs or additional services that increase
the amount and quality of instructional time
Promoting schoolwide reform and ensuring children have access to effective,
scientifically based instructional strategies and challenging academic content
Elevating the quality of instruction by providing staff in participating schools
with substantial opportunities for professional development
Coordinating services under all parts of this Title with each other, with other
educational services, and to the extent feasible, with other agencies providing
services to youth, children, and families
Affording parents substantial and meaningful opportunities to participate in
the education of their children (ED, 2004)
Despite the continued investment in California schools, schools with high
populations of English language learners, low socio-economic students, and foster youth
continue to underperform in comparison to the mainstream students. According to the

18
Lansner (2018), California is just under the per-pupil spending average for the Nation at
$11,495 per student and is ranked 30th for reading abilities overall.
In 1968, Kappel launched the first national assessment sponsored by the Office of
Education. It was called the National Assessment of Educational Progress (NAEP). The
assessment was first implemented during the 1969-70 school year. New versions of the
test were developed as the government adjusted and reevaluated the test to help with
standardization (Kaestle, n.d.). In 1988, NAEP was used to look at student progress
across states, which gave the government a picture of how the nation was progressing.
During the 1970s, groups advocating for equality for children and adults with
different abilities demanded closure of government institutions housing these populations
so they could be closer to home and attend comprehensive schools. The institutions were
known to be warehouses for the mentally and physically challenged. In 1975, the
Education for All Handicapped Children Act was passed, which required Individualized
Education Plans (IEPs) to be written and implemented for students who qualified for
special education services. This Act was reauthorized as the Individuals with Disabilities
Education Act (IDEA) in 1997 and again in 2004 CDE, 2017). For the specific services
to be carried out, teachers in both general and special education needed support.
Simultaneous to the focus on U.S. education, its assessment outcomes, and
national diversity, A Nation at Risk was published in 1983; it stated, “If an unfriendly
foreign power had attempted to impose on America the mediocre educational
performance that exists today, we might well have viewed it as an act of war” (National
Commission on Excellence in Education, 1983, p. 1). This era produced other
publications focused on the American education system.

19
Despite discussions for schools to teach beyond what is measurable on
standardized tests, the 1980s and 1990s placed more emphasis on accountability and
standardized testing. President George H. Bush was elected into office in 1989 and
placed a heavy emphasis on education reform based on assessment data. By the 1990s,
content standards and performance standards were a common theme for public education.
Although some advocated for a portfolio style or authentic assessment, the common
multiple-choice, content standards-based assessments received state support.
In 1993, President Bill Clinton was elected and enacted the Goals 2000
legislation, which continued the involvement of the federal government in public
education. This initiative required all states to write standards and submit them for
approval. The development and implementation of this legislation was a slow-going
process for the administration. In 2002, President George W. Bush signed the No Child
Left Behind Act (NCLB). With this act, scores were disaggregated by class and race.
The implementation of this legislation helped to expose where students were falling short
of meeting standards. During this time, data were analyzed to help evaluate schools in
terms of student improvement on the assessment, with threats of reconstitution if schools
could not show they were making improvements or adequate yearly progress. A lack of
adequate yearly progress indicated a school was failing and in need of improvement. The
schools in the program improvement category could receive more money and resources
to advance toward expected outcomes.
The high expectations demanded by the legislation rendered NCLB
unmanageable with regard to all students meeting the requirements the Act proposed. In
2010, President Obama recognized and responded to the need for new law to ensure the

20
readiness of students for college and career. In 2015, the Every Student Succeeds Act
(ESSA) was signed into law, replacing NCLB (CDE, 2017).
Local Control Funding Formula and Local Control Accountability Plan
LCFF was enacted in 2014 to enable school districts to provide more resources to
support students in low socio-economic schools. LCFF is intended to provide extra funds
for services to “support students who face the biggest obstacles in achieving academic
proficiency, graduating, and being college and career ready” (Fix School Discipline, n.d.,
para. 1). The measures include academic performance and culture and school climate
factors. With the implementation of LCFF, districts have more flexibility to decide how
to spend money to ensure students have the resources to achieve academic success
(California State Parent Teacher Association [PTA], 2018). The previous system based
funding on the number of students in attendance, also known as average daily attendance.
With the new formula, funds are augmented per qualified student with extra funding to
support low socioeconomic students, foster youth, and English language learners (PTA,
2018).
LCAP is a plan developed and turned into the state to hold schools, districts, and
county offices accountable for the students they serve. The plan documents state and
federal spending of funds given to LEAs based on the LCFF. This formula allows for
counties to distribute designated money to districts to provide extra supports to schools
with a high number of Title I students. In the past, the changes and interventions districts
implemented for struggling schools were top-down. With LCAP, all stakeholders can
participate in a conversation about what changes need to be made to improve student
success in school, which includes parents and community members.

21
The LCAP follows a template school districts are required to submit to their local
school boards and jurisdictional county office of education for approval. Per the CDE
(2017) requirements, the LCAP focuses on five areas:
Achievement as measured by proficiency based on annual state assessments
Four-year cohort graduation rates for high schools
Another academic indicator for elementary and middle schools (e.g., growth)
Progress in English language proficiency for English language learners
At least one other indicator of school quality or student success that is valid,
reliable, comparable, and statewide (e.g., postsecondary readiness, student
engagement
Critics of the LCAP say it falls short of impacting the populations it was intended
to support. After reviewing 50 school districts, the Legislative Analyst Office found
there was not a specific amount of money directed to the designated populations. They
also observed the wording in the document was vague and did not specifically name the
individual populations. It grouped all students into one category (Garcia, 2015). The
strategies assigned to schools implied they would benefit all students. Another criticism
exposed was that despite requiring stakeholders to be a part of the changes, groups
representing designated populations of English language learners, foster youth, and low
socioeconomic students were not necessarily represented in the conversations.
Populations Focused on for LCFF/LCAP
The populations focused on in the LCFF and LCAP are those meeting the criteria
for Title I. They include English language learners, foster youth, and low socioeconomic
students.

22
English language learners. English language learners are a group of students
who qualify for Title I funds. The United States experienced an influx of immigrants
during the establishment of the school system. Increasingly, immigrants in California
come from Latin American countries, continuously adding to California’s already diverse
population. Families migrating to California were establishing homes and needed their
children enrolled in the public school system. With increased accountability and a
shortage of teachers, ESSA made policymakers and administrators look for new ways to
improve student learning in schools and provide support for teachers. However,
immigrants are not the only population comprising English learners in the United States.
As of 2014, 76% of elementary school and 56% of secondary school English language
learners were born in the United States and more than half of those in secondary school
are second- and third-generation U.S. citizens (National Education Association, 2010).
Teachers found it difficult to relate to the minority groups of children and their
families (McClure, 2008). In current times, bilingualism and biculturalism are important
to the California school system. Although most schools embraced the need of family
involvement in their child’s education and began implementing programs encouraging
bilingual education, where students are instructed in English and another language, others
prioritized learning English first. In California, students who attend bilingual immersion
schools often already had a multi-lingual background. For example, if a child from
Ethiopia speaks Amharic at home, his parents may enroll him in a Spanish bilingual
program where he is learning Spanish and English in addition to his home language of
Amharic.

23
After it was implemented, the LCAP offered districts within the California public
school system another way to exhibit English language learner growth. LCAPs allowed
California to report English language learner status regarding specific assessments that
analyze student progress specifically in learning English. When NCLB was initiated,
English language learners status was based on how this specific group of students
performed on the state standards assessment. Now, they are rated on how they do on the
California English Language Development Test (CELDT) or English Language
Proficiency Assessments for California (ELPAC) initiated in 2018.
Foster youth. Foster youth are another group described under the Title I
umbrella. Foster youth in the California public school system faced many obstacles
preventing them from showing as much success as the general population. This
population underperformed on state standards because of the amount of movement
typical for foster youth. On February 11, 2014, CDE publicized a letter written by Will
Lightbourne, Director of the California Department of Social Services, informing the
education system it would now be easier to exchange information between schools to
ensure student educational experiences remained as continuous as possible, as mandated
by the Uninterrupted Scholars Act (Public Law 112-278).
With the implementation of LCAP, foster youth are reported separately to analyze
how schools and districts are specifically accommodating the needs of this population
(CDE, 2017). The amount of money districts receive under LCFF is evaluated based on
the performance of these students.
Low socioeconomic students. Students of poverty are classified as Title I
students. These students are also a subgroup represented in the Dashboard. Typically,

24
this group of students is targeted because they underperform as compared to non-poverty
students. They face unique situations middle-class students may not. According to the
CDE (2018), some of these experiences include:
Low birth weight, led poisoning, hunger, lack of healthcare, and poor nutrition
Parent unavailability as a role model or active participant in a child’s
education
High mobility as parents seek work or affordable housing
Children from low socioeconomic backgrounds also experience situations where
their houses are overcrowded and do not offer a quiet place to do their homework, study,
or sleep. Studies also showed children in low-income homes experienced a conversation
gap. Parents of middle-class families tended to reason with their children and teach them
negotiating skills they use in school. Low-income children are typically ordered to do
things, which is what they may experience in their own work world (CDE, 2018).
When President Trump was elected, he stated, “Millions of poor, disadvantaged
students are trapped in failing schools” (Brown, 2017, p. 1). Some believe the integration
of schools is the way to address the problems of low-income students. Vouchers and
private schools were also suggested. California’s current approach to the problem of
income disparity and low student performance is through the LCFF and LCAPs.
Funding for California Schools
Before 1965, California spent more money per student than the national average.
After 1965, even more money was allocated to California public schools and this money
was intended to support the needs of underachieving students. The legislation helping
turn the reform focus toward assisting underperforming students was ESEA in 1965. It

25
was from this legislation Title I funding found its origin. Title I funding forced the states
to reallocate money to provide for students who were traditionally underrepresented.
The funding for California schools relied heavily on local taxes. State and local
property taxes comprised most of the funding for public schools. In 1978, Proposition 13
was passed. Proposition 13 cut property taxes, which was the significant resource of
funding for the education system. Under Proposition 13, property owners paid 60% less
in property taxes. The law also limited tax increases and restricted districts from
increasing rates. After the introduction of Proposition 13, California per-student funding
fell below the national average.
In 1988, Proposition 98 was passed (California Budget Project, 2006). This
allowed the state to adjust the budget for schools based on the economy of the state. The
funding came from a formula calculated from the state general funds, which could be
adjusted based on inflation and enrollment. Despite the new formula, it was debated as to
whether Proposition 98 was significant enough to provide for the needs of the students.
Proposition 111 modified Proposition 98 in 1990. This proposition put a cap on the
percent of spending of general fund revenues. Therefore, the amount of money spent on
each student continued to stay below the national average (California Budget Project;
2006).
In 2012, the California Teachers Association and Governor Jerry Brown pushed
for Proposition 80, The Schools and Public Safety Protection Act. This proposition
increased sales taxes and income taxes for people who earned enough to classify them as
higher earners. Despite all the changes, California still provides less money to students
compared to the national average.

26
In 1997, the Standardized Testing and Reporting (STAR) program was used for
grades 2-11 to determine progress. All students in grades 2-11 were tested in English,
reading, writing, spelling, and math. These tests were norm-referenced and approved by
the California State Board of Education. In 1999, California used these assessments to
rank schools based on the calculations using the Academic Performance Index (API).
This system of measurement was enacted to hold schools accountable for the results of
the STAR test. In 2001, ESEA was reauthorized by President Bush as NCLB. With this
change came a new accountably action, Adequate Yearly Progress (AYP). The STAR
results from 2001 were used to establish the baseline year. About 50% of schools were
able to make growth each year (CDE, 2017). Schools unable to meet their growth targets
from year to year were placed into program improvement status. These schools were
closely monitored and provided interventions by way of a School Assistance Intervention
Team (SAIT). This team monitored student progress and interventions throughout the
school year. They ensured the implementation of essential program components:
Use of state-adopted (K-8) or standards-aligned (9-12) English language arts
(ELA) and math instructional materials, including intervention materials
Instructional time adhering to prescribed instructional minutes for ELA and
math (K-8) or access to standards-aligned core courses (9-12)
Participation of principals in the School Administrator Training Program, as
adopted in Assembly Bill (AB) 430 (Chapter 364, Statutes 2005) on state-
adopted instructional materials

27
Engagement of fully credentialed, highly qualified teachers and universal
participation of ELA and math teachers in the Senate Bill (SB) 472
professional development program on state-adopted instructional materials
Implementation of a student achievement monitoring system that uses data to
monitor student progress on curriculum-embedded assessments and to modify
instruction
Ongoing instructional assistance and support for teachers via content experts
and instructional coaches
Monthly teacher collaboration by grade level (K-8) and department (9-12)
facilitated by the principal
Use of lesson and course pacing schedules (K-8) and a master schedule
flexibility for a sufficient number of intervention courses (9-12)
District alignment of state categorical flex funds and federal School
Improvement Grants funds awarded to schools needing additional resources to
meet the demands of changes in state requirements (Sigman, 2008)
In 2008, the Obama administration initiated a new school reform known as Race
to the Top (RTT). RTT, although significantly different from NCLB, was still founded
on the results of standards-based assessments and reflected on the results to rank schools.
More money was used to develop professional development opportunities for teachers.
Under RTT, the instructional focus became the Common Core State Standards (CCSS),
which aimed at getting students to practice more meta-cognition by analyzing and
articulating their thought processes while solving problems. This new way of teaching

28
required a new way of assessing students that reflected the depth of knowledge standards
teachers were attempting to inculcate in their students.
Smarter Balanced Assessment Consortium
In 2010, California adopted the CCSS. A need surfaced for a new assessment to
reflect the style of teaching expected in the schools. The SBAC standardized test was
implemented as a way to assess student progress based on the new CCSS, which were
focused on student preparedness for college and career. The SBAC given to grades 3-8
and 11. The assessment involves an adaptive computer-based test and a performance
task; both the adaptive test and performance task use the CCSS for criterion referencing.
The performance tasks include open-ended questions requiring students to demonstrate
their thought process using words or pictures. The questions are designed to assess
critical thinking, writing, and problem-solving. The test was first administered in 2013 as
a pilot with level sets determined in 2014.
The California Dashboard
Since 1997, California implemented different systems to monitor performance on
standardized tests. They created ways to track how students who meet the qualifications
of Title I are performing on these tests over time. The newest method is with the
California Dashboard. It is a public reporting system about the achievements of schools
in varying subcategories. In 2017, CDE replaced the API and AYP with the California
School Dashboard Report, which was a way to indicate the performance of individual
schools. The information “is calculated based on the combination of current performance
(Status) and improvement over time (Change)” (CDE, 2017, p. 15). This indicator allows

29
the public to access county, district, and schoolwide data overall and as individual
subgroups, including those classified as socioeconomically disadvantaged.
Additionally, California provides a performance level, organized by color and
divided into five segments. The colors denote the level to which the students and schools
are performing. These levels are disaggregated both by individual groups and overall
measures with indicators based on LCFF criteria. The reports provide both state and
local indicators to include a broader picture of schools’ individual progress. These
indicators include basic services or basic conditions at schools, implementation of state
academic standards, parent engagement, student achievement, student engagement,
school climate, access to a broad course of study, and outcomes in a broad course of
study. The county offices are responsible for two other local indicators: coordination of
services for expelled students and coordination of services for foster youth (Appendix A).
The performance of each of these areas determines if the organizations are eligible for
further assistance or in need of intensive support and intervention. Schools are rated on a
color system in which blue signifies the highest level of performance, followed by green,
yellow, orange, and red.
Another report available on the Dashboard is the status and change report. This
report indicates the change of performance over time. LCFF and LCAP have now been
implemented for six years and, therefore, data are available for analysis and comparison.
The changes in the data are reported on the status/change report. The change portion of
the report indicates the change over the last two years.
The scores are calculated based on five levels. Colors represent the five levels,
red being the lowest performing (1), followed by orange (2), yellow (3), green (4), and

30
blue being the highest performing (5). Level 3 indicates the standard of the appropriate
grade level is met. “Once all students’ scores are compared to the fixed point on the scale
(Level 3), the distance results would be averaged to produce LEA, school, and student
group results” (CDE, 2017, p. 45). SBAC is only given to those students in grades three
through five in addition to 11th grade. For this study, only the elementary schools were
used. The assessment scores reflect grades three through five. These scores could reflect
the implementation of the LCAP strategies within the entire school setting and
specifically for the Title I population. These scores were recorded and then organized in
an ordinal measurement scale. Ordinal measurement is a way of organizing groups in
which the order or ranking in which they are presented is meaningful (McMillan &
Schumacher, 2010). California established the Dashboard as its primary reporting
system. The Dashboard is based on the California Model, which includes the status
report and change report. The Dashboard allows an at-a-glance view of how schools are
progressing over time with their respective implementations of the LCFF and LCAP.
Theoretical Framework
Fullan (2006) discussed the fact that many change models implemented in the
school systems are missing an important component, motivation. Fullan (2006) posited
that, on their own, so many models fall short without the necessary ingredient of
motivation. Anderson and Ackerman-Anderson (2010) promoted a change model with
quadrants: mindset, behavior, culture, and systems. Although this model addresses many
of the same topics, the framework chosen for this study was taken from WestEd studies.
WestEd is a nonprofit agency focused on research, service, and development to help
every child attain academic success. Members of the Center on School Turnaround at

31
WestEd and members of the Network of State Turnaround and Improvement Leaders
Advisory Council created this framework. It is released in the document Four Domains
for Rapid School Improvement (WestEd, 2018). The four domains are turnaround
leadership, talent development, instructional transformation, and culture shift. Within the
four domains, examples of success are stated to help schools implement the framework.
These examples are not sequential and therefore, principals can evaluate which examples
they want to implement and moderate the degree of focus given to each (Figure 1).
Figure 1. Four domains of rapid school turnaround. Source: WestEd, 2018
Evidence of a turnaround in leadership is reflected by improved communication,
goal setting, and targeted support systems being established (Day, 2009; WestEd, 2018).

32
According to Anrig (2015), research was done to observe the commonalities of a
successful turnaround leader. One of the five areas indicated was teacher lead
collaboration about data and classroom instruction. According to the model described by
Anrig (2015), collaboration should be teacher led with principal support. Other areas
Anrig (2015) discussed were creating a safe environment, offering in-class and out-of-
class support for students with things like tutoring for specific subjects, ensuring all
parents and community stakeholders are involved in the culture of the school, and
bringing in outside consultants for a limited amount of time. These outside agencies
should be showing teachers how to maintain the change on their own. A turnaround
leader must have self-confidence and believe change can happen. A turnaround leader
can take the strongest competencies and create a climate in which others will follow and
implement the vision (WestEd, 2018).
Evidence of talent development is reflected by an organization’s ability to recruit,
develop, and retain talent; target professional learning opportunities; and set clear
expectations (WestEd, 2018). According to the California Teachers Association (CTA;
2018), 20% of all new teachers hired in California leave the profession within three years.
In urban sites, the number increases to 50% in five years (CTA, 2018). Studies
completed related to teacher retention also showed the effects on students. Effective
teachers who left the profession created a decline in student performance at that school
whereas when ineffective teachers, there was no change (Papay, Bacher-Hicks, Page, &
Marinell, 2017).
Brown and Wynn (2007) studied new teachers and principals to identify the key
to retaining teachers. They found three leadership factors in which teachers were more

33
likely to stay at their school. First, principals had a proactive approach to situations
rather than reactive. Second, principals understood the challenges new teachers had to
face and responded in a way to support them. Third, principals looked for ways to
improve their leadership and promoted growth and excellence for their teachers and
students (Brown & Wynn, 2007).
Another way found to be a strong factor was teacher support in via Beginning
Teacher Support and Assessment (BTSA), and professional learning communities (PLCs;
Brown & Wynn, 2007; Papay et al., 2017). New teachers stayed when given the right
support for them to be successful in the classroom. By using mentor teachers, coaches,
and other faculty to support new teachers, principals can learn and mentor side-by-side to
create effective learning environments. This mentoring should include: “learning
experiences that are differentiated, purposeful, targeted, employed in rapid response to
identified needs, reflective of what is known about effective adult learning, and clearly
connected to the school’s turnaround priorities” (WestEd, 2018, p. 14).
Implementation of PLCs was one way some districts found they could address
these concerns. Many districts opted to implement PLCs to improve student scores. To
begin the process of implementing change in a school, teachers first must be motivated
and put into action the steps that transform the idea of change into reality (Hord, 1997).
Effective PLCs are built upon three main pillars: ensuring students learn, having a culture
of collaboration, and focusing on results (DuFour, 2004).
The first pillar is ensuring students learn (DuFour, 2004). This requires staff
change the mindset of being in front of students to teach them, to helping students learn
what they are instructing. This means re-teaching for students who did not master the

34
lesson the first time. Often, teachers are forced to move forward with content because of
a pacing guide or expectations of finishing the content in the time allotted. When pacing
is too fast, students who did not understand are left behind. DuFour’s (2004) solution to
this problem is to expect the staff to focus on ensuring all students learn by implementing
strategies aligned with standards, offered in a timely manner, and based on intervention
rather than remediation and directive.
The second big idea from DuFour (2004) was creating a culture of collaboration.
He emphasized collaboration should not be confused with camaraderie; it does not
involve groups coming together to make logistical decisions, such as determining yard
duty schedules. Collaboration refers to being able to provide teachers with time to
strategically analyze data and create deep meaning as to how to make their teaching
better (DuFour, 2004). Senge (1990) discussed the idea of a learning organization in his
book The Fifth Discipline. A learning organization is defined as an organization “where
people continually expand their capacity to create the results they truly desire, where new
and expansive patterns of thinking are nurtured, were collective aspiration is set free, and
where people are continually learning how to learn together” (Senge, 1990, p. 3). The
belief students can learn and teachers can work effectively together is reciprocal. When
teachers feel good about what they are doing, students succeed. When students succeed,
teachers’ self-efficacy increases; this dynamic creates success (Lee, Smith, & Croninger,
1995; Lieberman, 1995). Hattie (2008) stated teachers need to recognize when students
are successful, should take credit, and should be confident in defending they caused
learning.

35
DuFour’s (2004) last big idea was to focus on results. For this idea, teachers use
data to focus on the improvement of student results. They come together to analyze
predetermined formative assessments and discuss the results specific to each classroom.
However, PLCs may be watered down and implementation would not have all that was
intended. In this case, like so many others in education, implementation would be
dropped because it did not work (DuFour, 2004).
The third domain of the Rapid School Improvement framework was instructional
transformation (WestEd, 2018). Evidence of instructional transformation is reflected by
student needs being addressed, evidence-based instruction being utilized, and
opportunities being created. With implementation of NCLB, schools felt the pressure of
trying to meet the needs of all students. Populations were separated so they could be
analyzed by the schools, districts, and governing bodies involved with education. In
addition to academic instruction, attention was paid to the environment in which the
students were learning (DuFour, 2004). “Young people need more connections, more
support, more opportunities, and more learning time to be successful” (Blank, Jacobson,
& Pearson, 2009, p. 1). Relationships between students, parents, staff, and the
community begin to be addressed to support the whole child.
Districts look for a standards-based curriculum addressing the individual needs of
students (Gustafson & Branch, 1997). A new curriculum is developed to integrate
teaching content with ongoing assessments to incorporate individual interventions for
every student. Along with the new curriculum and the emphasis on student performance
comes the importance of creating time for teachers to plan together. This planning time
usually includes data analysis and the plan to address the needs of the students who do

36
not make the grade. Another factor increasing the effect of instructional transformation is
having leadership and staff share the vision and understand why the changes need to
happen; this mindset provides opportunities for the staff to evolve with the changes in the
organization (Dweck, 2006).
One way some schools in California addressed the need to individualize
instruction was to implement response to intervention (RTI) programs. RTI emerged
from the reauthorization of the IDEA in 2004 (Preston, Wood, & Stecker, 2016).
According to the National Association of State Directors of Special Education (2005),
“RTI is the practice of providing high-quality instruction/intervention matched to student
needs and using learning rate over time and level of performance to make important
educational decisions” (p. 3). There is no one way to implement RTI and it varies
depending on the resources and educational setting (Kratochwill, Clements, & Kalymon,
2007). The purpose of RTI is to help students improve academically and behaviorally.
Data are used to identify and plan for students who are struggling. The Center on
Response to Intervention (2010) identified three areas of RTI: primary (students who
receive core instruction and curriculum), secondary (students participate in intensive
supports), and targeted (students receive individualized and customized supports to
address their needs). Hattie (2015) stated RTI can be used for all students, not just those
struggling. Using the RTI model, all students fall into one of the three categories of
implementation.
The last domain of the framework for rapid school improvement is to create a
cultural shift (WestEd, 2018). Evidence of a culture shift is reflected by the creation of a
community focused on student learning, one that includes all stakeholders and involves

37
students and parents in creating and pursuing educational goals. In this domain, the
discussion of the whole community is emphasized. One indicator of a successful cultural
shift is community involvement in creating and meeting the goals set forth in the LCAP.
This document requires the school to include all stakeholders in the community to help
make decisions affecting the schools. Epstein (2000) stated researchers looked at support
programs for lower-income students such as Head Start since the 1960s, but were yet to
study the effects of home life on school and vice versa. The research was usually on how
home life or school impacted the student. In the 2000s, the focus shifted toward trying to
bridge the two to include the families in the education of the students.
Another reflection of California viewing the cultural shift being of great
importance is the fact attendance and suspension rates are now recorded and reported on
the California Dashboard. According to Chang and Romero (2008), if a student from a
lower-income family is chronically absent in kindergarten, it is predictable he will
struggle in fifth grade. They suggested if a student misses 2-4 days in September, he is
more likely to miss an entire month of school. For schools to have great attendance, they
need to provide an engaging experience for both students and parents. Chang and
Romero (2008) emphasized the need for parents and students to become part of the
learning community and encourages leadership and staff to provide engaging activities
that include all stakeholders.
All the four domains working together in an organization are needed to make a
transformation. The four domains (turnaround leadership, talent development,
instructional transformation, and cultural shift) need to be considered to create effective,
sustainable change.

38
Summary
Many public schools with a high percentage of socioeconomically disadvantaged
students are struggling to perform equally in relation to their non-Title I counterparts.
For over 40 years, the federal government has been implementing different methods to
try to address the needs of these students. In 2013, California initiated the LCFF and the
LCAP to give schools, districts, and counties more control of the extra money allotted to
them to provide interventions for their underserved students. The idea behind local
control of funding is that decisions regarding how to determine the best strategies to
impact students should be made at the community level. By documenting these processes
and the strategies agreed upon, districts can track their own accountability measures and
efforts. In effect, the state can monitor and analyze the best practices by using the data
available on the California Dashboard.

39
CHAPTER III: METHODOLOGY
This chapter explains the methodology of the study, including the purpose
statement, research questions, research design, population, target, sample,
instrumentation, data collection, data analysis, and limitations. The study is a descriptive
qualitative study. Qualitative data were gathered after archival data were compiled from
the California Dashboard. After identifying possible schools using the Dashboard data,
the researcher interviewed the school principals and collected artifacts to quantify actions
and strategies implemented by individual school districts. Eleven principals were
interviewed from northern California K-5 elementary schools with at least 75% Title I
students that experience at least a 10-point increase in their SBAC ELA scores.
Purpose Statement
The purpose of this descriptive qualitative study was to identify and describe the
strategies principals of Title I schools perceive as most effective in improving ELA
scores by at least 10-point growth, through the lens of WestEd’s Four Domains of Rapid
School Improvement.
Research Questions
The central research question guiding this study was: What strategies do
principals of Title I schools perceive as most effective in improving ELA scores by at
least 10 points, through the lens of WestEd’s Four Domains of Rapid Improvement?
Research Sub-Questions
1. What strategies do principals in schools with 75% or higher Title I
populations perceive are most effective in rapid improvement, based on
WestEd’s Domain I – Turnaround Leadership?

40
2. What strategies do principals in schools with 75% or higher Title I
populations perceive are most effective in rapid improvement, based on
WestEd’s Domain II – Talent Development?
3. What strategies do principals in schools with 75% or higher Title I
populations perceive are most effective in rapid improvement, based on
WestEd’s Domain III – Instructional Transformation?
4. What strategies do principals in schools with 75% or higher Title I
populations perceive are most effective in rapid improvement, based on
WestEd’s Domain IV – Cultural Shift?
Research Design
This study utilized a descriptive qualitative research design. This was the best
design to address the strategies used in Title I schools that showed at least a 10-point gain
on the ELA SBAC assessment in the 2016-17 school year. Qualitative research does not
aim to generalize findings (McMillan & Schumacher, 2010; Patton, 2015). Rather,
qualitative research tries to deepen understanding about an issue by “going into the field”
and gathering contextual data and inner-perspectives (Patton, 2015, p. 56). Thus,
qualitative research aims to generalize findings only in the sense of limiting researcher
bias and deductive reasoning to arrive at conclusions (Creswell, 1998; McMillan &
Schumacher, 2010; Patton, 2015). A qualitative study was selected as a means of
examining the implementation of actions and strategies and their perceived impact on
SBAC scores. First, ELA scores were collected from the California Department of
Education (CDE) Dashboard individually and analyzed to determine schools with the

41
most growth. These scores were recorded and analyzed to identify their impact. Schools
with at least a 10-point gain were eligible to participate in the study.
The California School Dashboard data were used to establish which schools met
the qualifications of a minimum of 75% Title I students and at least a 10-point gain in
ELA SBAC scores. In addition, this study analyzed the secondary data available on the
2017 California Dashboard report. The researcher had no influence on actions and
implementation strategies taken in districts where this study’s participants had an
influence on scores produced on the SBAC assessment.
Qualitative data were also gathered to answer the research question: What
strategies do principals of Title I schools perceive as most effective in improving ELA
scores by at least 10-points, through the lens of WestEd’s Four Domains of Rapid
Improvement? The researcher incorporated a descriptive, qualitative approach. This
commonly used approach of qualitative research does not aim to generalize findings
(McMillan & Schumacher, 2010; Patton, 2015). In a descriptive design, the questions
asked are “What is? or What was? It reports the way things are or were” (McMillan &
Schumacher, 2010, p. 23). Additionally, z descriptive design was chosen for this study to
investigate the participants’ perspectives on strategies affecting students’ overall SBAC
growth.
Population
A population was defined by McMillan and Schumacher (2010) as “a group of
individuals or events from which a sample is drawn into which results can be
generalized” (p. 129). The population of this study was California school administrators.
According to the CDE website, there were 26,893 administrators in California. An

42
administrator is as a person with a certificate and credential who does not work directly
with students, such as a superintendent, director, coordinator, manager, principal, or
assistant principal. This study addressed the school principal. The principal is an onsite
administrator in charge of a school site. California is home to 1,024 districts and 10,477
schools, thus the population was estimated at 10,477 school principals.
Target Population
According to Asiamah, Mensah, and Oteng-Abayie (2017), a study’s target
population is decided upon by using a refinement of the representation of the general
population. Asiamah et al. (2017) explained, “The specification of the target and
accessible populations is necessary if the study population is large” (p. 1612). The target
population for this study was principals from schools that met specific criteria. Of the
10,477 schools reported by the CDE website, only 2,562 were classified as Title I
elementary schools. By disaggregating data further, the researcher determined 987
schools met the following criteria:
Public elementary school with at least 75% of students qualifying for Title I
funding
Public elementary school serving kindergarten through fifth grade
Public elementary school with a population of 200 or more students
The target population was narrowed further to include only elementary schools in
northern California using the CDE Regional Assessment Network Map (2018) from
regions 1, 2, 3, 4, 5, 6, and 7 (Figure 2). The target population was determined as 266
public elementary K-5 schools meeting all the outlined criteria. From the 266, the
researcher continued to refine the criteria by using the California Dashboard to identify

43
34 schools that improved their ELA SBAC assessment test scores by at least 10 points,
which narrowed the target population to 34 schools.
Figure 2. California Department of Education Regional Assessment Network
Sample
Because studying all members of a large population would be nearly impossible
to accomplish in a reasonable time, the researcher selected a sample population in which
inferences and generalizations can be made about the entire population (Patten, 2012).
By using a sample, the researcher can engage with a smaller group to assist in answering
the study’s research questions. The sample size should represent all the perceptions that
may occur if a more significant sample is used. However, in nonprobability purposive
sampling, the researcher elects to use a sample of members with the knowledge and
experience to address the research questions (McMillan & Schumacher, 2010).

44
Nonprobability sampling does not provide the potential for every member of the
population to be part of the study. Creswell (1998) suggested 5-25 participants be
sampled for a qualitative study. For this study, 11 participants responded and were
included based on meeting the following criteria:
Principal of California Title I K-5 public schools
Principal of an elementary school with over 200 students
Students in grades 3-5 were assessed using the ELA SBAC
The school showed a minimum of a 10-point gain on the SBAC
Principal of schools located in northern California
The number of schools that fit the criteria was 34. Principals from 11 of those
schools participated in an interview for this study.
Instrumentation
In this qualitative study, the researcher used semi-structured interviews and
collected artifacts. Semi-structured interviews allow the respondent to answer
independently and do not provide answers from which the respondent can choose
(McMillan & Schumacher; 2010). Semi-structured interviews were used for the
respondent to share the strategies implemented in their school sites. In addition to
interviews and artifacts, the researcher was also one of the primary instruments in this
study.
Interview Questions
As part of the data collection design, participants for this study were interviewed
either face-to-face or digitally using a one-on-one interview protocol. Participants were
questioned about their school’s strategies and implementations. The researcher arranged

45
to meet with principals, either in person or virtually. Meetings with principals were
scheduled based on the availability of each principal. For both in-person and virtual
meetings, the researcher appeared early to prepare paperwork and ensure the digital
format was working correctly. The researcher also anticipated an early or late start as
principals are on call 100% of their time. For the digital interviews, the researcher
logged on early and made sure everything was working correctly. The researcher then
waited for principals to ready themselves for the interview session. The researcher
helped ease principals into the process by ensuring the time principals offered was the
same amount of time allotted to the interview process. The interviews ranged from 30-60
minutes. Introductions were made, and principals were thanked for their time. Each of
the participants were given five documents to review and complete:
Interview script and questions
Participants Bill of Rights
Informed Consent Letter with Consent Agreement for Video Recording
Privacy Act Statement
Demographic questionnaire
The interview was conducted allowing for elaborations and follow up questions.
The researcher took notes in addition to recording the interviews. Principals were
thanked for their willingness to participate in the study and share effective strategies for
their Title I students. After thanking principals for their participation, each meeting
ended on time.
The interview process was informal and interactive between the researcher and
the participants, which allowed the researcher to request clarification whenever

46
necessary. The researcher was careful to ask the semi-structured questions using the
same tone of voice to avoid any possible implications for expected or anticipated
responses. With permission from the participants, the interviewer used a digital
recording device to record both face-to-face interviews and interviews conducted using
Zoom. McMillan and Schumacher (2010) stated the interviewer needs to record the
answers. Recording can be achieved by tape recorder, digital devices, or by note-taking.
The researcher transcribed the interviews within one week.
The researcher used the four domains and 12 strategies from the Four Domains
for Rapid School Improvement framework from WestEd (2018) to develop the interview
questions. Each of the 12 strategies were used to formulate questions about specific
strategies within each domain. The interview questions were created to answer the
research question: What strategies do principals of Title I schools perceive as most
effective in improving ELA scores by at least 10 points, through the lens of WestEd’s
Four Domains of Rapid Improvement?
Researcher as an Instrument
According to Patten (2012, 2015), when conducting qualitative research the
researcher is considered the primary instrument. When the researcher is the primary
instrument, three areas may influence the interview process and how data are collected:
unique personalities, characteristics, and interview techniques of the researcher (Pezalla,
Pettigrew, & Miller-Day, 2012). As a result, the study may contain bias based on how
the researcher influenced the interviewee during the interview. In this study, the
interviewer is employed as a manager in a migrant education program and was previously
employed as an intervention specialist at a two-way immersion, Title I elementary school.

47
As a result, the researcher brought potential biases to the study based on personal
experiences in similar settings in which the study took place.
To mitigate bias, the interviewer maintained strict protocols during the interview
process, data collection process, and subsequent analysis. To further assure attention to
bias, the interviewer contracted and arranged for an expert adviser.
Expert Adviser
The researcher recognized the need to improve the validity of this descriptive,
qualitative study and did so by selecting an expert advisor. To qualify, the expert met the
following criteria:
Working knowledge of SBAC assessment administration and analysis
Employed in a northern California public school
Ten years of more experience as a certificated staff member
Working knowledge of research-based coding and theme development
The role of the expert was to include reviewing the interview process and
reviewing the questions associated with it. The expert also examined the interview
protocols and asked clarifying questions.
Credibility
According to McMillan and Schumacher (2010), credibility is “the extent to
which the results approximate reality and are judged to be accurate, trustworthy, and
reasonable” (p. 102). To ensure clarity when necessary, and by doing so increasing the
data’s overall credibility, the interviewer used the suggestions given by the WestEd Four
Domains of Rapid School Improvement to sort the results of the interviews and artifacts.
The researcher used NVivo qualitative coding software to enhance credibility, extract

48
respondent statements, and easily organize the responses into categories. Using the
software allowed the research to view the responses and code them into categories or
themes to report the data accurately, adding further credibility to the study’s findings.
Validity and Reliability
Validity
Validity was defined as “the degree to which scientific explanations of
phenomena match reality” (McMillan & Schumacher, 2010, p. 104). A study is deemed
valid if the instrument used is exact to “ensure that the instrument measures what it is
supposed to measure” (Patton, 2015, p. 22). The validity of the scores is evident in the
way the test is administered.
The first part of this study required the analysis of the data provided by the
California Dashboard and its reporting of the SBAC scores. To further indicate the data’s
validity, it should be noted there is a strict protocol for the SBAC administration. CDE
test administration affidavits are signed and specific directions followed. If there are
breaches in these protocols, those breaches must be reported to the state immediately.
According to Creswell (1998), the researcher should borrow procedures to ensure
qualitative validity by continually checking for accuracy of the findings throughout the
study. In the case of this study, the researcher consistently checked for accuracy in both
the quantitative data provided by CDE and when designing the interview questions.
Content validity. To further validate the data used for this study, the researcher
used a professional expert to review the content of the interview questions to validate
their effectiveness. The expert examined and validated the questions in their role as part
of the framework. The expert also reviewed the amount of time allotted for the

49
interviews as it related to the depth of the responses expected. The expert was able to
advise the researcher as to possible probing and follow up questions that could be used.
To further validate the data collected during interviews, the researcher conducted a pilot
interview with a qualified participant who was not part of the actual study. During that
time, the researcher practiced the interview procedures and process to ensure fluidity,
probing skills, and depth of responses.
Researcher validity. When considering validity, it is essential to include the
researcher’s background. The researcher is a 50-year-old female with 25 years of
experience in intervention at Title I elementary schools in northern California. The
researcher is familiar with the AYP measures established in California as a way of
measuring student growth on the state assessment and was interested in the aspects of the
new way of calculating the growth on the SBAC assessment. Additionally, the
researcher had seen many changes in education to address the gap in scores for Title I
schools compared to non-Title I schools. This study was intended to inform principals of
Title I schools what their peers perceived as the most important strategies to implement to
show growth on ELA SBAC assessments for their particular population.
Reliability
Reliability in research refers to the process of the study that yields consistency by
way of standardizing the process of data collection (McMillan & Schumacher, 2010;
Patton, 2015). A set of standard questions was used to increase reliability. Testing the
questions multiple times or in multiple ways allows testing of an instrument’s reliability
(McMillan & Schumacher, 2010; Patton, 2015). The researcher triangulated data by
using artifacts in addition to interviews.

50
Internal reliability. Internal reliability is the consistency of people’s responses
given the same items or in this case, questions (Price, Chiang, & Jhangiani, 2016). The
researcher conducted a face-to-face interview with an interviewee who was not a
participant in the study but met the study criteria to strengthen the internal reliability.
The identical protocol was used whereby the interviewee was given the same questions
designed for the study. The interview was recorded and transcribed using a digital device
for accuracy. During interviews with the study’s participants, questions were reviewed
ahead of time to avoid any confusion, a procedure intended to allow participants to
prepare their answers in advance and ask clarifying questions if they were uncertain after
reading the questions.
To further ensure internal reliability, triangulation methods of analyzing data were
employed. Triangulation refers to methods in research in which data are collected to
provide credibility and trustworthiness in the collection of data (McMillan &
Schumacher, 2010; Patton, 2015). Multiple data sources were used in this study, such as
interviews and the review of artifacts. Each of the data points was used to triangulate the
collected data.
External reliability. External reliability refers to the possibility of the study
being replicated (McLeod, 2013). The purpose of this study was to gain a deeper
understanding of the strategies used at the individual sites by the sample group
interviewed. Because of the nature of the interview, exact answers cannot be replicated.
However, to ensure reliability, the same questions were used in the same order during
face-to-face and virtual interviews at all sites. Although in a qualitative study the
interview question design and subsequent answers are not intended for replication, the

51
process is geared more toward understanding the experiences and perceptions of the
participants.
Inter-coder reliability. Inter-coder and inter-rater reliability are one in the same.
Inter-coder reliability refers to the rate that different coders give consistent assessments
of the same information (McLeod, 2013). To ensure inter-coder reliability, a second
coder was enlisted. The coder’s qualifications included earning a doctoral degree, more
than 20 years’ experience in education, and previous experience in qualitative research
and coding data for theme development.
The second coder checked the themes identified by the researcher and checked the
organization and data of those themes. Reliability is indicated by agreement between
researchers who have different personalities, come from different environments, and rely
on different but similar measuring devices (Mouter & Noordegraaf, 2012). Inter-coding
is used to compute results using a percentage agreement calculation. By adding the
number of cases that received the same rating from both judges and dividing that number
by the total number of cases rated by the two judges, reliability is addressed (Stemler,
2001). For this study, an inter-coder reliability percentage agreement was used because
of its simplicity. The 70% agreement factor was used as the minimum agreement target
for this study.
Data Collection
The study was reviewed and approved by the Brandman University Institutional
Review Board (BUIRB) to ensure the proposed study procedures met the standards for
ethical research. This process is in place to ensure the protections of human participants
in a study.

52
Careful planning and attention to detail are important for successful data
collection. For the first portion of the study, the researcher used a spreadsheet provided
by the CDE that listed all of the Title I schools in California then located the schools
north of Fresno in northern California with K-5 Title I students that were at or above 75%
and public schools that had more than 200 students.
The California Dashboard was used to evaluate placement of overall students on a
five by five grid as they related to their performance on the SBAC assessment. The
researcher used the data to indicate the top schools in the area of growth in ELA. Of the
34 schools meeting the criteria of growing 10 or more points, 22 were asked to participate
and 11 principals agreed to participate in an interview. The scores examined were those
of the number of students, status, and change. SBAC scores is the new way of examining
growth in performance as it replaced AYP formulas.
Each participant was asked a series of questions to address the research questions.
See Appendix C for a copy of the interview protocol. All participants were asked the
same questions to provide more accurate responses to the study. A demographic
questionnaire (Appendix E) was distributed to learn the background of each participant.
Interview protocol. The qualitative study focused on interviews and artifacts.
Eleven principals were interviewed using semi-structured interview questions.
According to McMillan and Schumacher (2010), semi-structured interviews use open-
ended questions in which the participant is not given a list of choices to select an answer.
By using semi-structured interviews, the researcher can ask tailored follow-up questions
encouraging the participant to share more deeply than if using a structured interview
format. Each participant was asked a series of questions to address the research

53
questions. The interview protocol is presented in Appendix C. All participants were
asked the same questions to provide more accurate responses for the study. This enabled
the researcher to code more accurately. In preparation for the data collection, the
researcher took the following steps:
Principals were contacted by phone to elicit interest in the study and discuss
the interview possibility
Participants agreed on dates and times for the interview
Participants were advised as to the benefits and minimal risk of the study
Participants were emailed the informed consent form (Appendix D)
The researcher provided participants with a copy of the questions (Appendix
C) before the interviews commenced
On the day of the interview, the following steps were taken:
The researcher went to the participant’s place of business, used a virtual face-
to-face option, or used the phone to conduct the interview
The researcher confirmed signatures on each required document
The researcher reviewed the purpose of the study and confirmed the
participant consented to the interview being recorded
The researcher conducted the interview
After the interviews were completed, the following steps were followed:
The researcher thanked each principal for his or her time
The researcher spot tested to confirm the interview was recorded
The researcher transcribed each interview

54
The researcher filed all transcribed interviews on a secured computer under
pseudonyms
The researcher stored the signatures and notes in a locked cabinet
Field Test
As discussed by McMillan and Schumacher (2010), to ensure the trustworthiness
of data collection, a pilot test can be done. After analyzing the archival data from the
Dashboard, the researcher conducted a pilot test to establish the validity of the interview
instrument. A colleague familiar with the components of the study and the framework
agreed to participate in a pilot study. This person was asked to review the content of the
interview questions to validate their effectiveness. The expert validated the questions
aligned with the framework. With the agreement of the interviewee, the pilot interview
commenced. The researcher then solicited feedback from the participant expert. The
expert’s feedback helped the researcher ensure the research questions were clear and in
alignment with the purpose of the study. The expert also offered input regarding
intonation and wait time in relation to the question-response exchange. The expert
confirmed the one-hour timeframe allotted for questioning was appropriate for subjects to
thoroughly provide answers without rushing.
The researcher used low-inference descriptors in addition to recording the
interviews. Low-inference descriptors are those as close to real accounts without
underlying assumptions (Seale, 1999). The researcher took notes consistent with the
participant responses. The researcher included member checking in the interview
process. Member checking is providing the participant copies of notes or transcripts for

55
accuracy (McMillan & Schumacher, 2010). The researcher made suggested changes to
the interview transcript notes.
Eleven qualified participants who met the study’s criteria participated in the semi-
structured interviews. The researcher took steps to enhance validity by recording the
interviews and subsequently transcribing all participant responses. All participants
responded to the same set of questions to ensure data consistency and limit bias.
Artifact Protocol
The artifacts used for this study required the researcher to go into the individual
websites of the school districts and look for their school LCAP. These plans revealed the
strategies districts put into place to ensure students performed in their academic studies.
The following is a sample of the artifacts used.
Table 1
Sample from One LCAP
Source Artifacts
LCAP Example: Schools will implement supplemental actions and services to
provide pathway programs that prepare low-income students and other
target student groups for college and career. Actions and services include
certificated staff, services, and operational expenditures.
Note: This is a sample and not a list.
Data Analysis
Qualitative analysis of data is primarily a process of “organizing data into
categories and identifying patterns and relationships among the categories” (McMillan &
Schumacher, 2010, p. 367). Data were collected and organized based on McMillan and
Schumacher’s (2010) general process of inductive data analysis. Data were coded,

56
categorized, and interpreted. The coding process included systematically analyzing the
data without interpreting responses.
For this study, the data were collected via interviews and review of artifacts. The
data were then transcribed from the audio or video interviews. The data were then
organized and uploaded into NVivo for coding. The researcher used NVivo, a qualitative
data analysis program, to facilitate the coding process. The program provides a central
place to store data and categorize it using common themes. The data from interviews
were coded using NVivo. The coding process breaks apart information into pieces that
can then be categorized and given specific names or titles (McMillan & Schumacher,
2010; Patten, 2012). Patterns and themes were identified and logged in such a way they
could easily be categorized based on segments of the responses. This process continued
until all data were documented and analyzed. Tables are represented in Chapter IV
representing the results of the interview responses and coding process.
Limitations
As with many studies, this study encountered limitations. The researcher is the
primary instrument in a qualitative study and, therefore, can introduce instances where
personality, experiences, and interview techniques can influence what is collected. Thus,
researcher bias is a potential limitation of the study. Another limitation is the strategies
found were those in use at only northern California schools. Schools in other regions of
the California or in other parts of the country may use different approaches yet get the
same results. Given the limited geography of the study, findings may not be generalized
beyond the schools that participated in the study. A third limitation is this study focused
on the 34 schools that showed at least a 10-point gain in their SBAC results from one

57
year to the next. Although the researcher reached out to 22 principals, only 11 agreed to
participate. It is possible those who agreed differed from or used different strategies
thank those who did not participate. Additionally, the sample size of 11 principals may
be too small to generalize the results.
Summary
This chapter provided a detailed explanation of the methodology used to conduct
the study. It described the research design, population, sample, data collection
procedures, analysis techniques, and limitations of the study. Chapter IV presents the
findings from the qualitative analysis. Chapter V presents a summary of key findings,
conclusions, implications for action, recommendations for future research, and
concluding remarks.

58
CHAPTER IV: RESEARCH, DATA COLLECTION, AND FINDINGS
The findings in this chapter are an outcome of interviews conducted and artifacts
reviewed. After analyzing data collected, the findings attempted to answer the central
research question: What strategies do principals of Title I schools perceive as most
effective in improving English language arts ELA scores by at least 10 points, through
the lens of WestEd’s Four Domains of Rapid School Improvement? Sixteen themes
immerged as a result of the analysis.
Purpose Statement and Research Questions
The purpose of this descriptive qualitative study was to identify and describe the
impact of the strategies principals of Title I schools perceived as most effective in
improving ELA scores by at least 10 points, through the lens of WestEd’s Four Domains
of Rapid School Improvement. The central research question guiding this study was:
What strategies do principals of Title I schools perceive as most effective in improving
ELA scores by at least ten points, through the lens of WestEd’s Four Domains of Rapid
School Improvement? The research sub-questions were:
1. What strategies do principals in schools with 75% or higher Title I
populations perceive are most effective in rapid improvement, based on
WestEd’s Domain I – Turnaround Leadership?
2. What strategies do principals in schools with 75% or higher Title I
populations perceive are most effective in rapid improvement, based on
WestEd’s Domain II – Talent Development?

59
3. What strategies do principals in schools with 75% or higher Title I
populations perceive are most effective in rapid improvement, based on
WestEd’s Domain III – Instructional Transformation?
4. What strategies do principals in schools with 75% or higher Title I
populations perceive are most effective in rapid improvement, based on
WestEd’s Domain IV – Cultural Shift?
Research Methods and Data Collection Procedures
The researcher used a spreadsheet provided by the California Department of
Education (CDE) that listed all the Title I schools in California, then located the schools
north of Fresno in northern California that served students in grades K-5 and had at least
200 students. The researcher used the data to identify the top schools in the area of
growth in ELA. Of the 34 schools meeting the criteria of gaining at least 10 points on the
SBAC ELA assessment, 22 were asked to participate in the study and 11 principals
participated in the interviews. After identifying the sample of 11 principals, the
researcher began the interview process.
This qualitative study focused on date collected via interviews and a review of
artifacts. Each participant was asked a series of questions to address the four research
sub-questions. All participants were asked the same questions (Appendix C) to provide
more accurate responses to the study. A demographic questionnaire (Appendix E) was
also distributed so the researcher could better understand each participant’s background.
Population
The population of this study consisted of California school administrators.
According to the CDE website, there were 26,893 administrators in California. This

60
study addressed the administrative role of school principal. In 2017, there were 10,477
elementary schools across 1,024 districts in California. Therefore, the population was
estimated at 10,477 school principals. After narrowing the target population to northern
California and K-5 Title I elementary schools that experienced at least a 10-point gain on
the SBAC ELA assessment, 34 schools were identified as meeting the criteria to
participate in this study.
Sample
The sample for this study consisted of 11 principals from the 34 schools in the
target population. Participants all met the following criteria:
Principals of California Title I K-5 public schools with over 200 students
Principals of K-5 public schools that assessed 3-5th grade students using the
SBAC ELA assessment
Principals of K-5 schools located in northern California
Demographic Data
This study involved 11 participants. All participants were principals at sites that
meet the criteria of being northern California schools with a minimum of 75% of students
who meet Title I criteria and schools that gained at least 10 points on the SBAC ELA
assessment. Table 2 represents the demographic data collection from the participants.

61
Table 2
Participants Demographics
Participant Position Years in Position
Participant 1 Principal 5
Participant 2 Principal 6
Participant 3 Principal 4
Participant 4 Principal 4
Participant 5 Principal 6
Participant 6 Principal 14
Participant 7 Principal 2
Participant 8 Principal 5
Participant 9 Principal 2
Participant 10 Principal 8
Participant 11 Principal 3.5
Presentation and Analysis of Data
The following section contains the data collected from the interviews and artifacts
that were analyzed to answer the two research questions about the strategies used to
support the gain on the ELA SBAC assessment. The 11 principals interviewed were
from northern California. A question on the demographic questionnaire asked about the
number of years in their current position to understand their responsibility for the changes
in test scores.
Data Preparation
The data collected for this study emanated from interviews and artifacts. The data
were then transcribed from the recordings and subsequently coded. The data were
organized based on the study’s theoretical framework, WestEd’s Four Domains for Rapid
School Improvement : turnaround leadership, talent development, instructional
transformation, and cultural shift.

62
The following section presents the data collected and analyzed from the
interviews to answer each sub-question about the strategies used to make the growth on
the ELA SBAC assessment. Table 3 summarizes the themes and frequency from highest
to lowest of the responses from the principals.
Table 3
Overall Themes, Participants, and Frequency of Responses
Sub-
Question Theme Interviews Frequency Artifacts Total
SB-3 Adopting an aligned curriculum
for all grade levels
11 28 3 31
SB-4 Setting student goals for
teachers, students, and parents
9 30 n/a 30
SB-2 Creating professional
development focused on goals
10 21 6 27
SB-2 Implementing PLCs 8 22 3 25
SB-2 Hiring at least 1 TOSA for
literacy support
7 21 4 25
SB-3 Creating and administering
common assessments
11 20 2 22
SB-3 Providing intervention for
students not meeting goals
9 17 3 20
SB-3 Regularly analyzing data by the
teachers
11 16 2 18
SB-4 Communicating and
collaborating with parents
8 17 1 18
SB-1 Providing administrative support
with accountability
5 14 n/a 14
SB-2 Teachers collaborating about
goals
6 10 2 12
SB-1 Delivering consistent feedback
from administration to teachers
and teachers to students
4 8 n/a 8
SB-2 Teachers participating in
decision-making
7 7 n/a 7
SB-3 Implementing an aligned
schedule for all grade levels
5 7 n/a 7
SB-4 Providing workshops to parents
to link them to the school
4 6 2 8
SB-2 Continuously reviewing standards 4 6 n/a 6

63
Central research question. The central research question was: What strategies
do principals of Title I schools perceive as most effective in improving ELA scores by at
least 10 points, through the lens of WestEd’s (2018) Four Domains of Rapid School
Improvement? The researcher coded principal responses and then categorized them into
framework areas using the Four Domains of turnaround leadership, talent development,
instructional transformation, and culture shift. Each domain was separated and analyzed
in order of importance of strategies listed in the sections.
Findings for Research Sub-Question 1
Research Sub-Question 1 was: What strategies do principals in schools with 75%
or higher Title I populations perceive are most effective in rapid improvement, based on
WestEd’s Domain I – Turnaround Leadership?
The first Domain is turnaround leadership. Evidence of turnaround leadership is
when communication is improved, goals are set, and support is targeted to the students’
needs (Day, 2009; WestEd, 2018). Table 4 presents the themes associated with the
turnaround leadership domain.
Table 4
Frequency of Responses for Research Sub-Question 1
Sub-
Question Theme Interviews Frequency Artifacts Total
SB-1 Providing administrative
support with accountability
5 14 0 14
SB-1 Delivering consistent
feedback from administrators
to teachers and teachers to
students
4 8 0 8

64
Providing administrative support with accountability. Administrative support
was mentioned 14 times by five principals. The principals described being able to hold
teachers accountable while supporting them through observations and participation in
training was valuable.
Administrative support with accountability was the 10th ranked strategy out of the
16 noted by the principals, yet the most common for Sub-Question 1. Four of the five
principals who supported their staff with accountability stated they were learning along
with their teachers. Participant 9 stated the leadership team sat in on professional
development opportunities with the teachers to understand what they were expected to
implement. Participant 10 described really listening to the teachers during staff meetings
and adjusting to their needs. These principals reported walking through the classrooms
regularly and providing immediate, meaningful feedback. All five of these
administrators emphasized they were part of the staff as opposed to being leader who was
uninvolved with what was happening in the classrooms.
Delivering consistent feedback from administrators to teachers and teachers
to students. Feedback was mentioned eight times by four principals. The elementary
school principals explained the importance of actionable feedback given from them or the
administrative team to the teachers, as well as from the teachers to students. This
strategy was ranked 13th out of 16.
Feedback was given to teachers after planned and unplanned walkthroughs the
principals performed regularly. Administrators provided immediate feedback to the
teachers intended to improve instruction. Participant 1 stated, “I’m also a teacher at
heart, like, first and foremost, I’m a teacher and I will be able to observe and give

65
actionable feedback.” Feedback was an important part of both evaluative and non-
evaluative strategies the administrators found valuable. After setting goals and based on
the modelling and feedback from the principals, teachers also give continuous feedback
to students. Students were aware of where they were and what they need to do to get to
the next level. Participant 4 explained,
I think also the students, the teachers really going through the classes and
you know when they’re teaching say okay, this is going to be on a test.
This is what you’re going to have to do to really make sure they taught to
students the skills they needed to learn to be successful.
Findings for Research Sub-Question 2
Research Sub-Question 2 was: What strategies do principals in schools with 75%
or higher Title I populations perceive are most effective in rapid improvement, based on
WestEd’s Domain II – Talent Development?
The second Domain is talent development. Evidence of talent development stems
from the organization’s ability to recruit, develop, and retain talent; target professional
learning opportunities; and set clear expectations (WestEd, 2018). Six of the 16 themes
were associated with this domain. Table 5 presents the themes associated with Research
Sub-Question 2 and talent development.

66
Table 5
Frequency of Responses for Research Sub-Question 2
Sub-
Question Theme Interviews Frequency Artifacts Total
SB-2 Creating professional
development focused on goals
10 21 6 27
SB-2 Implementing PLCs 8 22 3 25
SB-2 Hiring at least one TOSA for
literacy support
7 21 4 25
SB-2 Teachers collaborating around
goals
6 10 2 12
SB-2 Teachers participating in
decision making
7 7 0 7
SB-2 Continuously reviewing
standards
4 6 0 6
Creating professional development focused on goals. Professional
development was mentioned 21 times by 10 principals and appeared in six artifacts for a
total of 27 references indicating professional development had a big impact on their
scores. Professional development was 3rd ranked strategy of the 16 documented.
Some of the professional development focused on student engagement, some on
ELA, and others on English language development. Principals wanted to ensure teachers
understood the goal and could adjust based on what teachers at each site needed.
Participant 10 mentioned following up with teachers later in the day to “keep the
conversation fresh” and reported listening to teacher needs to “create our own flash PD
sessions on-site based on their suggestions.” Participant 11 said, “I guess it just kind of
just goes all back to the professional development that we did. It was all aligned to, you
know, higher-order thinking.” Similarly, Participant 1 stated, “Professional development
for us has been two-fold, what does it mean to teach reading, but what does it mean to
know the kids that are in front of you.” Participant 2 said the school’s professional

67
development was related to the district’s initiative. Each site had different topics of
professional development but a common theme was that they all focused on what
teachers needed.
Implementing professional learning communities. PLCs were mentioned 22
times by eight principals and appeared in three artifacts for a total of 25 references.
Implementing PLCs was ranked 4th of the 16 strategies principals stated was the reason
for the increase in student performance.
DuFour (2004) stated executing PLCs was critical for creating a culture of
collaboration. This went beyond the idea of camaraderie. Rather, PLCs needed to be
involved in making logistical decisions as to how to run the school. Effective PLCs
provide teachers with time to strategically analyze data and create deep meaning as to
how to make their teaching better (DuFour, 2004). Eight of the 11 principals seemed to
embrace the notion that PLCs were more than just teachers getting together to chat. Each
of these principals expressed there was purpose in their school’s PLC meetings.
Participant 2 stated when discussing PLCs,
[It] is not just meeting together as a professional learning community; it’s
a way of being. It’s not a program and it’s about students first, results, not
intentions. It’s kind of a mantra and so every decision we make, are we
leaning this way because it is easier for us or because it’s more effective
for students’ needs.
Eight principals stated there was a designated time to implement the PLC process.
They emphasized the need to give teachers the structure to discuss students and progress.
PLCs provide the structure to help teachers plan together and help address questions.

68
Hiring at least one TOSA for literacy support. Teachers on special assignment
(TOSAs) were mentioned 21 times by seven principals and appeared in four artifacts for
a total of 25 references. Literacy support from TOSAs was ranks 5th out of the 16
strategies. Seven of the 11 principals stated TOSAs were a great support for the teachers,
students, and administrators.
Some of the jobs of the TOSA included administering assessments, providing
interventions, delivering professional development, setting goals with students, and
supporting teachers with coaching and one-on-one support. The TOSAs all worked
fulltime at the school. Each school had one or two of these TOSAs on-site who
specialized in literacy and/or beginning reading skills. TOSAs helped guide the planning
time and the PLC time for the teachers. They gave feedback to teachers and at times,
modeled lessons with students. Participant 4 said, “I did have a good instructional coach
and she also worked with teachers and supported teachers.” Sometimes TOSAs
supported teachers and sometimes they supported students. Participant 11 stated, “We
also provided a TOSA in focusing on ELA across the board.” Principals stated their
teachers needed additional help and coaching to focus on ELA, and they appreciated the
supports provided by the TOSAs.
Teachers collaborating about goals. Teacher collaboration was mentioned 10
times by six principals and appeared in two artifacts for a total of 12 references. Teacher
collaboration was ranked 11th of the 16 strategies. Six out of the 11 principals
interviewed described the importance of teacher collaboration.
Either through the PLC structure or just giving teachers the time needed to plan,
collaboration was an important strategy mentioned by the principals. One principal

69
stated, “Teachers meet once a week for two hours in addition to two days of prep/PE days
that they can collaborate.” Whether collaboration was for planning, understanding
CCSS, or looking at individual student needs, principals felt the need to provide teachers
ample opportunity for structured collaboration.
Teachers participating in decision-making. Teacher participation in decision-
making was mentioned seven times by seven principals. This theme was ranked 12th of
the 16 strategies. Participation in decision-making means the teachers had a say in the
curriculum they would be teaching. These seven principals believed teachers being
involved in the discussion and participating in the decisions had a positive impact on the
student scores.
Teachers believed students could be successful if they were able to plan according
to what they knew would benefit their students. In one school, teachers also had a say
into how money would be spent to better support their efforts in the classroom. Teachers
were the ones who emphasized parent involvement. For example, Participant 8 said,
“That was the way that students and families were engaged and really what came from
that, a majority of staff members and all families wanted [the best] for their kids.” These
seven principals believed that for the change in scores to happen, teachers had to have
buy-in for the curriculum and understand the budget for the school year so they could
best support their students.
Continuously reviewing standards. Teachers continuously reviewing standards
was mentioned six times by four principals. This theme was ranked last of the 16
strategies. All four of the principals that addressed this strategy identified a focus on
standards with their teachers as important.

70
Participant 4 stated, “You use the curriculum to teach the standards and instead of
just following it kind of like, with everything blindly, you do go through and pick out the
parts of the curriculum.” Participant 1 stated, “It’s not hard. It’s the learning and the
practice…You practice it until it’s like a part of you.” Ensuring teachers understand
student needs, specific standards, and what was needed for students to meet the standards
was a practice these four principals used to improve student ELA scores.
Findings for Research Sub-Question 3
Research Sub-Question 3 was: What strategies do principals in schools with 75%
or higher Title I populations perceive are most effective in rapid improvement, based on
WestEd’s Domain III – Instructional Transformation?
The third domain is instructional transformation. Evidence of instructional
transformation stemmed from schools addressing student needs, providing evidence-
based instruction, and creating opportunities for learning. Table 6 illustrates the
frequency with which the principals responded related to the instructional transformation
domain.
Table 6
Frequency of Responses for Research Question 3
Sub-
Question Theme Interviews Frequency Artifacts Total
SB-3 Adopting aligned curriculum
for all grade levels
12 28 3 31
SB-3 Creating and administering
common assessments
11 20 2 22
SB-3 Providing intervention for
students not meeting goals
9 17 3 20
SB-3 Regularly analyzing data by
teachers
11 16 2 18
SB-3 Implementing an aligned
schedule for all grade levels
5 7 n/a 7

71
Adopting an aligned curriculum for all grade levels. Adopting an aligned
curriculum for all grade levels was mentioned 28 times by 10 principals and appeared in
three artifacts for a total of 31 references. this theme was ranked number one of the
sixteen strategies. Ten of the 11 principals attributed their school’s increased ELA scores
to the aligned curriculum.
Of the 10 principals who mentioned this theme, seven reported their schools had a
new curriculum teachers were implementing. In addition to implementing the new
curriculum, these principals also mentioned implementing supports and accountability
practices to ensure fidelity of program implementation. Participant 1 discussed the
importance of “teaching and supporting teachers to teach it, and not just giving it to
them.” Nine of the principals emphasized the importance of supporting the current
curriculum, whether it was new or already being used by the school. They did not want
to give teachers a new curriculum or even the current curriculum without implementation
support. Whether the principals discussed a new or increased focus on the CCSS,
English language development, or an integrated science curriculum, they emphasized the
importance of teacher training and accountability for the new programs.
Creating and administering common assessments. Having common
assessments was mentioned 20 times and by all 11 principals, and appeared in two
artifacts for a total of 22 references. Use of common assessments was ranked 6th among
the 16 strategies. All 11 principals revealed assessments were another way they were
able to increase SBAC scores.
By using the assessments and keeping them in the forefront, they could identify
gaps in student learning and address the needs of individual students. Principals used

72
formative and summative assessments on a regular basis to inform instruction.
Participant 3 stated, “Our teachers meet in grade-level teams to collaborate and look at
the essential standards and they break it down into skinny targets and write common
formative assessments and so they are looking at that constantly.” Teachers used district
benchmark assessments and formative assessments that came with the curriculum. They
also used teacher-developed assessments to monitor student needs on a predetermined
basis. Most principals stated a six-week interval was their target for assessing and
reteaching. Using the common assessments allowed teachers to use common language
about monitoring student progress.
Providing interventions for students not meeting goals. Interventions for
students not meeting goals was mentioned 17 times by nine principals and appeared in
three artifacts for a total of 20 references. Providing intervention was ranked 7th of the 16
strategies. Nine of the 11 principals expressed the importance of interventions.
Interventions happened before, during, and after school. The interventions were
typically provided by a TOSA who specialized in literacy and/or intervention strategies to
support struggling readers. These interventions were structured as both push-in and pull-
out models. In all cases, students were grouped by ability with the intention of
addressing their needs. The groups were smaller and specialized for the interventions.
Participant 3 reflected, “Once we started that, we have 30% of our students move from
Tier 3 to Tier 2 for reading intervention.” Participant 1 called interventions “individual
educational support,” going on to say, “It’s not an intervention thing for us, it’s what you
need.”

73
Regularly analyzing data by the teachers. Data analysis was mentioned 16
times by 11 principals and appeared in two artifacts for a total of 18 references. Ongoing
data analysis was ranked 8th of the 16 strategies. In addition to administering common
assessments, all 11 principals saw the value in analyzing the data collected from the
assessments.
Data analysis was mentioned 16 times throughout the interviews. Participant 11
said, “Data analysis was also another key piece that we not only do, we not only train
staff on, but they were coached through it and how to look at data.” Teachers used data
to inform their instruction. Data analysis was planned and the results were used to inform
future instruction. The teachers administered the pre-determined assessment and then
were guided as to how to analyze and use the results. The teachers participated in the
analysis of the data and they planned for next steps. Many of the schools had a minimum
day during the week for teachers to come together to analyze and use the assessment data
and then plan together. Along with the data analysis, teachers set goals for themselves
and student. Participant 2 stated, “Our other focus here is the use of data. And again,
that’s not specific to language arts, but all subject areas.”
Implementing aligned schedules for all grade levels. Aligned schedules were
mentioned seven times by five principals. Aligned schedules were ranked 14th of the 16
strategies. Five of the 11 principals believed aligning schedules was important for
improvement in scores.
The elementary school principals mentioned implementing aligned schedules
seven times. Principals also discussed the advantages of having a block schedule.
Teachers could plan together, intervention specialists could work with students when

74
teachers knew they would be pulling students or pushing in to offer support, and
administrators could conduct observations more easily. As stated by Participant 8, “If a
coach is going in, or we are doing instructional learning walks as an admin and coach’s
team, we’re able to go into classrooms and see alignment across the grade level.” The
principals knew if they wanted to see teachers providing ELA or English language
development instruction, such instruction would be occurring at the same time every day
and thus could plan their walkthroughs and observations accordingly. Similarly, one
participant stated, “If peers want to observe each other, it’s easier when we know what
time everyone’s teaching ELA.” Although they may have initially received pushback
from staff members, principals felt aligned schedules was an important change to achieve
improved SBAC scores.
Findings for Research Sub-Question 4
Research Sub-Question 4 was: What strategies do principals in schools with 75%
or higher Title I populations perceive are most effective in rapid improvement, based on
WestEd’s Domain IV – Cultural Shift?
The fourth domain is cultural shift. Evidence of a culture shift is demonstrated by
a community focused on student learning, one that involves all stakeholders, including
students and parents, in creating and pursuing educational goals. The following section
discusses the frequency with which the principals responded to areas the researcher
identified as within the domain of cultural shift. Table 7 illustrates the frequency with
which the principals responded related to the cultural shift domain.

75
Table 7
Frequency of Responses for Research Sub-Question 4
Sub-
Question Theme Interviews Frequency Artifacts Total
SB-4 Setting student goals for
teachers, students, and parents
9 30 n/a 30
SB-4 Communicating and
collaborating with parents
8 17 1 18
SB-4 Providing workshops to
parents to link them to the
school
4 6 2 8
Setting goals for teachers, students, and parents. Setting goals for teachers,
students, and parents was mentioned 30 times by nine principals for a total of 30
references. Setting goals was ranked 2nd of all 16 strategies principals found made a
difference for student SBAC scores.
The process of setting goals for teachers, students, and parents varied greatly. For
students, long- and short-term goals were set to show growth on standardized
assessments. Participant 1 summarized this by stating,
Short-term, we can set goals for like small, small group instruction, which
were really like by semester, or in our case by trimester. And then long-
term, we had a three-year vision of what the reading instruction would
look like – the year one goal was to adopt aligned curriculum in third
through fifth grade.
Staff set goals and in all the cases, continued to monitor and adjust activities as
needed to achieve their targets. Participant 2 described a distinct system as to how they
held students accountable for their learning. This principal stated,

76
Every student has a goal binder and so they set their own goals for every
assessment. Prior to an assessment or a unit, they talk about what they
wanted to be able to gain from it and what do they want to score on the
assessment and then they get feedback on that and that goes also in their
goal binder. We use those goal binders at parent conferences, back to
school night, open house so the parents also see what is happening with
each child and also have a goal minded mentality.
Principals and teachers embraced the idea of ensuring first that teachers set goals
and then second that the students were able to meet those goals and rise to the
expectations. These goals and expectations were articulated to the parents as well, which
helped gain buy in and build a culture of high expectations for students.
Communicating and collaborating with parents. Parent communication was
mentioned 17 times by eight principals and appeared in one artifact for a total of 18
references. Parent communication was ranked 9th out of the 16 strategies. Eight of the
principals suggested parent involvement played an important part in their school’s
increased SBAC scores.
It was important to principals that parents understand the school system and how
the system works. Communication to parents was mentioned 17 times throughout the
interviews with the emphasis on ensuring parents were involved in their child’s
education. Parents were given school tours. They were shown on a one-to-one basis as
to how to help their child. Participant 9 stated,
We constantly meet with our parents, we have parent-teacher conferences
where teachers share with parents to let them know how their child is

77
doing with grade-level standards. What they are meeting and what they
still need to work on. And that is ongoing throughout the year. We send
report cards home every trimester and parents know that they are always
welcome to come in to see the teacher personally. Parents have access to
their child’s grades through the portal. To see how the students are doing
and actually communicate with the teacher which is a special tool that we
use to where parents can then send messages in their language and it’s
going to translate in English for the teacher and the teacher can send
messages in English and it will translate for the parent.
Sometimes the communication was initiated through district- or school-level
initiatives, and in some cases from the parents. All eight principals who shared
information relevant to this theme wanted parents to play a part in their child’s academic
success.
Providing workshops to parents to link them to the school. Workshops were
mentioned six times by four principals and appeared in two artifacts for a total of eight
references. Workshops for parents was ranked 15th of the 16 strategies. Four principals
suggested workshops for parents made a difference in student performance.
Workshops for parents included helping their student at home with literacy nights,
analyzing data in individualized meetings, and showing families how to infuse
educational activities into everyday activities, such as “cooking with them and doing
gardening” said Participant 4. Principals indicated family involvement was important to
student academic performance. Workshops were used to encourage the parents to be a

78
part of the learning process by valuing what they brought with them. Sometimes the
workshops were also provided in another language to accommodate family needs.
Summary of Major Themes and Patterns
Chapter IV presented the qualitative findings from the 11 principals interviewed.
The data were used to answer the research questions about strategies implemented by
Title I schools that helped improved student ELA test scores as perceived by principals.
The data were rich, shared by principals who saw at least a 10-point gain in their school’s
ELA SBAC scores. Specifically, principals shared about the strategies they perceived
contributed to their school’s academic gains.
After a thorough analysis of the data, major themes were identified and classified
into four themes of the framework: turnaround leadership, instructional transformation,
talent development, and culture shift. Sixteen strategies emerged that principals believed
made a major difference in student improvement on the ELA SBAC assessment. These
strategies were mentioned 10-43 times by the 11 principals interviewed. Frequency of
reference to each of the Four Domains is shown in Figure 3.
Figure 3. Proportion of responses aligned with the Four Domains.
98
102
56
22
Instructional Transformation
Talent Development
Culture Shift
Turnaround Leadership

79
Two Domains were mentioned with a greater frequency than the other two.
Talent development was referenced 102 times, followed closely by instructional
transformation, which was referenced 98 times. Cultural shift was referenced 56 times in
the data. The Domain mentioned least often was turnaround leadership, which was only
referenced 22 times.
In the next chapter, major findings are further explored along with conclusions,
implications for action, and recommendations for future research.

80
CHAPTER V: FINDINGS, CONCLUSIONS, AND RECOMMENDATIONS
Findings, conclusions, and recommendations are presented in the final chapter of
the research study. Following the reporting of the key and unexpected findings,
conclusions drawn from those findings are presented. Next is a discussion of
implications for action based on the findings and conclusions. This is followed by
recommendations for future research and this chapter concludes with the researcher’s
reflections and final remarks.
Methodology Review
A qualitative study was conducted to describe the strategies Title I principals
perceived as most effective in improving ELA scores by at least 10 points, through the
lens of WestEd’s (2018) Four Domains of Rapid Improvement. The methodology was
designed to answer each of the sub-questions:
5. What strategies do principals in schools with 75% or higher Title I
populations perceive are most effective in rapid improvement, based on
WestEd’s Domain I – Turnaround Leadership?
6. What strategies do principals in schools with 75% or higher Title I
populations perceive are most effective in rapid improvement, based on
WestEd’s Domain II – Talent Development?
7. What strategies do principals in schools with 75% or higher Title I
populations perceive are most effective in rapid improvement, based on
WestEd’s Domain III – Instructional Transformation?

81
8. What strategies do principals in schools with 75% or higher Title I
populations perceive are most effective in rapid improvement, based on
WestEd’s Domain IV – Cultural Shift?
This qualitative study collected data through interviews and a review of artifacts.
The researcher conducted in-depth interviews with 11 principals from K-5 elementary
schools with a population of 75% or higher of Title I students, and the school was
recognized for at least a 10-point gain on the SBAC ELA assessment.
Key Findings
To identify the key findings for this study on the strategies principals perceived as
most effective in improving ELA scores by at least 10 points, through the lens of
WestEd’s (2018) Four Domains of Rapid School Improvement, the qualitative data were
analyzed and sorted into themes. The qualitative data included in-depth interviews with
11 principals either in-person or virtually, and a review of the artifacts. The researcher
identified 16 themes providing evidence of strategies the principals believed impacted
their students’ scores on the ELA SBAC assessments. The researcher established that if a
strategy was referenced six or more times, it would be included and considered a key
finding. Principals perceived the following strategies most impacted their scores:
Key Finding 1. Implementation of professional learning communities, the addition
of a teacher on special assignment, and professional development support positive
change in struggling schools
Participants reported the implementation of professional learning communities
(PLCs) with a frequency of 33 and teachers on special assignment (TOSAs) with a
frequency of 32 as valid strategies to turnaround schools. Similarly, professional

82
development for teachers was referenced 37 times. Participants emphasized giving
teachers the support they needed to influence their teaching strategies was most
important. Regarding PLCs, Participant 1 explained how the teachers met up to four
times a week to plan together and coaches were involved with the planning process to
ensure the lessons would meet student needs. Participants believed PLCs were not just
another program, but something that needed to be implemented with fidelity and
supported for teachers to benefit from the meetings. Participant 2 emphasized how
professional learning was a way of being at the school and teachers focused on student
results. To make PLCs work for the teachers, TOSAs were trained and expected to
support teachers in their planning and teaching. TOSAs sat with teachers during planning
time, both within and outside of PLCs. TOSAs created professional development
sessions based on meeting the needs of the students and what they observed in the
classroom. TOSAs were also able to go into classrooms and model lessons, which helped
ensure all students could access the curriculum and meet standards.
Key Finding 2. Collaboration among administrators, TOSAs, and teachers, and
focused professional development and classroom support, directly impact change in
SBAC ELA scores and lead to success in struggling schools
The administrators did not specifically say they were the ones responsible for the
change in SBAC ELA scores, yet two themes specifically addressed the domain of
turnaround leadership and the overall impact of the leader. Providing administrative
guidance and resources led to purposeful feedback, collaboration, and teacher
accountability. As a result, both administrators and TOSAs influenced changes in teacher
practice. Eight of the 11 principals addressed the need to be present and give immediate

83
feedback. They discussed their routines and their expectations of observing classrooms
to provide meaningful feedback and/or decide on necessary professional development
topics. One participant said, “We have lots and lots of walkthroughs with specific
feedback for teachers and then you know, follow up with professional developed based
on our needs.” When leadership focused on changing practices improve student
outcomes, immediate feedback coupled, and continuous and focused support, Title I
students improved their ELA test scores.
Key Finding 3. Ongoing TOSA-supported data review and intervention plan
development support teachers to increase student performance in struggling schools
All 11 principals stated data analysis was a key strategy for student success.
Ongoing data analysis was referenced 29 times. DuFour (2004) stated, “The crucial first
step in that transformation comes when staff began to honestly confront data on student
achievement and to work together to improve results rather than make excuses for them.”
Teachers were given time to meet and review data from common assessments. They met
in grade-level groups to review assessment data and plan for their next steps in teaching.
Participant 5 commented, “I mean we look at data all the time. Our minimum days [are
spent] looking at data…it’s an 81% Title I school, so all we do is data, plan, analyze, and
repeat.” TOSAs were present in the meetings and provided support to the students who
did not meet the goal of mastering a standard. TOSAs provided interventions and
continuously supported teachers so they could implement the next steps as described in
the intervention plan.

84
Key Finding 4. Implementing a new curriculum and common schedules brings
consistency to sites and reinforces collaboration between teachers and
administrators in struggling schools
Implementing an aligned curriculum was the most often referenced theme across
the 16 themes that emerged. Ten principals referenced curriculum alignment as a
strategy they were implementing to improve ELA scores. Districts looked for a
curriculum that was standards-based and addressed the individual needs of students.
New curriculum was designed to integrate teaching content with ongoing assessments to
incorporate individual interventions for every student. For some schools, the curriculum
was moving to something addressing the CCSS and for others it was implementing a new
reading curriculum. The curriculum was supported by administrators and TOSAs. In
addition to implementing a new curriculum, five principals referenced having common
schedules was a way to facilitate observations to confirm the curriculum was being
implemented with fidelity. Common schedules also provided additional time for teacher
planning and helped teachers, TOSAs, and administrators stay in sync.
Key Finding 5. Academic performance goals should be set and monitored with
students in Title I schools to promote improved achievement in struggling schools
In this study, setting student academic performance goals was referenced 39
times. Nine principals emphasized the need to set academic performance and overall
goals with the students and their parents. For example, Participant 3 stated, “We have
high expectations for learning and really working with kids on a growth mindset and
perseverance and grit, and that has changed everything. I mean kids understand what
they’re reading and what their goals are.” To help monitor progress, one school used a

85
data wall whereas another used goals binders. For Participants 2, 4, 8, and 9, it was
important to share the goals with the families so parents understood how to help their
children at home. In one school, students created their learning goals and during parent
conferences, used their goals to explain to their parents where they were and where they
needed to go.
Unexpected Findings
After the analysis of the qualitative data, two unexpected findings emerged from
the study. First, RTI models were not mentioned as a strategy. According to Brown-
Chidsey and Steege (2010), RTI is not a new concept, but represents years of research to
improve education for all students with a focus on identifying root causes, designing and
implementing intervention plans, and monitoring results. Although all 11 participants
were implementing pieces of the RTI model, the term was never mentioned. It seemed
the pieces of the model were valued, but not identified as being RTI.
The second unexpected finding was the limited support for and involvement of
parents. Parent involvement, communication, and collaboration was referenced 26 times.
In the LCAP, parents are required to have input in the plan for the school district. Only
eight principals and one artifact mentioned parent involvement. ESSA suggested Title I
schools provide families information to make informed decisions and be involved in their
child’s success. According to CDE, outreach should also be happening for parents. In
the case of this study, parents were invited to parent-teacher meetings, principal coffees,
and other school-level events. They were also provided with workshops provided by
participants from four school. Workshops for parents was referenced 12 times, but

86
principals did not indicate parents were involved in the decision-making process for their
student.
Conclusions
The key findings resulted in five conclusions. These conclusions were based on
the qualitative data produced by the principals and artifacts at the Title I schools as well
as from the literature.
Conclusion 1. Principals must provide training, implement PLCs, and hire TOSAs
to support teachers in improving ELA test score goals
For these schools, implementing PLCs, creating professional development
focused on improving student performance goals, and hiring at least one TOSA per
school site created positive change. To support teachers with their instructional planning
and pedagogical efficacy to ensure improved student achievement, PLCs must be
implemented with fidelity and overseen by administrators and TOSA partners. Time and
support must be given to teachers so they can create effective lesson plans that are
meaningful for students. Like other reforms, PLCs can be misguided or forgotten
altogether. According to DuFour (2004), this can be avoided if educators reflect
critically on the merits of commitment and persistence of improvement in the school.
Teachers and administrators need to remember the three ideas and core principles of
PLCs. Additionally, a shared mission, vision, values, and goals must become part of a
site’s culture so the model can be maintained and supported for student success. Further,
part of that focus must be supported through having a TOSA who is attentive to teacher
needs and guides them to ensure the focus is on student achievement. TOSAs must also
be responsible for working in the classroom with the teacher to model lessons, help

87
students not making the goal, and decide what professional development is needed to
help teachers go to the next level. This conclusion was based on the following:
Eight of 11 principals implemented PLCs that included the support of a
TOSA. PLCs were referenced 25 times in this study. To demonstrate that
PLCs are implemented correctly, a focus must be on the model; the more
support for the teachers, the better the results.
Seven of the 11 principals believed having a TOSA was important to their
school’s growth on the SBAC because TOSAs offered support to the staff
when implementing new programs. TOSAs were mentioned 21 times and
found in four artifacts for a total of 25 references. The TOSA supported
teachers with their lessons and their students. They were also instrumental in
supporting the professional development offered to the teachers.
Conclusion 2. Principals must actively engage with teachers and provide them with
direct feedback and TOSA support to improve student academic achievement
Providing administrative and TOSA support, direct feedback, and professional
development helped lead to higher levels of teacher accountability. Having involved
leaders who listen, guide, and support their teachers in improving pedagogical practices
will have a direct influence on meeting student performance goals and, in general,
positively impact struggling schools’ academic standings. In addition to the
administrator, a TOSA is also a partner and instructional leader on campus. Evidence of
turnaround leadership includes improved communication, goal setting, and targeted
support to meet students’ needs (Day, 2009; WestEd, 2018). According to Anrig (2015),
research was done to observe the commonalities of a successful turnaround leader; one of

88
the five areas noted that impacted success was teacher-led data analysis and sharing
classroom instructional practices. Additionally, principals reported conducting
walkthroughs and providing immediate feedback helped impact student achievement.
This conclusion was based on the following:
Administrator support with accountability was referenced 14 times, including
involvement through observations. Providing immediate feedback was
discussed eight times by four principals. Their combined impact was
important for student growth.
Conclusion 3. Principals must provide teachers support in data review and
intervention planning to improve student performance outcomes
Providing interventions for students not meeting goals and regularly analyzing
data with TOSA support was essential for improving Title I schools’ performance
standings. Students enrolled in Title I schools provided with targeted interventions
designed by their teachers in collaboration with TOSAs are more likely to experience
improvement toward reaching their academic performance goals. Routine data reviews
by all stakeholders, including teachers, administrators, and TOSAs, is vital for student
growth. To increase student achievement, staff need to be trained on how to look at data
and coached and supported through the analysis process. For example, Participant 11
stated, “The first data point is the SBAC assessments and how students perform overall
on the state assessment. Teachers then review the expectations and can visualize the
steps they need to take to help their students improve their performance.” With TOSA
support in analyzing and planning, teachers can review the data and think about creating
attainable student performance goals. When teachers feel good about what they are

89
doing, students succeed. When students succeed, teachers’ self-efficacy increases. This
dynamic, when executed, creates success (Lee et al., 1995; Lieberman, 1995). This
conclusion was based on the following:
The qualitative data showed the importance of ongoing data analysis. All 11
principals interviewed valued data analysis. Data analysis was also referenced
in two artifacts. The 11 principals reported data analysis was a shared practice
that contributed to their school’s growth of 10 or more points on the ELA
SBAC.
Conclusion 4. Principals and staff must adopt new curriculum and implement
common schedules that support collaboration and data analysis
Adopting new curriculum and aligning schedules for all grade levels reinforced
collaboration among teachers, TOSAs, and administrators. Additionally, a common
curriculum and schoolwide schedule alignment allowed teachers, TOSAs, and
administrators more opportunities for collaboration, data analysis, and intervention
planning necessary to support struggling students. To meet new expectations and help
students retain necessary content, districts looked for standards-based curriculum that
addressed students’ individual needs (Gustafson & Branch, 1997). To implement a new
curriculum, principals must have teacher consensus for the new curriculum. In some
cases, teachers picked the curriculum; in other cases, the principals made sure they hired
staff who believed in the systems that would be implemented. In addition to new
curriculum, it was concluded having common schedules when teachers implemented the
new curriculum was important. According to evidence collected, having common

90
schedules helped teachers plan and administrators and TOSAs support the
implementation. This conclusion was based on the following:
All 11 participants emphasized the need for a new curriculum. It was
mentioned 28 times during interviews and appeared in three artifacts for a
total of 31 references. New curriculum requires support, which is necessary to
make anticipated student academic performance changes on the California
assessments.
Conclusion 5. Teachers must guide students and their parents in setting and
understanding short- and long-term academic performance goals to support
students in monitoring and achieving them
Setting and monitoring goals with teachers and parents help students improve
their academic progress. Students in struggling schools who are supported by teachers
and parents to keep track of their academic performance and understand the requirements
and expectations for improvement are more likely to increase their scores on the ELA
SBAC assessments. With students as partners, teachers and parents can articulate each
student’s goals and plan for necessary cognitive growth together. In addition to teachers
knowing the plan for improvement according to each student’s goals, students must
understand the plan and track their progress. When students can create and articulate
their goals, success happens. Hattie (2012) took this idea a step further recommending
self-reported grades as number two in his list of factors related to student achievement.
In his study, students could accurately report how they would do on an assessment and it
was the teachers’ job to encourage students to do more (Hattie, 2012). In the current

91
qualitative study, it was found teachers set goals for students and involved students at
every level in meeting those goals. This conclusion was based on the following:
Nine of the 11 principals discussed the importance of setting goals for
students with teachers and students, which was referenced 30 times.
Administrators realized the importance of setting clear goals and providing
support to both teachers and students.
Implications for Action
The conclusions of this study showed actions can be taken by leaders in
California elementary Title I schools to improve SBAC ELA scores. Based on the
review of the literature and research findings, the following actions are recommended.
Implication 1. Schools should implement PLCs and hire a TOSA to support
teachers to improve student achievement on the ELA part of the SBAC
Based on the conclusion implementation of PLCs and support and professional
development from a TOSA can improve student achievement on the ELA part of the
SBAC, it is recommended schools implement PLCs and hire TOSAs. Principals
perceived the strategies exemplified in PLCs can increase teacher efficacy and result in
student gains. By providing time to collaborate and a TOSA for support, administrators
are able to ensure PLCs are implemented with fidelity. By creating PLCs, teachers -have
time to review all aspects of their instruction and analyze student data with their
colleagues.
District administrators can examine the results of model schools implementing
PLCs successfully and replicate their practices in Title I schools. At model schools,
teachers learn the value of following the PLC framework strategies. It is worth the extra

92
effort for TOSAs to support teachers, students, and administrators. TOSAs are given the
task of focusing professional development on teacher needs. By having an extra staff
member who concentrates on teacher needs, districts can show support for staff members,
creating meaningful relationships with them.
Support is provided through purposeful professional development. It must be
designed to impact teacher performance immediately. Professional development should
be based on what administrators observe and what teachers request. A culture of teacher
suggestions and feedback must be established to ensure success for the Title I student
population.
Implication 2: Leader must listen and participate in the change
Based on the conclusion having an involved leader who listens to teachers and
participates in implementing changes is necessary to ensure their design and
implementation, the site leader must be honest about making and sustaining change.
Effective leaders must listen to their staff when they have concerns. Relationships are
also an important part of being an effective leader. For leaders to provide teachers with
constructive feedback, they must be an intricate member of the team.
Implication 3: Data need to be in the forefront to make changes for Title I schools
Ongoing data review coupled with interventions and TOSA support in the
classrooms are important for Title I schools. Teachers require training on effective data-
driven instructional strategies. With TOSAs, teachers can gradually learn analysis
strategies by having TOSAs first do the heavy lifting then taking on more responsibilities.
Teachers can use their energy to focus on groups of students and drill down to individual
students and their needs. TOSAs can provide support so teachers can implement new

93
lessons, receive constructive feedback, and make on-the-spot changes as needed. As a
result, the role of the TOSA on a Title I campus was confirmed.
Implication 4: Title I schools must implement a new curriculum and common
schedule with fidelity
Implementation of a new curriculum and common schedules were identified as
effective strategies to improve ELA scores. Having teachers and parents participate in
reviewing and selecting a new curriculum helps to gain buy-in when implementing
change. When the new curriculum is implemented, administrators and TOSAs must
support teachers. The staff must be willing to change the curriculum and sometimes
instructional strategies. Teamwork is the foundation for change to happen.
Administrators must support their teachers’ growth. By creating common schedules, the
school culture shifts to be more collaborative. Changing teaching strategies is difficult
enough, but when staff can change together and rely on support, the students ultimately
benefit.
Implication 5: Students and teachers must have time to create, articulate, and
achieve student goals
Student goals must be set and monitored to improve academic outcomes. Time
must be scheduled for teachers and students to create goals and articulate expectations
allowing students to reach them. Creating both short- and long-term goals can impact the
way students approach learning. When they know exactly where they stand in their class,
students relate better to the instruction. Taking ownership of their learning is an
important strategy affecting results in Title I schools. Teachers with high expectations
can push students to rise to their potential and as a result, students can exceed those

94
expectations. For teachers to engage effectively in this work, they must be given time
and support to set their own goals and plan a path toward achieving them. By using data,
teachers set expectations for final outcomes and then identify individual students, their
learning styles, and levels of accomplishment. This process requires the administrators to
provide teachers with time to reflect and plan together. With structured collaboration and
planning, students and teachers will achieve their potential.
Recommendations for Further Research
The current study revealed effective strategies that work for Title I schools with a
75% or higher population of Title I students. Although the current study focused on
principals from schools that demonstrated at least 10-point growth on the SBAC ELA
assessment, there is potential for researchers to explore additional effective strategies that
also work. Based on data from the current study, the following are recommended for
further research:
This qualitative study was focused on strategies that worked for ELA. A
similar study could be conducted to explore strategies effective in other
subject areas based on assessment improvement. Studies could be conducted
for math and science with the same population. Data would attest to which
strategies would show growth in each of the areas assessed.
This qualitative study focused on principal effectiveness and impact on
advancing SBAC assessment scores at the chosen sites. A future study could
be conducted with principals and teachers at Title I schools. Such as study
could compare the similarities and differences as perceived from the two
groups.

95
This qualitative study focused on Title I schools with 75% or higher Title I
student populations. Another study could be conducted on schools with fewer
Title I students to determine the similarities and differences in the strategies
other principals thought were impactful for student growth on the SBAC
assessment.
This qualitative study was limited to schools in northern California. Another
qualitative study could be conducted in other sections of the state to provide
further information on implementing strategies that principals thought were
important to show academic growth for Title I schools.
Concluding Remarks and Reflections
The current qualitative study closes with my reflections and concluding remarks
about the research process and results. This dissertation journey exposed me to the
different abilities and passions regarding the success of students in California’s
educational system related to Title I students. The time and effort dedicated to this study
helped me understand there is a need in education to continuously support educators
because each site and each educator approaches instruction differently. Many strategies
must be working effectively and simultaneously to make changes for Title I populations
to support educators and students. Administrators are key to teacher buy-in and staff
efficacy. The administrator must listen and respond to people on their campus who
impact students daily. It is important to consider each teacher as an integral part of a
team. Overall, each person must have a sense of belonging when building programs that
work for all students. Although relationships were not mentioned as a strategy, they are
implied as critical components for the implementation of successful strategies. Having a

96
TOSA on every Title I school campus to support administrators, guide teachers, and most
importantly, share a common vision with stakeholders assures positive student
achievement outcomes.
I appreciate the principals who took time away from their busy schedules to
participate in this study. Working at Title I schools is unique to other school dynamics.
Speaking with their principals reminds me of the dedication it takes to make a significant
difference for students who may not have the external support other students experience.
Continuing to support and guide each other will ensure meaningful change and
improvement for our most vulnerable students.

97
REFERENCES
Anderson, D., & Ackerman-Anderson, L. S. (2010). Beyond change management: How
to achieve breakthrough results through conscious change leadership. San
Francisco, CA: Pfeiffer.
Anrig, G. (2015, August 19). Five things successful turnaround schools have in common.
Retrieved from https://www.edweek.org/ew/articles/2015/08/19/five- things-
successful- turnaround-schools-have-in.html
Asiamah, N., Mensah, H. K., & Oteng-Abayie, E. F. (2017). General, target, and
accessible population: Demystifying the concepts for effective sampling. The
Qualitative Report, 22(6), 1617-1621.
Blank, M., Jacobson, R., & Pearson, S. (2009). Well-conducted partnerships meet
students’ academic, health, and social service needs. American Educator, 30-36.
Blum, J., & Knudson, J. (2016). Implementing LCFF: Possible solutions to emergent
LCAP Challenges. Washington, DC: American Institutes for Research. Retrieved
from https://www.air.org/resource/implementing-lcff-possible-solutions-
emergent-lcap-challenges
Bosse, S. (2013, March 19). History of public education [Video File]. Retrieved from
https://www.youtube.com/watch?v=h3c6Ou7Ed1c
Brown, E. (2017, February 14). Trump praises Education Secetary, Betsy DeVos, saying
she endured a “very unfair trial.” Washington Post. Retreived from
https://www.washingtonpost.com/news/education/wp/2017/02/14/trump-praises-
education-secretary-betsy-devos-saying-s he-endured-a-very-unfair-
trial/?utm_term=.a4ddb3856ea5

98
Brown, K., & Wynn, S. (2018). Teacher retiontion issues: How some principals are
supporting and keeping new teachers. Journal of School Leadership, 17, 664-698.
Brown-Chidsey, R. & Steege, M. W. (2010) Response to intervention (2nd Ed.). New
York, NY: The Guilford Press.
California Budget Project. (2006). School finance in California and the Proposition 8
guarantee. Retrieved from https://calbudgetcenter.org/wp-
content/uploads/0604_prop98.pdf
California Department of Education. (2017). California school dashboard technical
guide. Sacramento, CA: Author.
California Department of Education. (2018). Socioeconomic status. Taking Center Stage-
Act II (TCSII) A Portal for Middle Grades Educators. Sacramento, CA: Author.
Retrieved from https://pubs.cde.ca.gov/tcsii/ch7/socieconomicstats.aspx
California Department of Education. (2019). Parent and family engagement-Title I, Part
A. Retrieved from https://www.cde.ca.gov/sp/sw/t1/parentfamilyinvolve.asp
California Department of Education. (n.d.). CAASPP online test administration manual
for caaspp testing. Retrieved from
http://www.caaspp.org/administration/instructions/
California State Parent Teacher Association. (2018). LCFF and LCAP-Califronia State
PTA: Your Voiece Matters. Retrieved from https://pta1.org/lcff-and-lcap-
california-state-pta-your-voice-matters/
California Teachers Association. (2018). Teacher shortage. Retrieved from
https://www.cta.org/en/issues-and-Action/Retirement/Teacher-Shortage.aspx

99
Center on Resounse to Intervention. (n.d.). The essentional components of RTI. Retrieved
from https://www.rti4success.org/
Chang, H. N., & Romero, M. (2008). Present, engaged, and accounted for: The critical
importance of addressing chronic absence in the early grades. New York, NY
National Center for Childern in Poverty.
Creswell, J.W. (1998). Qualitative inquiry and research design: Choosing among five
traditions. Thousand Oaks, CA: SAGE Publications, Inc.
Day, C. (2015). Capacity building through layered leadership: Sustaining the turnaround
[ebook]. Dordrecht, Netherlands: Springer. Retrieved from
https://link.springer.com/chapter/10.1007/978-1-4020-9737-9_7
DuFour, R. (2004). What is a professional learning community? Retrieved from
http://www.ascd.org/publications/educational-leadership/may04/vol61/num08/
What-Is-a-Professional-Learning-Community%C2%A2.aspx.
Dweck, C. S. (2006). Mindset: The new psychology of success. New York, NY:
Ballantine Books.
Dynarski, M., & Kainz, K. (2015). Why federal spending on disadvantaged students
(Title I) doesn’t work. Evidence Speaks Reports, 1(#7), 5.
Elmore, R. F. (2004). School reform from the inside out policy, practice, and
performance. Cambridge, MA: Harvard Education Press.
Epstein, J. L. (2001). School, family, and community partnerships: Preparing educators
and improving schools. Boulder, CO: Westview Press.
Fix School Discipline. (n.d.). LCFF & LCAP. Retrieved from
http://www.fixschooldiscipline.org/lcap-lcff/

100
Friedman, T. L., & Mandelbaum, M. (2011). That used to be us: How American fell
behind the World. New York, NY: Picador.
Fullan, M. (2017). Ten assumptions about change. Retrieved from
https://web3.esd112.org/docs/default-source/tpep/assumptions-about-
change.pdf?sfvrsn=0
Garcia, A. (2015). The art of implementation: California’s LCAPs fall short for ELs.
Retrieved from https://www.newamerica.org/education-
policy/edcentral/california-lcff/
Goldsmith, W., & Speckart, J. (2017, August 10). Why did we create public schools? A
short history of education [Video File] Retrieved from
https://www.youtube.com/watch?v=MxZOcT9wk6M
Gustafson, K. L., & Branch, R. M. (2002). Survey of instructional development models
(4th ed.). Syracuse, NY: ERIC Clearninghouse on Informational Technology.
Retrieved from https://files.eric.ed.gov/fulltext/ED477517.pdf
Hattie, J. (2015, December 18). Professor Hattie on RTI models [Video File]. Retrieved
from https://www.youtube.com/watch?v=33Xk-B5el_Y
Heilig, J. V., Romero, L. S., & Hopkins, M. (2017). Coign of vantage and action:
considering California' local accountability and school finance plans for English
learners. Education Policy Analysis Archives, 25(15), 24. Retrieved from
https://files.eric.ed.gov/fulltext/EJ1134307.pdf
Heilig, J. V., Ward, D. R., Weisman, E., & Cole, H. (2014). Community-based school
finance and accountability: a new era for local control in education policy. Urban
Education. doi: https://doi.org/10.1177/0042085914558171

101
Hord, S. M. (1997). Professional learning communities: Communities of continuous
inquiry and improvement. Austin, TX: Southwest Educational Development
Laboratory.
Kaestle, C. (n.d.). Testing policy in the United States, a historical perspective. Retrieved
from https://www.ets.org/Media/Research/pdf/kaestle_testing_policy_us
_historical_perspective.pdf
Knudson, J. (2014). Implementing LCFF: Building capacity to realize the promises of
California’s new funding system. Retrieved from
https://www.air.org/resource/lcff-implementation-building-capacity-realize-
promises-california-s-new-funding-system
Knudson, J. (2016). Implementing LCFF: Communicating about district plans, policy
and practice brief. Retrieved from https://files.eric.ed.gov/fulltext/ED571658.pdf
Koppich, J. E., Humphrey, D. C., & Marsh, J. A. (2015). Two years of California's local
control funding formula: Time to reaffirm the grand vision. PACE, 15.
Kratochwill, T., Clements, M. & Kalymon, K. (2019). Response to intervention
conceptual and methodological issues in implementation [online]. Available at
https://link.springer.com/chapter/10.1007/978-0-387-49053-3_3#citeas
Lansner, J. (2018, May 22). California school spending frows at fastest pace in the U.S.
Orange County Register. Retrieved from https://www.ocregister.com/2018/05/22/
california-school-spending-grows-at-fastest-pace-in-the-u-s/
Lee, V. E., Smith, J. B., & Croninger, R. G. (1995). Another look at high school
restructuring (Issue Report No. 9). Retrieved from http://archive.wceruw.org/
cors/Issues_in_Restructuring_Schools/ISSUES_NO_9_FALL_1995.pdf

102
Lieberman, A. (1995). Practices that support teacher development: Transforming
conceptions of professional learning. Phi Delta Kappan, 76(8), 591-596.
Lips, D. (n.d.) Does spending more on education improve academic achievement?
Retrieved from https://www.heritage.org/education/report/does-spending-more-
education-improve-academic-achievement
Malburg, S. (n.d.). Understanding the basics of Title I funds. Retrieved from
http://www.brighthubeducation.com/teaching-methods-tips/11105-basics-of-title-
1-funds/
McClure, P. (2008). Ensuring equal opportunity in public education how local school
district funding practices hurt disadvantaged students and what federal policy can
do about it. Retrieved from http://www.americanprogress.org
McMillan, J. H., & Schumacher, S. (2010). Research in education evidence-based
inquiry (7th ed.). Upper Saddle River, NJ: Pearson.
Mouter, N. & Noordegraaf, D. V. (2012). Intercoder reliability for qualitative research.
Proceedings from the 12th TRAIL Congress, Rotterdam, Netherlands.
Muhammad, A., & Hollie, S. (2012). The will to lead, the skill to teach. Bloomington, IN:
Solution Tree Press.
National Association of State Directors of Special Education. (2005). Response to
intervention: Policy considerations and implementation. Alexandria, VA.
National Center for Education Statistics. (1996). Reading literacy in the United States.
Washington, DC: Author. Retrieved from
https://files.eric.ed.gov/fulltext/ED396245.pdf

103
National Commission on Excellence in Education. (1983). A nation at risk: The
imperative for educational reform. Washington, DC: U.S. Department of
Education. Retrieved from http://eric.ed.gov/?id=ED226006
National Education Association. (2010). English language learners face unique
challenges. Washington, DC: Author. Retrieved from
http://educationvotes.nea.org/wp-content/uploads/2010/05/ELL.pdf
Papay, J., Bacher-Hicks, A., Page, L., & Marinell, W. (2017). The challenge of teacher
rentention in urban schools: Evidence of variation from a cross-site analysis.
Educational Researcher, 46(8), 434-448. doi: 10.3102/0013189x17735812
Patten, M. (2014). Understanding research methods Glendale, CA: Pyrczak Publishing.
Patton, M. Q. (2015). Qualitative research and evaluation methods (4th ed.). Thousand
Oaks, CA: SAGE Publications.
Pezalla, A. E., Pettigrew, J., & Miller-Day, M. (2012). Researching the researcher-as-
instrument: An exercise in interviewer self-reflexivity. Qualitative Research,,
12(2), 165-185.
Preston, A. I., Wood, C. L., & Stecker, P. M. (2016). Response to intervention: Where it
came from and where it’s going, preventing school failure. Alternative Education
for Childern and Youth, 60(30), 173-182.
Puckett, S. [Producer]. (2018, October 19). Defies measurement [Video File]. Retrieved
from vimeo.com/122720631
Rose, H., & Weston, M. (2013). California school district revenue and student poverty
moving toward a weighted pupil funiding formula. Sacramento, CA: Public Policy
Institute of California. Retrieved from

104
https://www.ppic.org/publication/california-school-district-revenue-and-student-
poverty-moving-toward-a-weighted-pupil-funding-formula/
Seale, C. (1999). The quality of qualitative research. London, England: SAGE
Publications.
Senge, P. (1990). The fifth dicipline. New York, NY: Century Business.
Sigman, D. (2008). Memorandum to the state of California: Evaluation of the School
Assistance and Intervention Team Process. Sacramento, CA: California
Department of Education.
Smarter Balanced Assessment Consortium. (2018). History. Retrieved from
http://www.smarterbalanced.org/about/history/
Standerfer, L. (2006). Before NCLB: The history of ESEA. Principal Leadership, 6(8),
26-27.
Stemler, S. R. (2004). A comparison of consensus, consistency, and measurement
approaches to estimating interrater reliability. Practical Assessment, Research and
Evaluation, 9(4). Retrieved from http://PAREonline.net/getvn.asp?v=9&r=4
U.S. Department of Education. (2004). Title I — Improving the academic achievement of
the disadvantaged. Retrieved from
http://www2.ed.gov/policy/elsec/leg/esea02/pg1.html
Waldron, N. L., & McLeskey, J. (2010). Establishing a collaborative school culture
through comprehensive school reform. Journal of Educational and Psychological
Consultation, 20, 58-74. doi:10.1080/10474410903535364
Warren, P., & Carrillo, G. (2015). Implementing local accountability in California’s
schools: The first year of planning. Retrieved from

105
http://www.ppic.org/publication/implementing-local-accountability-in-californias-
schools-the-first-year-of-planning/
Wisconsin Department of Public Instruction. (2017, November 15). How our public
school system came to be [Video file]. Retrieved from
https://www.youtube.com/watch?v=AyHy71_tkcY
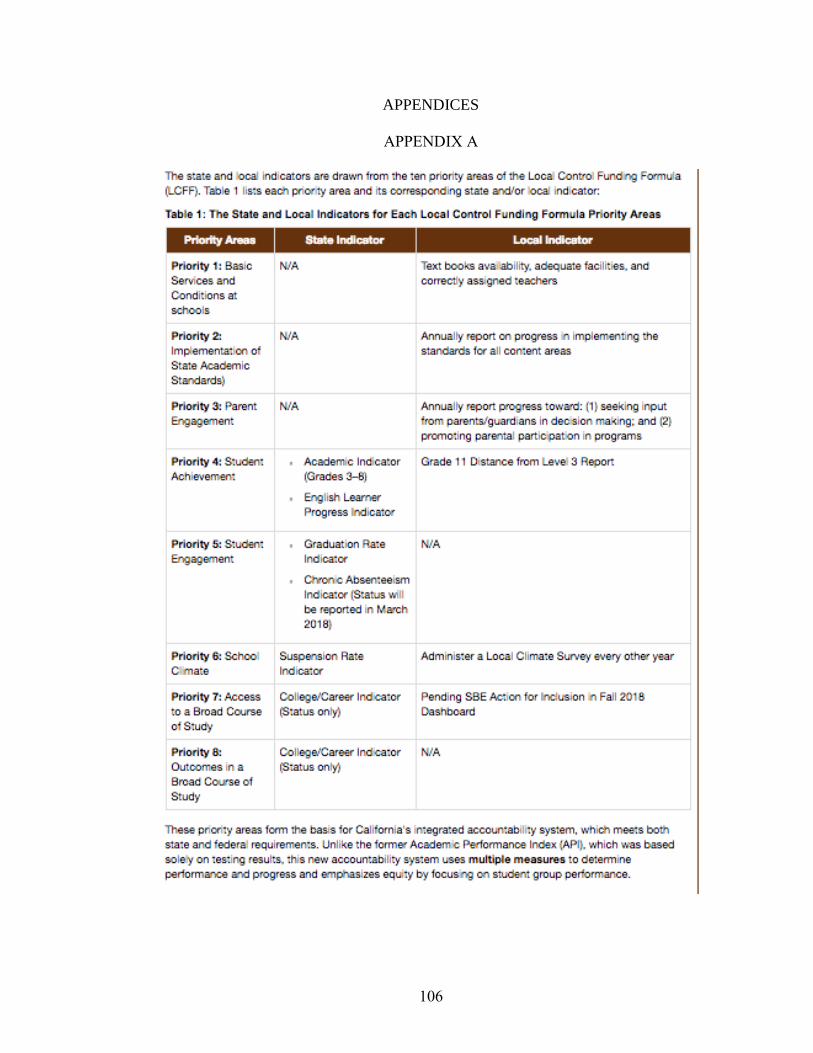
106
APPENDICES
APPENDIX A

107
APPENDIX B
Requirements of the Test Environment

108

109
APPENDIX C
Interview Script and Questions
Opening
I appreciate your willingness to participate in the interview today. The purpose of this
study is to identify and describe the impact of the LCAP on the 3rd – 5th grade student
SBAC ELA scores in Northern California public elementary schools that have a 75% or
higher Title I student population. An additional purpose of this mixed method study is to
identify the LCAP strategies that principals and district staff perceive as most effective in
improving student achievement in language arts. All information shared in this interview
is confidential. A pseudonym for all participants will be used in this study. If you do not
feel comfortable answering a question, you may skip it. I will be recording this interview
as well as taking notes. It should only take about 45-60 minutes. There are no
foreseeable physical, psychological, or social risks involved with your participation. The
researcher will protect confidentiality by keeping identifying letter codes, audio
recordings, and transcribed documents in a locked file. Both the documents and audio
recording will later be destroyed. You will not be compensated for your participation.
However, your participation will benefit the research regarding Title I schools and the
LCAP strategies that are used. Any questions you have, may be answered by the
researcher, myself, Michelle Manriquez. I can be reached by email at
[email protected] or by phone at 209-604-8790.
Is this process still okay with you? Do you have any questions or concerns before
we start? Please verbally say “yes” to indicate that you understand your rights and
consent to being interviewed. I would like to begin by asking you a few background
questions about your experience.
How long have you worked in education?
How long have you worked in this district?
Turnaround Leadership
1. In what way, if any, was improvement prioritized and its urgency
communicated in the area of ELA?
2. In what way, if any, were short term and long-term goals monitored in the
area of ELA?
3. In what way, if any, were needs customized and supported in the area of
ELA?
Talent Development
1. In what ways, if any, was talent recruited, developed, retained, and sustained
in the area of ELA?
2. In what ways, if any, were opportunities for professional learning targeted in
the area of English Language Arts?

110
3. In what ways, if any, were performance expectations clearly set in the area of
English Language Arts?
Instructional Transformation
1. In what ways, if any, were student-learning needs diagnosed and responded to
in the area of English Language Arts?
2. In what ways, if any, was rigorous evidence-based instruction provided in the
area of English Language Arts?
3. In what ways, if any, were barriers removed and opportunities provided in the
area of English Language Arts?
Culture Shift
1. In what ways, if any, was culture built to focus on student learning and effort
in the area of English Language Arts?
2. In what ways, if any, was stakeholder input solicited and acted upon in the
area of English Language Arts?
3. In what ways, if any, were students and families engaged in pursuing
educational goals in the area of English Language Arts?
Probing questions
1. Can you tell me more about…?
2. Can you give a specific example of…?
3. Do you have more to add…?
4. Why do you think that was the case…?
Closing
Thank you for taking the time to meet with me and be interviewed regarding your
thoughts about LCAP strategies and what you have implemented in the area of English
Language Arts. Your opinion is very valuable to me as a researcher. If you would like a
copy of the transcription, it may be made available to you by sending an email to
Michelle Manriquez at [email protected]. Thank you again.

111
APPENDIX D
Informed Consent Letter
Dear (insert name)
Thank you for agreeing to be a participant in my research study. The goal of this study is
to analyze the strategies that were used in the 2016-2017 school year that the principal or
director viewed as being the most impactful to create growth in the SBAC scores. This
study asks 5 principals or directors to provide their insights and opinions regarding the
strategies that were implemented over the last years to impact the growth.
There are four domains of rapid improvement according to WestEd: Turnaround
Leadership, Talent Development, Instructional Transformation, and Culture Shift. It is
these four domains that will drive the conversation for this research study.
Evidence of a turnaround leadership is that communication is improved, goals are set,
and support is targeted to the needs. Evidence of talent development is the organization
can recruit, develop and retain talent, target professional learning opportunities, and set
clear expectations. Evidence of instructional transformation is to address student needs,
provide evidence-based instruction, and created opportunities. Evidence of a culture shift
is to create a community that is focused on student learning, include all stakeholders, and
include students and parents in creating and pursuing educational goals. According to the
framework, all the four domains need to be considered in creating effective, sustainable
change.
Study Process and Dates of the Study
There are three parts to your participation:
1. Online demographic questionnaire-this will include your name, contact
information, position, and number of years in that position. This questionnaire
will take not more than 10 minutes.
2. Online preliminary questions-this will include four open ended questions around
the four quadrants mentioned above. These questions could be as short as five
minutes to fifteen, depending on how much you have to share.
3. Interview-ideally this would be in person but could be a phone interview.
The study will be conducted over a period of three weeks in August. With this letter, you
are receiving the link to both the questionnaire and the survey.
Demographic Questionnaire link:
Questions link:

112
Please complete these in the next week. Once both have been completed, I will be
contacting you by email and/or phone to set up the interview. Again, the interview will
take no more than 30 minutes.
Requirements of the Study
In order to guarantee the validity and timely completion of this study, participants are
asked to review these requirements and confirm your willingness and ability to complete
the study.
One key element of any research study is anonymity. Neither your name nor your
answers will be shared with other participants. Please do not discuss your answers to the
preliminary with others throughout the process.
Participants are chosen by their test score growth on the SBAC and their willingness to
participate.
During the period of the study, participants must complete the demographic and
preliminary interview questions through an online form. Interviews will be scheduled as
participants complete the form.
Informed Consent (included in the demographic online questionnaire)
Please read the following and sign below:
I understand that I may refuse to participate in or I may withdraw from this study at any
time without any negative consequences. Also, the investigator may stop the study at any
time. I also understand that no information that identifies me will be released without my
separate consent and that all identifiable information will be protected to the limits
allowed by law. If the study design or the use of the data is to be changed, I will be so
informed and my consent obtained. I understand that if I have any questions, comments,
or concerns about the study or the informed consent process, I may write or call the
Office of the Vice Chancellor Academic Affairs, Brandman University, 16355 Laguna
Canyon road, Irvine, CA 92618 telephone (949) 341-7641. I acknowledge that I have
received a copy of this form.
Signed:________________________________________________________________
Please return the informed consent as a scanned pdf.
Michelle Manriquez
209.604.8790

113
APPENDIX E
Demographic Questionnaire
Thank you for agreeing to participate in this research study. This will be the only written
questionnaire to be filled out for this study. By filling it out, you agree to participate and
you have been given informed consent.
Informed Consent:
I understand that I may refuse to participate in or I may withdraw from this study at any
time without any negative consequences. Also, the investigator may stop the study at any
time. I also understand that no information that identifies me will be released without my
separate consent and that all identifiable information will be protected to the limits
allowed by law. If the study design or the use of the data is to be changed I will be so
informed and my consent obtained. I understand that if I have any questions, comments,
or concerns about the study or the informed consent process, I may write or call the
Office of the Vice Chancellor of Academic Affairs, Brandman University 16355 Laguna
Canyon Road, Irvine, CA 92618 Telephone (949) 341-7641. I acknowledge that I have
received a copy of this form.
1. Full Name:
2. Best email address:
3. Phone number:
4. Position:
5. District:
6. Number of years in current position:
Appendix F
Note Requesting Expert
This is taken from a phone call requesting the professional expert to be part of
analyzing the coding for the study.
Researcher: Good morning, I am writing my dissertation and am in the process of coding my data. My dissertation is on what strategies principals
perceived were effective in improving ELA SBAC scores for their school site.
I was wondering if you would be interested in reviewing the data and themes
that I have been able to develop using NVivo for my study?
Expert: Yes, I would love to help you to review and analyze the data. I will be available this week to go over it.
Researcher: Thank you. I will give you a text with some times that I have
available and see if any of them work for you. Thank you again.