title electronic state of fe⁴ 稀 ions in perovskite-type
TRANSCRIPT
Title Electronic State of Fe⁴� Ions in Perovskite-Type Oxides
Author(s) Takano, Mikio; Takeda, Yasuo
Citation Bulletin of the Institute for Chemical Research, KyotoUniversity (1983), 61(5-6): 406-425
Issue Date 1983-11
URL http://hdl.handle.net/2433/77050
Right
Type Departmental Bulletin Paper
Textversion publisher
Kyoto University

Bull. Inst. Chem. Res., Kyoto Univ., Vol. 61, No. 5-.6, 1983
11111AlIAllA111111lllilllllll Review 11111111111111111111111111111111
Electronic State of Fe4+ Ions in Perovskite-Type Oxides
Mikio TAKANO* and Yasuo TAKEDA**
Received October 30, [983
Our MSssbauer effect studies on the electronic state of Fe4+ ions in perovskite-type oxides, Cax_zSrrFeO3 (05x51), Sr3_yLa,Fe03 (OS y50.6), and some others, are summarized and discussed.
The Fe4+ ions take a high spin state, t4eg, and the eg electrons are accommodated in a narrow a* band. The quarter-filled a* band state is stable down to the lowest temperature in SrFeO3.
However, when the Sr-content is enough decreased, the eg electrons get localized at low temperatures
in a special way to form a mixed valence state, that is, a charge disproportionation of the Fe4+ ions
into Fe3+ (t4e2g) and Fe5+(t2) ions which can be seen typically in CaFeO3 and Sr0,7La0.3Fe03. In the intermediate composition ranges of 0<x<1 and 0<y<0.3 quite unusual intermediate states are
realized and, hence, the chemical formulas of these oxides at low temperatures can be expressed
conveniently as Cal_ xSr.Feo s+e>+FeosS °)+03 and Srl_,LayFen37,Fe(i:7203•
KEY WORDS: Perovskite/ Fe4+/ Fes+/ Charge Disproportionation/ Mossbauer Effect/
1. INTRODUCTION
An Fe atom has six 3d electrons and two 4s electrons in its neutral state and, therefore, can take various ionic valence states of 1 + to 8+ by releasing these elec- trons. However, the valence states stabilized in oxides are, at the present stage,
limited to from 2+ to 6+. These ions are rather small in size and can be suitably accommodated in oxygen-polyhedra such as octahedra and tetrahedra. The num-
bers of oxides containing Fe' and/or Fe3+ ions are very large, and some of them have been very useful to our daily life. For example, a-Fe203 exhibits various
tones of reddish color depending on the particle size and can be used as a pigment.
r-Fe203 with a metal-deficient spinel structure is ferrimagnetic and is a useful mag- netic recording material. On the other hand, the numbers of oxides containing
highly charged ions, Fe4+ to Fes+ ions, are very small because these valence states are stabilized under strongly oxidizing conditions. We have been interested in
perovskite-type oxides containing Fe4+ ions for the last several years. The behavior of d electrons changes in a very interesting way depending on temperature, oxygen
deficiency, and also on such cations as Sr and Ca coexisting with iron in the same crystal. We summarize and discuss the experimental results in this paper, hoping
that these oxides also become useful. In fact some investigators are now trying to
* A¢} A : Laboratory of Solid State Chemistry, Institute for Chemical Research, Kyoto University, Uji, Kyoto 611.
** Amiga : Department of Chemistry, Faculty of Engineering, Mie University, Tsu 514.
(406)
Electronic State of Fe4+ Ions in Perovskite-type Oxides
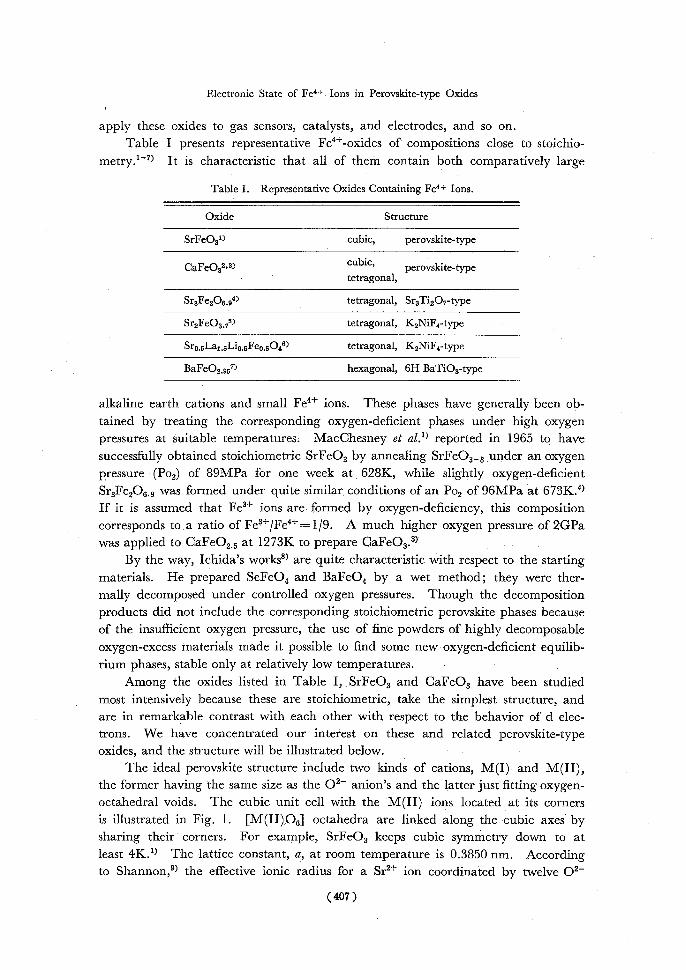
apply these oxides to gas sensors, catalysts, and electrodes, and so on. Table I presents representative Fe4+-oxides of compositions close to stoichio-
metry.' 7) It is characteristic that all of them contain both comparatively large
Table I. Representative Oxides Containing Fe4+ Ions.
OxideStructure
SrFeO31)cubic, perovskite-type
CaFeO32'3cubic, perovskite-type tetragonal,
Sr3Fe206,94>tetragonal, Sr3Ti20,-type
Sr2FeO3,75)tetragonal, K2NiF4-type
Sr6,5La1,5Li6,5Fe6,5046) tetragonal, K2NiF4-type
BaFeO2.957)hexagonal, 6H BaTiO3-type
alkaline earth cations and small Fe4+ ions. These phases have generally been ob-tained by treating the corresponding oxygen-deficient phases under high oxygen
pressures at suitable temperatures. MacChesney et a1.1> reported in 1965 to have successfully obtained stoichiometric SrFeO3 by annealing SrFeO3_8 under an oxygen
pressure (Po2) of 89MPa for one week at 628K, while slightly oxygen-deficient Sr3Fe206,9 was formed under quite similar conditions of an Po2 of 96MPa at 673K.4) If it is assumed that Fe3+ ions are formed by oxygen-deficiency, this composition
corresponds to a ratio of Fe3+/Fe4+=1 /9. A much higher oxygen pressure of 2GPa was applied to CaFeO2.5 at 1273K to prepare CaFe03.3)
By the way, Ichida's works') are quite characteristic with respect to the starting materials. He prepared SeFeO4 and BaFeO4 by a wet method; they were ther-mally decomposed under controlled oxygen pressures. Though the decomposition
products did not include the corresponding stoichiometric perovskite phases because of the insufficient oxygen pressure, the use of fine powders of highly decomposable oxygen-excess materials made it possible to find some new oxygen-deficient equilib-rium phases, stable only at relatively low temperatures.
Among the oxides listed in Table I, SrFeO3 and CaFeO3 have been studied
most intensively because these are stoichiometric, take the simplest structure, and are in remarkable contrast with each other with respect to the behavior of d elec-trons. We have concentrated our interest on these and related perovskite-type oxides, and the structure will be illustrated below.
The ideal perovskite structure include two kinds of cations, M(I) and M(II), the former having the same size as the 02- anion's and the latter just fitting oxygen-octahedral voids. The cubic unit cell with the M(II) ions located at its corners is illustrated in Fig. 1. [M(II)06] octahedra are linked along the cubic axes by sharing their corners. For example, SrFeO3 keeps cubic symmetry down to at least 4K." The lattice constant, a, at room temperature is 0.3850 nm. According to Shannon,9> the effective ionic radius for a Sr2+ ion coordinated by twelve 02-
(407)

M. TAKANO and Y. TAKEDA
•
• 1=_~1^ •••~—si0 M(I)
~~~•p 02 •0 •
tormarir • MO!)
•
Fig. 1. Unit cell of the perovskite structure.
ions, r(XIISr2+), is 0.144 nm and that of an octahedrally coordinated Fed+ ion, r("IFe4+), is 0.585 nm when r(v102-)=0.140 nm is assumed.
2. ELECTRONIC STATEto,11)
When a transition metal ion is located at the center of an oxygen octahedron,
the fivefold-degenerate d orbitals are split into twofold-degenerate orbitals of eg
symmetry and threefold-degenerate orbitals of t2g symmetry. The octahedral crystal
field and covalent mixing with the anionic p orbitals make the eg orbitals energetically
unfavorable by I ODq. in comparison with the t2g's. An Fe4+ ion has four 3d electrons,
and two kinds of electronic configurations are possible: one is the high spin state,
t2geg, and the other is t2geg, the low spin state. The latter state is stabilized at the expense of intra-atomic exchange interaction when IODQ is large enough.
When [M(II)06] octahedra are linked to form perovskite structure, a stabili-zation of the electronic state by a virtual transfer of d electrons from one transition metal ion to near-neighboring metal ions should be taken into account. Such a transfer via an intervening anion is, generally, more important as the covalent mixing
of the relevant metallic and anionic orbitals is larger. However, the electron-elec-tron Coulomb energy at the neighboring M(II) ions is increased. So, two kinds of typical d electron states can be assumed. One is an itinerant state with a broad energy band to accommodate the d electrons. The crystal tends to keep high sym-metry to maintain the strong orbital overlapping. A typical example is LaNiO3. The Ni3+ ion is in the low spin state of t2geg. The a* band is formed from the crystal-field eg(Ni3+) orbitals containing the p,(O2-) orbitals. The broadened, quarter-filled a* band gives metallic conductivity and Pauli paramagnetism. The other is a localized state. The metal ions keep their localized magnetic moments, and the conductivity is semiconductive. Moreover, if the ground state is orbital-de-generate, the degeneracy may be lift by distorting the surrounding oxygen-octa-hedron according to the Jahn-Teller effect. LaMnO3 is a typical example. The Mn3+ ion takes the high spin state of tzgeg, and the cooperative crystalline distor-tion to orthorhombic symmetry occurs at about 880K.
LaMnO3 and LaNiO3 are, thus, in good contrast with respect to their eg elec-
trons. Studies on SfFeO3i CaFeO3, and some related oxides have shown that the
Fe4+ ion also has a single electron in the two-fold eg orbitals which form a narrow
(408)

Electronic State of Fe4+ Ions in Perovskite-type Oxides
a* band (i.e. the high spin state) and that the behavior of the eg electron can be characterized aptly by a disproportionation of the Fe4+ ions into Fe3+ and "Fes+"
ions, i.e.
2Fe4+(t2g0*1) (high temperature phase) Fe+(t4eg) +Fes+(tsgeg) (low temperature phase)
3. SrFeO3 AND CaFeO3
3.1. SrFeO3
The properties of SrFeO3 will be summarized and discussed below. The elec-trical resistivity measured on a sintered body is rather low, 10-3 SZ cm, and almost temperature independent.') This suggests the existence of itinerant d electrons. Magnetic susceptibility') and neutron diffraction12) measurements revealed that
this oxide is an antiferromagnet having a screw spin structure with a propagation vector parallel to the <111> direction (TN=134K). The angle between the mag-netic moments of the nearest-neighboring Fe ions is only about 40°. The magnetic exchange interactions estimated from a paramagnetic neutron-scattering measure-ment") range from the ferromagnetic nearest-neighbor interaction of J1=1.2 meV
to the antiferromagnetic second- . and fourth-nearest-neighbor interactions of J2= —0.1 meV and J4= —0.3 meV. The coexistence of these interactions of opposite
signs results in the special type of spin structure. The magnitude of magnetic moment can be the key to an understanding of
the electronic state. An estimation by neutron techniques is, however, rather com-
plicated: two research groups have reported different values. Takeda et al.13> made a measurement on a powdered SrFeO3 sample and obtained a value of ,aFe4+=3.1 AB
at 4K. On the other hand, Watanabe et a1.14) made measurements on single crystals of slightly nonstoichiometric SrFe02.9i and the magnetic moment was /2 e4+=5 AB in the paramagnetic state and ,aFe4+=2.211 B at 4K. A high spin transi-tion at TN was suggested accordingly. This disagreement comes from the samples they used and also from the analysis of the intensity data. So, it may be better
to refer to another kind of measurement. According to Takeda et al.,15) the high-field magnetization of SrFe1_xCox03 at 4K, which is ferromagnetic for 0.2<x<1, increases linearly with increasing Fe-content and the value extrapolated to SrFeO3
(x=0) corresponds to ,aFe4+=333t B. This is very close to the spin-only value of 4 AB expected from the high spin state. On the other hand, the Mossbauer effect
(ME) measurements on SrCoo.9957Feo.o103 (x=0.99), SrCo0.3Feo.303 (x=0.5),16) and SrFe0317) showed that the electronic state of the Fe ions remains almost the same: the isomer shift is almost independent of composition, 5=-40.05 mms-1 at room tem-
perature, and the hyperfine field at 4K varies monotonically as 29.6 T for x=0.99, 30.2 T for x=0.5, and 33.1 T for x=0. Such a possibility that the electronic state of the Fe4+ ions changes within a composition range of 0<x�_ 0.2 to the low spin state is rejected particularly by the absence of a corresponding change in hyperfine field. Thus, the magnetization and ME measurements on SrCo,_xFexO3 strongly suggest that the Fe4+ ions in SrFeO3 are in the high spin state.
( 409 )

M. TAKANO and Y. TAKEDA
SrFeO3 having been the first stoichiometric phase, the ME measurement by
Gallagher et al.'7 attracted keen attention. The spectra they obtained were very
simple and beautiful as can be seen in Fig. 2. A single narrow absorption line with
300K
-3 -2 -1 0 1 - 2----------------------3
TV11- 78K i 1 1 1 . J 1 1 1 1
44K
-1 1 I J it 1 I 1 -10 -• -• -• -2 0 2 • • • 10
velocity/mms-1 (vs. Fe in Cu)
Fig. 2. Mossbauer spectra of SrFeO3.1 )
an isomer shift (IS) of 0.05 mms-1 was observed at room temperature, and a single set of magnetically split absorptions characterized by a magnetic hyperfine field
(Hi) of 33.1 T and an IS of 0.146 mms-1 appeared at 4K. A quadrupole inter- action was not detected. It sometimes happens that structural studies on powdered
samples by X-ray or neutron diffraction fail to detect short-range ordered distortions, but the absence of a quadrupole interaction down to 4K rules out this possibility and, hence, the possibility of a stabilization of the high spin state by the Jahn-Teller
effect. The cubic structure and good conductivity retained at least down to 4K and
the values of the magnetic moment and the Hi support strongly the quarter-filled narrow a* band model.
3.2. CaFeO3
The girdle-type high pressure apparatus we used to prepare CaFeO3 is illus- trated in Fig. 3. A sandwich type platinum cell was charged with powders of the
starting material, CaFe02 ,5, and an oxygen generator, CaO, or Cr03. To prevent the direct reaction of these materials a Zr02 disk was interposed. After applying
a pressure of 1.5-6 GPa the platinum cell was heated to 1173—j1273K to promote
(410 )

Electronic State of Fe"- Ions in Perovskite-type Oxides
WC-piston
4i45 00 composite//_ gasket'!.
<---- pyrophyllite steel
Cr03orZ_pt-foil
CaOZ` sample—,----------—2rOZ
WC-cylinderCaFeO fired=2254— Pt-tube
pyrophyllite V/, pyrophyllite,,
0011'M-16 mm~'' 0
Fig. 3. Girdle-type high pressure apparatus used for the preparation of CaFeO3.
release of oxygen from the peroxide and absorption by CaFeO2.5. After repeated trials, the most convenient and sufficient conditions were found to be of 2 GPa and 1273K. The oxygen content was checked by the weight change on reducing the
product to CaFeO2.5 at 1473K in air.3> The crystal data determined by powder X-ray diffraction are given in Table
II. The tetramolecular unit cell results from a slight distortion of the perovskite
Table II. Crystal Data for CaFeO3 and SrFeO3 at Room Temperature.
OxideSymmetry Lattice Constants Volume per Molecule
SrFeO31) cubica=0.3850 nm 5.707 x 10⁻² nm3
CaFeO33j tetragonala=0.5325nm 5.373 x 10⁻² nm3 c=0.7579 nm
cell. This seems to be due to an imperfect combination of the ionic radii; the radius of the Ca2+ ion, r(xIICa2+)=0.134 nm,91 is slightly smaller than that of the 02_ ion. Cubic SrTiO3 and orthorhombic CaTiO3 afford a parallel pair.
Measurements of magnetic susceptibility and electrical resistivity were made between room temperature and 77K.3) The susceptibility showed a typical anti-
ferromagnetic behavior with its maximum at 115K as shown in Fig. 4. We, un-fortunately, found difficulty to obtain reproducible resistivity data, which may be due to the small sample volumes, small cracks in the sintered bodies, and contami-nations. However, at the present stage, we can say at least that the resistivity at room temperature is 10 S2 cm, which is 104 times that of SrFeO3 and that the temperature dependence is semiconductive: the difference in resistivity increases with decreasing temperature. In near future these kinds of measurements will be repeated on samples of more suitable volume and better quality.
(411)

M. TAKANO and Y. TAKEDA
~"~~----------------------------------------------------------1 1 1I1
2.0 -
v V. 1.5 - . •
•
1.0 -'' ... N
100200300 T/K Fig. 4. Temperature dependence of magnetic susceptibility of CaFeO3.
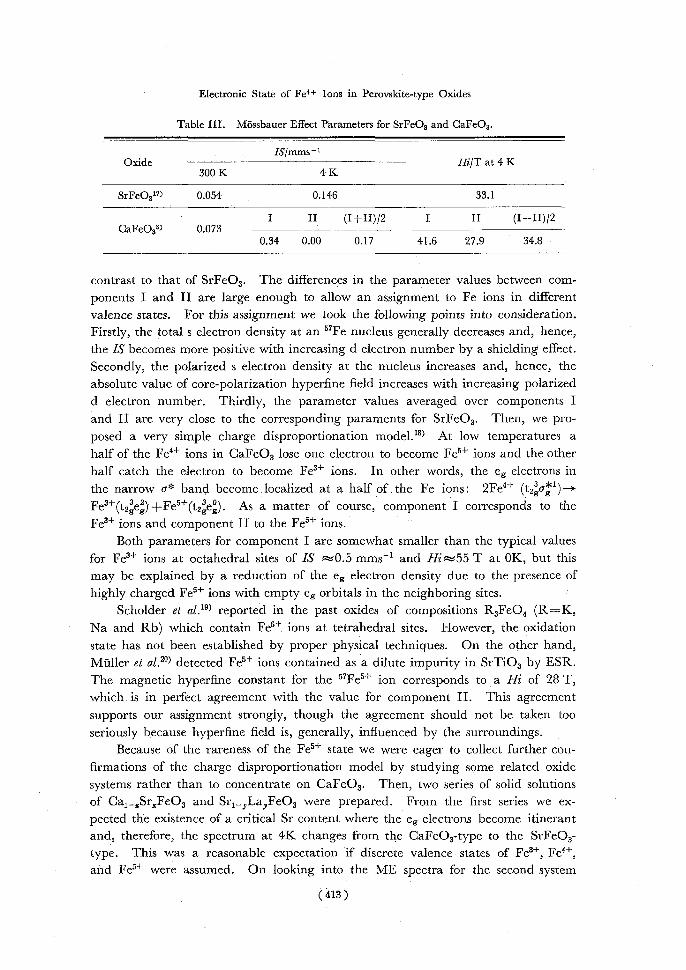
The samples used for ME measurements were enriched with 57Fe up to about 10% to compensate the small sample volume. The spectra') are shown in Fig. 5, and the parameters are given in Table III together with those for SrFeO3.17)
A sharp absorption peak without any trace of undesirable absorption by Fe3+
ions was observed at room temperature, which assured the proper stoichiometry of our sample. The IS is very close to that of SrFeO3, suggesting that the Fe ions in CaFeO3 and SrFeO3 have similar electronic states. However, the spectrum at 4K consists of two sets of magnetic hyperfine patterns of equal intensities in sharp
i .. 300K
3 2 1 0 1 2 3 velocit—1 y/mms
4K
I cly I-------------------------------------------------------------------------------------------------I I I I crl>
1 I I f 1 I I -i -8 —6 —4 —2 0 2 4 6 8
velocit—1 Y/mms
Fig. 5. Mossbauer spectra of CaFeO3.
(412)
Electronic State of Fe"- Ions in Perovskite-type Oxides
Table III. Mossbauer Effect Parameters for SrFeO3 and CaFeO3.
ISimms-1 OxideHilT at 4 K
300 K4 K
SrFe0317) 0.0540.14633.1
I II (I+II)/2I II (I+II)12 CaFeO33) 0.073
0.34 0.00 0.1741.6 27.9 34.8
contrast to that of SrFeO3. The differences in the parameter values between com-
ponents I and II are large enough to allow an assignment to Fe ions in different valence states. For this assignment we took the following points into consideration.
Firstly, the total s electron density at an 57Fe nucleus generally decreases and, hence,
the IS becomes more positive with increasing d electron number by a shielding effect.
Secondly, the polarized s electron density at the nucleus increases and, hence, the
absolute value of core-polarization hyperfine field increases with increasing polarized
d electron number. Thirdly, the parameter values averaged over components I
and II are very close to the corresponding paraments for SrFeO3. Then, we pro-
posed a very simple charge disproportionation model.18) At low temperatures a half of the Fe4+ ions in CaFeO3 lose one electron to become FeS+ ions and the other
half catch the electron to become Fe3+ ions. In other words, the eg electrons in
the narrow a* band become . localized at a half of the Fe ions: 2Fe4+ (t2gag 1) —> Fe3+(t2geg) +Fes+(t2geg) . As a matter of course, component I corresponds to the Fe3+ ions and component II to the FeS+ ions.
Both parameters for component I are somewhat smaller than the typical values
for Fe" ions at octahedral sites of IS P. mms-1 and Hi^-,55 T at OK, but this may be explained by a reduction of the eg electron density due to the presence of highly charged FeS+ ions with empty eg orbitals in the neighboring sites.
Scholder et a1.19> reported in the past oxides of compositions R3FeO4 (R=K, Na and Rb) which contain FeS+ ions at tetrahedral sites. However, the oxidation state has not been established by proper physical techniques. On the other hand, Muller el a1.201 detected FeS+ ions contained as a dilute impurity in SrTiO3 by ESR. The magnetic hyperfine constant for the 57Fe5+ ion corresponds to a Hi of 28 T, which is in perfect agreement with the value for component II. This agreement supports our assignment strongly, though the agreement should not be taken too
seriously because hyperfine field is, generally, influenced by the surroundings. Because of the rareness of the FeS+ state we were eager to collect further con-
firmations of the charge disproportionation model by studying some related oxide systems rather than to concentrate on CaFeO3. Then, two series of solid solutions of Ca1_xSrxFeO3 and Sr1_,LayFeO3 were prepared. From the first series we ex-
pected the existence of a critical Sr content where the eg electrons become itinerant and, therefore, the spectrum at 4K changes from the CaFeO3-type to the SrFeO3-type. This was a reasonable expectation if discrete valence states of Fe3+, Fe4+, and FeS+ were assumed. On looking into the ME spectra for the second system
(413)

M. TAKANO and Y. TAKEDA
reported by Gallagher and MacChesney,21) we became confident that substitution
of La' ions for Sr' ions induces a similar disproportionation. Then, we expected to observe a reasonable composition dependence of the Fe3+/Fe5+ ratio.
3.3. Ca1_xSrxFeO3.
Samples of compositions x=0.125, 0.25, 0.5, 0.625, and 0.75 were prepared by the same method as was applied to the preparation of CaFeO3.22) The applied
pressure was 2.5 GPa and the samples were heated to 1273K. The substitution of x>0.125 makes the structure cubic. The lattice constant
increases almost linearly with x as shown in Fig. 6. Magnetic susceptibility meas-urements indicated that all the compositions are antiferromagnetic.
0.385• 0
Eo C0 fCp
0.380 0 0 0
0 0.5 x 1
Fig. 6. Composition dependence of lattice constant of Cal_xSrxFe03. The value for CaFe03 is the
cubic root of the volume per mole.
The ME spectrum at room temperature consists of a single line for every com-
position, and the IS of 0.06 mms-1 is independent of composition within experi-mental error, indicating that there is no remarkable change in the electronic state. However, at 4K, we observed an unexpected composition dependence. As can be seen in Fig. 7, there is no sharp change in the character of the spectrum: even
Cao.25Sro,75FeO3 exhibits double components. Continuously with increasing Sr content, the absorption lines become broader and, at the same time, the differences in the
parameters between the double components become smaller. The spectra were computer-analyzed using broadened Lorentzian lines for convenience. Areas of the double components are almost the same for any composition. The parameter values are plotted in Fig. 8. It is quite impressive that the double components merge into one at x= I.
These results supported our model in the sense that the Fe' ions dispro-
portionated into equal numbers of Fe ions having valences higher and lower than 4+ but, at the same time, gave rise to another problem of indiscrete, continuous valence.
3.4. Sr1_,,LayFeO3.
Some stoichiometric perovskite phases of the Sr1_,,LayFeO3 system were studied by Gallagher and MacChesney21) in the past (this work will be referred to as GM, hereafter). They observed average valence states due to a rapid electron exchange,
(414 )

Electronic State of Fe4+ Ions in Perovskity-tepe Oxides
''T \ T1T~ T '
:. 0.75
7.--,,, (7.7rierr-TIT -------,,7" • — ...... ,
ItlK•`.0.625
Uf ... -~T . ~rlT-i7- ',,,T1 ~
i ''9, '0 .5
A..,,,,„,. .,,,,..:„,,„...,.....
ii'/j~J ':i, Y1
0.25
, \I i I \CiI 0.125
8 vvelocity/mms-1 8
Fig. 7. Mossbauer spectra of Cal _xSrzFeO3 at 4K.
which may be expressed as Fe4-v)+, for y<0.6 at room temperature. On the other hand, they obtained complex spectra at 4K, which were interpreted as indicating
a resolution into the individual valence states of Fe' and Fe4+. Sro,6La0 4FeO3
particularly exhibited well resolved double components. However, though Fe3+/ Fe4+=4/6 for this composition, the intensity ratio of the corresponding components was indicative of Fe3+/Fe4+> 1. If a charge disproportionation is supposed to occur instead, the expected ratio of Fe3+/Fe5+= (1 +y)/(1 y) should be larger than unity. Then, we repeated ME measurements on this system expecting an application of our model.2)
Samples of compositions of y=0.1, 0.2, 0.3, 0.5, and 0.6 were treated finally under oxygen pressures of 100,-150 MPa at 673--873K for 170-500 hr depending
(415)

M. TAKANO- and Y. TAKEDA - -
40.0- O\p
O~
0 e ~\ ~° O
2 -----^/' 30.0 -
0 0.5 X1.0
(
0.30 Q I °-~ o
0.2 O —
L--- _° r 2—°
0.00- -^ n II
Fig. 8. Composition dependence of isomer shift and magnetic hyperfine field of Cal_xSrxFeO3 at 4 K.
upon composition.The crystal data obtained by powder x-ray diffraction measure-
ments are given in Table IV. The data are in excellent agreement with those by
GM except for the case ofy=0.3 to which GM assigned cubic symmetry. The tem-
perature dependence of the magnetization is shown in Fig. 9. Antiferromagnetism with or without parasitic ferromagnetism, depending upon crystalline symmetry,
was observed. The temperature of a magnetic anomaly indicated as Tm in Fig. 9,
is also given in Table IV. As will be described later, the ME measurements on
Table IV. Crystal Data and Tm for Srl_yLayFeO3.
Composition Symmetry Lattice Constants VolumeTm
0.1cubica=0.38590 nm 5.747 x 10⁻² nm3 114 K
0.2cubica=0.38652 nm 5.775 x 10⁻² nm3 139 K
0.3 rhombohedrala=0.3873 nm 5.810 x 10⁻² nm3 199 K a=90.05°
0.5 rhombohedrala=0.3889nm* 5.882 x 10-2 nm3 230 K a=90.26°*
0.6 rhombohedrala=0.3896 nm* 5.913 x 10-2 nm3 >300 K a=90.333°*
* The data given by GM21) explain very well the diffraction pattern of our sample .'
(416 )

Electronic State of Fe4+ Ions in Perovskite-type Oxides
100200 300 II
450-450
0.6
400--400
.o150- 03-350
E 100--100
0.2
0.5 50- 03-50
T
TII- 100200 300
T/K Fig. 9. Temperature dependence of magnetization of Sri_,La,FeO3.
compositions of y=0.3 and 0.5 revealed that these anomalies do not correspond to a normal second order transition.
Electrical resistivity was measured for the compositions of y=0.3 and 0.5. As can be seen in Fig. 10 there exist two temperature ranges where the resistivity shows a normal semidonductive temperature dependence with a fixed activation energy for both compositions. Sandwiched between these is an unusual range, the high temperature end of which is close to the Tm.
E4— /.
02_116I5K~/0.50.3~•— 0Wi
1—123K
235K.
0I1~ +.• --------------------------------------------------1 I I 1 I 4,a/'`168 10
-1—189 K103/ T/ K-1
Fig. 10. Temperature dependence of electrical resistivity of Sro,7La0 3FeO3 (y=0.3) and Sr0.5La0.5FeO3 (y=0.5).
(417 )

M. TAKANO and Y. TAKEDA
The ME spectra at room temperature are shown in Fig. 11. In agreement with GM we observed a single absorption peak or a single quadrupole doublet for y<0.5. The spectrum for y=0.6 has a magnetically perturbed background and was not computer-analyzed. However, the central absorption line is quite similar to that for y=0.5. The IS increases linearly with y as plotted in Fig. 12: the Fe ions have an averaged eg electron number of (1-]-y) /Fe.
r : 0.48
0.1I S: 0.09
r : 0.48 0.2I S: 0.11
r :0.47
0.3I S: 0.15 QS: 0.21
r : 0.45
0.5I S: 0.19 QS: 0.18
Y =w
0.6I S: =0 .2
-4 -2 0 2 4
V / m m s-'
Fig. 11. Mossbauer spectra of Srt_,LayFe03 at 300 K.
eo 0.40
0.2/~o0 ,-o
0.0 o-~o / 00.5x 1.0
Fig. 12. Composition dependence of isomer shift of Srl_yLayFeO3 at 300 K.
(418)

Electronic Stateeof Fe4+ Ions in Perovskite-type Oxides
A typical disproportionation meeting to our expectations was observed for
Sra.7Lao.3FeO3 at 4K. As shown in Fig. 13, the absorption lines are sharp and
are well-resolved. The IS's and Hi's for the double components are rather close to those for CaFeO3. The intensity ratio is, however, not unity as it is for CaFeO3,
but is 66:34, just fitting the composition of Sro.7La0.3Feos5Feos5O3. Quite a
similar, well-resolved spectrum was reported for the composition of y=0.4 by GM. The intensity ratio was not reported, but it seems to be favorable for our model.
• •0.2
0.3
0.5
• • 0 .6
• 1 11 -10 -5 0 510
vetocity/mms-I
Fig. 13. MSssbauer spectra of Sri_,,Las,Fe03 at 4 K.
Resolution into two components becomes poorer with increasing Sr content as
noted in Cai_xSr„FeO3i too. For y = 0.1, the components are so close to each
other that the spectrum looks almost like a single set of magnetic pattern.
On the other hand, as the Sr content is increased, three or more compo-
nents appear to make the spectra quite complex.24) Though the presence of more
than two components is beyond our model, we suggest that these can be divided
into two groups according to the parameter values and that the relative intensity
is close to the expected value as seen in Table V.
(419)

M. TAKANO and Y. TAKEDA
Table V. Mossbauer Data for Sr1_yLayFe03 at 4 K.
CompositionISHiI y Component (mms-1) (T)(%)
I0.20 34.556 0.1 II0.12 32.844 ay. 0.16 33.6
I ~0.33 ~43~60 0.2 II ~0.05 ~31~40
ay. ~0.19 ~37
I0.36 46.066 0.3 II -0.05 26.934 ay. 0.16 36.5
I0.44 50.572
0.5TI0.00 26.213 TI' 0.10 29.815
ay. 0.25 39.3
I0.44 54.239 I'0.42 50.437
0.6 TI -0.05 26.614 II' 0.12 29.310
ay. 0.23 40.1
3.5, CaFeO3 and Sr0.7La0,3FeO3 at Intermediate Temperatures.
We have described the composition and temperature dependence of the elec-tronic state of the "Fe4+" ions up to now and emphasized the disproportionation in
CaFeO3 and Sr0.7Lao,3FeO3 by showing the ME spectra at room temperature and 4K. It has been very interesting for us, as a matter of course, to study these oxides in the intermediate temperature range.
Some of the spectra for CaFeO3 at various temperatures between 300K and 77K are shown in Fig. l4.2'an As can be seen most clearly in the spectrum at 154K, a pair of peaks of equal intensities appeared below about 290K. These double
peaks can be interpreted in two ways; one is a temperature-dependent quadrupole interaction and the other is the onset of the disproportionation. We take the latter considering the following points. Firstly, though the crystal is slightly distorted from cubic symmetry even at 300K, any sign of quadrupole interaction cannot be detected in the well-resolved spectrum at 4K. The quadrupole interaction is prob-
ably negligibly small below 300K. Secondly, the separation between the double
peaks gets saturated at about 160K as shown in Fig. 15a, and the value of 0.32 rums' is coincident with the difference in IS between the Fe3+ and FeS+ ions at 4K. The
peak positions, namely, the /S's of the Fe3+ and FeS+ ions at 154K are more negative by mms-1 than those at 4K, which can be explained by the second order Doppler effect.
(420)

Electronic State of Fe4+ Ions. in Perovskite-type Oxides
285 K
•~ r
. 266 K
.car.,ti~,;.v+.u^.w.wew"w..,, .r.~f . ~..rry~.+ v.5r.+~•..
154 K
A. 4.. 1 1 3 K '5
•
Y~~• •_
p
One f110 K • y.%,'H
-32 -1 0 1 2 3 4 velocity/mms-'
Fig. 14. Mossbauer spectra of CaFeO3 at intermediate temperatures.
O. _0----------------------
E 0.2- a a 0------------------------------------------
100 200 T/ K 300
ir///~o 20
0_ 0100 200 T/K 300
Fig. 15. (a) Temperature dependence of the difference in isomer shift between the two kinds of Fe ions in CaFeO3. (b) Tem-
perature dependence of the magnetic hyperfine fields of the Fe3+ and Fe5+ ions in CaFeO3.
(421)

M. Tntcano and Y. TAIEnn
The Hi's plotted in Fig. 15b indicate a normal second order transition. Thus, we conclude that CaFeO3 shows a transition from its paramagnetic average valence
phase (Pa-phase) to the mixed valence phase (Pm) at 290K and, next, a second order transition to the antiferromagnetic mixed valence phase (Am) at 115K. It is noteworthy that the disproportionation proceeds passing through the temperature-dependent intermediate state as can be seen clearly in Fig. 15a.
Sro.,La0•3FeO3 shows quite a different behavior.23> A . paramagnetic and an antiferromagnetic pattern are superimposed over a wide temperature range as shown in Fig. 16. It should be noted that the resolution into double components
:186K
174K
,164 K
A • ,n j...•~r f
P.
' ~.• —
•r; N.14.• • 105 K t •• ••
• •
•
I-------------------------------------------------------------------------------------------------------------------------------------------------------------------------------------I I I I I I I I I I —8 —4 04 8
velocity/mm s'I Fig. 16. Mossbauer spectra of SroaLa0.3FeO3 at intermediate temperatures.
can be seen only in the antiferromagnetic pattern. Its intensity decreases with
increasing temperature to vanish asymptotically at the Tm, the temperature of the
magnetic and electrical anomaly. The magnetic splittings remain, however, large
even at this temperature. This observation indicates that below the Tm there appear
domains in the crystal making a first-order transition from the Pa-phase to the Am
phase and that the total volume becomes full at about 130K. The transition tem-
perature might be so susceptible to a locally fluctuating La content that these phases
(422)

Electronic State of Fe4+ Ions in Perovskite-type Oxides
coexist over the wide temperature range. Spectra of quite a similar character were obtained from Sro.,Lao,5Fe03 and also from Cao.SSro.5Fe03. The anomalies detected by the magnetic and electrical measurements for these oxides should not be taken as indicating a normal second order antiferromagnetic transition.
The types of transition we have observed are summarized below.
SrFeO3: Pa (134K)---*Aa,
CaFeO3: Pa (290K)—>Pm (115K) Am,
Sr07Lao.3Fe03: Pa (190—.130K)—>Am,
where P, A, a, and m stand for paramagnetic, antiferromagnetic, average valence
phase, and mixed valence phase, respectively.
4. SUMMARY
The Fe' ions in SrFeO3 take the high spin state of t2geg, and the eg electrons are accommodated in the a* band, which is narrow enough to allow polarization of the electrons. The quater-filled, narrow a* band state is stable at least down to 4K.
When the Sr ions are completely replaced by Ca ions to form CaFeO3, the a* band state becomes unstable at 290K, and the Fe" ions disproportionate into equal numbers of Fe3+ and Fe" ions passing through temperature-dependent in-
termediate valence states: Substitution of La" ions for the Sr' ions to form Srl_yLayFe03 leads to an in-
crease in the eg electron number from unity to (1-1-y) /Fe. These additional elec-trons are also accommodated in the a* band so that all the Fe ions take compo-sition-dependent, average valence state. However, at low temperatures the first-
order transition to the antiferromagnetic, mixed valence phase containing Fe3+ and Fe" ions of a ratio of (1+y)/2: (1-y)/2 occurs for y=0.3'-0.4.
In Fig. 17 the IS- and Hi-values for Cal_xSrxFeO3 and Sr1_yLayFeO3 at 4K
are plotted. Figure 17a gives the values for the individual components, and Fig. 17b the averaged values corresponding to the virtual Fe' states. It is im-
pressive that both these parameters take a wide range of continuous values keeping a beautiful correlation between them. On the other hand, the averaged values show a good convergence around the point of IS = 0.15 mms-1 and Hi = 33 T, which is the point for SrFeO3. Therefore, the chemical formulas appropriate at 4K are Cal_xSrxF4. 5°)+FeosS`>+03 and Srl_y,LayFe~i+yjj2Fei= )/203, where both d and 8 increase to unity with increasing Sr content.
It is interesting to point out here the following effects of substitution. CaFeO3 has a smaller volume per molecule than that of SrFe03i and, hence, the Fe-O-Fe bond angle may be decreased to 150,--,160°, as can be roughly estimated by com-
paring the lattice constants. This bending would .reduce the a* band width and accordingly would make the electronic state susceptible to perturbations. On the other hand, the substitution of the La3+ ions to form Sro.,Lao.3FeO3 leads to an in-crease in the eg electron number to 1.3/Fe, which would also give rise to an instability
(423 )

M. TAKANO and Y. TAKEDA
12*
126 10'r
40 3 8 2 ;..3'4
10,\ 94.: \ 8
\-5 I 11116 11 2 0 (a)
N1-1
I I II+ 0 0.2 0 .4 IS /mms-' 0
.15 12 =4 0• .
• 11 35---,~, 9 (b)
30 Cal_xSrxFeO3i 1 x=1, 2: x=0.75, 3: x=0.625,
4 : x=0.5, 5 : x=0.25, 6:x=0.125,7:x=0.
Srl_yLa,Fe03i 8: y=0.1, 9: y=0.2, 10 : y=0.3, 11 : y=0.5, 12 : y=0.6.
Fig. 17. Mossbauer data for Cal_xSrxFe03 and Srl_,LayFeO3 at 4 K. (a) Data for individual components. (b) Data for the virtual
Fe4+ state.
of the a* band due to increased electron correlation. For both oxides the low tem-
perature phase contains Fe3+ and FeS+ ions which are very stable in an octahedral field. The Fe3+ ions tend, quite naturally, to be surrounded by the FeS+ ions and vice versa; at the same time, the 02- ions would be shifted towards the more highly
charged ions. So, it seems to be the coupling of the electronic system with such a phonon mode that induces the phase transition. Our powder X-ray diffraction measurement on CaFeO3 down to 77K, however, did not detect any sign of such an ordered arrangement of the Fe ions, and now we are making use of electron dif-fraction with which it would be easier to find even a short range ordering.
We have focused our attention only on the two series of oxides. However, we can mention some other interesting oxides each showing a similar phenomenon such as Sr3Fe206.9, SrFe02,R5i BaFe02,9518,,26) and Cal_ZLa2Fe03.27'28) As can be most clearly seen in SrFe02,85, oxygen deficiency also can induce a disproportiona-tion.26) By the way, interesting to compare with are the oxides prepared and char-
acterized recently by Demazeau et al.,6,29) Mo.5Lai.6Lio5Fe 04 (M=Ca, Sr, Ba) of the K2NiF4 structure and LaLi0,5Fea 503 of. the perovskite structure; Fe4+ ions
take a localized, high spin state in the former and a high concentration of FeS+ ions are stabilized in the latter.
As described above oxides of the perovskite-type structure and of some related
(424)
Electronic State of Fe4+ Ions in Perovskite-type Oxides
structures containing highly charged Fe ions present a very interesting field of re-search from the viewpoints of physics, chemistry, theory, and experiment. We hope that further researches open a way to practical use of these oxides.
ACKNOWLEDGMENTS
The original works were made while the authors, M.T. and Y.T., belonged to
Konan University and Nagoya University, respectively. They greatly appreciate discussions with and encouragements by Professor N. Nakanishi, Mr. J. Kawachi
(Konan University), Professor S. Naka (Nagoya University), Professors T. Takada, Y. Bando, and T. Shinjo (Kyoto University).
REFERENCES
(1) J.B. MacChesney, R.C. Sherwood, and J.F. Potter, J. Chem. Phys., 43, 1907 (1965). (2) F. Kanamaru, H. Miyamoto, Y. Miura, M. Koizumi, M. Shimada, and S. Kume, Mat. Res.
Bull., 5, 257 (1970). ( 3) Y. Takeda, S. Naka, M. Takano, T. Shinjo, T. Takada, and M. Shimada, ibid., 13, 61 (1978).
(4) J.B. MacChesney, H.J. Williams, R.C. Sherwood, amd J.F. Potter, ibid., 1, 113 (1966). (5) P.K. Gallagher, J.B. MacChesney, and D.N.E. Buchanan, J. Chem. Phys., 45, 2466 (1966). (6) G. Demazeau, N. Chevreau, L. Fournes, J-L. Soubeyroux, Y. Takeda, M. Thomas, and M.
Pouchard, Rev. Chim. Min., 20, 155 (1983). (7) J.B. MacChesney, J.F. Potter, R.C. Sherwood, and H.J. Williams, J. Chem. Phys., 43, 3317
(1965) . (8) T. Ichida, Bull. Chem. Soc. Japan, 46, 1591 (1973) and J. Solid State Chem., 7, 308 (1973). (9) R.D. Shannon, Acta Cryst., A32, 751 (1976). (10) J.B. Goodenough and J.M. Longo, "Landolt-Bornstein Tabellen Neue Serie", III/4a, Springer-
Verlag, Berlin, 1970, p. 126.
(11) J.B. Goodenough in "Progress in Solid State Chemistry", Vol. 5, H. Reiss Ed., Pergamon Press, Oxford, 1971, Ch. 4.
(12) T. Takeda, Y. Yamaguchi, and H. Watanabe, J. Phys. Soc. Japan, 33, 967 (1972). (13) T. Takeda, S. Komura, and N. Watanabe in "FERRITES: Proc. Int. Conf. Sept.—Occ. 1980,
Japan", H. Watanabe, S. Iida, and M. Sugimoto Ed., Center for Academic Publication, Japan, 1981, p. 385.
(14) H. Watanabe, H. Oda, E. Nakamura, Y. Yamaguchi, and H. Takei, ibid., p. 381. (15) T. Takeda, S. Komura, and H. Fujii, J. Mag. Mag. Mater. 31-34, 797 (1983). (16) T. Shinjo, M. Takano, H. Taguchi, and M. Shimada, J. Phys. Colloq., 41, C1-157 (1980). (17) P.K. Gallagher, J.B. MacChesney, and D.N.E. Buchanan, J. Chem. Phys., 41, 2429 (1964). (18) M. Takano, N. Nakanishi, Y. Takeda, S. Naka, and T. Takeda, Mat. Res. Bull., 12, 923 (1977). (19) R. Scholder, Bull. Soc. Chim. Fr., 1112 (1965). (20) K.A. Muller, Th von Waldkirch, W. Berlinger, and B.W. Faughnan, Soild State Comm., 9, 1097
(1971). (21) P.K. Gallagher and J.B. MacChesney, Symp. Faraday Soc., 1, 40 (1968). (22) Y. Takeda, S. Naka, M. Takano, and N. Nakanishi, J. Phys. Colloq., 40, C2-331 (1979). (23) M. Takano, J. Kawachi, N. Nakanishi, and Y. Takeda, J. Solid State Chem., 39, 75 (1981). (24) M. Takano, N. Nakanishi, Y. Takeda, and S. Naka, J. Phys. Colloq., 40, C2-313 (1979). (25) T. Shinjo, N. Hosoito, T. Takada, M. Takano, and Y. Takeda in "FERRITES: Proc. Int.
Conf. Sept.—Oct. 198 0, Japan", H. Watanabe, S. Iida, and M. Sugimoto Ed., Center for Academic Publication, Japan, 1981, p. 383.
(26) M. Takano, N. Nakanishi, Y. Takeda, and T. Shinjo, ibid., p. 389. (27) Y. Takeda, K. Kajiura, S. Naka, and M. Takano, ibid., p. 414, (28) S. Komornicki, L. Fournes, J-C. Grenier, F. Menil, M. Pouchard, and P. Hagenmuller, Mat.
Res. Bull., 16, 969 (1981).
(29) D. Demazeau, B. Buffat, F. Menil, L. Fournes, M. Pouchard, J.M. Dance, P. Fabritchnyi, and P. Hagenmuller, Mat. Res. Bull., 16, 1465 (1981).
(425)