title: abrupt decline in the arctic winter sea ice …...popular summary before 2005, the maximum...
TRANSCRIPT
Source of Acquisition NASA Goddard Space fight Center
Title: Abrupt Decline in the Arctic Winter Sea Ice Cover Author: Josefino C. Comiso Affiliation: Cryospheric Sciences Branch, Code 614.1, NASA Goddard Space Flight Center
Journal: ScienceIAAAS
Abstract Maximum ice extents in the Arctic in 2005 and 2006 have been observed to be significantly lower (by about 6%) than the average of those of previous years starting in 1979. Since the winter maxima had been relatively stable with the trend being only about -1.5% per decade (compared to about -10% per decade for the perennial ice area), this is a significant development since signals from greenhouse warming are expected to be most prominent in winter. Negative ice anomalies are shown to be dominant in 2005 and 2006 especially in the Arctic basin and correlated with winds and surface temperature anomalies during the same period. Progressively increasing winter temperatures in the central Arctic starting in 1997 is observed with significantly higher rates of increase in 2005 and 2006. The Atlantic Oscillation (AO) indices correlate weakly with the sea ice and surface temperature anomaly data but may explain the recent shift in the perennial ice cover towards the western region. Results suggest that the trend in winter ice is finally in the process of catching up with that of the summer ice cover.
https://ntrs.nasa.gov/search.jsp?R=20070017895 2020-05-25T10:04:50+00:00Z

Popular Summary
Before 2005, the maximum extent of the Arctic winter sea ice cover as observed from satellite data has been changing modestly with the trend being negative but only about -1.5% per decade. In contrast, the area of the Arctic perennial ice cover has been declining at a rapid rate of about -10% per decade. The large difference in the trends for winter maxima and summer minima was puzzling in light of the fact that a greenhouse warming is supposed to be most prominent in winter when the Arctic is mainly in darkness and the long wave radiation dominates. Moreover, recent studies have shown that the length of melt period over the sea ice cover has been increasing at about 15 days per decade. The reduction of about 6% from the average maximum extent in 2005 and again in 2006 is a significant development because it may signify that the effects of greenhouse gases and shortening ice growth period are finally being observed in the Arctic during winter. The moderate trend in the winter ice in earlier period is consistent with trends in surface temperature data inferred from infrared satellite radiances which also show significant cooling in parts of northern Eurasia during approximately the winter period. The ice anomalies in winter are shown to be occurring primarily in the eastern part of the Arctic basin near the North Pole and this could makes the perennial ice cover even more vulnerable. The low winter ice anomaly is shown to be correlated with wind and surface temperature. The retreat in the eastern region is in part caused by wind induced advection of perennial ice to the western region and to significant delay in the onset of freeze-up in the region. The latter is an indication that the previously observed trend of 15 days per decade in the melt period over sea ice is finally being reflected in the winter sea ice cover.
Satellite winter surface temperature data, which provides a direct measurement of long wave radiation during this period, show large positive anomalies in the Central Arctic in 2005 and even greater anomalies in 2006 indicating a pattern of warming. Progressively increasing surface temperatures in the Arctic basin in winter since 1997 suggest that the low ice cover values will likely continue in the near future. Feedback effects and warming associated with greenhouse gases would further accelerate the warming which in turn reduces the length of the ice growth period and enhances the downward trend in the winter ice cover. The correlations of winter A 0 with the observed changes in the ice and surface temperatures are relatively weak but the latter is likely responsible for wind induced advections of ice in the Arctic basin and the transport of the perennial ice cover to the western region in recent years. The abrupt declines in winter ice maxima in both 2005 and 2006, however, may be a signal that the winter ice is catching up with the rapid decline in the perennial sea ice cover.

Scientific Findings
The trend in the Arctic maximum ice extents in the Arctic has been negative but relatively modest at 1.5% per decade. In contrast, the trend in the minimum ice extent has been about 8.5% per decade. In 2005 and again in 2006, however, the maximum extent values were 6% lower than the average of the extents in previous years. This development is quite significant in light of the fact that the impact of increasing greenhouse gases is supposed to be most apparent in winter when the region is in darkness and longwave radiation is most dominant. The location of anomalously low winter ice is primarily in the eastern part of the Arctic basin, near the North Pole, where the perennial ice cover becomes even more vulnerable. This phenomenon is observed to be correlated with wind and surface temperature. Persistently strong wind during the period likely caused in part the ice retreat in the region and the advection of perennial ice to the western region. Relatively warm temperatures also caused significant delays in the onset of freeze-up. The latter is likely associated with recently observed trend of 15 days per decade in the length of melt period over sea ice.
The surface temperature data indeed show large positive anomalies in the Central Arctic in 2005 and 2006 indicating a pattern of warming. Progressively increasing surface temperatures in the Arctic basin in winter since 1997 suggest that the winter ice cover will likely continue to decrease in the near future. Feedback effects and warming associated with greenhouse gases would further accelerate the downward trend in maximum extent. The correlations of winter A 0 with the observed changes in the ice and surface temperatures are relatively weak but the latter is likely responsible for wind induced advections in the sea ice cover. Overall, the low winter extents in 2005 and 2006 may signify that the trends in the winter ice cover is finally catching up with the rapid decreases in the summer ice cover observed during the last two decades.
Draft: 6/14/06 To be submitted to Science
Abrupt Decline in the Arctic Winter Sea Ice Cover
Josefino C. Comiso NASA Goddard Space Flight Center
Abstract Maximum ice extents in the Arctic in 2005 and 2006 have been observed to be significantly lower (by about 6%) than the average of those of previous years starting in 1979. Since the winter maxima had been relatively stable with the trend being only about -1.5% per decade (compared to about -10% per decade for the perennial ice area), this is a significant development because signals from greenhouse warming are expected to be most prominent in winter. Negative ice anomalies are shown to be dominant in 2005 and 2006 especially in the Arctic basin and correlated with winds and surface temperature anomalies during the same period. Progressively increasing winter temperatures in the central Arctic starting in 1998 is observed with significantly higher rates of increase in 2005 and 2006. The Atlantic Oscillation (AO) indices correlate weakly with the sea ice and surface temperature anomaly data but may explain the recent shift in the perennial ice cover towards the western region. Results suggest that the trend in winter ice is finally in the process of catching up with that of the perennial ice cover.
1. Introduction Before 2005, the maximum extent of the Arctic winter sea ice cover as observed from satellite data has been changing modestly with the trend being negative but only about -1.5% per decade. In contrast, the Arctic perennial ice area has been declining at a rapid rate of about -10% per decade (1). The rapid change in the perennial ice cover, which is ice that survives at the end of the melt period, provides an intriguing signal of a warrning Arctic. The perennial ice consists mainly of multiyear ice floes that have been the mainstay of the Arctic sea ice cover. The rapid decline of the ice enhances the ice-albedo feedback which in turn could accelerate the melt process (2). Although the ice was already observed to be on a rapid decline before this time (3) the persistently low values from 2002 to 2005 had led to speculations that the sea ice cover might have reached the tipping point (4) as the impact of ice-albedo feedback starts to dominate. Also, it led to postulates of a linear decline and a departure from what would be expected from the Arctic Oscillation (5). Meantime, a near term recovery of the perennial ice cover is not apparent since surface temperature has been increasing (I) while the ice cover in 2006 appears to be following the 2005 ice pattern.
The large difference in the trends for winter maxima and summer minima was puzzling in light of the fact that a greenhouse warming is supposed to be most prominent in winter when the Arctic is mainly in darkness and the long wave radiation dominates. The moderate trend is also consistent with trends in surface temperature data inferred from infrared satellite radiances which indicate significant cooling in parts of the Arctic during approximately the same period in winter (6). In 2005, however, an abnormally low winter ice cover maxima preceded the record low perennial ice cover during the same year. Based on statistical fluctuations from historical record, the abnormal winter in 2005 was initially considered as merely part of the natural yearly variability. However, the 2006 winter ice cover was again abnormally low and slightly lower than that of 2005. As in 2005, an abnormal ice retreat in the eastern region is also observed in the spring of 2006 and the seasonal trend suggests that the perennial ice area in 2006 will be anomalously low as well.
2. Trends in the Mid-Winter and End-of-Summer Ice Cover Two sea ice parameters that have been useful in quantifying the state of the sea ice cover are the extent and area and especially, the maximum and the minimum values. Ice extent is defined as the sum of the ice covered areas with at least 15% ice concentration while ice area is the integral sum of areas actually covered by sea ice. The ice maxima provide information about available ocean surface area that is thermodynamically conditioned for ice formation during the growth season. This is in part affected by the influence of wind that causes the transport or advection of the ice cover towards the relatively warmer south. Declines in winter ice maxima would mean northward advances of the -2.0 OC sea surface temperature (SST) isotherm and therefore a warmer ocean in the region. On the other hand, the ice minima reflect the efficiency of atmospheric and oceanic heat at melting the ice cover during the summer period. A negative trend in ice minima thus means a warmer ocean and atmosphere assuming that the percentage of ice advected out of the Arctic basin is basically constant.
Analyses of passive microwave satellite data from 1978 to the present indicate significant declines in maximum and minimum ice extents and areas (Fig. 1) but the minimum values have been changing about 6 times faster than maximum values. In Fig. la, the maximum values for 2005 and 2006 stand out as significantly lower than average values and part of a decline that started in 2003 for ice extent and 2001 for ice area. But even with the inclusion of 2005 and 2006 data, the trends of winter maximum extent and area are still low at about -1.9 % and -2.5% per decade, respectively, compared to -8.6 and -9.6% per decade for the minimum extent and area (Fig. lb). The perennial ice cover also went through large yearly fluctuations in the 1990s that might have led to higher percentages of the thinner second year ice as discussed in (3). This may have contributed to reductions in average thickness in the 1990s reported previously (7-9) and may have facilitated the decline in the perennial ice cover during the last decade.
Using data derived from satellite infrared AVHRR sensor as described in (2), yearly surface temperatures in winter (Fig. lc) averaged over all sea ice covered area (blue) and over sea ice area north of 70°N (green) provide the means to assess the effect of longwave radiation. Surface temperatures are shown to be enhanced in 2005 and 2006 suggesting a role of temperature on the decline of ice maxima during these years. The elevated temperatures in 1984 and 1996 are also correlated with low winter ice maximum. However, this was not the case in 1988 and 1990 illustrating the complexity of the Arctic climate system with these cases possibly influenced by strong wind divergence effects. Trends in temperatures over all sea ice and > 70°N are 0.56 and 0.73 'Cldecade, respectively, while the corresponding values, with 2005 and 2006 excluded. are 0.33 and 0.3 1 'Cldecade. Except for a slight drop in 2002, the temperature data also indicate progressively increasing temperature anomalies from 1998 to 2006.
Five-year means of daily values of extent and area over the summer period reported previously (1) have been extended to include the winter period and 2006 data (Fig. 2a) and the lots show B downward decadal progression in the minimum extents from an average of 7.7 x 10 km2 for the first two periods through 7.0 x lo6 km2 during the following decade to 6.5 x lo6 km2 for the period 2000 to 2004. In winter, it is apparent that the first three 5-year averages (i.e., from 1980 to 1994) are virtually overlapping at 15.6 x lo6 km2 while the following two (i.e., from 1995 to 2004) are also overlapping and only slightly reduced at 15.3 x lo6 km2. For comparison, the corresponding values for the individual years in 2005 (black) and in 2006 (gold) are shown to be significantly lower than the 5-year average values, the maximum extents being 14.6 x lo6 km2

and 14.3 x lo6 km2, respectively. Currently available ice data in May 2006 also show that the 2006 extents are anomalously more negative than those of 2005 in the Eastern region, reflecting the January anomaly and suggesting that the perennial ice cover in 2006 might break the record low values in 2005. Similar 5-year average plots but using weekly surface temperatures over sea ice covered regions are shown in Fig. 2b. The average surface temperatures of the ice cover during the winter periods of 2005 and 2006 are indeed significantly higher than normal indicating consistency with the observed decline in the winter ice cover. Also, the temperatures during the spring for 2005 show a rapid increase in May with values about 3 I( higher than the five year average values. It should also be noted that the surface temperatures in April and May of 2006 are following patterns similar to those of 2005.
3. Anomalies in Ice Cover and Surface Temperature in the Winter of 2005 and 2006
The geographical locations of the regions where negative ice anomalies are most prominent during the winters (January and February) of 2005 and 2006 are presented in Fig. 3. It is apparent that the locations of negative anomalies are evenly distributed around the periphery of the Arctic sea ice cover in 2005 while in 2006, some positive anomalies are apparent in the western region but these are compensated by the relatively big anomalies in the eastern (Barents Sea) region. Average surface wind vectors (from NCEP) during the same months are superimposed on the ice anomaly maps to illustrate variability and persistence of the wind from one month to another how wind might have affected the ice cover spatial distribution. In January 2005, relatively warm winds from the south go through the western coast of Alaska through Bering Sea and into the Sea of Okhotsk (Fig. 3a). In the Bering Sea and Okhotsk Sea, the wind gets diverted to the south perhaps causing advection of ice into the warmer water where they melt and contributing to the negative anomaly. In February 2005, winds were again primarily from the south but some components from the Arctic basin gets into the Bering Sea that may have caused the slight positive ice anomaly in the northern part of the sea. In January and February 2006, stronger wind components from the Arctic basin are apparent and may have contributed to the positive ice anomalies in the Bering Sea during these periods. In the Eastern region, strong input of relatively warm wind from the Atlantic is apparent and is specially prominent in January 2006 when the ice anomalies north of Svalbard are most pronounced.
The corresponding surface temperature anomalies for the same set of months are shown in Figure 4 and it is apparent that the spatial features are strongly correlated with the ice anomalies. Comparing Figs. 3 and 4, areas of strong negative anomalies (purples and reds) in the ice cover are shown to be regions where strong positive anomalies (purples and reds) in surface temperatures are apparent. Even the areas of positive ice anomalies as in the Bering Sea in January 2006 (greens and blues) are shown to correspond to areas of negative surface temperature anomalies (greens and blues). Regions where sea ice has retreated are normally shown as positively anomalous regions in the temperature maps since liquid water is warmer than ice covered surfaces. However, temperature anomalies are shown to extend into the inner regions indicating atmospheric effects. The relatively high temperature values in the winters of 2005 and 2006 (Fig. 2b) are actually for ice covered regions only.
Fig. 4 also show unusually high positive surface temperature anomaly in the Central Arctic in 2006. Since the data represents long wave (1 1.5 um) emissions, it also represents the impact of greenhouse warming. The warming, however, is in part caused by the impact of relatively warm winds from the south (e.g., Atlantic Ocean), as indicated in Fig. 3a. The strong wind in winter

also might have caused the transport of thick multiyear ice to the northwest leaving behind seasonal ice, the growth of which is inhibited by the warmer temperatrue. An evidence of this is the complete melt of sea ice in the same region in the spring of 2006 (not shown). This phenomenon can thus be a mechanism for further reductions in the surface area of the perennial ice cover. It should be noted that the surface temperature maps also show significant areas of negative anomalies, indicating the complexity of the Arctic climate system.
The Atlantic Oscillation (AO) indices have been used to characterize the overall state of the polar atmosphere (10) and to interpret interannual variations in the sea ice cover. In the 1980s and early 1990s, negative A 0 indices have been associated with relatively extensive ice cover while positive values has been related to low ice cover values. However, the indices have been on neutral for the last 9 years and the previous interpretation has been questioned in light of significant declines in the perennial ice cover during these years (5). A regression analysis of winter A 0 indices with winter sea ice cover from 1979 to 2006 yielded a correlation coefficient of 0.32 while similar regression using surface temperature instead of ice cover yielded a correlation coefficient of -0.23. While the correlations with the A 0 are relatively weak, the impact of the latter cannot be totally ignored. The A 0 has been linked with wind circulation the influence of which is apparent in the 2005 and 2006 winter data. During the years preceding 2005, the perennial ice cover has been anomalously negative in the western region. In 2005, however, a recovery in the western region was in part caused by the advection of the perennial ice cover into the region. Similar phenomenon is occurring in 2006 suggesting that dynamics needs to be considered when the variability of the winter ice and perennial ice cover is evaluated.
4. Discussion and Conclusions
Maximum ice extents in the Arctic have been relatively stable until 2005 and 2006 when the values were 6% lower than average. This phenomenon, which is correlated with wind and surface temperature, is occurring primarily in the Arctic basin near the North Pole, where the perennial ice cover which has been declining rapidly becomes even more vulnerable. The ice anomaly is in part caused by wind induced advection of the perennial ice to the western region. Significant delays in the onset of freeze-up, is apparently a contributing factor and may indicate that the observed trend of 15 days per decade in the melt period over sea ice (1) is finally being reflected in the winter ice data.
The surface temperature data show large positive anomalies in the Central Arctic in 2005 and 2006 indicating a pattern of warming in winter. Progressively increasing surface temperatures in the Arctic basin in winter since 1998 indicates that the warming effect of greenhouse gases is finally being revealed in winter. It also suggests that the low ice cover values will likely continue in the near future. Ice-albedo feedback effects and increasing atmospheric greenhouse gases would serve to even accelerate the downward trend. The correlations of winter A 0 with the observed changes in the ice and surface temperatures are relatively weak but the latter is likely responsible for wind induced advections in the sea ice cover. Overall, the results suggest that the trend in the winter ice cover is beginning to catch up with the observed rapid decline in the summer ice cover.
References: 1. J. C. Comiso. Weather 61,70 (2006). 2. J. C. Comiso and C. L. Parkinson. Phys. Today 57,38 (2004).

3. J. C. Comiso. Geophys Res. Letts. 29, doi:l0.1029/2002GL015650 (2002). 4. R. W. Lindsay, and J. Zhang. J. Climate 18,4879 2005. 5. J. E. Overland, and M. Wang. Geophys. Res. Lett. 32, doi: 10.1029/2004GL021752 (2005). 6. M. C. Serreze, and J.A. Francis. Weather, 61,65 (2006). 7. D. A. Rothrock, Y. Yu, G.A. Maykut. Geophys. Res. Lett. 26,3469 (1999). 8. P. Wadharns, and N. R. Davis. Geophys. Res. Lett. 27,3973 (2000). 9. W. B. Tucker 111, J. W. Weatherly, D. T. Eppler, D. Farmer, and D. L. Bentley.
Geophys. Res. Letts. 28,2851 (2001). 10. J. W. Hurrel, from Encyclopaedia of Atmospheric Sciences, eds: J. Holton, J. Pyle,
and J. Curry, Academic Press, New York, 2000.
o) Mox Ice Cover, Northern Hemisphere I
I
r? 14: €
IM t8I-t T n r d x -1.9 t 0.5 ~ J : 1 , ~ n o t r ~ d : - 2 . 5 * 0 . 5 ~ d a C
I
0 F - 9 : - - - - - - -
I
h : c) Winter Ternpeatun (Sea lee)
1980 1985 1990 1995 2000 2005 Figure 1. Arctic extent and area derived from satellite passive microwave (SMMR and SSM/I)during (a) ice extent maxima from 1979 to 2006, (b) ice extent and area minima from 1979 to 2005 and (c) winter (DJF) temperature averages from 1982 to 2006. The trends are as indicated with the error listed being the statistical uncertainty associated with yearly variability.

18. I I I I I I I I I I I
:a) NH Ice Extent
280 . I I I I I I I I I I I
:b) NH Ice Surface Temperature (IC > 50%):
Jan Feb Mar Apr May Jun Jul Aug Sep Oct Nov Dec Figure 2. (a) Five-year averages of daily ice extents for the periods 1980 to 1984 (violet), 1985-1989 (blue), 1990-1994 (green), 1995-1999 (brown) and 2000-2004 (red). Individual years are shown for 2005 and 2006 (see Fig. la for the variability of the other years). A smoothing is applied on the data by taking %day running averages. (b) Five-year of weekly surface temperatures derived from satellite infrared data for the same periods as in (a). A 3-week running average smoothing is applied for this temperature data.

Figure 3. Monthly anomaly maps of ice concentrations in (a) January 2005; (b) February 2005); (c) January 2006 and (d) February 2006.
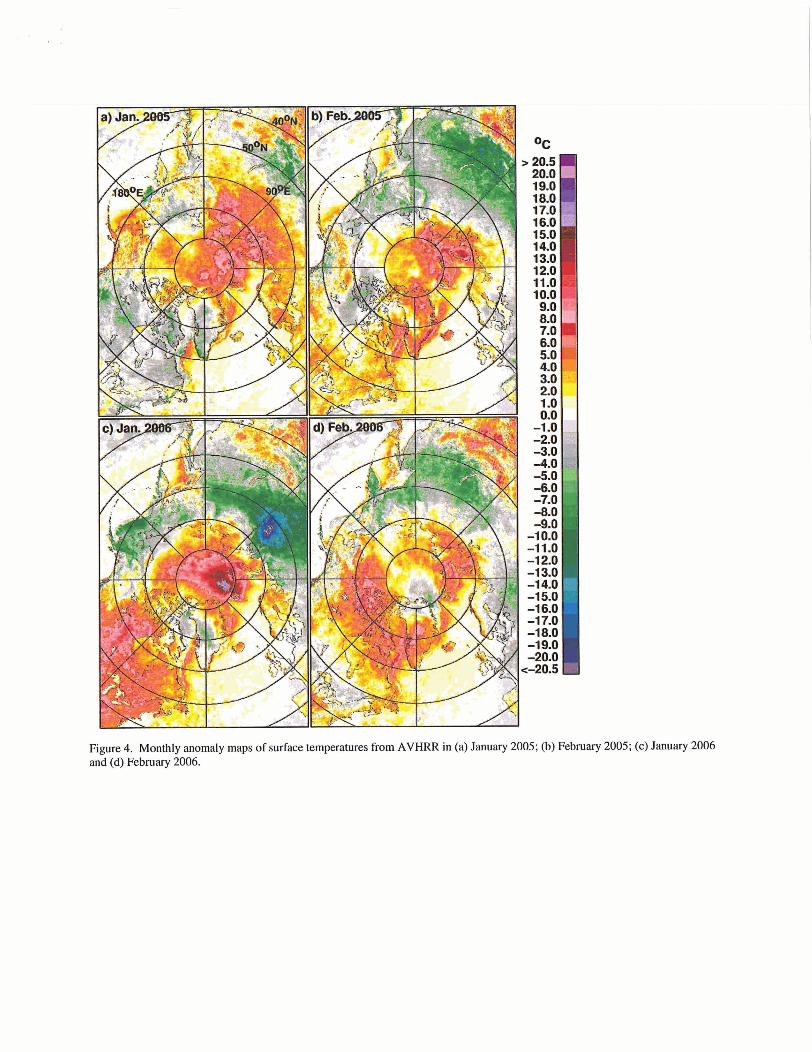
Figure 4. Monthly anomaly maps of surface temperatures from AVHRR in (a) January 2005; (b) February 2005; (c) January 2006 and (d) February 2006.

For-Supporting Document: