title a year-round test meteorological observation in the...
TRANSCRIPT

Title A Year-round Test Meteorological Observation in the Desert ofHEIFE Area, Northwest China
Author(s) INOUE, Jiro; MITSUTA, Yasushi
Citation Bulletin of the Disaster Prevention Research Institute (1990),40(3): 111-129
Issue Date 1990-09
URL http://hdl.handle.net/2433/124969
Right
Type Departmental Bulletin Paper
Textversion publisher
Kyoto University

Bull. Disas. Prey. Res. Inst., Kyoto Univ., Vol. 40, Part 3, No. 350, September, 1990 111
A Year-round Test Meteorological Observation in the Desert
of HEIFE Area, Northwest China
By Jiro INOUE and Yasushi MITSUTA
(Manuscript received on July 2, 1990)
Abstract
A year-round test meteorological observation by an automatic weather station was made in the desert of
northwest China. There are two prevailing wind directions: southeasterlies after midnight in summer, and
northwesterly in the afternoon of other seasons. Their origins are synoptic winds: easterly current toward the
heat low over Tibetan Plateau in summer, and planetary westerly in winter. The mean daily temperature
range of the desert is larger in winter than summer. Specific humidity decreases in daytime and increases at
night suggesting the evaporation at the ground, but no diurnal change in dry season. Moisture advection
from oasis is not evident in monthly averages. Attention to the maintenance of instruments is proposed.
1. Introduction
As one of HAPEX (Hydrological and Atmospheric Pilot Experiment), a part of the WCRP (World Climate Research Program), the Sino-Japanese cooperative experiment on atmosphere-land surface processes, HEIFE (HEIhe river Field Experiment) is
planned in the arid area of the northwestern part of China. The field observation is scheduled to start in 1990. The observation will focus on the structure of the atmos-
pheric boundary layer over various surface conditions of arid areas including deserts. The existing climatic data of weather stations in this area represent the climate of the oasis in which the stations are located. Therefore, test meteorological observation in the desert was planned (Inoue and Mitsuta, 1989)1) before the start of HEIFE. The test had two purposes: first, to obtain a basic knowledge of the climate of the desert including the diurnal changes of each meteorological element, and second, to check the weathering damages to the instruments to be used in the severe environment of the desert. An automatic weather station (AWS) was prepared with conventional instruments without any special modifications.
2. Observation
The location of the test station is shown ( ) in the land feature map of HEIFE area in Fig. 1. The surrounding geography consists of the vast Gobi Desert to the north, and to the southwest are the 4500 m high Qilian Mountains, the northeastern tip of the Tibetan Plateau. The HEIFE area includes several oases along the Heihe River with altitudes of 1300-1500 m asl. According to the average climatic record of three

112 J INOUE and Y. MITSUTA
olf \/' e\z' /\ X
<s"
rr • f - -4011104pr",„ CAOTA I•r.z1""GY
• .1
„
• . „..
. •
III MURIA IN • - "..
• , ^•-. •
•, ' • DAS is
DE SER r
IV,” GOBI
Fig. 1. Land feature map of HEIFE area and the location of stations. The ( f ) arrow shows the test sta- tions.
meteorological stations (Zhangye, Linze and Gaotai; Fig. 1) in this area, annual
precipitation is 100-130 mm, 80% of which is concentrated in the five months from May to September.
The appelation 'Gobi' is generally used for the desert area consisting of pebbles and coarse sand, and is distinguished from other desert areas consisting entirely of fine sand. The terrain of these two desert areas is different: the Gobi is flat while undulating wind-formed dunes form the floor of the sand desert. The dunes range in height from 1 m to several tens meters. The heart of the sandy desert (1390 m asl, 100° 05' E, 39° 18' N), about 37 km north of Linze was chosen as the observation site. This desert area is 3 km in width and streches nearly 30 km along the Heihe River. Oases to the north and south were not far as shown in Fig. 1. The landform is mainly sand dunes of various sizes and shapes on flat clay ground. Since the site is not far from the river, the
ground water level is high, being as high as 1 m below the soil surface in summer, but receding to more than 2 m in winter. The AWS was set on the crest of a gently sloping sand dune.
The details of the AWS are given in Table 1. The elements to be measured and the heights of the measuring instruments are: air temperature (Ta) and realtive humidity
(Rh) at 1.5 m, wind speed (Ws) and direction (Wd) at 4 m, ground temperature (Tg) and global solar radiation (Rs). Hourly instantaneous data was automatically sampled and entered to a programed RAM memory (Hakusan, Datamark). The memory can store the data of the above 6 channels over 6 months. The stored data was collected by
portable computer every 6 months. The local time of 105° E (GMT + 7 hours) was used. The electric supply was changed from lithium batteries to a solar power system in order to test and compare their performances over the test period; both proved satis-

A Year-round Test Meteorological Observation in the Desert of HEIFE Area, Northwest China 113
Table 1. Observed Elements, Sensors and Recorder Resolution
Element (Symbol): Sensor (Manufacturer) Wind Speed and Direction (Ws, Wd):
Windmill type anemometer with vane, 4 blades 25 cm in diameter (Ogasawara, WS-942). Ground Temperature (Tg):
Platinum-resistance thermometer (Ogasawara, TS-180). Solar Radiation (Rs):
Thermopile pyranometer (Ogasawara, S-100). Air Temperature and Relative Humidity (Ta, Rh):
Platinum-resistance thermometer and capacitance hygrometer (Vaisala, HMP-112Y) with radiation shelter (Young); no ventilation.
Sensor Recorder Element
Range / Output Input Resolutiona
Ws 0-60 m/s / 0-1 V 1 V 0.015 m/s Wd 0-360° / 0-700 ohm 1 kohm 0 .2 °
Tg —50-100°C / 80-139 ohm 100 ohm 0.1°C Rs 0-1 kW/m2 / 0-7 mV 100 mV 4 W/m2
Ta —50-100°C / 80-139 ohm 100 ohm 0.1°C Rh 0-100% / 0-1 V 1 V 0.03%
a per bit.
factory. Observations were begun on September 11, 1988 (see Photo. 1). However, data entry was found to have stopped within 12 days. No trouble was found in either the recorder or in the battery except for evidence of some external trigger-like factor that stopped the recording. The last data suggested that a large electric impulse had been in-duced just before operation ceased. According to the weather record at Linze, there had been remarkable thunderstorms on the last day of operation. We concluded that lightn-ing had caused the recorder stop. The AWS was reset on March 5, 1989, and worked well after that, but no recording was made between September 19 and October 13, 1989
Photo 1. Automatic weather station in the desert.

114 j INOUE and Y MITSUTA
due to full memory of the RAM. The test observation ended on March 17, 1990 after a full year of operation.
No weathering damage to the sensors from 1.5 years' exposure to the desert was detected. An inspection of the accumulation of desert dust on the sensors revealed a par-tial thin cover on the pyranometer dome and thick deposition on the filter cap of the hygrometer. The calibration of the hygrometer indicated that the observed values were within 10% of the actual value in all ranges in spite of the dust-covered condition. No invasion of dust particles inside of the anemometer was found after disassembling it in the laboratory. The calibration curve had not changed including the thresh-hold veloc-ity. The unpredictable factor was surface level change of the desert floor. At the initial stage (September, 1988), the ground thermometer was buried vertically into the sand to avoid the probe becoming uncovered by wind erosion. The probe level was —20 cm. After a year the surface level had risen by 11 cm. In light of this in October 1989 the thermometer was re-buried horizontally at a depth of —17 cm. However, it was found almost exposed near the surface in March, 1990. Furthermore, the sand dune on which the AWS has been set modified its shape as well by the final stage.
3. Data Quality and Statistics
Most records were accurate when retrieved from memory, but false nocturnal in-creases in Rs, Ta and Tg were found in the data taken in winter. The functional test of the data recorder in a cold chamber revealed: 1) biased voltage is induced under the freez-ing point; 2) the induced bias is same for Rs, Ta and Tg; while 3) the effect of this bias is negligible for Ws, Wd and Rh. The detailed procedures of the data quality check and correction are described in a separate report (Inoue and Mitsuta, 1990)2). The following
Table 2. Number of Data
Corrected Deleted
Month Total Rs, Ta, Tg Rs, Ta, Tg Rh
LT: 07 80 09 10 Others
Sept.' 1988 269 0 0 0 0 0 0 0 Marchb 1989 633 250 14 14 0 0 0 633 April 720 77 0 0 0 0 0 0 May—Aug. 2952 0 0 0 0 0 0 38
Sept.' 429 0 0 0 0 0 0 103 Oct. d 422 162 12 0 0 0 0 235
Nov. 720 415 0 24 7 0 0 714 Dec. 744 456 0 31 24 7 3 675
Jan. 1990 744 439 0 31 31 22 4 734 Feb. 672 374 12 28 13 9 0 667 March' 402 196 13 8 0 0 0 402
Total 8707 2369 51 136 75 38 7 4201 a Sept . 11-22. b March 5-31. ' Sept. 1-18. d Oct. 14-31. ' March 1-17.
A Year-round Test Meteorological Observation in the Desert of HEIFE Area, Northwest China 115
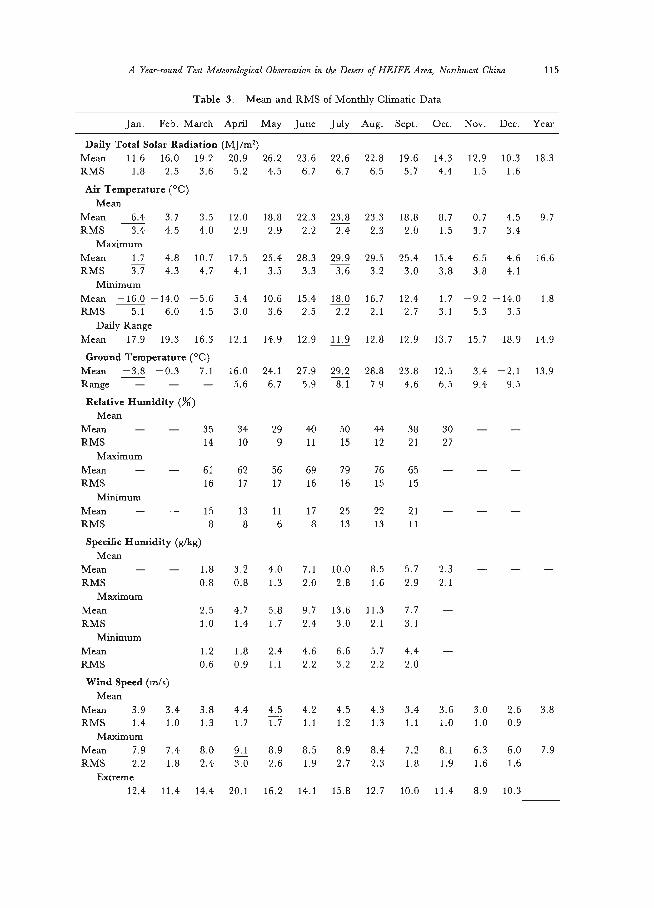
Table 3. Mean and RMS of Monthly Climatic Data
Jan. Feb. March April May June July Aug. Sept. Oct. Nov. Dec. Year
Daily Total Solar Radiation (MJ/m2) Mean 11.6 16.0 19.2 20.9 26.2 23.6 22.6 22.8 19.6 14.3 12.9 10.3 18.3 RMS 1.8 2.5 3.6 5.2 4.5 6.7 6.7 6.5 5.7 4.4 1.5 1.6
Air Temperature (°C) Mean
Mean -6.4 -3.7 3.5 12.0 18.8 22.3 23.8 23.3 18.8 8.7 -0.7 -4.5 9.7 RMS 3.4 4.5 4.0 2.9 2.9 2.2 2.4 2.3 2.0 1.5 3.7 3.4
Maximum Mean 1.7 4.8 10.7 17.5 25.4 28.3 29.9 29.5 25.4 15.4 6.5 4.6 16.6 RMS 3.7 4.3 4.7 4.1 3.5 3.3 3.6 3.2 3.0 3.8 3.8 4.1
Minimum Mean -16.0 -14.0 5.6 5.4 10.6 15.4 18.0 16.7 12.4 1.7 9.2 -14.0 1.8 RMS 5.1 6.0 4.5 3.0 3.6 2.5 2.2 2.1 2.7 3.1 5.3 3.5
Daily Range Mean 17.9 19.3 16.3 12.1 14.9 12.9 11.9 12.8 12.9 13.7 15.7 18.9 14.9
Ground Temperature (°C) Mean -3.8 -0.3 7.1 16.0 24.1 27.9 29.2 28.8 23.8 12.5 3.4 -2.1 13.9 Range - - - 5.6 6.7 5.9 8.1 7.9 4.6 6.5 9.4 9.5
Relative Humidity (%) Mean
Mean - - 35 34 29 40 50 44 38 30 - -RMS 14 10 9 11 15 12 21 27
Maximum Mean - - 61 62 56 69 79 76 65 - - -RMS 16 17 17 16 16 15 15
Minimum Mean - 15 13 11 17 25 22 21 - - -RMS 8 8 6 8 13 13 11
Specific Humidity (g/kg) Mean
Mean - - 1.8 3.2 4.0 7.1 10.0 8.5 5.7 2.3 - - -RMS 0.8 0.8 1.3 2.0 2.8 1.6 2.9 2.1
Maximum Mean 2.5 4.7 5.8 9.7 13.6 11.3 7.7 -RMS 1.0 1.4 1.7 2.4 3.0 2.1 3.1
Minimum Mean 1.2 1.8 2.4 4.6 6.6 5.7 4.4 -RMS 0.6 0.9 1.1 2.2 3.2 2.2 2.0
Wind Speed (m/s) Mean
Mean 3.9 3.4 3.8 4.4 4.5 4.2 4.5 4.3 3.4 3.6 3.0 2.6 3.8 RMS 1.4 1.0 1.3 1.7 1.7 1.1 1.2 1.3 1.1 1.0 1.0 0.9
Maximum Mean 7.9 7.4 8.0 9.1 8.9 8.5 8.9 8.4 7.2 8.1 6.3 6.0 7.9 RMS 2.2 1.8 2.4 3.0 2.6 1.9 2.7 2.3 1.8 1.9 1.6 1.6
Extreme 12.4 11.4 14.4 20.1 16.2 14.1 15.8 12.7 10.0 11.4 8.9 10.3
116 J. INOUE and Y. MITSUTA
adaptations to Rs, Ta and Tg were made. The zero points were corrected by adjusting the pyranometer outputs during sunless periods. When sun was above the horizon, their data were eliminated if a spike-like deviation was found in the time-series of Rs. The result is shown in Table 2. The corrected data amounted to 2369 hours (27% of total). The data of roughly three hours after sunrise in January and of two hours in February and December were eliminated, which amounted to 307 hours (4%). No elimination was made between April and September. For Ws, Wd and Rh, no correc-tions were made, but failures in Rh measurement due to the trouble in the power supply to the sensor were deleted. The maximum errors in Ws, Wd and Rh are expected to be 0.5 m/s, 7° and 1%, respectively. However, the maximum errors in the corrected Ta and Tg became ±3.7°C, which sets some limitation to reliability in temperature statistics. The checked and corrected data were summarized only on a monthly basis. The reason for averaging a large amount of data are; 1) the large errors in temperature data may cancel each other, and 2) the ailiasing effect due to the instantaneous sampling may be avoided. It is to be noted that the maximum (minimum) daily value given in this
paper is the maximum (minimum) of 24 samplings a day. For Rs, Ta and Tg, the data of 1-3 hours after sunrise from November to February are largely reduced in number
(Table 2). As a result, monthly mean temperatures of these months are underestimated (by a maximum of 1°C less than the 24 hours average: Inoue and Mitsuta, 1990)2) due to a lack of data during the rapid temperature increases after sunrise.
The amount of data collected in March, September and October is insufficient for each month (Table 2). Thererore, we combined the data of March ('89/'90) and of September ('88/'89) to approximate a full month's data, and assumed an annual cycle from January to December. The mean and root mean square (RMS) of monthly climatic data are shown in Table 3. The annual courses are discussed based on this imaginary year, if not otherwise specified. To reconcile the varying number of measurements taken each month, monthly frequencies were multiplied by the ratio of the number of measurements to the number of hours in a month, or shown as percentage units.
4. Diurnal and Annual Course
4.1 Solar Radiation (Rs)
Although precipitation was not directly measured, we could deduce cloud activity through radiation data. Solar radiation (Rs) is maximum in May, but lessens in June and July (Table 3) due to the summer rainy season. A series of the averaged diurnal course of the observed Rs in each month is shown in Fig. 2. Solar radiation at the top of the atmosphere was calculated from the latitude-solar altitude equation, and this series is connected by dotted lines. Large absorption occurs in summer and also in April, while the winter atmosphere is relatively transparent. The lower transmission in April is pro-bably due to atmospheric dust, but it may be a consequence of the continuous cover of dust on the pyranometer dome. This was checked by the following variability indexes of

A Year-round Test Meteorological Observation in the Desert of HEIFE Area, Northwest China 117
1.5 i 1111111111f Rs—obs
Rs—cal
1.2 —
k.9— —
A
II\ ; :4 I; m2
.6 — I
•
•
„\•h
0
' J F M A m J J A S 0 N D Month
Fig. 2. Annual change of monthly averaged diurnal courses (04-20 LT) of solar radiation (Rs). Solid line; observed Rs. Dotted line; calculated Rs at the top of atmosphere.
Rs: 1) averaged variation coefficient (VC1), the averaged (05-19 LT) ratio of monthly RMS to the mean of each LT's Rs; and 2) the ratio of monthly RMS to the mean of daily total value (VC2). The results are shown in Table 4. VC1 is large from June to August (maximum; July), gradually decreases in September and October, and is small in winter and spring except in April. VC2 is large from June through October, and also in April. Both day-to-day (VC2) and hour-to-hour (VC1) variability is large in April, indicating that the effect of continuous dust deposition is small.
The daytime change of Rs is shown in the isopleth of monthly mean value at each LT in Fig. 3. The hourly maximum is at local noon (solar meridian; 1220 LT). The symmetric distribution of Rs between morning and afternoon suggests no daytime in-crease in cloud activities, such as the frequent afternoon local convective clouds in the Himalayas (Inoue, 1976)3).
The small reduction of Rs in winter suggests that the winter utilization of solar energy is feasible. Nearly half of the summer solar energy is reliably available in winter. The sun is a stable energy source throughout the year.
Table 4. Monthly RMS and Variation Coefficients (VC) of Solar Radiation
Jan. Feb. March April May June July Aug. Sept. Oct. Nov. Dec.
RMS of Daily Total (MJ/m2) 1.8 2.5 3.6 5.2 4.5 6.7 6.7 6.5 5.7 4.4 1.5 1.6
VC (%) VC la 28 21 28 35 29 44 47 41 37 35 18 20
VC2b 16 16 19 25 17 28 30 29 29 31 12 16 a Averaged ratio of RMS to the average of each LTs.
b Ratio of RMS to the average of daily total Rs.

118 J. INOUE and Y. MITSUTA
LT
0 6 •
09 • •
12 0 . 8
0.6 0.4 -
0.2-
Fig. 3. Averaged solar radiation by hours of the day and by months. Contour interval; 0.1 kW/m2.
4.2 Temperature (Ta, Tg)
Air temperature (Ta) is the basic information on the environment. The hottest month is July, and the coldest is January. The amplitude of the mean annual march ex-
35 - Ta
Tg
25 -
15-
t \\I\ \:A 5 -
1, -5 -
-15 M A MJ J A S OND JF 11
1989 1990
Fig. 4. Series of monthly mean diurnal courses (00-23 LT) of air temperature (Ta; solid line) and ground temperature (Tg; dotted line) from March, 1989 to March, 1990.

A Year-round Test Meteorological Observation in the Desert of HEIFE Area, Northwest China 119
ceeded 30°C. The monthly averaged maximum is highest in July and the minimum is lowest in January. The summer maximum Ta is relatively low due to the high altitude of this place. This may be climatically classified as a typical cold interior desert
(Bucknell, 1964)4). The averaged daily temperature range (Ra) is larger in winter (max-imum; February) than in summer (minimum; July), which may be a feature typical of this desert area. The RMSs of mean, maximum and minimum temperatures are larger in winter months than in summer.
Ground temperature (Tg) is greater than Ta throughout the year, and Ra (Tg); temperature range of Tg, is smaller than Ra (Ta). The depth of ground thermometer was unstable due to the changing surface level. The averaged diurnal marches of Tg and Ta of successive months (March, 1989-March, 1990) are shown in Fig. 4, into which several deleted data of winter have been interpolated. The ratio of Ra (Tg) to Ra
(Ta) becomes larger, and the phase lag (Pa) between Ta and Tg becomes smaller after October, at which time the thermometer level was relocated to a depth near the surface. Pa vanished in February, and Ra (Tg) became larger than Ra (Ta) in the last March. The surface level may have changed continuously after succesive erosion and deposition.
4.3 Humidity (Rh, Sh)
Aridity is the most unique factor of this area. The available data (March to October) of relative (Rh) and specific (Sh) humidities are shown in Table 3. The mean monthly Rh is less than 50%, and the averaged maximam is less than 80% even in the summer rainy season. The seasonal change of Rh is not pronounced, but Sh decreases considerably in spring and autumn from the summer values.
The monthly averaged diurnal course of Ta, Rh and Sh from March to September are shown with RMS bars in Fig. 5. The diurnal march of Rh was inversely correlated to Ta every month. The daytime decrease of Sh with increased Ta is evident only in the summer months, with no significant diurnal changes of Sh in March and September. The summer diurnal cycle of Sh can be explained by moisture flux divergence (Munn,
1966)5): quicker upward transportation of water vapor than evaporation at the surface in the afternoon, and vice versa in the evening. This may suggest the ground as a moisture source in summer. The diurnal change of Sh may vanish in the dry season (September to March) due to the exhausted ground moisture. A pertinent discussion will be
presented in section 5.
4.4 Wind (Ws, Wd)
The monthly mean winds are: April to August, gentle breezes; and September to March, light breezes. The average maximum winds are moderate to fresh breezes, and their annual trend is same as the mean wind pattern. The number of days and hours of strong winds (Ws > 10.0 m/s) are shown in Table 5. The number of hours is highest in April, but the number of days is maximum in May. The average duration of a strong wind is 2-3 hours and was maximum in April. The extreme Ws was also maximum in April (Table 3). Strong winds were rare from September to December and in February. The annual averaged diurnal course of Ws is shown in Fig. 6. It is evident

120 J. INOUE and Y. MITSUTA
es . T.
'f' ik't,
, 11
oh 1 „II' 1 'I i. IF '1
ill
1111' 11'1 11;110 10'111H1111 1 hd
lii,1,11:: 1'11 911,11, 1 Fil
l -lei
11 A h J J fi S Month
b 103 Rh
111111 ! i1II,1 ..I,111111111,• dill111,III 1,1.1j,11111l'!,11ill 9g1111111
Ilr'111V1III'1I'I'1 4' ,1111,1111I1'111I1' '1111111111..0.il11111111111I1,111l I 11I ga11'11illi1HO'11:1I i i i
i 1 81dli 114 MJJ A Sry o,
. 15
7 Sh 121 ', 1 1. liihig
.,.III,
9,..11.1.:1
-
1.11.1 .1.1,—,11 IdII..
I'l 11111111,1r,1.._ ;I::111:11111 111111;1111,i. 111V11111011.11411111'111,. 1„1„
,„
111,111„ii,,,,11111,1,ii iiL„ii
' 1 I , I I 1 J " 5 Mont h
Fig. 5. Series of monthly mean diurnal courses (00-23 LT) and standard deviations (bars) of (a) air temperature (Ta), (b) relative humidity (Rh) and (c) specific humidity (Sh) from March to September, 1989.
Table 5. Duration of Strong Winda
Jan. Feb, March April May June July Aug. Sept. Oct. Nov. Dec.
Number of Hours 14 2 13 31 22 8 18 23 0 7 0 2
Number of Days 5 1 5 9 10 4 7 8 0 9 0 1
Averaged Duration (hours) 2.8 2.0 2.6 3.4 2.2 2.0 2.6 2.9 0.0 0.8 0.0 2.0
a Ws >10 m/s .

A Year-round Test Meteorological Observation in the Desert of HEIFE Area, Northwest China 121
that Ws increases with sunrise, reaching its maximum early in the afternoon and be-coming weak at night. The diurnal change is constant except in the evening as deduced from RMS values.
Monthly frequencies (%) of Wd (8 directions) are shown in Table 6. There are two prevailing wind directions (maximum frequencies are underlined). Easterlies (NE, E, SE) and northwesterly are the two predominant directions throughout the year. Fre-
quencies are divided into daytime (06-17 LT) and night (18-05 LT) in Table 6. The prevailing wind was northwesterly in daytine except in July, but there still remained a large number of easterlies. The nocturnal easterlies were predominant, but the direc-tional persistence was not marked.
The number of measurements in each Ws-Wd range is summarized in Table 7,
where Wd is in 8 directions and Ws is divided into three: light (0.5-5.0 m/s), moderate
(5.0-10.0 m/s) and strong (>10.0 m/s) winds. The total number concentration was highest in the range of light wind, and in the directions of E, SE and NW. The fre-
Table 6. Monthly Frequency (%) of Wind Direction
Jan. Feb. March April May June July Aug. Sept. Oct. Nov. Dec.
24 hour Calm 4 8 6 4 5 5 2 3 6 8 8 11
N 10 6 8 8 11 7 4 9 7 6 10 6 NE 15 18 18 13 12 8 18 14 10 17 15 15
E 16 17 17 15 18 16 14 22 17 15 18 19 SE 15 9 11 17 15 24 30 17 15 18 12 13
S 7 7 7 5 6 10 12 8 9 10 7 8 SW 7 5 5 5 3 4 4 3 4 5 6 8
W 13 11 11 13 9 10 10 7 12 11 9 6 NW 14 18 17 21 20 15 15 13 16 16 14 13
— —
Day (06-17 LT) Calm 5 6 6 5 3 4 3 2 6 6 8 12
N 15 8 11 9 15 9 5 12 10 7 13 9 NE 14 12 14 12 10 9 5 16 13 14 13 13
E 15 14 18 17 12 11 13 17 12 9 15 14 SE 10 7 9 14 13 19 25 16 12 15 13 9
S 5 4 4 4 3 10 14 6 6 9 4 6 SW 7 5 2 3 3 4 3 2 3 3 3 7
W 14 15 11 13 11 12 11 10 14 13 11 9 NW 16 29 24 25 29 22 18 19 23 23 20 20
Night (18-05 LT) Calm 3 10 6 3 6 6 2 3 6 10 8 10
N 5 5 5 7 7 4 3 6 5 6 7 3 NE 16 25 22 14 13 7 9 20 14 7 21 17
E 17 19 16 14 24 22 15 28 21 21 20 24 SE 2111 12 20 1829 35 18 18 20 11 18
S 9 10 9 7 10 11 10 10 13 10 10 10
SW 6 5 7 6 3 5 5 4 4 7 9 8
W 12 8 11 13 8 8 9 5 9 10 6 4
NW 11 7 11 17 11 8 12 7 10 10 8 6

122 J. INOUE and Y. MITSUTA
6 1 1 I I 1 I I I Ws
_ -
5 - ,
-
-
- _
_
_ _--_ ------....„
M / 3- --
- - - -
-
2- -
1- _
0 ' 1 I I I I I I 0 3 6 9 12 15 18 21 L T
Fig. 6. Annual averaged diurnal course of wind speed (Ws) and standard deviations (bars).
quencies in these three directions were nearly same, but for light winds the highest fre-quency is in E, and for moderate and strong winds in NW. The maximum Ws of 20.1
m/s (April 19) was from NW. The percentage frequencies of Wd in each Ws range and those of Ws in each Wd range are also shown in Table 7. It is noted that more than 70% of the strong winds are from W or NW and nearly 50% of SE, W and NW winds were moderate to strong. The winds from SW were very rare with 94% being light winds.
The directional constancy (q), defined by
q= Vul Va, (1)
where VI) is vector mean and Va is scalar mean wind speeds, is calculated. The values
Table 7. Numbers of Data with Different Wind Speed and Direction
Ws (m/s) C N NE E SE S SW W NW Sum
WsO: <0.5 520 Ws1: 0.5-4.9 554 940 1170 821 634 398 520 742 5779
Ws2: 5.0-9.9 101 263 312 608 74 24 326 613 2321 Ws3: >10.0 3 6 16 10 3 1 50 53 142 Sum 658 1210 1497 1440 712 422 895 1408 8242
Frequency (%) of Wd in Ws Range Ws1 10 16 20 14 11 7 9 13
Ws2 4 11 13 26 3 1 14 26 Ws3 5 5 11 7 2 1 35 38
Frequency (%) of Ws in Wd Range Ws1 84 78 78 57 89 94 58 53
Ws2 15 22 21 42 10 6 36 44 Ws3 0 1 1 1 0 0 6 4

A Year-round Test Meteorological Observation in the Desert of HEIFE Area, Northwest China 123
Table 8. Monthly Constancy (q) of Wind
Jan. Feb. March April May June July Aug. Sept. Oct. Nov. Dec. 100xq
24 hrs 30 41 34 23 33 29 26 35 29 39 38 46 Day 33 43 42 26 31 15 14 27 28 41 42 48 Night 26 39 26 20 35 44 38 44 31 37 34 44
for 24 hour, daytime and nocturnal q are shown in Table 8. Two prevailing winds from almost opposite directions caused decrease in 24 hour q values, but both daytime and nocturnal values are also small with even the highest value being less than 0.5.
In spite of the apparent existence of prevailing winds, the small values of q must result from the short duration of the prevailing winds perhaps far less than 12 hours.
The hourly values of q and the direction of Vv (36 directions) in each month are shown in Table 9, where q>0.55 are underlined. There is no critical value of q to define a
prevailing wind. To illustrate this, there is an example of the stationary katabatic winds on the Antarctic Ice Sheet: for surface winds, q>0.8; and for free atmosphere, q< 0.6
Table 9. Diurnal Constancy (q) of Wind and Vector Mean Wind Direction
Month 1 2 3 4 5 6 7 8 9 10 11 12 1 2 3 4 5 6 7 8 9 10 11 12
100xq Wd LT
00 33 51 32 15 52 60 47 53 49 55 45 69 14 10 08 10 14 13 14 10 11 12 07 10 01 30 42 26 18 45 65 51 54 31 40 41 65 11 08 09 12 10 13 13 12 08 10 07 09 02 33 34 36 23 41 67 45 47 33 49 33 47 11 07 10 12 11 11 12 10 08 13 08 10 03 27 42 39 26 37 67 49 45 29 62 36 43 09 05 09 06 09 12 13 09 11 12 08 11 04 31 36 39 17 22 52 44 61 18 37 35 26 09 03 09 06 06 12 12 09 12 Ti. 07 12 05 31 26 34 3 29 21 23 51 16 27 43 30 08 03 08 20 05 10 11 08 10 10 08 10 06 18 22 26 5 19 16 22 38 18 48 42 38 10 02 09 07 05 11 10 07 06 11 09 11 07 20 10 28 8 20 20 11 32 10 47 54 39 06 01 07 27 06 09 11 08 10 12 09 11 08 20 33 34 6 13 4 13 28 14 36 55 35 11 35 09 09 12 23 10 08 10 11 09 08 09 31 31 40 4 5 12 8 8 7 34 31 44 10 34 08 13 08 30 13 07 25 09 09 09 10 37 28 24 18 14 21 12 20 9 12 22 34 07 33 08 35 32 32 17 01 35 12 08 11 11 32 57 21 26 46 23 3 24 19 8 22 20 09 32 00 34 35 31 16 35 35 25 02 04 12 19 70 52 37 44 17 8 23 46 26 33 48 32 33 34 35 34 36 02 33 36 33 36 36 13 29 61 49 40 44 16 6 31 43 59 50 66 31 34 34 34 33 31 25 36 35 33 35 33 14 52 56 60 56 44 16 17 34 52 57 56 60 34 33 33 35 33 30 25 34 35 31 35 32 15 56 56 60 40 45 11 18 36 30 60 52 71 32 32 34 34 34 23 22 34 34 31 34 33 16 43 54 54 37 41 16 22 24 47 53 48 75 32 32 34 31 35 24 20 33 35 31 34 32 17 42 42 49 37 34 12 28 21 36 57 35 45 32 32 34 34 35 29 18 35 36 30 35 31 18 22 24 35 41 23 23 28 25 16 27 28 16 32 02 35 31 01 24 22 03 36 24 01 24 19 11 24 25 37 24 17 15 32 17 40 4 20 29 09 36 30 04 21 22 06 16 22 05 12 20 11 45 6 9 32 18 34 31 27 23 12 38 16 10 13 36 10 18 15 08 14 21 09 14 21 29 40 13 13 28 41 39 38 43 17 25 47 16 12 17 36 12 17 15 09 13 15 09 12 22 32 47 9 13 42 46 42 38 46 34 47 63 17 10 20 10 14 16 15 09 11 17 06 10 23 25 58 16 23 49 45 45 55 48 37 58 65 13 08 06 15 16 13 14 10 08 12 07 09

124 J. INOUE and Y. MITSUTA
(Schwerdtfeger, 1970)6). A simple relation of the standard deviation of wind direction (Sd: measured in radians) with Va and Vu can be approximated (Yamartino, 1984)7) by
Vol Va.= I (1 — Sd2). (2)
If we assume the definition of the prevailing wind as Sd< ir/4, a combination of the equa-tions (1) and (2) yields g > 0.6. The prevailing winds are southeasterly in summer nights and northwesterly in the afternoon of the other seasons. The durations of the
prevalence are limited to several hours. The origin and nature of these two winds are ex-amined in section 6.
5. Sandy Desert, the Gobi and the Oasis
Sandy desert, the Gobi and the oasis are the three principal landforms in the
Tr desert Tr O.S.s 18- /
16-
w. e 11\ .
12
le J Mont h
60 ,b rd) desert
• / 40- ;.
30- \.1
20-
10-
0 M Month
5 Ws desert
Wssees.
•
5 2-
-
; N Mont h
Fig. 7. Monthly average values in desert and oasis. (a) Daily temperature range (Tr). (b) Relative humidity (Rh). (c) Wind speed (Ws).
A Year-round Test Meteorological Observation in the Desert of HEIFE Area, Northwest China 125
HEIFE area as shown in Fig. 1. The oasis environment is extremely opposite in temperature and humidity to that of the desert and the Gobi. The monthly mean values of the desert were compared with the data of Linze (1454 m asl.), the nearest meteorological station located in an oasis. Since the data of Linze are the average for 30
years (1951-1980; HEIFE Report No. 4), the discussions are confined to the different annual course of some elements. The averaged temperature range (Tr) estimated from mean maximum and minimum air temperatures are shown in Fig. 7a. Due to the scanty water content of the desert, larger temperature ranges than those of the oasis are expected (Oke, 1978)8). The annual course of Tr in the oasis is stationary throughout the year. In contrast, the Tr of the desert is large in winter, but decreases in summer when it approaches the values of the oasis. The Rh (Fig. 7b) in the oasis is lowest in spring and highest in winter. The change in Rh in the desert is similar to that of the oasis from March to August. However, the tendencies reverse after August. The Rh of the desert in October may not represent the true monthly average due to the reduced amount of data, but the decreasing tendency in August and September is reliable infor-mation. Ws (Fig. 7c) in the oasis is highest in April and decreases in summer. This is
probably due to the increased roughness in the oasis mainly by high trees, which become dense in summer. The smaller summer temperature range in the desert is partly caused by increased wind speed. However, it may be associated also with the moisture in the
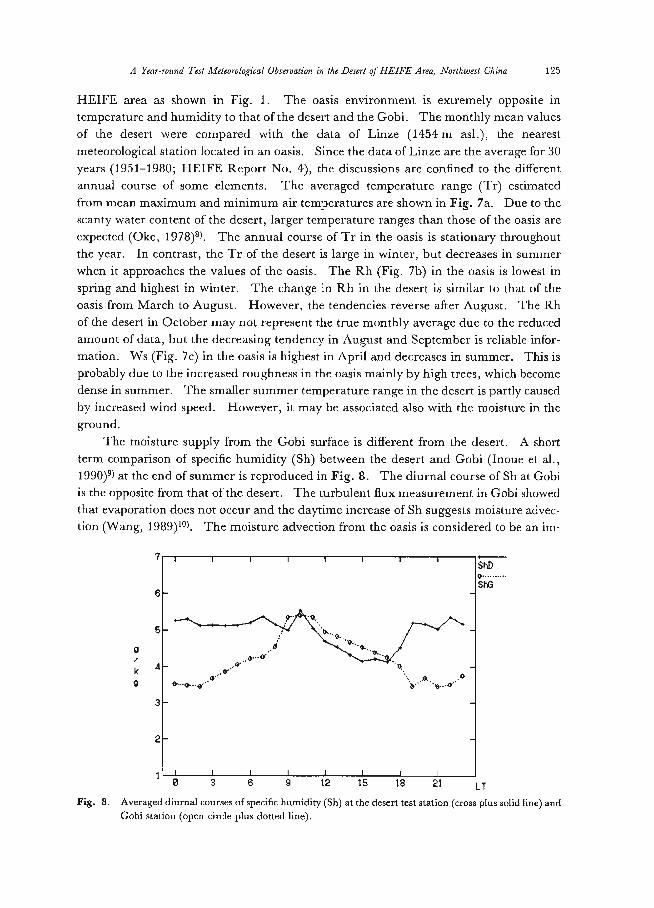
ground. The moisture supply from the Gobi surface is different from the desert. A short term comparison of specific humidity (Sh) between the desert and Gobi (Inoue et al.,
1990)8) at the end of summer is reproduced in Fig. 8. The diurnal course of Sh at Gobi is the opposite from that of the desert. The turbulent flux measurement in Gobi showed that evaporation does not occur and the daytime increase of Sh suggests moisture advec-tion (Wang, 1989)10). The moisture advection from the oasis is considered to be an im-
7 - ShD
0 ShG s—
.0... 5 —
-0.. .0..
k4„VG.. q. 9
3L —
2— —
1 0 3 6 9 12 15 18 21 LT
Fig. 8. Averaged diurnal courses of specific humidity (Sh) at the desert test station (cross plus solid line) and Gobi station (open circle plus dotted line).

126 J. INOUE and Y. MITSUTA
Table 10. Mean (RMS) Specific Humidity by Months and Wind Directions
March April May June July Aug. Sept.
Wd 100xSh 1 N 211(85) 303(114) 400(169) 632(291) 901(250) 833(165) 674(355)
2 NE 206(91) 324(116) 407(178) 703(279) 931(351) 901(227) 564(285) 3 E 170(74) 370(131) 479(169) 782(219) 1101(372) 895(217) 578(235) 4 SE 181(93) 344(162) 458(130) 767(227) 945(343) 777(240) 491(277) 5 S 157(76) 306(139) 481(158) 797(299) 921(316) 810(154) 593(264) 6 SW 205(92) 312(149) 383(176) 653(263) 1076(381) 870(334) 619(297) 7 W 162(88) 280(134) 327(113) 633(230) 966(355) 814(255) 508(275) 8 NW 162(81) 304(113) 386(154) 695(224) 945(291) 794(226) 544(285)
RA' 54 91 153 164 201 124 183 SGb 85 132 156 254 332 227 284
a Maximum Sh-minimum Sh; 8 directions. b Average RMS; 8 directions.
portant factor in determining the areal evaporation over complex landforms such as the HEIFE area.
Since our test station in the desert is not far from oases lying to the north and south, moisture advection was examined through the monthly Sh averaged for each 8 Wd range, as shown in Table 10. There is some tendency towards large Sh, but RMS is also large. The difference between the maximum and minimum Sh by Wd, is max-imum in July and minimum in March. However, the averaged RMS of Sh in 8 Wd ranges is considerably larger than the Sh range in all months except in May. The monthly averaged Sh by Wd range in March, May and July are shown in Fig. 9. There are almost no differences in Sh by Wd in March. Some increase in Sh in July was found
15 Sh-3
;11-5 12 - Sh-7
-
6-
.0- .. ... . ........... • .... ..... .. ,........„.
3
0 - I N NE E SE S SW W NW Wd
Fig. 9. Monthly averaged specific humidity (Sh) and standard deviations (bar) of March, May and July by 8 wind directions.

A Year-round Test Meteorological Observation in the Desert of HEIFE Area, Northwest China 127
in 3 (E) and 6 (SW) directions, but was not significant due to large RMS (bars). The directions of increased Sh are not evident even in May. Moisture advection is not ap-
parent in the monthly averages. However, it is observable in the data for short periods, e.g. 10 days (Inoue and Mitsuta, 1989)').
6. Seasonal Circulation
The Qilian Mountains are located to the west of the HEIFE area, which is the nor-theast periphery of the Tibetan Plateau. The alternation of two winds between day and night in summer over the slopes of the Qilian Mountains due to large scale mountain and valley winds was reported (Tang, 1963; cited by Yoshino, 1974)11), namely southerly (downslope) at night and northerly (upslope) in daytime. However, the pre-sent desert site seems not to be directly affected by this circulation. The spring and sum-mer boundary-layer observations in the Gobi desert, immedeately north of the Qilian Mountains, revealed prevailing daytime northerly winds in all periods (Smith et al., 1986)12). However, the present winds are cross slope directions, and no prevalence oc-
curs in summer afternoons. It can be concluded that the prevailing winds in the desert are not slope winds but of another circulation.
The monthly averaged surface (850 mb) maps show that the HEIFE area was in the low centered on the Tibetan Plateau in July, 1989, and on the high pressure ridge extend-ing along the northern periphery of the plateau in January, 1990. Thus the occurrence of prevailing winds is indefinite based on the averaged surface maps. This was because 1) the wind originated from upper layers, and 2) the prevailing winds were of short dura-tion. The summer heat low over the Tibetan Plateau and the resulting cyclonic circula-tion around the plateau was presented by Flohn (1968)13). The extent directly affected by the plateau, defined by Gao and Li (1981)14), covers a much larger area than the
plateau, and includes the HEIFE area. The thermal effect of the plateau is a heat sink in winter, October to March, and a heat source in summer, April to September (Ye and Gao, 1981)15). As a result, shallow, cold highs in winter and huge heat lows in summer are produced. In the northern part of the plateau, the winter high intensifies planetary westerlies and the summer low produces cyclonic circulation around the plateau. As a result, the basic upper currents of the HEIFE area are strong westerly in winter, and easterly in summer.
The stationary northwesterly in winter afternoons is considered to be produced by the mixing of upper currents and the boundary layer, which can be deduced from the in-creased Ws in the afternoon (Fig. 6). A high pressure belt is formed in summer on a 600 mb chart due to a descending air motion along both the north and south peripheries of the plateau. The northern high belt is reported to change diurnally. It is said to be intensified in the afternoon (Tang and Shen, 1981)16). The wind under high pressure is not stationary. This may explan why q is small in summer afternoon.
The annual frequency distributions of Wd of our desert test station and three existing stations are shown in Table 11. The primary (underlined) and secondary maximum frequencies reveal prevailing northwesterly and the easterlies at all stations.

128 1 INOUE and Y. MITSUTA
Table 11. Frequency (%) of Wind Direction in HEIFE Area
Wd C N NNE NE ENE E ESE SE SSE S SSW SW WSW W WNW NW NNW
Desert 6 3 4 7 10 8 7 9 6 4 3 2 2 5 8 9 5 Linze 25 4 2 3 2 4 5 12 5 3 2 2 2 5 8 18 7 Gaotai 16 2 1 2 3 17 7 6 2 2 1 2 2 9 7 10 3 Zhangye 23 5 2 2 1 2 3 8 9 7 3 3 2 4 5 12 8
The increased numbers of calms at three stations are due to increased roughness of the oasis. The northwesterly is definite, but the directions of the easterlies are ambiguous. The station to station differences in wind direction of the easterlies form a quadrant, but the easterlies seem to blow roughly along the Qilian Mountains.
7. Concluding Remarks
7.1 The Basic Climatic Features of the HEIFE Area and the Seasonal Circulation:
1) Both hourly and daily total solar radiation are maximum in May with no significant differece from June to August. The cloud cover is large from June to August, and is maximum in July. There is no evidence of increased daytime cloud activitity in summer.
2) The hottest month is July with no significant difference from June to August. The standard deviations of Ta are larger in winter than in summer. 3) The monthly averaged relative humidity is less than 50%, which shows the aridity of this area. 4) There are two prevailing wind directions: south easterlies in summer after midnight, and northwesterly in the afternoon of the other seasons. The directions of the prevailing easterlies differ depending on months and stations. 5) The durations of the prevailing winds are several hours. Their origins are easterly currents toward the heat low over the Tibetan Plateau in summer and planetary westerlies in winter. The summer easterly is disturbed by the diurnally developed high
pressure ridge over the northern periphery of the plateau in daytime, while the winter westerly is considered to be blocked by nocturnal thermal stratification.
7.2 The Local Climate of the Desert in Comparison with the Oasis:
1) The averaged daily temperature range is larger in winter than in summer in the desert, while it is stationary in oasis. 2) Relative humidity in desert changes diurnally in close inverse correlation with air temperature. Specific humidity also decreases diurnally with increased temperature in summer but does not changes in the dry season. 3) Mosture advection from oasis to desert is not evident on monthly statistics but may occur in a short period.

A Year-round Test Meteorological Observation in the Desert of HEIFE Area, Northwest China 129
7.3 The Maintenance of Instruments:
1) The effect of desert dust on the instruments is not serious for temperature/humidity sensors and the propeller type anemometer. Periodic cleaning of radiation dome is necessary. 2) The ground thermometer must be placed in stable sand dunes, and the surface level must be checked frequently. 3) The instruments must be protected against lightning. Thunderstorms occur from April to October on the average of 7.4 days a year (Linze climatological office; personal communication) Finally, it is noted that the solar energy is stable throughout the year in this area.
Acknowledgement
This work is a part of a Sino-Japanese cooperative program, HEIFE. The logistic support on the observation was due to Prof. Shen Zhibao and other Chinese colleagues of Lanzhou Institute of Plateau Atmospheric Physics, Academia Sinica. The authors are indebted to Mr. H. Tagawa for drawing figures.
References
1) Inoue, J and Y. Mitsuta: A Preliminary Report of Test Observation by Automatic Weather Station in HEIFE Area, HEIFE Report 4, 1989, pp. 72-86.
2) Inoue, J and Y. Mitsuta: Results and Problems of Test Observation in the Desert of HEIFE Area, HEIFE Report 5, 1990, pp. 165-221.
3) Inoue, J. (1976): Climate of Khumbu Himal, Seppyo, Vol. 38, Special Issue, 1976, pp. 66-73. 4) Bucknell, J.: Climatology, An Introduction, Macmillan, London, 1964, pp. 76-90.
5) Munn, R.: Descriptive Micrometeorology, Academic Press, 1966, p. 49. 6) Schwerdtfeger, W.: The Climate of the Antarctica, World Survey of Climatology, Vol. 14, Elsevier,
1970, pp. 286-291. 7) Yamartino, R. J.: A Comparison of Several "Single-Pass" Estimator of the Standard Deviation of Wind
Direction, Journ. Climate Appl. Meteor., 23, 1984, pp. 1362-1366. 8) Oke, T.: Boundary Layer Climate, Wiley & Sons, 1978, 372p.
9) Inoue, J., Y. Mitsuta, Z. Shen and J. Wang: Comparison of Surface Meteorological Data in Gobi and Sand Desert of HEIFE Area, HEIFE Report No. 5, 1990, pp. 159-164.
10) Wang, J.: A Preliminary Study of Turbulent Transfer Characteristics in Gobi Area with an Eddy Correlation Technique, HEIFE Report No. 4, 1989, 54-71.
11) Yoshino, M.: Rain and Climate of China (in Japanese), Taimeidoh, Tokyo, 1974, 216pp. 12) Smith, E., E. Reiter and Y. Gao: Transition of Surface Energy Budget in the Gobi Desert between
Spring and Summer Seasons, J. Climate Appl. Meteor., 25, 1986, pp. 1725-1740. 13) Flohn, H.: Contribution to a Meteorology of the Tibetan Highlands, Atmos. Sci. Paper No. 130,
Colorado State Univ., 1968, I20p. 14) Gao, Y. and C. Li: Influences of Qinghai-Xizang Plateau on Seasonal Variation of General
Atmospheric Circulation, Geological and Ecological Studies of Qinghai-Xizang Plateau, Vol. 2, Science Press, Beijing, 1981, pp. 1477-1484.
15) Ye, D. and Y. Gao: The seasonal Variation of the Heat Source and Sink over Qinghai-Xizang Plateau and Its Role in the General Circulation, ibid., pp. 1453-1461.
16) Tan, M. and Z. Shen: Some Basic Characteristics of the Climate of Qinghai-Xizang Plateau, ibid., pp. 1563-1568.