tipranavir nda 21-814: efficacy evaluation rafia bhore, ph.d. statistician reviewer division of...
TRANSCRIPT

Tipranavir NDA 21-814:Efficacy Evaluation
Rafia Bhore, Ph.D.
Statistician Reviewer
Division of Antiviral Drug Products
Food and Drug Administration
May 19, 2005 FDA Antiviral Drugs Advisory Committee Meeting

May 19, 2005 FDA Antiviral Drugs Advisory Committee Meeting 2
Outline of Efficacy Presentation• Study Design of Phase 3 Trials• Patient Disposition• Demographics and Baseline Characteristics• Evaluation of Open-Label Design• Efficacy Evaluation
– Primary Efficacy (FDA Analysis)– Subgroup Analyses by PI resistance, T-20 use– Head-to-head comparison of TPV vs PIs
• Summary of Efficacy

May 19, 2005 FDA Antiviral Drugs Advisory Committee Meeting 3
Study Design of RESIST* Trials
(Studies 1182.12 and 1182.48)*Randomized Evaluation of Strategic Intervention in
Multi-Drug ReSistant Patients with Tipranavir
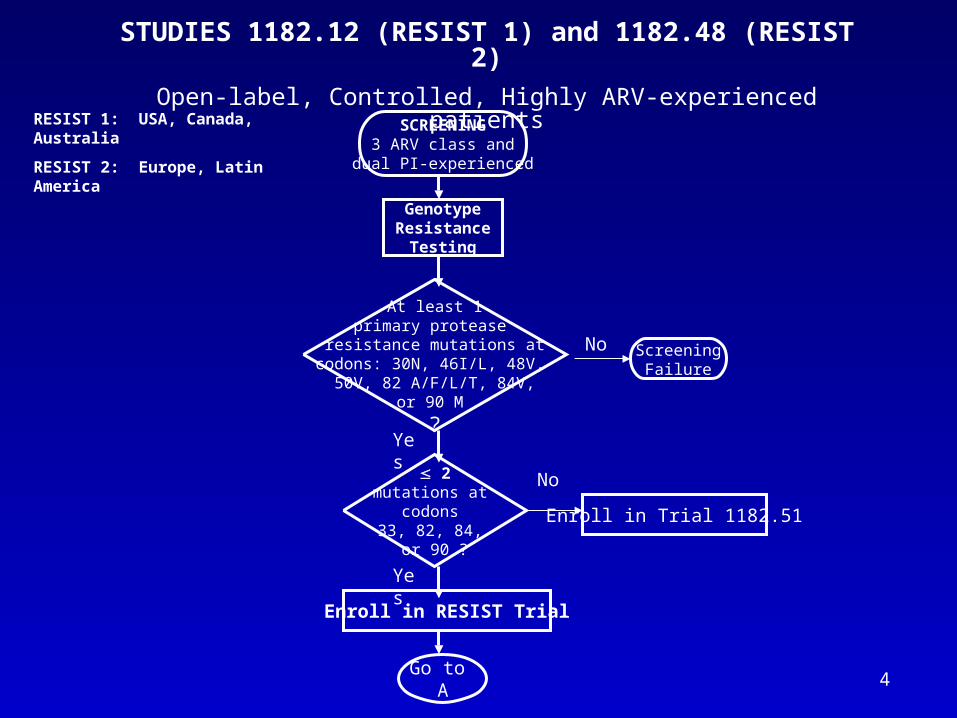
STUDIES 1182.12 (RESIST 1) and 1182.48 (RESIST 2)
Open-label, Controlled, Highly ARV-experienced patients
At least 1primary protease
resistance mutations atcodons: 30N, 46I/L, 48V,
50V, 82 A/F/L/T, 84V,or 90 M
?
Yes
ScreeningFailure
2mutations at
codons 33, 82, 84,
or 90 ?
GenotypeResistance
Testing
SCREENING3 ARV class and
dual PI-experienced
No
Enroll in Trial 1182.51
No
Yes
Enroll in RESIST Trial
Go to A
RESIST 1: USA, Canada, Australia
RESIST 2: Europe, Latin America
4

either
or
TPV 500 mg bid + RTV 200 mg bid + OBR
PI + RTV + OBR
APV/RTVSQV/RTVIDV/RTVLPV /RTV
RANDOMIZEto
Pre-select PI(Protease Inhibitor)based on genotypic
resistance test
Select OBR(OPTIMIZED BACKGROUND REGIMEN)
based on screening genotype test and ARV medication history
A
Week 8 Week 24 Week 48 Week 96
Open-label
Roll-overTrial 1182.17
Patients in comparator PI/RTVgroup with lack of initial
virologic response or confirmed virologic failure will roll-over to
TPV/RTV groupin Roll-Over Trial 1182.17
Week 8 Week 24 Week 48 Week 96
NOTES:
PI=Protease Inhibitor
TPV=tipranavir, RTV=ritonavir
APV=amprenavir, SQV=saquinavir
IDV=indinavir, LPV=lopinavir 5
Amendment # 2Allowed patients with
highly PI resistant virus to be treated with PI-based regimen.
May 19, 2005 FDA Antiviral Drugs Advisory Committee Meeting 6
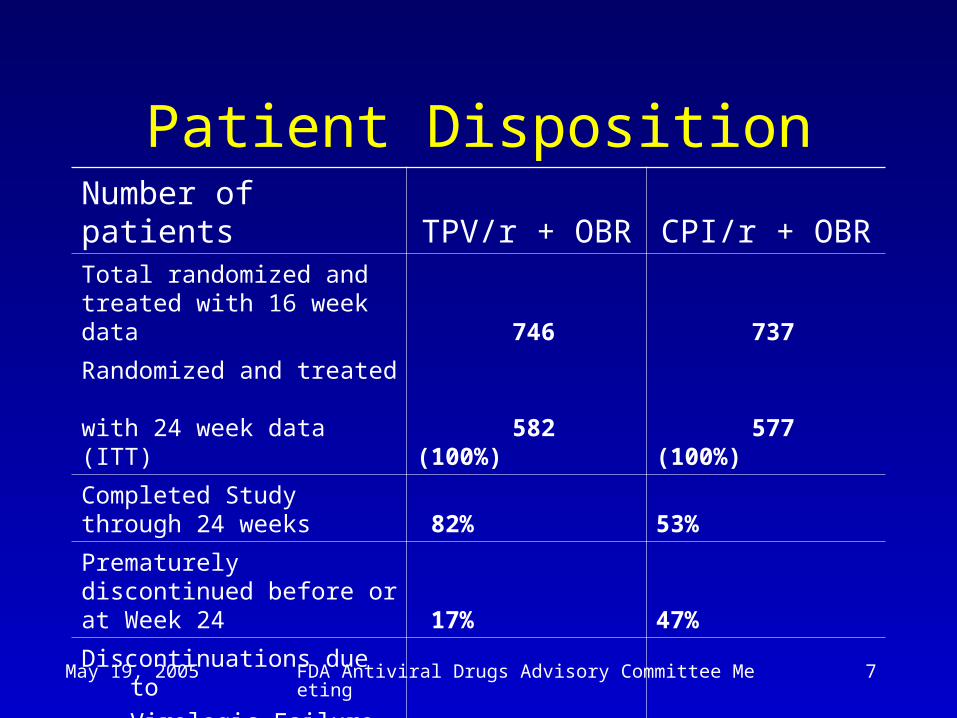
Patient Disposition
May 19, 2005 FDA Antiviral Drugs Advisory Committee Meeting 7
Patient DispositionNumber of patients TPV/r + OBR CPI/r + OBRTotal randomized and treated with 16 week data 746 737
Randomized and treated with 24 week data (ITT) 582 (100%) 577 (100%)
Completed Study through 24 weeks 82% 53%
Prematurely discontinued before or at Week 24 17% 47%
Discontinuations due to
Virologic Failure or no Virologic response 3%
37%
Adverse Events 8% 4%
May 19, 2005 FDA Antiviral Drugs Advisory Committee Meeting 8
Demographics and Baseline Characteristics
May 19, 2005 FDA Antiviral Drugs Advisory Committee Meeting 9
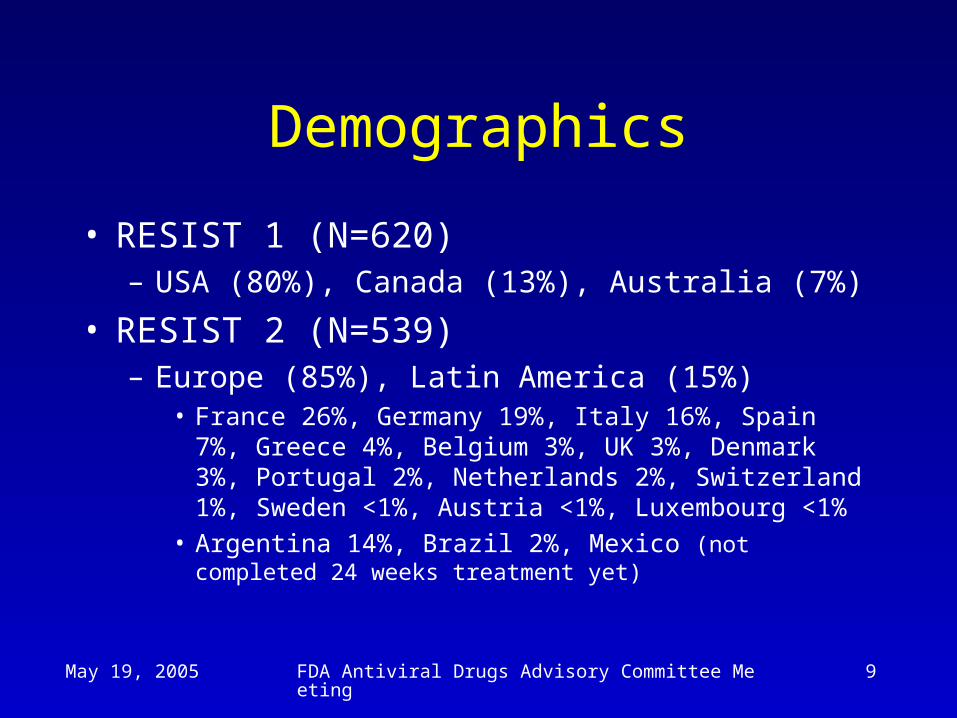
Demographics
• RESIST 1 (N=620)– USA (80%), Canada (13%), Australia (7%)
• RESIST 2 (N=539)– Europe (85%), Latin America (15%)
• France 26%, Germany 19%, Italy 16%, Spain 7%, Greece 4%, Belgium 3%, UK 3%, Denmark 3%, Portugal 2%, Netherlands 2%, Switzerland 1%, Sweden <1%, Austria <1%, Luxembourg <1%
• Argentina 14%, Brazil 2%, Mexico (not completed 24 weeks treatment yet)

May 19, 2005 FDA Antiviral Drugs Advisory Committee Meeting 10
Demographics (contd)
• Age [Mean (range)]
– RESIST 1: 45 years (24 to 80 yrs)– RESIST 2: 43 years (17 to 76 yrs)
• Gender– RESIST 1: 91% male, 9% female– RESIST 2: 84% male, 16% female
• Race– RESIST 1: 77% Caucasian, 22% Black, 1% Asian– RESIST 2: 68% Caucasian, 5% Black, 1% Asian,
26% Missing (France)
May 19, 2005 FDA Antiviral Drugs Advisory Committee Meeting 11
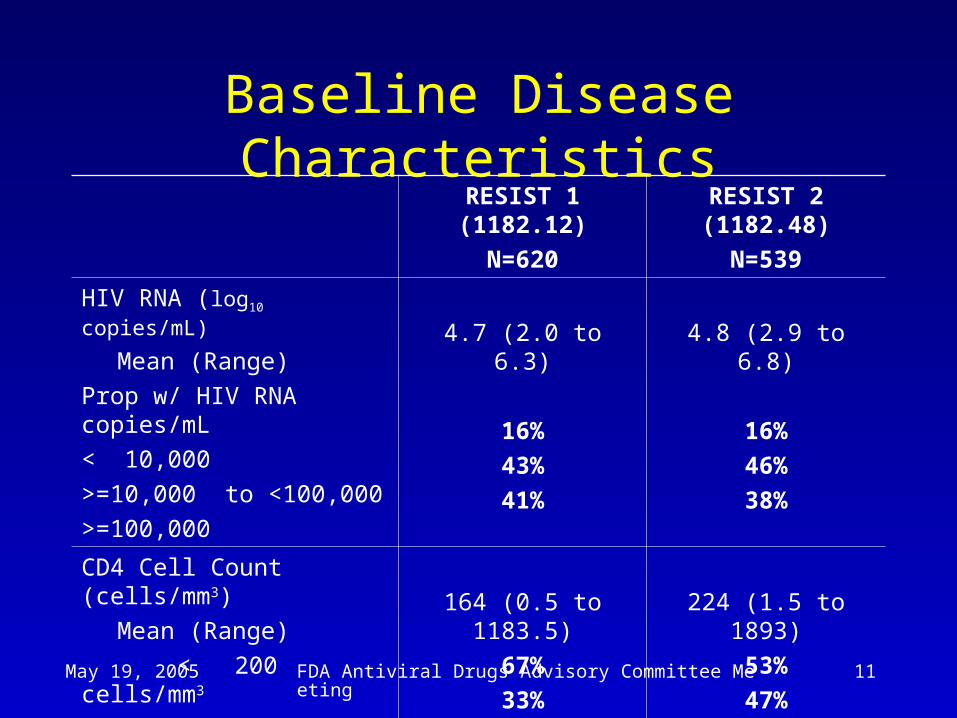
Baseline Disease CharacteristicsRESIST 1(1182.12)
N=620
RESIST 2(1182.48)
N=539
HIV RNA (log10 copies/mL)
Mean (Range)
Prop w/ HIV RNA copies/mL
< 10,000
>=10,000 to <100,000
>=100,000
4.7 (2.0 to 6.3)
16%
43%
41%
4.8 (2.9 to 6.8)
16%
46%
38%
CD4 Cell Count (cells/mm3)
Mean (Range)
< 200 cells/mm3
>= 200 cells/mm3
164 (0.5 to 1183.5)
67%
33%
224 (1.5 to 1893)
53%
47%

May 19, 2005 FDA Antiviral Drugs Advisory Committee Meeting 12
Baseline Disease Characteristics
RESIST 1(1182.12)
N=620
RESIST 2(1182.48)
N=539
HIV infection stage
Class A
Class B
Class C
24%
19%
57%
17%
27%
56%
Hepatitis B positive
Hepatitis C positive
Hepatitis B and C co-infected
5%
7%
0.5%
5%
14%
0.9%
May 19, 2005 FDA Antiviral Drugs Advisory Committee Meeting 13
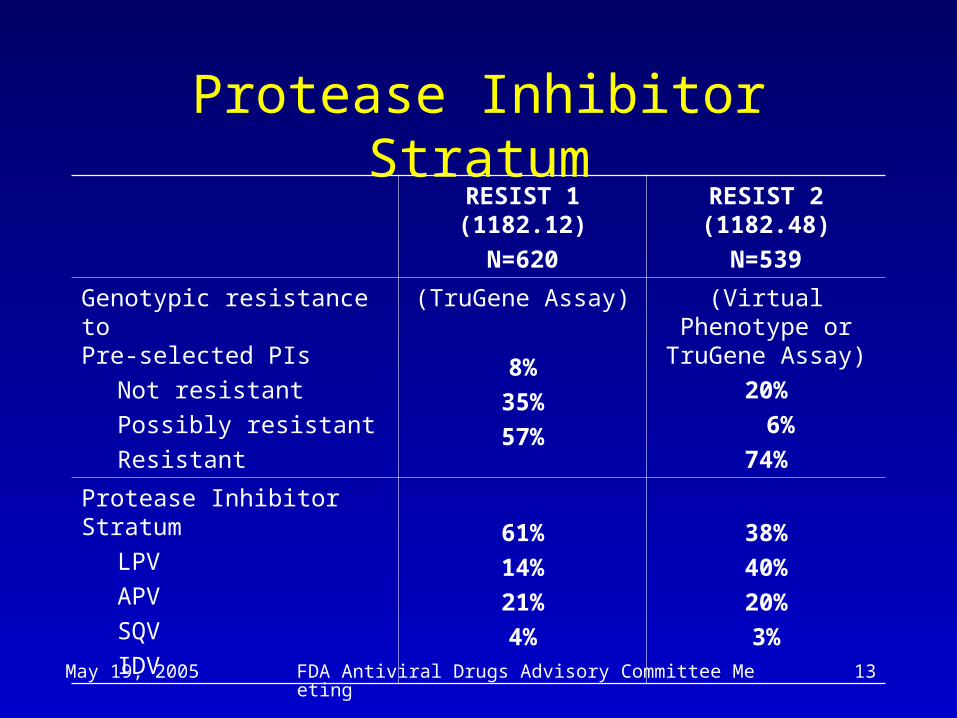
Protease Inhibitor StratumRESIST 1(1182.12)
N=620
RESIST 2(1182.48)
N=539
Genotypic resistance to Pre-selected PIs
Not resistant
Possibly resistant
Resistant
(TruGene Assay)
8%
35%
57%
(Virtual Phenotype or TruGene Assay)
20%
6%
74%
Protease Inhibitor Stratum
LPV
APV
SQV
IDV
61%
14%
21%
4%
38%
40%
20%
3%

May 19, 2005 FDA Antiviral Drugs Advisory Committee Meeting 14
Evaluation of Potential Biases due to
Open-Label Design

May 19, 2005 FDA Antiviral Drugs Advisory Committee Meeting 15
Pre-determined T-20 Stratum versus Actual T-20 use
Pre-selected T-20 (No) but
Actual T-20 (Yes)
Pre-selected T-20 (Yes) but
Actual T-20 (No)TPV/rN=427
CPI/rN=430
TotalN=857
TPV/rN=155
CPI/rN=147
TotalN=302
3% 1%* 2% 5% 16%* 10%
* McNemar’s test p-value < .001
• Mismatches between Pre-determined vs Actual

May 19, 2005 FDA Antiviral Drugs Advisory Committee Meeting 16
Pre-determined vs Actual Background Regimen
• Total # of pre-determined regimen = 155• Total # of actual regimen = 161• Mismatches between Pre-determined vs Actual
RESIST 1 RESIST 2
TPV/rN=311
CPI/rN=309
TotalN=620
TPV/rN=271
CPI/rN=268
TotalN=539
9% 12% 11% 13% 14% 14%
May 19, 2005 FDA Antiviral Drugs Advisory Committee Meeting 17
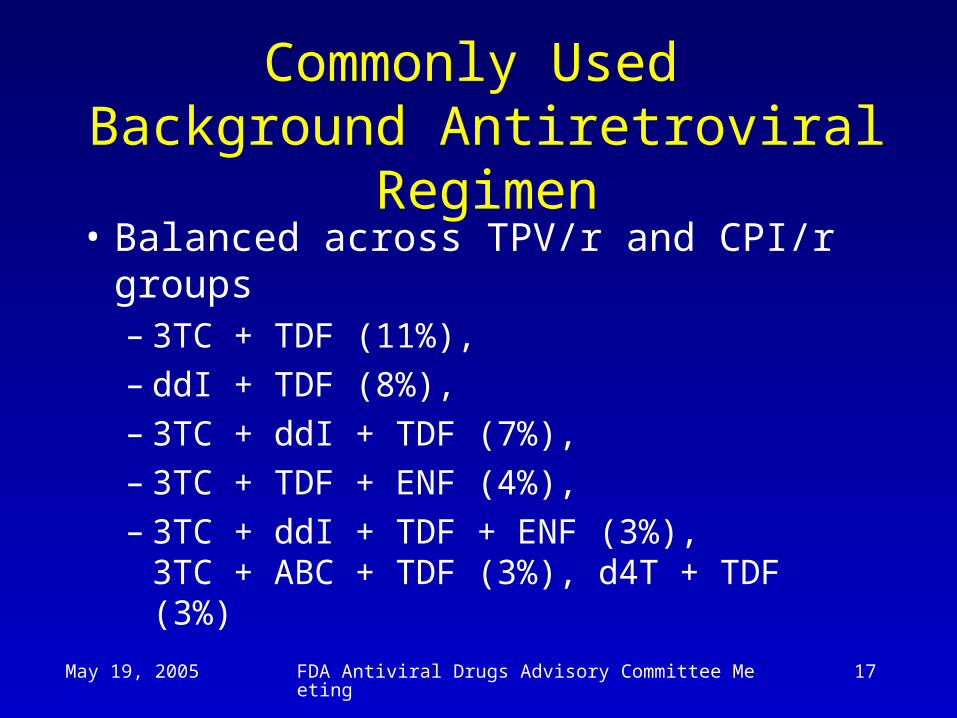
Commonly Used Background Antiretroviral Regimen
• Balanced across TPV/r and CPI/r groups– 3TC + TDF (11%), – ddI + TDF (8%), – 3TC + ddI + TDF (7%), – 3TC + TDF + ENF (4%), – 3TC + ddI + TDF + ENF (3%),
3TC + ABC + TDF (3%), d4T + TDF (3%)

May 19, 2005 FDA Antiviral Drugs Advisory Committee Meeting 18
Protocol Violations in RESIST 1 and RESIST 2 trials
• Unique patients with protocol violations– 51% in TPV/r and 56% in CPI/r group
• Patients had 1 or more protocol violations of same or different type
• Types of protocol violations– Screening (Entry Criteria) violations– Treatment Regimen violations during study– Other violations with use of concomitant drugs

May 19, 2005 FDA Antiviral Drugs Advisory Committee Meeting 19
Screening Violations
• 29% TPV/r vs 32% CPI/r unique patients with screening violations– E.g., no protease gene mutations at
codons 30N, 46I/L, 48V, 50V, 82A/F/L/T, 84V, or 90M
– Less than 2 PIs or less than 3 mos. of trt on historical therapy
– Screening viral load < 1,000 copies/mL, etc.

May 19, 2005 FDA Antiviral Drugs Advisory Committee Meeting 20
Treatment Regimen Violations
• 24% TPV/r vs 25% CPI/r unique patients with treatment regimen violations– E.g., Dual-boosted PIs used– Randomized to CPI/r group and pre-
specified PI not taken or changed– No new or recycled ARV in optimized
background regimen, etc.

May 19, 2005 FDA Antiviral Drugs Advisory Committee Meeting 21
Initial Lack of Virologic Response by Week 8
• Viral load has not dropped 0.5 log10 HIV RNA copies/mL after 8 weeks of treatment
• Failure to achieve a viral load <100,000 copies/mL after 8 weeks, despite a 0.5 log10 drop after 8 weeks of treatment
• Patients in CPI/r group may discontinue and roll-over to Study 1182.17 and receive tipranavir/ritonavir
• Escape clause may create bias in efficacy after Week 8
May 19, 2005 FDA Antiviral Drugs Advisory Committee Meeting 22
Efficacy EvaluationPrimary Efficacy (FDA Analysis)

May 19, 2005 FDA Antiviral Drugs Advisory Committee Meeting 23
Efficacy Endpoint at 24 Weeks
• Proportion of patients with confirmed ≥1 log reduction from baseline in HIV RNA without prior evidence of treatment failure, i.e., – Death– Confirmed virologic failure– Permanent discontinuation of study drug– Introduction of a new ARV drug for reasons
other than toxicity to background ARV

May 19, 2005 FDA Antiviral Drugs Advisory Committee Meeting 24
Efficacy Outcomes at 24 Weeks(Intent-to-Treat Analysis)
RESIST 1 (1182.12) RESIST 2 (1182.48)
TPV/r + OBR
N=311
CPI/r + OBR
N=309
TPV/r + OBR
N=271
CPI/r + OBR
N=268
Response (>=1 log reduction)
41% 21% 40% 14%
Virologic Failure 55% 75% 52% 83%
Initial Lack of Virologic Response at Week 8
35% 53% 35% 66%
Rebound
Never suppressed through Week 24
13%
7%
13%
9%
10%
7%
10%
8%

May 19, 2005 FDA Antiviral Drugs Advisory Committee Meeting 25
Efficacy Outcomes at 24 Weeks (contd.)
RESIST 1 (1182.12) RESIST 2 (1182.48)
TPV/r + OBR
N=311
CPI/r + OBR
N=309
TPV/r + OBR
N=271
CPI/r + OBR
N=268
Added ARV drug 2% 2% 6% 1%
Died 0% 0% 0% <1%
Discontinued due to adverse events
1% 0% 1% 1%
Discontinued due to other reasons
1% 1% 0% 0%
Discontinued while suppressed
0% 1% 1% 0%
May 19, 2005 FDA Antiviral Drugs Advisory Committee Meeting 26
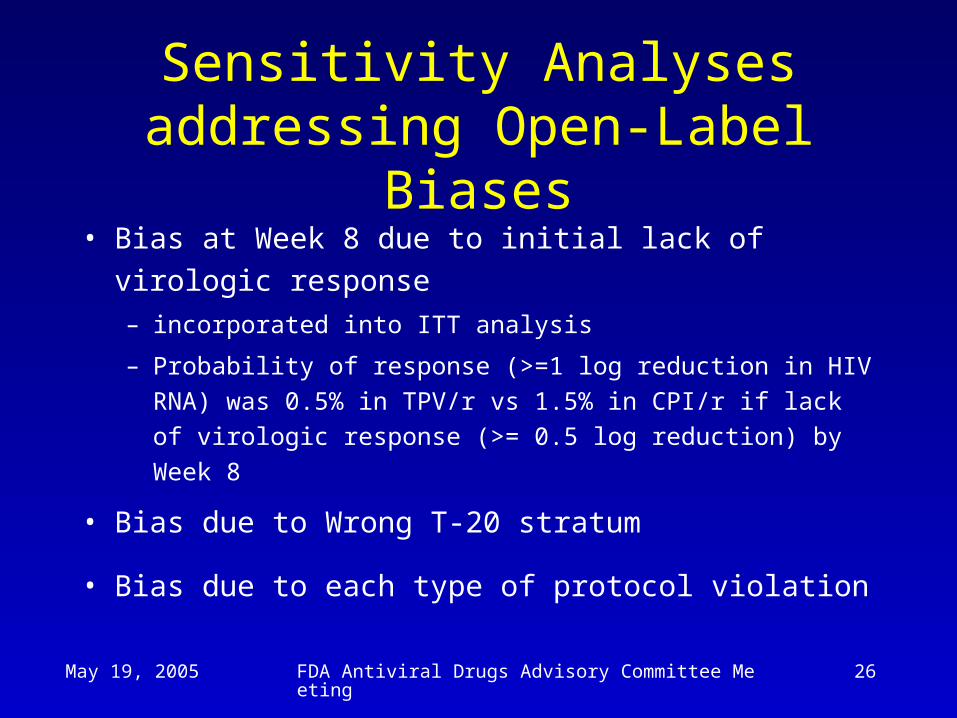
Sensitivity Analyses addressing Open-Label Biases
• Bias at Week 8 due to initial lack of virologic
response – incorporated into ITT analysis
– Probability of response (>=1 log reduction in HIV RNA) was
0.5% in TPV/r vs 1.5% in CPI/r if lack of virologic response
(>= 0.5 log reduction) by Week 8
• Bias due to Wrong T-20 stratum
• Bias due to each type of protocol violation

May 19, 2005 FDA Antiviral Drugs Advisory Committee Meeting 27
Sensitivity AnalysisEfficacy Results
Analysis type
TPV/r + OBR
N=582
CPI/r + OBR
N=577
Difference (TPV/r-CPI/r)
(95% CI)
ITT 234 (40%) 103 (18%) 22% (17%, 27%)
ITT adjusting wrong T-20 stratum
232 (40%) 126 (22%)
Per-Protocol (Exclude Treatment Regimen Violations)
215/507
(42%)
98/480
(20%)
Per-Protocol (Exclude Screening Violations)
191/465
(41%)
82/457(18%)
18%(13%, 23%)
22%(16%, 27%)
23%(17%, 29%)

May 19, 2005 FDA Antiviral Drugs Advisory Committee Meeting 28
Subgroup Analyses• By T-20 stratum
• By Control Protease Inhibitors adjusting for Resistance and Experience

May 19, 2005 FDA Antiviral Drugs Advisory Committee Meeting 29
Subgroup-Analysis by T-20 use stratum
Enfuvirtide (ENF, T-20) used? TPV/r CPI/r
Difference in proportions (95% CI)
P-value for treatment by subgroup interaction
Yes (25%) 48% 19% 29% (19%, 30%)
0.02No (75%) 29% 13% 16%
(10%, 21%)
May 19, 2005 FDA Antiviral Drugs Advisory Committee Meeting 30
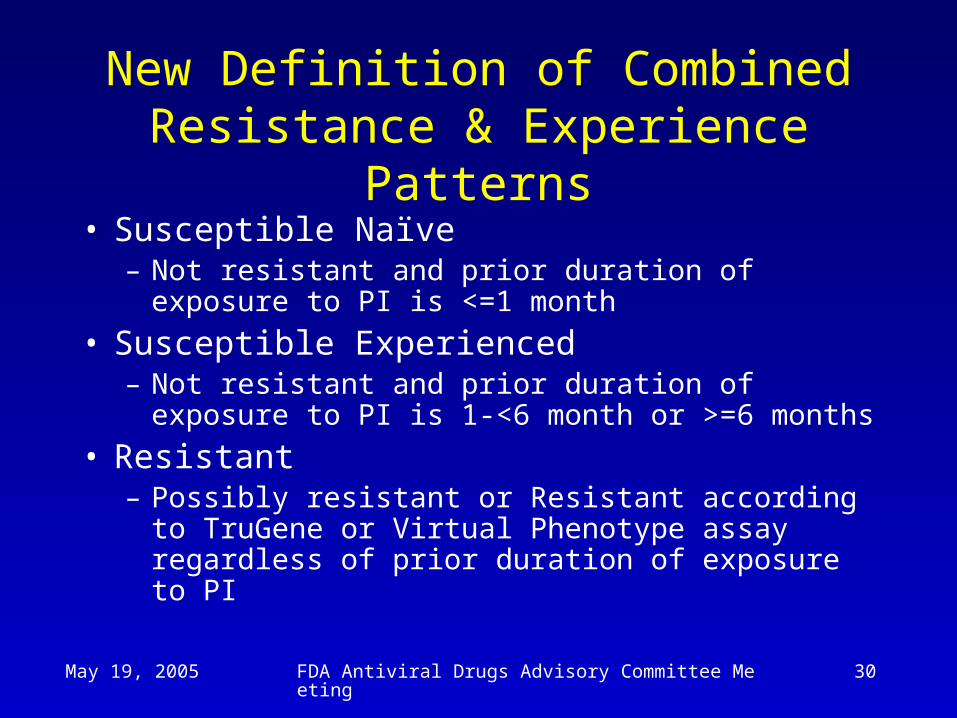
New Definition of Combined Resistance & Experience Patterns
• Susceptible Naïve – Not resistant and prior duration of exposure to PI
is <=1 month
• Susceptible Experienced– Not resistant and prior duration of exposure to PI
is 1-<6 month or >=6 months
• Resistant– Possibly resistant or Resistant according to
TruGene or Virtual Phenotype assay regardless of prior duration of exposure to PI

May 19, 2005 FDA Antiviral Drugs Advisory Committee Meeting 31
Baseline Resistance Patterns in PI Strata
38
192
245
526
2
17
14
23
1
33
25
41
0 100 200 300 400 500 600
IDV
SQV
APV
LPV
Prot
ease
Inhi
bito
r Stra
tum
Number of Patients in Each Stratum
SusceptibleNaïve
SusceptibleExperienced
Resistant

May 19, 2005 FDA Antiviral Drugs Advisory Committee Meeting 32
Confidence Intervals on Treatment Differences (TPV/r – CPI/r)
40%35%
71%
26%35%
41%
64%
-28% -26%
-8%
12% 14%18% 16%
-40%
-20%
0%
20%
40%
60%
80%
LPV/r APV/r SQV/r LPV/r APV/r SQV/r IDV/r
% o
f Res
po
nd
ers
95% UCL
Difference
95% LCL
Active PI(Susceptible Naïve)
Sub-Optimal PI(Experienced or Resistant)
May 19, 2005 FDA Antiviral Drugs Advisory Committee Meeting 33
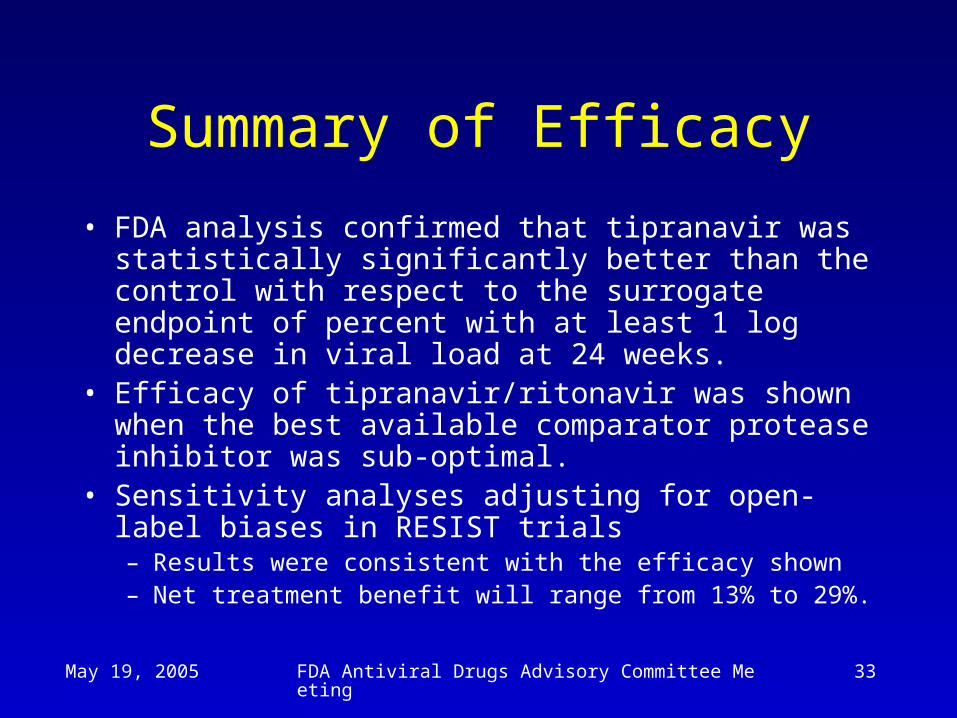
Summary of Efficacy
• FDA analysis confirmed that tipranavir was statistically significantly better than the control with respect to the surrogate endpoint of percent with at least 1 log decrease in viral load at 24 weeks.
• Efficacy of tipranavir/ritonavir was shown when the best available comparator protease inhibitor was sub-optimal.
• Sensitivity analyses adjusting for open-label biases in RESIST trials– Results were consistent with the efficacy shown– Net treatment benefit will range from 13% to 29%.
May 19, 2005 FDA Antiviral Drugs Advisory Committee Meeting 34
Summary of Efficacy (contd.)
• Efficacy of tipranavir/ritonavir was demonstrated regardless of T-20 use, but the efficacy was significantly greater when combined with T-20
• Boosted tipranavir is not proven to be better than boosted lopinavir, or amprenavir, or saquinavir, if patients are naïve and not resistant to respective protease inhibitors.– No data available on indinavir on susceptible
naïve patients.

May 19, 2005 FDA Antiviral Drugs Advisory Committee Meeting 35
Acknowledgment
• FDA colleagues– Greg Soon, Ph.D., Statistics Team Leader– Andrea James, M.D., Medical Reviewer– Rosemary Johann-Liang, M.D., Medical
Team Leader– Tom Hammerstrom, Ph.D., Statistician
Reviewer