ting hui min , che ros ismail -...
TRANSCRIPT
360
Performance of Different Types of Road Humps in Universiti Teknologi Malaysia
Ting Hui Min1, Che Ros Ismail1 1Faculty of Civil Engineering, Universiti Teknologi Malaysia, Malaysia
Keywords: Road Hump, speed reduction, heights
Abstract.Road hump is one of the most commonly used traffic calming device in Malaysia. The installation of such traffic calming device has created a more liveable environment with improvement of environmental quality and road safety as a result of lower speeds and traffic volume reduction. Road humps has been implemented in Malaysia especially in residential area, but the effectiveness of road humps in reducing the speed in campus area is not well explored. In order to make sure the road humps installed achieve its functions effectively, a study must be carried out to evaluate the performance of existing road humps. Thus this study was carried out (i) to check the as-built installation of road humps in UTM with the standard specifications by authorities such as MBJB, MPJBT, JKR, MPSP and SIRIM, and (ii) to determine the passenger cars speed reduction when passing the different types of road humps in UTM. Fourteen humps in UTM were checked with their dimensions and the installation of furniture such as the warning signboard and transverse bars. Through this study, it was found that most of the road humps in UTM were not fully complied with the standard specifications. Meanwhile, radar gun was used to collect the passenger cars free flow speed before the road humps and the speed on three flat-top humps and three round-top humps with different heights. For the flat-top humps with pedestrian crossing, it was found that the speed reductions were 52.8 %, 54.5 % and 53.2 % for the humps with height 55mm, 98mm and 115mm respectively. While for the round-top humps, the speed reductions were 35.7 %, 55.0% and 54.8% for the humps with height 53mm, 98mm and 125mm respectively. All the humps were proved to be effective in reducing speed through t-test. T-tests were also done to compare the average speed reductions of humps with different heights. Lastly, from t-test analysis, there was no significant difference between the average speed reductions for a 98mm flat-top hump and a 98mm round-top hump in this study. Further studies should be conducted to evaluate the other road humps in campus area to ensure a safe and harmonious environment for the community.
Introduction The proper planning and design of a road system is essential in determining the efficiency and safety of the road users. In order to create a safer traffic environment for all road users especially on the road that do not have access control, traffic calming measures were introduced to slow down the speed of vehicle. The installation of the traffic calming devices has resulted in a more liveable area with improvement of environmental quality and road safety as a result of lower speeds and traffic volume reduction.In campus, road humps are being installed to calm the traffic by its physical features which the vehicles will be forced to slow down by encumbrances as the roads are usually with heavy pedestrian movement [1]. In UTM where the private automobile dependency is considered high as most of the students and staffs preferto travel within the campus using their own vehicles, a number of road humps were installed at various locations in campus area.However, the performance of the different shapes of road humps resulting on the speed reduction for vehicles when passing through the road humps in UTM campus is not well explored.Thus this study was carried out (i) to check the as-built construction of different shapes of road humps in UTM with the standard specifications by authorities such as MBJB, MPJBT, JKR, MPSP and SIRIM, and (ii) to determine the passenger cars speed reduction when passing the different types of road humps in UTM.To achieve the objectives, the study was done on several types of speed humps in the Skudai

361
campus of Universiti Teknologi Malaysia (UTM). The focused area in this study is located along the road Lingkaran Ilmu, Lengkok Universiti, and Jalan Meranti. Fourteen existing road humps with different shapes in UTM were checked regarding to their dimensions and the installation of furniture such as the warning signboard and transverse bars.After that, six humps with different heights from different shapes of road humps were chosen to conduct the spot speed data collection on the vehicles that passing them. Problem statementIn Malaysia, many constructions built close or near to the unstable rock slope face. This happened due to the high demand of real estate and also because the location for that residential area is strategic compared to others places. By assuming the rock is strong and safe, the developer usually take least attention on the buffer zone, in which by time rock or disuse quarries may become unstable and can affect the stability of the rock slope. Given the situation, some analysis of the rock fall at Jalan Bukit Permai, Cheras will be carried out to determine the stability condition of the rock forming slope. Objective of study The objectives of this study are as per discussed: 1) To carry out scanline survey at Jalan Bukit Permai, Cheras, Selangor. 2) To determine the instability and probability of failure using kinematic analysis in Dips 6.0 and
simulate the rock fall event using RocFall 5.0. 3) To identify hazard level and stimulate the rock fall stability by using Rockfall Hazard Rating
System (RHRS). Scope of study The scope of study will be focused on: 1) The rock slope at Jalan Bukit Permai, Cheras, Selangor. 2) Empirical analysis using Rockfall Hazard Rating System (RHRS). 3) Numerical analysis of rock falls by using RocFall 5.0 and Dips 6.0 software from RocScience. Previous study Definition and Objectives of Traffic Calming Devices As a result of growth in traffic flow, traffic calming devices were introduced in order to have a better control towards the traffic. According to Metzger [2], traffic calming device is an effective measure to increase the safety through a combination of physical, behavioural and psychological ways. The devices are said to maintain the flow and circulation through a network by guiding the traffic at safe speeds for the road users. In addition, traffic calming is the combination of mainly physical measures that reduce the negative effects of motor vehicles, through changing the driver behaviour and thus improve the condition for the other non-motorised road users [3]. Meanwhile, Barbosa [4] claimed the main objectives of traffic calming are to reduce number and severity of accidents, to reduce noise and air pollution, to enhance the street environment for pedestrians by reducing the dominance of cars. Vertical Speed Controls According to Bunte [5], vertical devices generates the most displeasure with the citizens who frequently use the roadways. The increased acceleration and braking is necessary to pass through these vertical impediments or obstacles and thus causing speed interruptions while traveling upon the roadway. Drivers have to cross the vertical speed controls at lower speeds or else will cause discomfort for the passengers. Speed hump and speed bumps are raised above the pavement level extending transversely across the width of roadway. They are commonly used as they are easily constructed and not expensive. Speed humps are appropriate on public roads and bumps are commonly implemented in private property where operating speeds are low or less than 30km/hr [6].
A raised crosswalk are essentially broad, flat-topped speed humps that coincide with pedestrian crosswalks at street intersections. It is installed to slow traffic, enhance crosswalk visibility and

362
make the crossing easier for pedestrians who may have difficulty stepping up and down curbs [7] . The raised crosswalk are installed at locations with high pedestrian volume, school area, and central business district. Another shapes of road humps recommended in the National Guidelines for Traffic Calming is the sinusoidal speed hump [6]. However, sinusoidal speed humps are not commonly chosen due to the precise accuracy required during construction. The Guidelines of Road Humps Installation The guidelines for installation of road humps are not clearly specified in Malaysia. According to Manan & Poi [8], most of the traffic calming measures were implemented without proper standard or guidelines, but purely base on experiences of the traffic engineer and request from residents.
According to Guidelines of Construction of Road Hump by Majlis Perbandaran Seberang Perai [9], there is a need to install the road humps especially in residential areas where there are high density of public people at schools, mosque, and recreation parks. The selection of the types of speed humps is based on the reserved lane width for the roads. Round-top humps will be installed for the road with reserved lane width of at least 4.88 m while for roads with reserved width of at least 20.12 m, flat-top humps will be installed. Besides, the following are the criteria and requirements by Majlis Perbandaran Seberang Perai in considering the need of construction of road humps: i. Busy shortcuts such as the roads connecting two residential areas; ii. Municipal street and roads not connected to State Road/ Federal Road; iii. Nearby areas where the public concentrates such as mosque, prayer, hall, playground/recreation parks, school/kindergarden or others; iv. Near to existing street lights; v. Optimum distance from existing road humps; and vi. No car parks at left or right hand side or both sides.
Majlis Bandaraya Johor Bahru [10] only allows the construction of road humps in front of the mosques, schools, nurseries, or public or private higher education institutions, local government health centers or clinics, playgrounds, football fields, or recreation parks, or the roads with high potential of accidents that 3 cases of crash happened in 6 months period.
The Department of Transport of Pretoria, Africa, also provide a national guideline to determine whether speed humps are warranted or not. The purpose is to provide a uniform and streamlined procedure, which prevent the incorrect or unnecessary use of speed humps and reduce the need for corrective measures after implementation. Series of speed humps are warranted to be installed along a route if the 85th percentile speed exceeds the desired speed (40 to 80 km/hr) along the road or the average peak hour volume exceeds between 400 and 600 vph [6].
If a single speed humps is to be implemented, the warrants to be adopted depend on the motivation for the speed hump, either a hazardous location or a pedestrian or vehicle conflict. In a potentially hazardous site the installation of the speed hump to improve the conditions is warranted if the number of accidents in the vicinity of the site exceeds 3 in one year and the speed is a common dominating factor contributing to the cause of accidents. While at a location where the potential conflict between the pedestrians and motorists is a concern, the speed hump is warranted if the road provide access to a school, playground, or old age home and the number of pedestrians, predominantly children or the elderly, crossing the road along its length exceeds 150 pedestrians in the peak pedestrian hour. The road humps also can be installed if the road width is greater than 10 m and traffic volume greater than 400 vph. If an isolated speed hump is to be constructed, the 85th percentile speed may not exceed 70km/hr and the peak hour volume must be less than 600 vph [6]. Previous Studies on Road HumpsAccording SIRIM [11], worldwide studies show an average of 13% reduction in collisions along the stretch of the road where speed humps are installed appropriately. Speed humps can help to control speeding problem on local neighborhood streets and
363
public interest such as hotels and resorts, schools, universities, parks, sporting venues, shopping centres and car parks. When placed in a series of 90m to 180m apart, humps will reduce 85 percentile speeds by 12 km/hr to 15 km/hr. Average speed resulting from installing speed humps are 15 km/hr to 30 km/hr and 40 km/hr for roads with 80 km/hr speed limit [11].
According to Layfield and Webster [12] , road humps with 100mm high have proved to be an effective method of reducing vehicle speeds. However, due to passenger discomfort, it is not suitable for bus route or where the emergency services may be expected to pass the humps on a regular basis. Therefore, highway authorities use 75mm high hump as it provides a good speed reduction for cars without causing too much difficulty for buses and emergency vehicles.
The Transportation Research Laboratory in England and Wales conducted study on 72 sites where 75mm humps have been used. The result showed that average speeds for vehicles passing the 75mm high flat-top and round-top humps were similar to the speeds for vehicles passing 100mm high humps. The installation of 75mm high flat-top and round-top humps reduced mean and 85th percentile speeds between the humps by an average of 16km/hr [12].
According to Huang and Cynecki [13], data collection from ten locations at Omaha, Nebraska, the speed before and after speed humps showed a significant reduction at 5 percent significant level. However, the residents complained about the speeding still existed, as well as the vehicle damage problem and increased of noise levels. While for the 16 speed humps installed in Bellevue, Washington, it was found that before the installation, the 85th percentile speeds were 58 to 63 km/hr and they reduced to 39 to 43 km/hr after installation of speed humps.
Sinusoidal humps are similar to a round-top hump but have a shallower initial rise. Sinusoidal humps are more comfortable than the round-top humps. However, in experiment showed that the speed reduction for sinusoidal humps is similar to the round-top humps [12].
A research done by Yaacob and Hamsa [3] on the effect of road hump in reducing speed of motorcars in a residential area in Kuala Lumpur showed that the average speed of the vehicles before approaching the road humps was about 30 km/hr and further reduced to below 10 km/hr at the road hump. The findings also showed that the gentler the design profiles of road humps especially in term of its height and slope, the higher the speed of the vehicles near and at the road hump. This study clearly showed that the design profile of road humps resulted an impact on the speed of the vehicles. Methodology
This research was divided into three stages in order to complete which are preliminary study,
data collection and analysis with conclusion. Background studyThe studied area is in the campus area of Universiti Teknologi Malaysia (UTM), Skudai, Johor. In the campus, residential colleges are located far away from the administration areas and commercial zones. This development encourages the uses of personal vehicles in the campus. This study focused on road humps located at Lingkaran Ilmu, Lengkok Universiti and Jalan Meranti. By inspection, these roads consist of round-top humps, flat top humps with pedestrian crossing and sinusoidal shape humps. However, according to Pejabat Harta Bina UTM, there are only two types of humps which are the round-top and flat-top with pedestrian crossing. Check for Specifications of Existing Road Humps in UTM A total of 14 road humps were chosen in this study to check the compliance of the road humps with specifications. Among the 14 road humps, 12 road humps located along Lingkaran Ilmu, one road humps at Lengkok Universiti and one road humps at Jalan Meranti. All the road humps selected are in good condition without damage. Figure 1 shows the location and label of the 14 humps chosen.

364
Figure 1: The location of the road humps chosen
Dimensions (width and height) of selected road humps were measured using self-design
measuring tools which consist of water level balance, aluminium rod, and a ruler as shown in Figure 2. The recorded dimension data is then plotted using AutoCAD 2010 to illustrate the different shapes of road humps.
Figure 2: Method used to measure the dimensions of road humps
After that, the dimensions and the installation of furniture such as transverse bars and warning signboard of the different types of road humps were compared with the standards in order to evaluate the compliance of road humps with standards. In this study, the guidelines used were from JKR, MPJBT, MPJB, MPSP and SIRIM. Spot Reduction To study the efficiency of the different types of road humps in UTM, the speed reduction for the vehicles when pass through the road humps was obtained. Three flat-top humps and three round-top humps with different heights were selected to collect free flow speed before humps and speed on humps. The humps selected possess the heights near to the standards, higher and lower than the standards respectively. In this study, the three flat-top humps with pedestrian crossing selected are hump H1, H7, and H13 while the three round-top humps selected were hump H5, H10 and H14. Spot speed data only measured on free vehicles, in order to get the speed that the drivers would choose on their own, without any disturbance from other drivers. According to Bjarnason [14], a free vehicle refers to a vehicle that is not in queue with other vehicles. Besides, if there is junction near the road humps, the spot speed data only taken for the cars which drive straight only. In addition, the selected road humps are located at the important route in the campus which the roads probable have high vehicles and pedestrians volume. In this study, the focused area is located

365
around Lingkaran Ilmu, which have the high flow of traffic daily as the education and administration buildings are around this area. The road hump H13 at Lengkok Universiti was also selected as it is important hump in front of the Sekolah Agama where many children crossing the road. Hump H14 at Jalan Meranti also chosen as it is a busy main road connected to entrance gate and residential colleges.
The behavior of the drivers when approaching and on the speed humps were observed at sites in the preliminary study. Through this observation, the locations for taking the spot speed data can be identified. The location where the spot speed of cars approaching the humps with free flow speed (Point A) which no influence from the existence of humps is taken by observing the distance before the driver start to reduce their speed. The speed where the cars drive on the road hump (Point B) also been collected in this study.
Thus in this study, the free flow speeds (Point A) before the hump for H1, H5, H7, H10, H13 and H14 were taken at a distance of 45m, 45m, 60m, 60m, 50m and 55m from the speed humps respectively. Radar gun was used as a device to measure the spot speed of cars. The minimum number of sample in this study was obtained from Krejcie and Morgan’s formula, thus 375 cars
were taken as samples for the spot speed data collection for each road hump. The spot speed data collection were carried out during weekday. All the spot speed data of cars
were taken from 10 a.m. to 12.00 p.m. and from 2.30 p.m. to 4.30 p.m. as to avoid the peak hour for traffic flow. This is because free flow speed of vehicles in actual situation when approaching and passing through the road humps can be obtained during off-peak hours. The weather during the data collection was sunny.
The spot speed data collected was computed using software Microsoft Excel. Calculation was done to study the average speed for the cars when travelling before the road humps and on the road humps. Finally the effectiveness of different types of road humps can be determined from the speed reduction in percentage. The result of the study was presented through graphs plotted using software Origin Pro 8.5.
In this study, two samples t-test was used to analyse the data statistically. The statistical analysis was conducted to test the significance difference of the average free flow and on-hump’s speed, in
order to study the effectiveness of the hump installation towards the speed reduction. Besides, the t-test was conducted to test whether there are significant difference between the average speed reductions of humps with different heights. In the last part of the analysis, the average speed reductions for the different shapes of road humps were tested the significance with t-test. Data Analysis Specifications of Existing Road Humps in UTMIn the study checking the as-built dimensions of different shapes of road humps, a tolerance of ±10% was given to the height and width data of road humps when comparing with the suggested values in standards which do not provide an allowable range. This tolerance was given due to the probably inaccurate in measurements and construction error at site. Table 1 summaries the result of the checking of dimensions of as-built humps in UTM.

366
Table 1: Checking for the dimensions of as-built a) flat-top humps, b) round-top humps, and c) sinusoidal humps in UTM
Hump MPJB MPSP SIRIM H W1 W2 Slope H W1 Slope H W
H1 √ × shorter
√ √ √ × shorter
√ √ × longer
H2 × lower
× shorter
× shorter
× × lower
× shorter
× × lower
√
H3 × lower
× shorter
× shorter
× × lower
× shorter
× × lower
√
H4 × lower
× shorter
× shorter
× × lower
× shorter
× × lower
√
H6 √ × shorter
× shorter
× √ × shorter
× √ √
H7 × lower
× shorter
× shorter
× × lower
× shorter
× × lower
√
H9 × lower
× shorter
× shorter
× × lower
× shorter
× × lower
√
H13 × higher
× shorter
× longer
× √ × shorter
× × higher
×longer
(a)
Hump MPJB MPSP SIRIM MPJBT JKR H W H W H W H W H W
H11 × lower
√ × lower
× longer
√ × longer
× lower
× longer
× lower
× longer
H12 × lower
√ × lower
× longer
√ √ × lower
√ × lower
√
H14 √ × shorter
√ × longer
√ × shorter
√ × shorter
√ × shorter
(b)
(c)
Overall, the as-built dimensions of humps in UTM do not meet the requirements stated by the authorities compared in this study. There are only three humps fully meet the specifications by SIRIM, which are the humps H6, H8 and H12. There are no specified standard specifications by the campus authority to be followed and this causes the dimensions of humps are not standardised and inconsistent.
Hump SIRIM H W
H5 × higher
× shorter
H8 √
√
H10 × lower
× shorter

367
The presence of road humps warning signboard and the transverse bars is checked in this study. The warning signboard is suggested to be installed by authorities including MPJB, MPJBT, JKR and MPSP. Among the 14 humps selected in this study, the warning signboard for road humps can only be found at 10 humps. Furthermore, the road hump warning signboards installed in UTM are not standardised and inconsistent. In addition, only three humps out of 14 humps equipped with transverse bars. Only at hump H9, H10 and H12 the transverse bars are installed before the road humps. For all flat top hump with pedestrian crossing, there is no transverse bars but the grid bars with word ‘AWAS’ can be found before humps. Free-flow Speed, On-hump Speed and Speed ReductionThe spot speed data collected at 6 humps were analysed in this study. Table 2 summaries the dimensions for flat-top humps studied and Figure 3demonstrates the average speed of cars before and on the flat top humps H7, H1 and H13. Table 2:Dimensions for flat-top humps H7, H1 and H13
H7 H1 H13 Width (mm) Height (mm) Width (mm) Height (mm) Width (mm) Height (mm) 3680 55 6295 98 6000 115
Figure 3: Average speed versus distance from hump (Flat-top humps)
As shown in Figure 3, the average free flow speed of cars before the lower height hump H7 was 43.9 km/hr and reduced to 20.5 km/hr when passing on the hump with average speed reduction of 52.8%. For the flat top hump which its height near to standard, H1, the average free flow speed for was 44.7 km/hr and reduced to 20.1 km/hr when on hump with the speed reduction percentage of 54.5%. While for the higher hump, H13, the average speed at a distance of 45 m before the hump was 44.2 km/hr and the drivers reduced the speed to 20.4 km/hr when passing through the H13. The speed reduction for the drivers to pass through hump H13 was 53.2%. The average free flow speed of cars before the humps for H7, H1 and H13 show a little variation, which is round 44 km/hr. The average free flow speed before hump H7 was the lowest among the three flat top humps. This probably is due to the drivers realised the speed data collection at the roadside as there was no place for observer to hide. The average speed on humps for humps H7, H1 and H13 shows that the drivers reduced their cars’ speed to almost the same speed which is around
20 km/hr, regardless of the height of the humps. From this findings, 20 km/hr probably is the comfortable speed for the drivers in UTM to pass on the humps. According to Bjarnason [14], the

368
ideal road hump would be comfortable to cross at low speed but the discomfort would increase rapidly with speed above 20 km/hr. Table 3 summaries the dimensions for round-top humps studied and Figure 4 indicates the average speed of cars before and on the round-top humps H10, H14 and H5.
Table 3: Dimensions for round-top humps H10, H14 and H5 H10 H14 H5
Width (mm) Height (mm) Width (mm) Height (mm) Width (mm) Height (mm) 2235 53 3500 98 3475 125
Figure 4: Average speed versus distance from hump (Round-top humps)
From Figure 4, it was found that the average speed of cars before approaching the lower height hump, H10, was 38.7 km/hr and reduced to 24.8 km/hr when arriving on the hump. The average speed reduction for the cars when passing through hump H10 was 35.7%.While for the hump H14, which its height is near to the standard, the average free flow speed of cars was 41.7 km/hr and reduced to 18.6 km/hr when arriving on hump, with average speed reduction of 55.0%.For the higher hump, H5, the average speed for cars during free flow before the hump was 42.5 km/hr and was then reduced to 18.9 km/hr when arrive on hump, with the average speed reduction of 54.8%.
From this finding, the average speed on humps was around 20 km/hr.According to study by Yaacob and Hamsa [3], the average speed of cars on 80 mm round-top hump located at residential area in Kuala Lumpur was 7.7 km/hr. The variation of average speed on hump is probably due to difference in studied location. The speed limit for the residential area studied is 30 km/hr while in the UTM campus the speed limit is 35 km/hr. The drivers have higher awareness to drive at a lower speed when they travel in a residential area. The obtained results clearly show that the drivers in UTM campus tend to pass road humps at a higher speed compared to residential area. This is because thedrivers in UTM used to pass a lot of road humps every day, consequently, they tend to not reduce much speed when passing road humps.
The average speed on hump for the lower height round-top hump H10 is the highest when compared to hump H5 and H14. This shows that the as-built height for hump H10 which is 55 mm is less effective to reduce speed of cars. In short, the findings indicates that the average speed of cars on the different shapes of humps show little variation. The average speeds of cars on the flat-top humps with pedestrian crossing have less influence by the heights of the humps. For the average speeds of cars on the round-top humps, the humps with the lower height compared to the standard dimension obviously enable the cars passing the hump with higher speed.

369
Statistical Analysis of Speed before and on HumpsT-tests were done to test whether the average speed on hump is significantly less than the average speed before the humps. Table 4 shows the result of the two samples t-tests.
Table 4: t-test result for average speeds before and on the a) flat-top and b) round-top humps
Hump Mean Speed (km/hr)
Standard deviation, s
Fcrit = 1.225
t-test (t-crit =1.647)
A B A B F-value Degree of Freedom, v
t-value
H7 (55mm) 43.9 20.5 6.663 4.001 2.773 612 58.504
H1 (98mm) 44.7 20.1 5.991 4.648 1.661 704 62.759
H13 (115mm) 44.2 20.4 7.159 4.488 2.545 628 54.488
(a)
Hump Mean Speed
(km/hr)
Standard
deviation, s
Fcrit =
1.225
t-test
(tcrit =1.647)
A B A B F-value Degree of
Freedom,
v
t-value
H10 (53mm) 38.7 24.8 4.994 5.667 1.292 736 35.728
H14 (98mm) 41.7 18.6 5.551 3.830 2.100 664 66.397
H5 (125mm) 42.5 18.9 6.059 4.013 2.280 649 62.787
(b)
From the statistical analysis, it can be concluded that there are significant differences in average speed before and on the humps for all the six humps studied. Thus, the provision of both flat-top humps and round-top road humps at those locations in UTM is considered effective. The drivers were forced to reduce their cars’ speed as to mitigate the level of uncomfortable when passing
through the road humps. Statistical Analysis of Speed Reduction for Humps with Different Heights. The significant differences of average speed reductions for humps with different heights were tested. Table 5 shows the results of the significance test for average speed reductions of humps with different heights.

370
Table 5: Summary of significance test results for average speed reductions of humps with different height
Flat-top Humps Round-top Humps Humps Significance
Difference Humps Significance
Difference Lower hump H7 (55 mm) vs near-to-standard hump H1 (98 mm)
Yes Lower hump H10 (53 mm) vs near-to-standard hump H14 (98 mm)
Yes
Higher hump H13 (115 mm) vs near-to-standard hump H1 (98 mm)
No Higher hump H5 (125 mm) vs near-to-standard hump H14 (98 mm)
No
Lower hump H7 (55 mm) vs higher hump H13 (115 mm)
No Lower hump H10 (53 mm) vs higher hump H5 (125 mm)
Yes
From the result, the lower flat-top hump showed significance in average speed reduction when compared to hump which height near to standard.Hump H1 is more effective in reducing speed of moving cars compared to hump H7 which with a hump height of only 55 mm.Meanwhile, there is no significant difference between the average speed reduction between the H13 (higher hump) and the hump H1 (near-to-standard), this showed that the hump with height 115 mm brings almost the same speed reducing effect as the hump H1 with height 98 mm. However, the result indicates that there is no significant difference between the average speed reductions for cars passing through a higher hump H13 and a lower hump H7. The surprisingly results is probably due the geographical condition of hump H13 and H7.
On the other hand, for the round-top humps, there is significant difference between the average speed reductions when cars passing through a lower hump H10 and a near-to-standard hump H14. The hump H10 which height is only 53 mm is significantly results in a less speed reduction effect when comparing to hump H14 which with a height of 98 mm.The average speed reduction effects by the installation of a higher hump H5 shows no significant difference with a standard hump H14. This means that the hump height for H5 which is 125 mm brings speed reducing effect almost same as the hump H14 with height 98 mm. From the t-test, shows that there is significant difference between the average speed reductions of moving cars when passing on higher hump H5 and lower hump H10. The lower hump H10 with height of 53 mm only is significant bring less speed reducing effect compared to a higher hump H5 which height is 125 mm. The higher hump H5 reduces the speed of cars with an average percentage of 54.8 % while the lower hump H10 only reduces the speed of cars with 35.7 %. The lower hump H10 is obviously less effective in reducing cars’ speed. Flat-top Hump with Pedestrian Crossing versus Round-top HumpIn this study, only the flat-top hump H1 and round-top humps H14 with dimensions nearest to standards are used to be compared.It was found that the average speed before the flat-top hump H1 and round-top hump H14 demonstrate a little variations, which were 44.7 km/hr and 41.7 km/hr respectively. When arriving on the humps, the car’s drivers reduced their speed of vehicles to speeds of 20.1 km/hr and 18.6
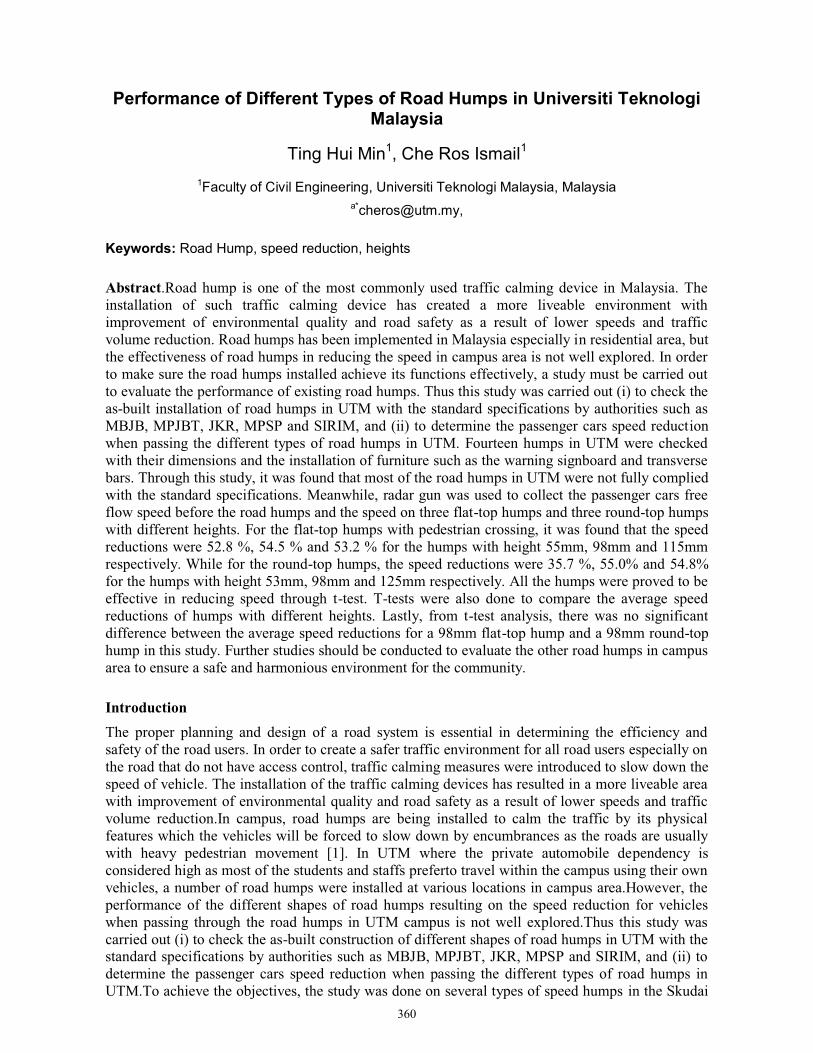
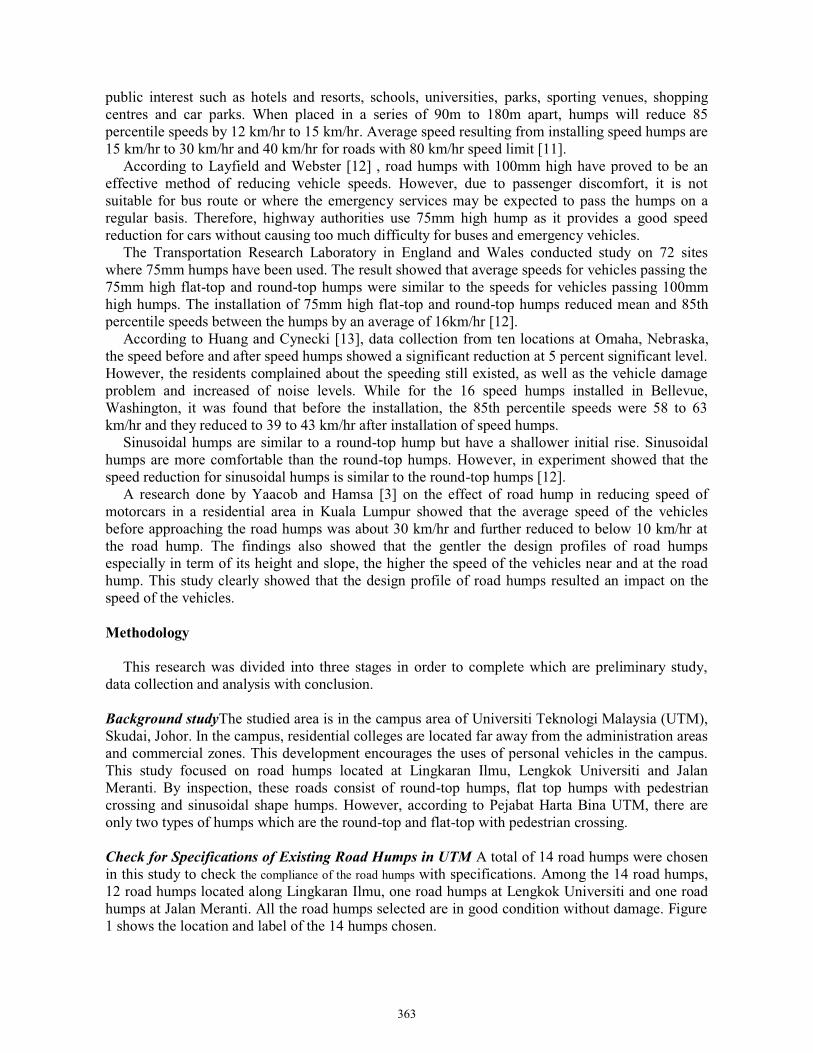
km/hr at flat-top hump and round-top hump respectively. Figure 5 shows the cumulative frequency versus spot speed data for hump H1 and hump H14.
371
(a) (b)
Figure 5: Cumulative frequency versus spot speed data for a) flat-top hump H1 and b)round-top hump H14
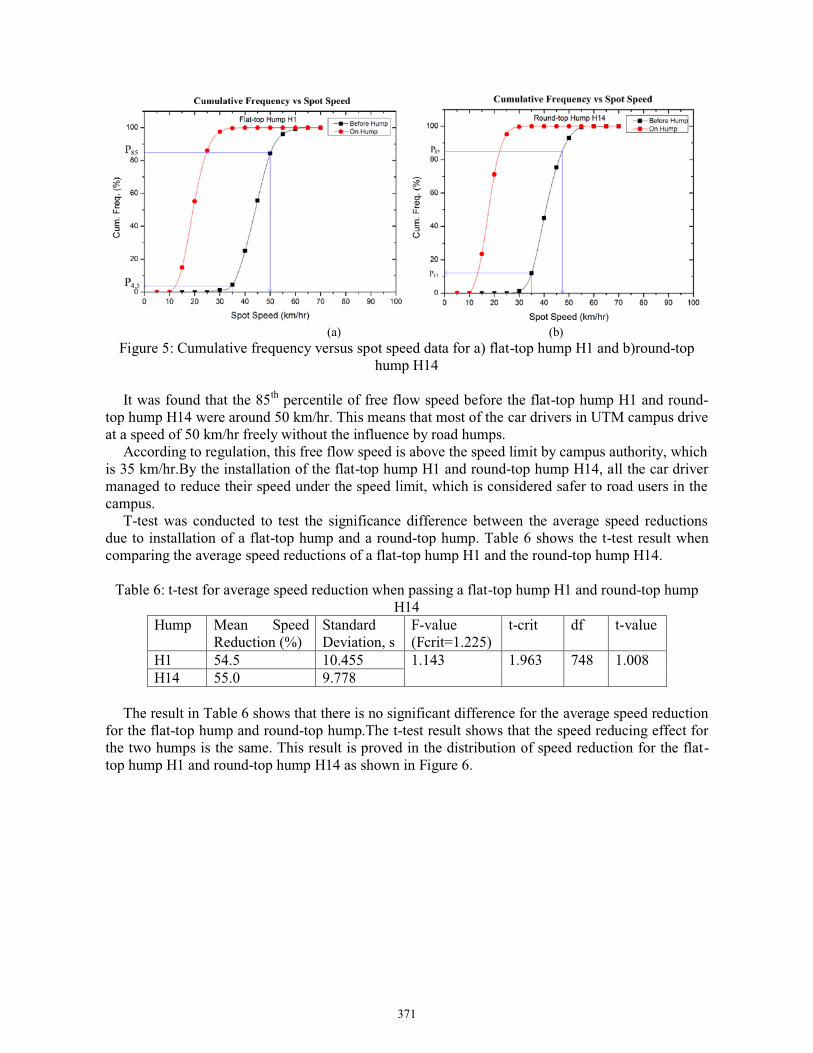
It was found that the 85th percentile of free flow speed before the flat-top hump H1 and round-top hump H14 were around 50 km/hr. This means that most of the car drivers in UTM campus drive at a speed of 50 km/hr freely without the influence by road humps. According to regulation, this free flow speed is above the speed limit by campus authority, which is 35 km/hr.By the installation of the flat-top hump H1 and round-top hump H14, all the car driver managed to reduce their speed under the speed limit, which is considered safer to road users in the campus. T-test was conducted to test the significance difference between the average speed reductions due to installation of a flat-top hump and a round-top hump. Table 6 shows the t-test result when comparing the average speed reductions of a flat-top hump H1 and the round-top hump H14.
Table 6: t-test for average speed reduction when passing a flat-top hump H1 and round-top hump H14
Hump Mean Speed Reduction (%)
Standard Deviation, s
F-value (Fcrit=1.225)
t-crit df t-value
H1 54.5 10.455 1.143 1.963 748 1.008 H14 55.0 9.778
The result in Table 6 shows that there is no significant difference for the average speed reduction for the flat-top hump and round-top hump.The t-test result shows that the speed reducing effect for the two humps is the same. This result is proved in the distribution of speed reduction for the flat-top hump H1 and round-top hump H14 as shown in Figure 6.

372
Figure 6: Distribution of speed reduction for flat-top hump and round-top hump
This result is probably due to the flat-top hump and round-top hump have the same height, which
is 98 mm. Regardless of the shapes of the road humps, the drivers in UTM tend to reduce their cars’
speed with average speed reduction of 55 %.Thus, the results obtained from this study illustrated that flat-top humps and round-top provide the same speed reduction effect, which functions as calming the moving cars for same extent. In brief, the selection of the types of humps to be constructed can be based on the pedestrian volume at that location. Conclusion A safe environment is very important for campus area where the pedestrian and traffic volume are high. Through this study, the as-built specifications of existing road humps were checked and it was found that most of the installation was not comply with the standard. The installation were inconsistent in term of their dimensions, and installation of the warning signboards and transverse bars. The speed reductions of humps with different shapes and heights were found through this study. For the flat-top humps with pedestrian crossing, it was found that the speed reductions were 52.8 %, 54.5 % and 53.2 % for the humps with height 55 mm, 98 mm and 115 mm respectively. For the round-top humps, the speed reductions were 35.7 %, 55.0% and 54.8% for the humps with height 53mm, 98mm and 125mm respectively. Besides, t-test conducted showed that there is no significant difference between the average speed reductions for a 98mm flat-top hump and a 98mm round-top hump in this study. There are some limitations for this study:
i. The measurement of the dimensions of road humps may inaccurate as manual
measurement was used.
ii. There are only one radar gun to be used to collect the spot speed data. This made the
data collection more difficult as the speeds at two points needed to be recorded. The
observer has to move the radar gun at a short time.
iii. The drivers may not drive at their normal travelling speed. At some hump location
there is no place or shelter for the observers to hide.

373
iv. In this study, the comparison of speed reduction only carried out on humps with
different heights, which exclude the width of the humps.
To improve the study on the performance of road humps in the future, there are some recommendations:
i. A better instrument such as the total station or GPS device can be used to measure the
dimensions of the road humps to collect a more accurate data.
ii. Use two radar guns to take the spot speed data at the point where cars travel at free
flow before the humps and at the point cars reach on the humps. This can avoid the
movement of radar gun and thus avoid the inconsistent data.
iii. The comparison of the specifications of road humps can be made with other standards
including the standard by foreign countries.
iv. Make comparisons on speed reduction between road humps with different widths and
heights.
v. The number of spot speed data collected can be increased to obtain a more
comprehensive result.
References
[1] Ibrahim, N. I., Arif, W. R., and Karim, M. R. Road humps as traffic calming
devices.Proceedings of Eatern Asia Society for Transportation Studies, Vol 4. October 2003. 1435-1441 pp.
[2] Metzger, S.A. (2008). The Application of Traffic Calming and Related Strategies in an Urban Environment. Master of Science of Civil Engineering. University of Massachusetts.
[3] Yaacob, N. A. and Hamsa, A. A. K. (2013). The Effect of Road Hump in Reducing Speed of Motorcars in a Residential Area in Kuala Lumpur. Journal of Design and Built Environment, 13, 1–13.
[4] Barbosa, H. M. (1995). Impacts of Traffic Calming Measures on Urban Roads. Doctor Philosophy. University of Leeds.
[5] Bunte, L. W. (2000). Traffic Calming Programs & Emergency Response: A Competition of Two Public Goods. Master of Public Affairs. University of Texas at Austin.
[6] Emslie, I. (1997). Design and Implementation of speed humps: Supplement to National Guidelines for Traffic Calming. Pretoria: Department of Transport.
[7] Federal Highway Administration (FHWA) Course on Bicycle and Pedestrian Transportation, (1990). Traffic Calming. 1-24 pp.

374
[8] Manan, M. M. A. & Poi, W. H. (2010). Traffic Calming Scheme around the Vicinity of Schools: A Survey in the Klang Valley, Malaysia, MER 11/2009, Kuala Lumpur, Malaysia: Malaysia Institute of Road Safety Research.
[9] Majlis Perbandaran Seberang Perai (2015). Garis Panduan Pembinaan Bonggol Jalan (Hump). Retrieved on November 2015 from http://www.mpsp.gov.my/brgonline/garispanduan/kej/bonggol.pdf