tinbergen lecture 1: sectoral trade want a distribution function for which we can compute certain...
TRANSCRIPT

Tinbergen Lecture 1: Sectoral Trade
Elhanan Helpman
June 2013
() Tinbergen Lecture 1: Sectoral Trade June 2013 1 / 27

Introduction
Traditional approaches emphasize intersectoral trade flows.
Ricardo (1817): variation across countries in relative productivity.
Heckscher (1919): variation across countries in relative factor endowments.
Ohlin (1924, 1933): integrated Heckscher’s insights into a Walrasianequilibrium system.
Lancaster (1980), Helpman (1981), Krugman (1981): add productdifferentiation and monopolistic competition to Heckscher-Ohlin.
() Tinbergen Lecture 1: Sectoral Trade June 2013 2 / 27

Eaton and Kortum (2002): Motivation
Empirical work based on Ricardo was very sparse; there was no good way tolink the theory to data.
E-K changed this, by modifying the Dornboush-Fischer-Samuelson framework.
They use a probabilistic formulation of productivity differences (heterogeneityis summarized by the parameters of the distribution).
They show how the model links bilateral trade flows to geography and prices.
They estimate the parameters using trade in manufactures among 19 OECDcountries.
They perform counterfactual exercises.
() Tinbergen Lecture 1: Sectoral Trade June 2013 3 / 27

The Model: Environment
There is a continuum of goods j ∈ [0, 1] .Let Zi (j) denote the amount of good j that a bundle of inputs can producein country i .
ci/Zi (j) is then the cost of producing a unit of good j in country i , where ciis the cost of a bundle of inputs.
Melting iceberg costs: dni > 1 units have to be shipped from country i to nfor one unit to arrive. Normalize dii = 1. Assume dni ≤ dnkdki .The c.i.f. cost of obtaining good j from country i in country n is then:
Pni (j) =cidniZi (j)
.
Perfect competition implies Pn(j) = miniPni (j). Here’s where the“triangle inequality” is needed.
CES preferences: U =[∫ 10 Q(j)
(σ−1)/σdj]σ/(σ−1)
.
() Tinbergen Lecture 1: Sectoral Trade June 2013 4 / 27

Technology
Key tractability assumption: the Zi (j)’s are realizations of random variables.
We want a distribution function for which we can compute certain orderstatistics (in particular distribution of min).
So assume that for each good j the distribution for country i’s productivity isFréchet:
Pr[Zi (j) ≤ z ] = Fi (z) = e−Ti z−θ.
Distributions are independent across goods and countries.
Ti > 0 governs technology (TFP) in i , θ > 1 determines dispersion ofproductivity.
Higher θ → less dispersion.
Ricardian interpretation: the Ti’s determine countries’absolute advantagewhile θ governs the force of comparative advantage.
() Tinbergen Lecture 1: Sectoral Trade June 2013 5 / 27

Prices
Country i presents country n with a distribution of pricesPr[Pni (j) ≤ p] = Gni (p) = 1− e−[Ti (cidni )
−θ ]pθ.
The price distribution for goods purchased in n is then:
Pr[Pn(j) ≤ p] = Gn(p) = 1−N
∏i=1[1− Gni (p)] = 1− e−Φnpθ
.
(the price of j in n will be lower than p unless each source’s price is greaterthan p).
The “price”parameter is Φn = ∑Ni=1 Ti (cidni )−θ.
Prices will tend to be lower the higher are the Ti’s and the lower are the ci’sand dni .
Notice that if dni = 1, then Φn is the same everywhere.For dni > 1, more “remote” countries have higher prices.
() Tinbergen Lecture 1: Sectoral Trade June 2013 6 / 27

Empirics
They show that:XniXn
=Ti (cidni )
−θ
Φn, (1)
where the X’s denote expenditure.
The model implies
Xni/XnXii/Xi
=ΦiΦnd−θni =
(PidniPn
)−θ
.
The LHS can be constructed using trade data and gross output data from asample of 19 OECD countries.
Next, they use data on retail prices to constructs measures of the priceindices as well as an alternative measure of dni (second largest observed pricedifference).
They estimate a value θ = 8.28.
() Tinbergen Lecture 1: Sectoral Trade June 2013 7 / 27

.
Before moving to the counterfactuals, it is necessary to close the model andsolve for factor prices.
To make the model more realistic than the stripped down Ricardian version,E-K stipulate a Cobb-Douglas production function in labor and intermediates,so ci = w
βi P
1−βi , with wi being the wage in country i .
They apply the model only to the manufacturing sector
They consider two polar cases:1 Labor is perfectly mobile across sectors.2 Labor is immobile.
See Alvarez and Lucas (2008) for an alternative way of closing the model.
() Tinbergen Lecture 1: Sectoral Trade June 2013 8 / 27

Counterfactuals 1
Let dni → ∞, i.e., autarky.
() Tinbergen Lecture 1: Sectoral Trade June 2013 9 / 27

Counterfactuals 2
Let dni → 1, i.e., no trade frictions.
() Tinbergen Lecture 1: Sectoral Trade June 2013 10 / 27

Counterfactuals 3
They extend the model to account for tariff revenues and discuss theelimination of tariffs. The initial tariff levels are calibrated to 5%.
A multilateral tariff reduction raises welfare from a high 1.31% in Belgium toa low 0.21% in Japan.
A U.S. unilateral tariff reduction benefits all other 18 countries, but the U.S.loses, around 0.005% (very small). Canada gains the most, 1.1%.
() Tinbergen Lecture 1: Sectoral Trade June 2013 11 / 27

Factor Proportions
Variation in factor endowments can drive trade (capital equipment, skilledlabor, unskilled labor, arable land, etc.).
In the simple Samuelson version of the Heckscher-Ohlin theory (2 sectors, 2factors, 2 countries), each country exports the product that is intensive in theinput with which the country is relatively well endowed. Requires:
1 Constant returns to scale technologies.2 Identical homothetic preferences.3 No factor intensity reversal or integrated equilibrium.
Multi-sector, multi-factor, multi-country generalizations do not yield sharppredictions on sectoral trade flows.
Switch to factor content predictions (Vanek equations), which are robust.
A country exports on net factor content of each input that it owns in excessof its prorata share.
() Tinbergen Lecture 1: Sectoral Trade June 2013 12 / 27

Trade-Endowment Relationship
Suppose that there are many sectors, many factors and many countries. Andsuppose that there is factor price equalization.
Then full employment of resources implies
AX k = V k for all k. (2)
And since preferences are homothetic and identical across countries
C k = sk X for all k, (3)
where X = ∑k X k and sk is the share of country k in consumption (whentrade is balanced the share sk equals country k’s share in world income).
Equations (2) and (3) provide two fundamental relationships that have beenused to formulate empirical specifications.
() Tinbergen Lecture 1: Sectoral Trade June 2013 13 / 27

Trade-Endowment Relationship (continued)
Suppose that inputs and outputs are aggregated into an equal number ofcategories. In this event the matrix A is square and can be inverted(whenever it is not singular).
It then follows from (2) that output is given by X k = A−1V k . Net exportsequal the difference between output and consumption: T k = X k − C k .Therefore using (3) and X k = A−1V k , we obtain(
1skT k)= A−1
(1skV k)− X for all k. (4)
This is a linear set of relationships between net exports, normalized by relativeexpenditure, and factor endowments, also normalized by relative expenditure.
Leamer (1984) estimates this linear relationship, obtaining Rybczynskicoeffi cients.
However, in many cases (e.g., more sectors than inputs) the matrix A is notinvertible.
() Tinbergen Lecture 1: Sectoral Trade June 2013 14 / 27

Factor Content
Suppose that instead of predicting the pattern of commodity trade, weattempted to predict the net factor content of trade.
Net exports of factor j in country k are given by
F kj = ∑i aji (w)Tki ,
orF k = AT k , where T k = X k − C k .
With homothetic preferences C k = sk ∑l X l and factor market clearingrequires AX k = V k .
() Tinbergen Lecture 1: Sectoral Trade June 2013 15 / 27

Vanek Equations
Therefore:
F k = AT k = A(X k − C k
)= V k − skV , where V = ∑
lV l .
It follows that F kj > 0 if and only if Vkj > s
kVj .
Furthermore, suppose that we rank factors such that
V k1V1
>V k2V2
> ... >V klVl
> sk >V kl+1Vl+1
> ... >V kmVm
.
Then we must have F kj > 0 for all factors j ≤ l and F kj < 0 for all factorsj > l .
() Tinbergen Lecture 1: Sectoral Trade June 2013 16 / 27

First Test of HOV: Bowen, Leamer and Sveikauskas (1987)
Bowen et al. (1987) conducted the first test of the Vanek equations, whichthey rewrote as:
F kjskVj
=V kjskVj
− 1 for all j and k.
They used data on 12 factors and 27 countries in 1967.
They performed two types of tests:
Sign tests: for what fraction of the observations is
sign
(F kjskVj
)= sign
(V kjskVj
− 1)
?
Rank tests: for what fraction of the observations is
sign
(F kjskVj
−F kj ′
skVj ′
)= sign
(V kjskVj
−V kj ′
skVj ′
)?
() Tinbergen Lecture 1: Sectoral Trade June 2013 17 / 27

Bowen, Leamer and Sveikauskas (continued)
The table below shows these tests by factors:
() Tinbergen Lecture 1: Sectoral Trade June 2013 18 / 27

Bowen, Leamer and Sveikauskas (continued)
The table below shows these tests by country:
() Tinbergen Lecture 1: Sectoral Trade June 2013 19 / 27

The Case of Missing Trade: Trefler (1995)
Trefler (1995) studies systematic deviations of the data from the theoreticalpredictions of the Vanek equations.
The Vanek equations imply:
F kj = Vkj − skVj .
For 33 countries (accounting for about 80% of world income) and 9 inputs in1983, he constructs the following measures of deviation from the Vanekequations:
εkj = Fkj −
(V kj − skVj
).
The main findings are that:
1 εkj is approximately equal to −(V kj − skVj
), which implies that the factor
content measures are biased toward zero, F kj ≈ 0 (“Missing Trade”).2 In poor countries there is a predominance of εkj < 0 while in rich countries
there is a predominance of εkj > 0.3 The above imply that poor countries tend to be abundant in most factors whilerich countries tend to be scarce in most factors (“Endowments Paradox”).
() Tinbergen Lecture 1: Sectoral Trade June 2013 20 / 27

Trefler (1995) (continued)
The missing trade is illustrated in the following figure:
() Tinbergen Lecture 1: Sectoral Trade June 2013 21 / 27

Trefler (1995) (continued)
These features may result from productivity differences, which he examinesnext.
First, consider Hicks neutral technological differences; πkj = δk for all j , k .Then
F kj = δkV kj − sk(∑k ′ δ
k ′V k′
j
). (5)
This can help because it increases the effective supply of factors in richcountries.
The estimated δs are positive and they are highly correlated with income percapita (90%).
Trefler also allows a set of poor countries to have a common factor-biaseffi ciency parameter φj on top of their individual Hicks-neutral terms.
Using a model-selection criterion he concludes that the Hicks-neutralspecification performs better.
() Tinbergen Lecture 1: Sectoral Trade June 2013 22 / 27

Trefler (1995) (continued)
The resulting estimates are:
() Tinbergen Lecture 1: Sectoral Trade June 2013 23 / 27

Further Corrections
Using a common technology matrix to calculate F k when in fact differencesin factor prices imply different As across countries, biases F k toward zero(see Helpman 1999).
Davis and Weinstein (2001) correct for intermediate inputs, nontraded goodsand Hicks-neutral technology differences.
They also allow for differences in factor composition that lead to a failure ofFPE. Using input-output tables of 10 OECD countries they estimate
log akji = αk + βji + γj
(K k/Lk
)+ εkji ,
and confirm that γK > 0 and γL < 0 (αk = − log δk , from the Hicks-neutral
technology differences).
They construct the factor content of trade with the estimated inputrequirements.
() Tinbergen Lecture 1: Sectoral Trade June 2013 24 / 27

Davis and Weinstein (2001)
The plot of predicted versus actual factor content measures now looks asfollows (their Figure 7):
() Tinbergen Lecture 1: Sectoral Trade June 2013 25 / 27

Trefler and Zhu (2010)
They carefully develop a calculation of factor content that accounts for eachcountry’s use of intermediate inputs from all over the world. Under thesecircumstances the matrix A in calculating F k = AT k is a construct thataccounts for these intermediate products.In constructing the matrix of intermediate inputs they follow the OECD inassuming that an industry in country k uses an imported intermediate inproportion to its use of the intermediate input, i.e., the fraction of animported intermediate is the same in all sectors.
() Tinbergen Lecture 1: Sectoral Trade June 2013 26 / 27

Trefler and Zhu (2010) (continued)
() Tinbergen Lecture 1: Sectoral Trade June 2013 27 / 27

Tinbergen Lecture 2: Monopolistic Competition
Elhanan Helpman
June 2013
() Tinbergen Lecture 2: Monopolistic Competition June 2013 1 / 28

Motivation
Large shares of intra-industry trade:
Table: Shares of intra-industry trade (in percent); 1996-2000 averageFrance 77.5Germany 72.0Spain 71.2Netherlands 68.9United States 68.5Sweden 66.6Japan 47.6Norway 37.1Australia 29.8
Source: Organization for Economic Cooperation and Development (2002, TableVI.1).
() Tinbergen Lecture 2: Monopolistic Competition June 2013 2 / 28

Motivation
Large volumes of trade across similar countries:
Table: Regional structure of exports of manufactures; 2005.
Origin\Destination North America Europe Japan World
North America 824 238 88 1478Europe 398 3201 77 4372Japan 152 94 0 595World 2093 4398 515 10159
Source: World Trade Organization (2006, Table III.3 and Table III.70), in billionsof U.S. dollars.
() Tinbergen Lecture 2: Monopolistic Competition June 2013 3 / 28

Product Differentiation
Where does the downward sloping demand come from?
Several approaches, all building on Chamberlin (1933). The most popular isthe “love-of-variety”approach of Dixit and Stiglitz (1977) (see also Spence,1976; and Lancaster, 1979).
In the constant elasticity of substitution (CES) case with a continuum ofvarieties:
ui =[∫ ni0xi (ω)
αi dω
]1/αi
, 0 < αi < 1. (1)
() Tinbergen Lecture 2: Monopolistic Competition June 2013 4 / 28

Product Differentiation (continued)
The elasticity of substitution across varieties is constant and given byσi = 1/ (1− αi ).
as αi → 1, σi → ∞ and varieties become perfect substitutes [ui linear inxi (ω)];as αi → 0, σi → 1 and we get the Cobb-Douglas case;αi < 0 is ruled out for reasons that will become clear.
Notice the “love-of-variety” feature. Under perfect symmetry, xi (ω) = xi forall ω, and we have
ui = n1/αii xi = n
(1−αi )/αii · (ni xi )︸ ︷︷ ︸
“real” spending
.
This approach has also been used to represent production; producers mayprefer a larger variety of inputs (e.g., more specialized inputs) because theyyield higher productivity.How do you solve this demand system? Use two-stage budgeting:
1 choose xi (ω)s to maximize ui subject to∫ ni0 pi (ω) xi (ω) dω ≤ Ei ;
2 choose Ei to maximize U (·) subject to ∑Ii=1 Ei ≤ E .() Tinbergen Lecture 2: Monopolistic Competition June 2013 5 / 28

An Example
Consumers have identical CES preferences as in (1) over varieties of a singlegood.
Technology:
there is a constant marginal cost of production equal to 1/ϕ units of theunique factor of production, labor;there is a fixed cost of production f in terms of labor.
Market structure in the single sector is characterized by monopolisticcompetition with a continuum of firms of endogenous measure n.
Solving the utility maximization problem yields demand for each variety:
x (ω) =EP
(p (ω)P
)−σ
, (2)
where
P =[∫ n0p (ω)1−σ dω
]1/(1−σ)
(3)
is the ideal price index (minimum cost of obtaining one unit of utility).
() Tinbergen Lecture 2: Monopolistic Competition June 2013 6 / 28

Closed Economy
Each firm maximizes profits π (ω) = p (ω) x (ω)− (1/ϕ)wx (ω)− wfsubject to (2).Because firms take E and P as given (continuum assumption), we get thestandard constant-markup pricing formula of a monopolist facing a constantprice elasticity of demand:
p (ω) =σ
σ− 1wϕ.
Now we can write the free-entry (or zero-profit) condition as1σp (ω) x (ω) = wf , or simply:
x (ω) = (σ− 1) f ϕ. (4)
Labor market clearing implies, however, that (f + x/ϕ) n = L, yielding:
n =L
σf.
Scale Effects: Note that the resulting welfare is n1/α (x/L), which isproportional to L1/(σ−1), i.e., larger economies produce more varieties andachieve higher welfare.
() Tinbergen Lecture 2: Monopolistic Competition June 2013 7 / 28
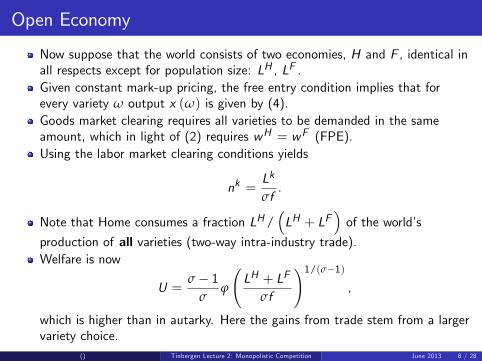
Open Economy
Now suppose that the world consists of two economies, H and F , identical inall respects except for population size: LH , LF .Given constant mark-up pricing, the free entry condition implies that forevery variety ω output x (ω) is given by (4).Goods market clearing requires all varieties to be demanded in the sameamount, which in light of (2) requires wH = wF (FPE).Using the labor market clearing conditions yields
nk =Lk
σf.
Note that Home consumes a fraction LH/(LH + LF
)of the world’s
production of all varieties (two-way intra-industry trade).Welfare is now
U =σ− 1
σϕ
(LH + LF
σf
)1/(σ−1)
,
which is higher than in autarky. Here the gains from trade stem from a largervariety choice.
() Tinbergen Lecture 2: Monopolistic Competition June 2013 8 / 28

General Model: Integrated Equilibrium
Helpman and Krugman (1985) show how to embody IRS, monopolisticcompetition, and product differentiation in a standard multi-sector,multi-factor model.Consider first the equilibrium conditions for the integrated equilibrium:
Free-entry into the industry drives the price down to average cost:
pi = ci (w , xi ) ≡Ci (w , xi )
xifor all i (5)
where
xi =Xini
for all i . (6)
Optimal pricing by the monopolist yields
MRi (p, n) = Cix (w , xi ) ≡ MC (w , xi ) for all i . (7)
Factor-market clearing requires:
∑i∈I aji (w , xi ) · Xi = Vj for all j . (8)
Goods market clearing requires:
αi (p, n) =pi Xi
∑i ′∈I (pi ′ Xi ′ )for all i . (9)
() Tinbergen Lecture 2: Monopolistic Competition June 2013 9 / 28

Predictions
Assume a 2x2x2 world; one sector manufactures homogeneous goods underperfect competition, the other a differentiated product under monopolisticcompetition.
Then
The volume of trade is larger the more similar countries are in relative size; orholding relative size constant, the more they differ in factor composition (seeDebaere (2005) for evidence).The share of intra-industry trade is larger the more similar countries are infactor composition, holding constant relative country size (see Cieslik (2005)for evidence).
() Tinbergen Lecture 2: Monopolistic Competition June 2013 10 / 28

Transport Costs
Let us go back to the 1× 1× 2 model of Krugman (1980), but assume nowthat there are iceberg transport costs of exporting.Profits of a firm at Home are now
πH (ω) =[pH ,H (ω)− (1/ϕ)w
]xH ,H (ω)
+[pH ,F (ω)− τ (1/ϕ)w
]xH ,F (ω)− wH f .
Because the elasticity of demand is unaffected by trade barriers, bothdomestic and export prices have a constant markup σ/ (σ− 1) over marginalcost (with the marginal cost being τ times higher for exporting).But then we can write the free-entry condition as
1σpH ,H (ω) xH ,H (ω) +
τ
σpH ,H (ω) xH ,F (ω) = wH f ,
or simplyxH ,H + τxH ,F = (σ− 1) f ϕ. (10)
Labor market clearing requires
nH(f + xH ,H/ϕ+ τxH ,F /ϕ
)= LH .
() Tinbergen Lecture 2: Monopolistic Competition June 2013 11 / 28

Wage Effect
Using (10), and a similar analysis for country F , implies
nk = Lk/σf for k = H,F . (11)
This is what we had before. The equilibrium is however distinct in animportant way: we no longer have FPE.
The trade balance condition nH τpH ,H xH ,F = nF τpF ,F xF ,H together with(2) and (11) imply
wσ =ρ+ λw1−σ
1+ ρλw1−σ,
where ρ ≡ τ1−σ < 1, λ ≡ LH/LF and w ≡ wH/wF .But for λ > 1, this implies w > 1 (the RHS is rising in λ and declining inw). The larger country has the higher wage (more attractive location to setup shop =⇒ higher labor demand).
() Tinbergen Lecture 2: Monopolistic Competition June 2013 12 / 28

Home Market Effect
In the example above, transport costs generated wage differences acrosscountries, but no “home market effect”:
country k’s share of world varieties = country k’s share of world population.
Now consider a variant of the model in which there is a second sectorproducing a numeraire homogenous good one-to-one with labor.
suppose the good is produced everywhere so we have w k = 1 for k = H ,F .
Working with the demand function (2) and the price index (3), one can show(see HK, pp. 206-07) that
nH
nF=
0 if λ ≤ ρ
λ−ρ1−λρ if 1/ρ ≥ λ ≥ ρ
+∞ if λ ≥ 1/ρ
.
So nH/nF > λ if and only if λ > 1 (the larger market attracts adisproportionate share of the IRS sector).
In addition, ∂(
λ−ρ1−λρ
)/∂λ > 1.
See Davis and Weinstein (2003) and Hanson and Xiang (2004) for evidence.
() Tinbergen Lecture 2: Monopolistic Competition June 2013 13 / 28

Firm Heterogeneity: Motivation
The Helpman-Krugman model features “universal” exporting by firms in adifferentiated product industry: every brand is produced by a single firm injust one country, which exports its output everywhere else in the world.
This does not provide a good description of firm-level data. In the data:
only a small fraction of firms export;exporters sell most of their output domestically;exporters are bigger than non-exporters;exporters are more productive than nonexporters.
() Tinbergen Lecture 2: Monopolistic Competition June 2013 14 / 28

Exporters I
Table: Share of manufacturing firms that export, in percent
Country Year Exporting firms, in percent
U.S.A. 2002 18.0Norway 2003 39.2France 1986 17.4Japan 2000 20.0Chile 1999 20.9Colombia 1990 18.2
Source: WTO (2008, Table 5)
() Tinbergen Lecture 2: Monopolistic Competition June 2013 15 / 28

Exporters II
Table: Share of exports of manufactures, in percent
Country Year Top 1% of firms Top 10% of firms
U.S.A. 2002 81 96Belgium 2003 48 84France 2003 44 84Germany 2003 59 90Norway 2003 53 91U.K. 2003 42 80
Source: WTO (2008, Table 6)
() Tinbergen Lecture 2: Monopolistic Competition June 2013 16 / 28

Exporters III
() Tinbergen Lecture 2: Monopolistic Competition June 2013 17 / 28

Motivation
The previously reported data suggests that the most productive firmsself-select into export markets, but it could also reflect learning by exporting,except that the evidence supports the former (Clerides et al., 1998).
Micro-level studies have found evidence of substantial reallocation effectswithin an industry following trade liberalization.
1 Exposure to trade forces the least productive firms to exit (Bernard andJensen, 1999 for the U.S.; Aw, Chung and Roberts, 2000 for Taiwan; Clerideset al., 1998 for Colombia, Mexico and Morocco).
2 Trade liberalization leads to market share reallocation towards more productivefirms, thereby increasing average productivity (Pavcnik, 2002 for Chile;Bernard, Jensen and Schott 2006 for the U.S.; Trefler, 2004 for Canada).
These studies suggest that a successful theoretical framework should includetwo features:
1 Within sectoral heterogeneity in size and productivity.2 A feature that leads only more productive firms to export: This could be fixedor sunk costs of exporting as documented by Roberts and Tybout (1997) andBernard and Jensen (2004), and formalized by Melitz (2003).
() Tinbergen Lecture 2: Monopolistic Competition June 2013 18 / 28

Melitz (2003): Closed Economy
The demand side is CES:
Yields constant elasticity demand functions
q (ω) =RP
[p (ω)P
]−σ
, (12)
where R is total spending and P is the ideal price index.
On the supply side:
Monopolistic competition; every variety is produced by a single firm and thereis free entry into the industry.Constant marginal costs and a fixed overhead production cost in terms of thesingle input (labor), which we take as numeraire.The fixed cost is identical across all firms; denote it by f .
() Tinbergen Lecture 2: Monopolistic Competition June 2013 19 / 28

New Features
1 The marginal labor cost 1/ϕ varies across firms, i.e.,
TC (ϕ) = f +q (ϕ)
ϕ. (13)
Firms with higher ϕ are more productive. Higher productivity firms chargelower prices, produce more output, and obtain higher revenues r (ϕ) andhigher profits π (ϕ):
p (ϕ) =1
ρϕ; q (ϕ) = RPσ−1 (ρϕ)σ ;
r (ϕ) = p (ϕ) q (ϕ) = R (Pρϕ)σ−1 ; (14)
π (ϕ) =1σr (ϕ)− f . (15)
2 Prior to entry, firms face productivity uncertainty:a firm pays a fixed cost of entry fe in units of labor;a firm then draws its productivity ϕ from a known distribution G (ϕ) withdensity g (ϕ) = G ′ (ϕ);After observing ϕ, a producer decides whether to exit or produce.
3 Every firm faces a probability δ of death per unit time.() Tinbergen Lecture 2: Monopolistic Competition June 2013 20 / 28

Firm Behavior
Given stationarity, a firm with productivity ϕ earns profits π (ϕ) in everyperiod, until it is hit by a shock. The expected value of the firm is:
v (ϕ) = max0,1δ
π (ϕ)
. (16)
It is clear from (15) and (16) that there is a unique threshold productivity ϕ∗
such that v (ϕ) > 0 if and only if ϕ > ϕ∗.
π (ϕ)
ϕ σ−1
f
0
(ϕ *)σ−1
() Tinbergen Lecture 2: Monopolistic Competition June 2013 21 / 28

Industry Equilibrium
Free entry ensures that, in the industry equilibrium, the expected discountedvalue of profits for a potential entrant equal the fixed cost of entry, or∫ ∞
0v (ϕ) g (ϕ) dϕ = fe , (FE) (17)
where π is average industry profits.
Melitz shows that the equilibrium is unique.
() Tinbergen Lecture 2: Monopolistic Competition June 2013 22 / 28

Open Economy
There are two types of trade frictions:1 A standard iceberg cost τ.2 An initial fixed cost of fex units of labor to start exporting, which is incurredonce the firm has learned ϕ (alternatively, the cost fex could be fixed ratherthan sunk).
It is also assumed that the domestic economy can trade with n ≥ 1 othercountries and that all countries are of equal size, which implies that factorprice equalization will hold and the wage will equal 1 everywhere (this can berelaxed).
() Tinbergen Lecture 2: Monopolistic Competition June 2013 23 / 28

Firm Behavior Revisited
Firms charge constant markups in both domestic and foreign markets.Domestic and foreign revenues are:
rd (ϕ) = R (Pρϕ)σ−1 ,
rx (ϕ) = τ1−σRk (Pk ρϕ)σ−1 .
Factor price equalization implies the same RPσ−1 in all countries, therefore:
r (ϕ) =rd (ϕ) if the firm does not export(1+ nτ1−σ
)rd (ϕ) if the firm exports to all countries.
The corresponding profit levels are
πd (ϕ) =rd (ϕ)
σ− f , (18)
πx (ϕ) =rx (ϕ)
σ− fx , (19)
where fx is amortized per-period portion of the initial fixed cost (i.e., δfex ).
() Tinbergen Lecture 2: Monopolistic Competition June 2013 24 / 28

Firm Behavior Revisited (continued)
Defining per period profits as π (ϕ) = πd (ϕ) +max 0, nπx (ϕ), the valueof the firm is again
v (ϕ) = max0,1δ
π (ϕ)
.
But we now have two relevant thresholds:
ϕ∗d = inf ϕ : v (ϕ) > 0
andϕ∗x = inf ϕ : ϕ ≥ ϕ∗d and πx (ϕ) > 0 .
Because RPσ−1 is the same in all countries, ϕ∗ is also the same.
Firms with ϕ ≥ ϕ∗d remain in the market after learning their productivity,while those with ϕ ≥ ϕ∗x also export.
So long as ϕ∗x > ϕ∗d , the model is able to replicate the micro-level findings.This will hold true whenever τσ−1fx > f , as illustrated in the figure.
The free entry condition is as before; expected discounted profits equal entrycosts.
() Tinbergen Lecture 2: Monopolistic Competition June 2013 25 / 28

πd(ϕ)
ϕ σ−1
f
0
fx
(ϕx*)σ−1
πx(ϕ)
(ϕd*)σ−1
() Tinbergen Lecture 2: Monopolistic Competition June 2013 26 / 28

The Impact of Trade
Comparing the closed-economy and open-economy equilibria impliesϕ∗ < ϕ∗d .
=⇒ Productivity is higher in the open economy:
Firms with productivity between ϕ∗ and ϕ∗d exit.Market shares are reallocated to exporters.
Intuition:
The fall in profits of nonexporters is not explained by a fall in mark-ups drivenby increased foreign competition (see, however, Melitz and Ottaviano, 2007).The main channel operates through the domestic factor market.Trade raise profitability of the more productive firms → more entry →increased labor demand → higher real wages (w/P) → least productive firmscan no longer afford to produce.
Welfare: new source of gains from trade; increased average productivity.
Similar conclusions for trade liberalization: τ falls.
() Tinbergen Lecture 2: Monopolistic Competition June 2013 27 / 28

Evidence
() Tinbergen Lecture 2: Monopolistic Competition June 2013 28 / 28

Tinbergen Lecture 3: Firm Heterogeneity
Elhanan Helpman
June 2013
Elhanan Helpman () Tinbergen Lecture 3: Firm Heterogeneity June 2013 1 / 24

Arkolakis, Costinot and Rodríguez-Clare (2012)
Consider a one-sector economy, with labor as the only input.There are many countries, and products can be differentiated.Preferences are CES with an elasticity of substitution σ.Result: If (i) trade is balanced; (i) operating profits are a constant share ofrevenue; and (iii)
∂(Xij/Xjj
)∂τkj
=
ε for k = i0 for k 6= i , ε < 0,
then changes in variable trade costs of j with other countries, or among othercountries, impact j’s welfare via
W = λ1/εjj ,
where λjj is j’s share of spending on its own goods.Conditions (i)-(iii) hold in the Eaton-Kortum model, in Krugman’s model, aswell as in a version of Melitz’s model with Pareto distributed productivity.ACR argue that this proves that productivity adjustment is not relevant forgains from trade or trade liberalizations.Elhanan Helpman () Tinbergen Lecture 3: Firm Heterogeneity June 2013 2 / 24

Melitz and Redding (2013)
Although the ACR formula is correct, their conclusion is wrong.
To compare alternative models, they have to be calibrated to the sameparameters, so as to yield the same productivity, cost structure, and othereconomic variables.
In the static version of the Melitz model, welfare in the closed economy is:
W AHet =
(L
σfd
) 1σ−1 σ− 1
σϕAd ,
and free entry implies
fd
∫ ∞
ϕAd
( ϕ
ϕAd
)σ−1
− 1
dG (ϕ) = fe ,yielding a unique value of ϕAd .
Elhanan Helpman () Tinbergen Lecture 3: Firm Heterogeneity June 2013 3 / 24

Melitz and Redding (closed economies)
In the spacial case in which G (·) is a two-point distribution on 0, ϕd withprobabilities Gd and 1− Gd , only the firms that draw ϕd remain in theindustry and they are all alike (no ex-post heterogeneity).
This is the same as the Krugman model with fixed operating costs:
Fd = fd +fe
1− Gd.
The resulting welfare is:
W AHom =
(L
σFd
) 1σ−1 σ− 1
σϕd .
Elhanan Helpman () Tinbergen Lecture 3: Firm Heterogeneity June 2013 4 / 24

Result
Let1 Gd = G (ϕd );
2 ϕd =[∫ ∞
ϕAdϕσ−1 dG (ϕ)
1−G (ϕd )
] 1σ−1
(weighted average of firm productivities); and3 the remaining parameters fd , fe , L, σ are the same in both types ofeconomies.
ThenW AHom = W
AHet .
Under these circumstances wages, the price index, and the mass of firms, arealso the same in the two economies.
Elhanan Helpman () Tinbergen Lecture 3: Firm Heterogeneity June 2013 5 / 24

Melitz and Redding (open economies)
Welfare in the Melitz model with selection into exporting (i.e., ϕTx > ϕTd ) is:
WTHet =
(L
σfd
) 1σ−1 σ− 1
σϕTd ,
implying gains from trade (because ϕTd > ϕAd ).
But even if there is no selection into exporting (i.e., ϕTx = ϕTd and all firmsexport), there are gains from trade.
Main Result: When the distributions of productivity are as above and theparameters (fd , fe , fx , τ, L, σ) are the same in both economies, then
WTHet
W AHet
>WTHom
W AHom
as long as fx > 0 (is more general).
Corollary: To achieve the same welfare gains from trade requires lower tradecosts in the homogeneous firm model.
Elhanan Helpman () Tinbergen Lecture 3: Firm Heterogeneity June 2013 6 / 24

Further Results
λHet =1
1+ τ1−σΛ, λHom =
11+ τ1−σ
,
Λ =
∫ ∞ϕTx
ϕσ−1dG (ϕ)∫ ∞ϕTd
ϕσ−1dG (ϕ).
Result: Whenever the representative firm exports and there is selection intoexporting, λHet > λHom .
Result: Given the same trade costs fx , τ and selection into exporting, thehomogeneous firm model cannot be calibrated to yield λHet = λHom .
Elhanan Helpman () Tinbergen Lecture 3: Firm Heterogeneity June 2013 7 / 24

ACR (continued)
With multiple sectors and Cobb-Douglas sectoral expenditure shares ηs :
W = ΠSs=1
(λsjj/L
sj
)ηs/εs
.
Now the reallocation of labor across sectors impacts welfare. If, for example,one sector produces homogeneous goods and the other differentiatedproducts, a reallocation of labor from the former to the latter sector raiseswelfare.
Elhanan Helpman () Tinbergen Lecture 3: Firm Heterogeneity June 2013 8 / 24

Balistreri, Hillberry and Rutherford (2011)
They compare an Armington specification to a Melitz-type specification usingthe same average sectoral productivity levels in a computable generalequilibrium model.
In their data, manufacturing output is 26% of world gross output, only 17%of manufacturing output is traded to another region, and the simple averagebenchmark tariff on these flows is only 9.7%. They consider a cut inmanufacturing tariffs to half the initial level.
Elhanan Helpman () Tinbergen Lecture 3: Firm Heterogeneity June 2013 9 / 24

Balistreri, Hillberry and Rutherford Table
Elhanan Helpman () Tinbergen Lecture 3: Firm Heterogeneity June 2013 10 / 24

Extensions
The Melitz model has been extended in a number of ways and it has beenapplied to data analysis.
Bernard, Redding and Schott (2007) integrate factor proportions into theMelitz framework.
Bustos (2011) extends it to incorporate technology upgrading and providesevidence supporting its implications.
Manova (2013) extends it to account for the impact of financial developmenton comparative advantage.
Helpman, Melitz and Rubinstein (2008) extend it to a setting withasymmetric countries and develop an econometric approach for estimatingtrade flows. This methodology:
provides a generalization of the gravity equation;accounts for zero trade flows across some country pairs;separates the intensive from the extensive margin of trade;allows asymmetric responses to trade resistance measures.
Elhanan Helpman () Tinbergen Lecture 3: Firm Heterogeneity June 2013 11 / 24

Bernard, Redding and Schott (2007)
BRS consider a two-factor, two-sector, two-country world economy, along thelines of Helpman and Krugman (1985), but with firm heterogeneity. Theirmain results are:
Without barriers to trade, the model aggregates nicely into a standardHelpman-Krugman model with homogenous firms.When introducing costs of exporting, they find that trade liberalizationincreases the zero-profit productivity cutoff in all industries and all countries.The productivity effect is disproportionately large in comparative advantageindustries in every country.
New features:
Two sectors:U = (C1)
α1 (C2)α2 , α1 + α2 = 1,
Two factors:
TCi (ϕ) =[fi +
qi (ϕ)ϕ
](wS )
βi (wL)1−βi , i = 1, 2. (1)
Elhanan Helpman () Tinbergen Lecture 3: Firm Heterogeneity June 2013 12 / 24

Helpman, Melitz, and Rubinstein (2008)
HMR start from the observation that many countries do not trade with eachother: close to half of all country pairs do not export to each other and asmall fraction exports in one direction only.
Trade in both directions Trade in one direction only No trade
0%
10%
20%
30%
40%
50%
60%
70%
80%
90%
100%
1970
1972
1974
1976
1978
1980
1982
1984
1986
1988
1990
1992
1994
1996
Standard estimates of the gravity equation discard the zero trade flows; HMRargue that zeros contain useful information.
Elhanan Helpman () Tinbergen Lecture 3: Firm Heterogeneity June 2013 13 / 24

HMR: Theory
Let a = 1/ϕ be a measure of a bundle of inputs per unit output; the inverseof productivity. Then
πij (a) = (1− α)
(τij cjaαPi
)1−ε
Yi − cj fij .
represents profits of a type a firm in country j from selling in country i .The aij cutoff is defined by
aij =a | πij (a) = 0
,
so only firms with inverse productivity a < aij find it profitable to export fromj to i .Suppose that the distribution G (a) has the support
0 <1
ϕmax≡ aL ≤ a ≤ aH ≡
1ϕmin
.
If aij > aL, then some firms export from j to i .But if aij < aL, then no firm exports from j to i .
Elhanan Helpman () Tinbergen Lecture 3: Firm Heterogeneity June 2013 14 / 24

Gravity
Suppose there are Nj firms in j . Then total exports from j to i are
Mij =(cj τijαPi
)1−εYiNjVij , where Vij = max
aij∫aLa1−εdG (a) , 0
.
If we also impose Yj = ∑iMij , then
Mij =YiYj∑iYi×
(τijPi
)1−ε
Vij
∑h
(τhjPh
)1−ε
Vhj sh
. (2)
This is a gravity equation that generalizes the Anderson van Wincoop (2003)equation.
Note potential asymmetries: by allowing τij or Vij to be asymmetric(Vij 6= Vji ), one can get unbalanced bilateral trade and zero trade flows, whichare features of the data.
Elhanan Helpman () Tinbergen Lecture 3: Firm Heterogeneity June 2013 15 / 24

Estimation
Let the productivity distribution be a truncated Pareto with shape parameter
k, then G (a) =[ak − (aL)k
]/[(aH )
k − (aL)k].
With this distribution, Vij is proportional to
Wij ≡ max(
aijaL
)k−ε+1
− 1, 0.
Next, let τε−1ij = Dγ
ij e−uij , where uij ∼ N(0, σ2u) and Dij is the distance
between i and j (can be replaced with any other variable).Then taking logs, we can express (2) as follows:
mij = β0 + λj + χi − γdij + wij + uij (3)
for Mij > 0 , where lower case variables are logs of the capitalized ones, andχi and λi are (potentially asymmetric) importer and exporter fixed effects.Traditional estimates neglect the term wij , which is unobservable. Thiscreates omitted-variable bias, which typically leads to an overestimate of γ,as well as a sample selection bias, because, although E
[uij]= 0, we have
E[uij | Mij > 0
]6= 0.
Elhanan Helpman () Tinbergen Lecture 3: Firm Heterogeneity June 2013 16 / 24

Two-Stage Estimation
HMR develop a two-step Heckman-type estimation procedure.In the first stage, a Probit selection equation is derived from the model, usingthe observation that j exports to i only if aij > aL.
Fixed costs are specified as fij ≡ exp(
φEX ,j + φIM ,i + κφij − νij
), where
νij ∼ N(0, σ2ν), φIM ,i is a fixed trade barrier imposed by the importingcountry on all exporters, φEX ,j is a measure of fixed export costs commonacross all export destinations, and φij is an observed measure of anyadditional country-pair specific fixed trade costs.Using this specification together with (ε− 1) ln τij ≡ γdij − uij yields
zij = γ0 + ξj + ζ i − γdij − κφij + ηij , (4)
where zij > 0 (a latent variable) if and only if j exports to i ;ηij ≡ uij + νij ∼ N(0, σ2u + σ2ν) is i.i.d. (yet correlated with the error termuij in the gravity equation), ξj is an exporter fixed effect, and ζ i is animporter fixed effect.zij is the log of operating profits minus the log of the fixed cost.
Elhanan Helpman () Tinbergen Lecture 3: Firm Heterogeneity June 2013 17 / 24

Two-Stage Estimation (continued)
Although zij is unobserved, we observe the presence of trade flows. Thereforezij > 0 when j exports to i , and zij = 0 when it does not. Moreover, thevalue of zij affects the export volume through wij .
For the procedure to work, one needs a variable that enters the first stage(affects the fixed costs), but not the second stage. HMR argue that thecombination of costs of creating a business in i and j satisfies this condition.A religion type variable is shown to also work, and it allows estimation on alarger sample of countries.
The main results of the estimation are that:
standard gravity estimates overestimate the effect of distance on trade flows(γ falls by about 1/3) since they ascribe to the intensive margin an effect thatreally works through selection into exporting;the bias stemming from firm-level heterogeneity is more important than theHeckman selection bias;there are large differences in wij (a factor of 3) and the estimates helpexplaining bilateral trade imbalances.
Elhanan Helpman () Tinbergen Lecture 3: Firm Heterogeneity June 2013 18 / 24

Benchmark Estimates
(Probit)Variables NLS 50 Bins 100 BinsDistance 0.213** 1.167** 0.813** 0.847** 0.755** 0.789**
(0.016) (0.040) (0.049) (0.052) (0.070) (0.088)Land border 0.087 0.627** 0.871** 0.845** 0.892** 0.863**
(0.072) (0.165) (0.170) (0.166) (0.170) (0.170)Island 0.173* 0.553* 0.203 0.218 0.161 0.197
(0.078) (0.269) (0.290) (0.258) (0.259) (0.258)Landlock 0.053 0.432* 0.347* 0.362+ 0.352+ 0.353+
(0.050) (0.189) (0.175) (0.187) (0.187) (0.187)Legal 0.049** 0.535** 0.431** 0.434** 0.407** 0.418**
(0.019) (0.064) (0.065) (0.064) (0.065) (0.065)Language 0.101** 0.147+ 0.030 0.017 0.061 0.036
(0.021) (0.075) (0.087) (0.077) (0.079) (0.083)Colonial Ties 0.009 0.909** 0.847** 0.848** 0.853** 0.838**
(0.130) (0.158) (0.257) (0.148) (0.152) (0.153)Currency Union 0.216** 1.534** 1.077** 1.150** 1.045** 1.107**
(0.038) (0.334) (0.360) (0.333) (0.337) (0.346)FTA 0.343** 0.976** 0.124 0.241 0.141 0.065
(0.009) (0.247) (0.227) (0.197) (0.250) (0.348)Religion 0.141** 0.281* 0.120 0.139 0.073 0.100
(0.034) (0.120) (0.136) (0.120) (0.124) (0.128)Regulation Costs 0.108** 0.146
(0.036) (0.100)R. Costs (Days & Proc.) 0.061* 0.216+
(0.031) (0.124)0.840**(0.043)0.240* 0.882**(0.099) (0.209)
3.261**(0.540)0.712**(0.170)0.060**(0.017)
Observations 12,198 6,602 6,602 6,602 6,602 6,602RSquared 0.573 0.693 0.701 0.704 0.706
Notes:Exporter and Importer fixed effectsMarginal effects at sample means and pseudo Rsquared reported for ProbitRegulation costs are exlcuded variables in all second stage specificationsBootstrapped standard errors for NLS; Robust standard errors (clustering by country pair) elsewhere+ significant at 10%; * significant at 5%; ** significant at 1%
1986 Reduced Sample
Benchmark PolynomialIndicator Variables
m ij
T ij
R#! ijD
N (from w#! ijD)
z#! ijD
z#! ijD2
z#! ijD3
Elhanan Helpman () Tinbergen Lecture 3: Firm Heterogeneity June 2013 19 / 24

Decomposing the Bias
HeckmanVariables NLS SelectionDistance 1.176** 0.798** 0.769** 1.214**
(0.031) (0.039) (0.038) (0.031)Land border 0.458** 0.834** 0.855** 0.436**
(0.147) (0.132) (0.142) (0.149)Island 0.391** 0.169 0.164 0.425**
(0.121) (0.120) (0.118) (0.120)Landlock 0.561** 0.447** 0.433* 0.565**
(0.188) (0.172) (0.187) (0.187)Legal 0.486** 0.387** 0.381** 0.488**
(0.050) (0.048) (0.049) (0.050)Language 0.176** 0.023 0.023 0.223**
(0.061) (0.062) (0.060) (0.061)Colonial Ties 1.299** 1.001** 0.979** 1.311**
(0.120) (0.204) (0.119) (0.123)Currency Union 1.364** 1.023** 0.996** 1.391**
(0.255) (0.273) (0.260) (0.257)FTA 0.759** 0.380* 0.314+ 0.737**
(0.222) (0.182) (0.168) (0.235)Religion 0.102
(0.096)0.871**(0.028)0.372** 0.265**(0.069) (0.070)
0.892**(0.051)
Observations 11,146 11,146 11,146 11,146RSquared 0.709 0.716 0.710
Notes: is dependent variable throughoutExporter and Importer fixed effectsReligion is exlcuded variable in all second stage specificationsBootstrapped standard errors for NLS; Robust standard errors (clustering by country pair) elsewhere+ significant at 10%; * significant at 5%; ** significant at 1%
1986 Full SampleFirm
HeterogeneityBenchmark
m ij
R#! ijD
N (from w#! ijD)
z#! ijD
Elhanan Helpman () Tinbergen Lecture 3: Firm Heterogeneity June 2013 20 / 24

Multinational Corporations
Three types of FDI:
Horizontal: Exporting vs. replication of the production process in a foreignmarket.Vertical: Fragmentation of production in the presence of factor pricedifferences across countries.Complex: Assembly and components production can generate interdependencebetween horizontal and vertical FDI, as well as third market effects.
MNE decide on location and the extent of control: internalization versusoutsourcing.
We have a 2x2 matrix with domestic integration, domestic outsourcing,foreign integration (FDI) and foreign outsourcing. Example: Intel vs. Nike.
We will discuss organizational or contractual theories of the multinationalfirm.
We will stress the importance of within-industry heterogeneity.
Elhanan Helpman () Tinbergen Lecture 3: Firm Heterogeneity June 2013 21 / 24

U.S. Multinationals
Elhanan Helpman () Tinbergen Lecture 3: Firm Heterogeneity June 2013 22 / 24

Affi liates
Elhanan Helpman () Tinbergen Lecture 3: Firm Heterogeneity June 2013 23 / 24

Affi liate Sales
Elhanan Helpman () Tinbergen Lecture 3: Firm Heterogeneity June 2013 24 / 24

Tinbergen Lecture 4: Multinational Corporations
Elhanan Helpman
May 2013
Elhanan Helpman () Tinbergen Lecture 4: Multinational Corporations May 2013 1 / 24

Horizontal FDI: Proximity-Concentration Tradeoff
Markusen (1984), Brainard (1997).
Consider a sector that produces differentiated products, yielding the demandfunction:
xk (v) = Akp (v)−ε , k = H,F (1)
for variety v . Let the wage rate be wk = 1 (there are no other inputs).
There is an entry cost of fE units of labor, which measures firm-leveleconomies of scale.
There are also plant-level economies of scale: a fixed cost of fD units of laborto set up a plant.
There is a constant marginal cost of 1 for every plant in every country.
Exported goods subject to iceberg transport costs τ > 1.
Firms service their domestic market from a local plant, but they can chooseto service the foreign market through either export or FDI (local sales by anaffi liate):
Tradeoff between τ and fD (proximity vs. concentration).
Elhanan Helpman () Tinbergen Lecture 4: Multinational Corporations May 2013 2 / 24

Horizontal FDI (continued)
Constant price-elasticity =⇒ constant mark-up pricing:
pkD (v) = 1/α = pkI (v) < τ/α = pkX (v) .
DefiningBk = (1− α) αε−1Ak , i = H,F , (2)
an exporter from country k = H,F selling in country ` 6= k will obtain profitsequal to
πkD + πkX = Bk + τ1−εB` − fE − fD . (3)
A firm from k = H,F that engages in horizontal FDI in ` 6= k will obtainprofits equal to
πkD + πkI = Bk + B` − fE − 2fD . (4)
Therefore: πkX > πkI whenever(1− τ1−ε
)B` < fD . (5)
Exporting is more likely when τ or B` are low, or fD is high.
Elhanan Helpman () Tinbergen Lecture 4: Multinational Corporations May 2013 3 / 24

But the demand level B` is an endogenous variable, which requires to solvefor industry equilibrium (see Brainard, 1997).
If the two countries are of equal size, then B is the same in both.
In an equilibrium with exports only we get:
πD + πX = B + τ1−εB − fE − fD = 0,
and therefore:
B =fE + fD1+ τ1−ε
.
Equation (5) then implies:
τε−1 − 1 < 2fDfE.
This is the condition under which there is no FDI. When the inequality isreversed, all there are no exports, only subsidiary sales.
Elhanan Helpman () Tinbergen Lecture 4: Multinational Corporations May 2013 4 / 24

Empirical Implementation: Brainard
Brainard (1997) starts by proposing an econometric model in which the shareEX/ (IS + EX ) is regressed on:
industry measures of plant-specific and firm-specific economies of scale(non-production workers),industry and country-specific measures of trade costs, anda set of controls related to the importing country, such as GDP per capita orcorporate tax rates.
In light of the model, we expect a negative impact of freight and tariffs, but apositive impact of plant economies of scale.
Brainard’s data is from 1989 and she can exploit both the cross-industry andthe cross-country variation.
Her results lend support to the proximity-concentration tradeoff and she findslittle impact of factor endowments.
Elhanan Helpman () Tinbergen Lecture 4: Multinational Corporations May 2013 5 / 24

Export vs. FDI with Heterogenous Firms
Helpman, Melitz and Yeaple (2004) incorporate intraindustry heterogeneity ofthe Melitz (2003) type into a general equilibrium model with multinationalfirms.
Firms produce with a technology that features:1 A fixed cost of entry of fE units of labor.2 A fixed overhead cost of fD units of labor if the firm produces a positiveamount.
3 A fixed cost of exporting of fX units of labor per foreign market.4 A fixed cost of FDI of fI units of labor per foreign market.5 A marginal cost that varies across firms and is denoted by a. Firms faceex-ante uncertainty about their productivity; a is drawn after entry from adistribution G (a).
After observing this productivity level, the firm decides whether to exit themarket, or stay and produce. If it chooses to produce, it has to choose anorganizational form.
Goods that are exported are subjected to iceberg costs τij > 1.
Elhanan Helpman () Tinbergen Lecture 4: Multinational Corporations May 2013 6 / 24

Firm Behavior
We can express
operating profits from serving the domestic market in j as
πjD = a1−εB j − fD ,
from exporting to country i as
πijX =(
τija)1−ε
B i − fX ,
from servicing country i through FDI as
πijI = a1−εB i − fI .
Provided that fI >(τij)ε−1
fX > fD , the following sorting (consistent withevidence) emerges:
the least productive firms exit upon observing their productivity;firms with somewhat higher productivity serve only the domestic market;firms with still higher productivity export;the most productive firms engage in FDI.
Elhanan Helpman () Tinbergen Lecture 4: Multinational Corporations May 2013 7 / 24

HMY (2004): Sorting into Exporting and FDI
Profit levels are depicted in the figure for the case in which B i = B j .
0ε−1a
ε−1)( jDa ε−1)( ij
Xa ε−1)( ijIa
ijIπ
jDπ
ijXπ
If−
Xf−Df−
Elhanan Helpman () Tinbergen Lecture 4: Multinational Corporations May 2013 8 / 24

Productivity Differences
Elhanan Helpman () Tinbergen Lecture 4: Multinational Corporations May 2013 9 / 24

Aggregation
HMY show how to solve for industry equilibrium and general equilibrium.
Notice that in a given industry, the ratio of exports from country j to countryi relative to j’s FDI sales are
s ijXs ijI=
∫ aijXaijI
(τija
)1−εB jdG (a)∫ aijI
0 a1−εB jdG (a)=(
τij)1−ε
V(aijX
)V(aijI
) − 1 . (6)
where V (a) =∫ a0 y
1−εdG (y).
HMY discuss comparative statics that hold regardless of a particular choice ofa functional form for G (a). In particular, they show that s ijX /s ijI is increasingin fI and decreasing in fX and τ, which is a reformulation of theproximity-concentration hypothesis.
Elhanan Helpman () Tinbergen Lecture 4: Multinational Corporations May 2013 10 / 24

Pareto Distribution
When productivity is distributed Pareto
s ijXs ijI
=(
τij)1−ε
(aijXaijI
)k−(ε−1)− 1
==
(τij)1−ε
( f ijI − f ijXf ijX
1(τij)ε−1 − 1
) k−(ε−1)(ε−1)
− 1
.It is then straightforward to see that the ratio of exports to FDI sales is:
decreasing in transport costs,increasing in plant-level economies of scale f ijI ,decreasing in productivity dispersion, as parametrized by (the inverse of) k .
The third point is new. One should expect more FDI relative to exports inindustries with a more dispersed distribution of sales.
Elhanan Helpman () Tinbergen Lecture 4: Multinational Corporations May 2013 11 / 24

Empirical Implementation
HMY estimate a log-linearized version of eq. (6) for U.S. firms.
As in Brainard (1997), plant-level economies of scale are proxied by thenumber of nonproduction workers.
To construct a proxy for productivity dispersion, HMY note that k/ (ε− 1)can be recovered from a regression of the logarithm of an individual firm’srank within the distribution on the logarithm of its size.
This measure is computed for both U.S. and European firms using data fromthe U.S. Census of Manufactures and the Amadeus database.
In order to control for omitted industry characteristics, they include measuresof capital intensity and R&D intensity.
Elhanan Helpman () Tinbergen Lecture 4: Multinational Corporations May 2013 12 / 24

Results
Elhanan Helpman () Tinbergen Lecture 4: Multinational Corporations May 2013 13 / 24

Results (continued)
Elhanan Helpman () Tinbergen Lecture 4: Multinational Corporations May 2013 14 / 24

Vertical FDI: Skill Intensity
Antras and Yeaple (2013) estimate:
Elhanan Helpman () Tinbergen Lecture 4: Multinational Corporations May 2013 15 / 24

Contractual Approach to the Organization of Firms
So far we have discussed models in which the emergence of MNEs wasdetermined by some combination of:
lactational advantages (distance, factor prices);technological factors (firm vs. plant-level economies of scale).
These theories enhance our understanding of trade and FDI flows, but theyshare a common failure to account for internalization. Why is fragmentationoccurring within firm boundaries? Or across firm boundaries?
Grossman and Hart (1986) property-rights approach:
integration means acquisition of assets;when contracts are incomplete, the parties encounter contingencies that werenot foreseen in the initial contract, and the owner of the asset has the residualrights of control;the residual rights of control affect the outside options and therefore how thesurplus from the relationship is divided ex-post (ownership = power).
In the presence of relationship-specific investments, these considerations leadto a theory of the boundaries of the firm in which both the benefits and thecosts of integration are endogenous.
Elhanan Helpman () Tinbergen Lecture 4: Multinational Corporations May 2013 16 / 24

A Simple Property-Rights Model
The firm faces a demand function
y = Ap−1/(1−α), 0 < α < 1. (7)
Production of good y requires the development of two specializedintermediate inputs h and m. Output is
y =(hη
)η ( m1− η
)1−η
, 0 < η < 1, (8)
where a higher η is associated with a more intensive use of h (headquarters)in production.There are two agents engaged in production:
a final-good producer (denoted by F ) who supplies the input h and producesthe final good y ,an operator of a manufacturing plant (denoted by S) who supplies the input m.
F can produce h at a constant marginal cost ch ; S can produce m atMC = cm . In addition, production requires fixed cost f · g (ch , cm).Both inputs are tailored specifically to y and are useless to anybody else.
Elhanan Helpman () Tinbergen Lecture 4: Multinational Corporations May 2013 17 / 24

Contractual Structure
Before the investments h and m are made, the only contractibles are theallocation of residual rights of control (i.e., the ownership structure) and alump-sum transfer between the two parties.
Ex-post determination of the price of m results from generalized Nashbargaining.
Ex-ante, F faces a perfectly elastic supply of potential S agents, so that inequilibrium the initial transfer secures the participation of S in therelationship at minimum cost to F .
Key features:1 ex-post bargaining takes place both under outsourcing and under integration;2 the distribution of surplus is sensitive to the mode of organization, because theoutside option of F is higher under integration.
Outside options are as follows:
under outsourcing, a contractual breach gives 0 to both agents;under integration, F can fire S and seize the input m, but this reduces outputto a fraction δ < 1.
Elhanan Helpman () Tinbergen Lecture 4: Multinational Corporations May 2013 18 / 24

Formulation of the Problem
In light of equations (7) and (8), the potential revenue from the sale of y is
R (h,m) =(hη
)αη ( m1− η
)α(1−η)
. (9)
Given the specification of the ex-post bargaining, H obtains the shareβO = β of revenue under outsourcing and the shareβV = δα + β (1− δα) > βO under integration.The optimal ownership structure k∗ from the point of view of F is thesolution to
maxk∈V ,O
πk = R (hk ,mk )− ch · hk − cm ·mk − f · g (ch , cm)− U
s.t. hk = argmaxhβkR (h,mk )− ch · h
mk = argmaxm(1− βk )R (hk ,m)− cm ·m
(P1)
where U is the outside option of the supplier S .
Elhanan Helpman () Tinbergen Lecture 4: Multinational Corporations May 2013 19 / 24

A Useful Result
The solution to (P1) delivers the following result (see Antràs, 2003 fordetails):
PropositionThere exists a unique threshold η ∈ (0, 1) such that for all η > η, integrationdominates outsourcing (k∗ = V ), while for all η < η, outsourcing dominatesintegration (k∗ = O).
As in Grossman and Hart (1986), in a world of incomplete contracts, ex-anteeffi ciency dictates that residual rights should be controlled by the partyundertaking the relatively more important investment:
when production is intensive in m, outsourcing alleviates best theunderinvestment problem;when production is intensive in h, vertical integration does a better job.
Convenient feature: threshold η is independent of factor prices(Cobb-Douglas assumption important).
Elhanan Helpman () Tinbergen Lecture 4: Multinational Corporations May 2013 20 / 24

Another Look at the Result
Suppose that instead of choosing k ∈ V ,O, F could choose β ∈ (0, 1).
0 1
1
)(* ηβ
η
NVβS
Vββ
Mη Hη
Elhanan Helpman () Tinbergen Lecture 4: Multinational Corporations May 2013 21 / 24

An Open-Economy Formulation
Consider a two-country version of the model in which firms are allowed tolocate different parts of the production process in different countries.
Denote by L the set of possible lactational decisions (a mapping fromproduction processes to locations) and by ` ∈ L a particular one.Different locational choices entail different cost variables.
The optimal ownership structure k∗ and the optimal locational choice `∗ nowsolve the following program:
maxk∈V ,O,`∈L
π`k = R`(h`k ,m
`k
)− c`h · h`k − c`m ·m`k − f `k · g `
(c`h , c
`m
)− U`
s.t. h`k = argmaxh
β`kR(h,m`k
)− c`h · h
m`k = argmaxm
(1− β`k
)R(h`k ,m
)− c`m ·m
(P2)
Elhanan Helpman () Tinbergen Lecture 4: Multinational Corporations May 2013 22 / 24

Evidence 1
log
of (
Mif
/ M
)
log of (Capital / Employment)3 4 5 6
4.5
3
1.5
0
aud
bev
checlecom
dru
ele
fme foo
ima
ins
lum
och
oel
oma
pap
pla
pri
rub
sto
tex
tra
veh
Notes: The Yaxis corresponds to the logarithm of the share of intrafirm imports in total U.S. imports for 23 manufacturingindustries averaged over 4 years: 1987, 1989, 1992, 1994. The Xaxis measures the average log of that industry’s ratio ofcapital stock to total employment, using U.S. data. See Table A.1. for industry codes and Appendix A.4. for data sources.
y = 6.86 + 1.17 x(1.02) (0.24)
R2 = 0.54
Elhanan Helpman () Tinbergen Lecture 4: Multinational Corporations May 2013 23 / 24

Evidence 2
Notes: The Yaxis corresponds to the logarithm of the share of intrafirm imports in total U.S. imports for 28 exportingcountries in 1992. The Xaxis measures the log of the exporting country’s physical capital stock divided by its total number ofworkers. See Table A.2. for country codes and Appendix A.4. for details on data sources.
log
of (
Mif
/ M
)
log of CapitalLabor Ratio7.5 9 10.5 12
6
4
2
0
A RG
A US
B E LB RA
CA N
CHE
CHL
COL
DE U
E GY
E S P
FRA
GB R
HK G
IDN
IRL
IS R
ITA
JP N
ME X
MY S
NDL
OA N
P A N
P HL
S GP
S W E
V E N
y = 14.11 + 1.14 x(2.55) (0.29)
R2 = 0.46
Elhanan Helpman () Tinbergen Lecture 4: Multinational Corporations May 2013 24 / 24

Tinbergen Lecture 5: Multinational Corporations
Elhanan Helpman
June 2013
Elhanan Helpman () Tinbergen Lecture 5: Multinational Corporations June 2013 1 / 25

Global Sourcing: Antràs and Helpman (2004)
Environment and Preferences: Two countries, North and South, and aunique factor of production, labor. There is a representative consumer ineach country with quasi-linear preferences:
U = x0 +1µ
J
∑j=1
X µj , 0 < µ < 1,
where x0 is consumption of a homogeneous good, Xj is an index of aggregateconsumption in sector j , and µ is a parameter.
Aggregate consumption in sector j is a CES function
Xj =[∫
xj (i)αdi]1/α
, 0 < µ < α < 1.
This specification leads to the following inverse demand function for eachvariety i in sector j :
pj (i) = Xµ−αj xj (i)
α−1.
Elhanan Helpman () Tinbergen Lecture 5: Multinational Corporations June 2013 2 / 25

The Model
Technology: Producers of varieties face a perfectly elastic supply of labor.Let the wage in North be strictly higher than that in South (wN > wS ).
As in Melitz (2003), producers needs to incur sunk entry costs wN fE , afterwhich they learn their productivity θ ∼ G (θ).As in Antràs (2003), final-good production combines two specialized inputsaccording to:
xj (i) = θ
(hj (i)
ηj
)ηj(mj (i)1− ηj
)1−ηj
, 0 < ηj < 1.
h is controlled by a final-good producer (agent F ), m is controlled by anoperator of the production facility (agent S).Sectors vary in their intensity of headquarter services ηj . Furthermore, withinsectors, firms differ in productivity θ.Intermediates are produced using labor with a fixed coeffi cient.hj (i) is produced only in the North, which implies that the headquarters H arealways located in North.Productivity in the production of mj (i) is identical in both countries.
Elhanan Helpman () Tinbergen Lecture 5: Multinational Corporations June 2013 3 / 25

The Model (continued)
After observing θ, F decides whether to exit the market or start producing.In the latter case additional fixed costs of organizing production are incurred.
These additional fixed costs are a function of the structure of ownership andthe location of production.In particular, if an organizational form is k ∈ V ,O and ` ∈ N , S, thesefixed costs are wN f `k and satisfy
f SV > fSO > f
NV > f NO . (1)
Contracting is the same as before, but δN ≥ δS .The ex-post division of surplus is:
North South
Non-Integration βNO= β βSO= β
Integration βNV=(
δN)α+β
[1−
(δN)α]
βSV=(
δS)α+β
[1−
(δS)α]
Notice thatβNV ≥ βSV > βNO = βSO = β.
Elhanan Helpman () Tinbergen Lecture 5: Multinational Corporations June 2013 4 / 25

Equilibrium
After solving for investment levels (in the constraints), the general program in(P2) reduces to
maxβ`k∈βNV ,β
SV ,β
NO ,β
SO
π`k (θ,X , η) = X(µ−α)/(1−α)θα/(1−α)ψ`k (η)− wN f `k (2)
where
ψ`k (η) =1− α
[β`kη +
(1− β`k
)(1− η)
][1α
(wN
β`k
)η (w `
1−β`k
)1−η]α/(1−α)
.
By choosing k and `, F is effectively choosing a triplet(
β`k ,w`, f `k
). And:
π`k is decreasing in w` and f `k .
π`k is largest when β`k = β∗ (η), with β∗′ (η) > 0, β∗ (0) = 0 and β∗ (1) = 1(remember the figure of β∗). Intuitively, F wants to allocate relatively morepower to the party undertaking a relatively more important investment.
One can also solve for the industry equilibrium as in Melitz (2003) or HMY(2004).
Elhanan Helpman () Tinbergen Lecture 5: Multinational Corporations June 2013 5 / 25

Tradeoffs
The choice of an organizational form faces two types of tensions.Location decision: variable costs are lower in South, but fixed costs are higherthere, and productivity θ affects the profitability of offshoring.Integration decision: integration improves effi ciency of variable productionwhen η is high, but involves higher fixed costs. This decision thereforedepends on η, and also on θ.
To simplify the discussion, we focus on two types of sectors:
A Component-intensive sector (η < β∗−1(β) and
wN/wS <(f SO /f NO
)(1−α)/α(1−η)):
This implies ψ`O (η) > ψ`V (η) for ` = N , S , which together with (1), impliesthat any form of integration is dominated in equilibrium (see figure).
A Heaquarter-intensive sector with η > β∗−1 (
βNV
), and
(wN/wS
)1−η
“high enough.”This implies the ranking of slopes
ψSV (η) > ψSO (η) > ψNV (η) > ψNO (η). (3)
which together with (1) leads to sorting (see figure).
Elhanan Helpman () Tinbergen Lecture 5: Multinational Corporations June 2013 6 / 25

Component-Intensive Sector
0
NOfNw−
SOfNw−
SOπ
)1/( ααθ −)1/( ααθ −
M)1/()( ααθ −N
MO
NOπ
Elhanan Helpman () Tinbergen Lecture 5: Multinational Corporations June 2013 7 / 25

Headquarter-Intensive Sector
0
NON fw−
SVN fw−
SOπ
)1/( ααθ −
)1/( ααθ −H
)1/()( ααθ −NHO
NOπ
SON fw−
NVN fw−
)1/()( ααθ −NHV
)1/()( ααθ −SHO
NVπ
SVπ
Elhanan Helpman () Tinbergen Lecture 5: Multinational Corporations June 2013 8 / 25

Sorting Patterns
Elhanan Helpman () Tinbergen Lecture 5: Multinational Corporations June 2013 9 / 25

Relative Prevalence
Let G (θ) be Pareto with shape parameter z . The relative prevalence of thedifferent organizational forms can be characterized by fractions of firms thatchoose them, or market shares.
In the component-intensive sector foreign outsourcing is more prevalent:
the higher is wN/wS (or the lower is τ),the lower are z and η.
In the headquarter-intensive sector :
the share of intrafirm imports in total imports is higher in industries withhigher η, but also in industries with higher productivity dispersion (lower z)and higher transport costs (τ).a higher wN/wS (or lower τ) increases the prevalence of offshoring, but alsoincreases the prevalence of foreign outsourcing in total offshoring.
Elhanan Helpman () Tinbergen Lecture 5: Multinational Corporations June 2013 10 / 25

Empirical Tests and Other Applications
Yeaple (2006) uses BEA data to test some of these cross-industryimplications:
he finds that the share of intrafirm imports in total U.S. imports (a measure ofthe relative prevalence of FDI over outsourcing) is higher in industries withhigh R&D intensity and high productivity dispersion.
Using a very rich sample of Japanese manufacturing firms, Tomiura (2006)provides evidence in support of the above sorting pattern:
firms engaged in FDI are more productive (and also more capital-intensive)than firms engaged in foreign outsourcing.
Antràs and Helpman (2008) introduce partial contractibility of inputs:
Key message: improvements in the contractibility of inputs controlled by Fhave different effects than improvements in the contractibility of inputscontrolled by S .When H-contractibility rises, outsourcing becomes more attractive; conversely,when M -contractibility rises, integration becomes more attractive.
Elhanan Helpman () Tinbergen Lecture 5: Multinational Corporations June 2013 11 / 25

Empirical Tests (continued)
Using U.S. data on imports of 5,423 products from 210 countries, Nunn andTrefler (2008) examine the determinants of the share of intrafirm imports.
They find that intrafirm trade is larger:1 The larger the share of headquarter services, and the evidence is stronger thanthat found in Antràs (2003) and Yeaple (2006).
2 Intrafirm trade is largest where headquarter inputs are important andproductivity is high. In particular, interacting headquarter intensity withproductivity dispersion yields estimates that are larger for more headquarterintensive goods.
3 Internalization rises with improved contractibility of the supplier’s inputs.Using Nunn’s (2007) measure of the fraction of noncontractible inputs, theyinteract this measure with the headquarter intensity measure, and estimate alarger impact for headquarter intensive goods that have highnon-contractibility.
Elhanan Helpman () Tinbergen Lecture 5: Multinational Corporations June 2013 12 / 25

Nunn and Trefler (2013): Testing AH (2004)
Productivity dispersion raises the share of intrafirm trade in more headquarterintensive sectors:
Elhanan Helpman () Tinbergen Lecture 5: Multinational Corporations June 2013 13 / 25

Nunn and Trefler (2013): Testing AH (2008)
More contractible headquarter services reduce the share of intrafirm trade:
Elhanan Helpman () Tinbergen Lecture 5: Multinational Corporations June 2013 14 / 25

Labor Market Features
Most of this literature assumes frictionless labor markets.
Three prominent features of product and labor markets are:1 substantial differences in workforce composition across firms;2 variation in wages for workers with the same observed characteristics;3 unemployment rate varies across industries (see BLS).
In addition, macro studies find that:1 to explain unemployment in European economies, it is necessary to allow forinteractions between shocks and differences in labor market institutions;
2 changes over time in labor market institutions are important determinants ofthe evolution of unemployment in OECD countries.
Elhanan Helpman () Tinbergen Lecture 5: Multinational Corporations June 2013 15 / 25

Labor Market Rigidities
Country Diffi culty of Hiring Rigidity of Hours Diffi culty of RedundancyUnited States 0 0 0Uganda 0 0 0Rwanda 11 0 10United Kingdom 11 20 0Japan 11 7 30OECD 27 30 23Italy 33 40 40Mexico 33 20 70Russia 33 40 40Germany 33 53 40France 67 60 30Spain 78 40 30Morocco 89 40 50
Elhanan Helpman () Tinbergen Lecture 5: Multinational Corporations June 2013 16 / 25

Main Issues
We will focus on the following question: How do labor market frictionsimpact interdependence across countries?
In particular:
what are the impacts of one country’s labor market frictions on its tradepartners?how does the removal of trade impediments impact countries with differentlabor market frictions?and what is the impact of trade on inequality and unemployment?
An examination of the link between trade and inequality requires new thinkingin view of the fact that the traditional reliance on Stolper-Samuelson effectsfails to provide an adequate explanation of inequality trends around the globe.
For this reason, we will focus on what labor economists call ‘residualinequality.’That is, inequality among workers with similar characteristics,which by some measures accounts for 70% of wage variation across firms.
Elhanan Helpman () Tinbergen Lecture 5: Multinational Corporations June 2013 17 / 25

Helpman and Itskhoki (2010)
There are two countries, two sectors and one input; homogeneous labor.
There is search and matching in sectoral labor markets; wage bargaining;unemployment.Homogeneous sector: identical firms under CRS; competition in productmarket; serves as numeraire.Differentiated sector: brands of a differentiated product produced byheterogeneous firms; monopolistic competition in product market.Fixed and variable trade costs.
Preferences: quasi linear, CES in differentiated sector:
U = q0 +1ζQζ , Q =
[∫ω∈Ω
q(ω)βdω
] 1β
, ζ < β < 1,
Production: y0 = h0 in homogeneous sector, y = θh in differentiated sector(will change later).
Elhanan Helpman () Tinbergen Lecture 5: Multinational Corporations June 2013 18 / 25

Wages and Cost of Hiring in the Homogeneous Sector
Matching function (drop country index)
H0 = m0Vχ0 N
1−χ0 .
Labor market tightness (probability of finding a job):
x0 ≡H0N0
= m0j
(V0N0
)χ
.
Probability of a firm finding a worker equals
H0V0
= m0
(N0V0
)1−χ
= m1+α0 x−α
0 , where α ≡ (1− χ) /χ > 0.
Cost of posting vacancies is v0 per worker and one firm matches with oneworker, so v0 is the entry cost.
If matched, the firm and worker split the surplus of 1 equally, i.e., 1/2 foreach.=⇒ w0 = π0 = 1/2.
Elhanan Helpman () Tinbergen Lecture 5: Multinational Corporations June 2013 19 / 25

Wages and Cost of Hiring in the Homogeneous Sector(continued)
Entry proceeds until expected profits equal the entry cost, or:
x0 = a−1/α0 , a0 ≡
2v0m1+α0
> 1.
The derived parameter a0 summarizes labor market frictions in thehomogeneous sector.The expected income of a worker searching for a job in the homogenoussector is ω0 = x0w0, which yields
ω0 =12a−1/α0 .
As a result of free entry of firms, the cost of hiring per worker,b0 ≡ v0jV0j/H0j , is:
b0 =12a0x
α0 =
12.
Note: this is the same in both countries, independent of labor marketfrictions.Elhanan Helpman () Tinbergen Lecture 5: Multinational Corporations June 2013 20 / 25

Wages and Cost of Hiring in the Differentiated Sector
Let x = H/N measures the degree of tightness in the sector’s labor market.A firm chooses profit maximizing employment so that at the bargainingstage, where it engages in Stole-Zweibel style multilateral bargaining, it endsup paying a wage w = b. Therefore the expected income from searching fora job in the differentiated sector is xb.
Workers allocate across sectors to equate expected income, which implies:
xb = ω0.
Unemployment in the differentiated sector is an equilibrium outcome whenxj < 1.
The number of successful matches is H = mV χN1−χ. Then b = vV/H and
b =12axα, a ≡ 2v
m1+α,
where a is our measure of frictions in the differentiated sector’s labor market.
Elhanan Helpman () Tinbergen Lecture 5: Multinational Corporations June 2013 21 / 25

Wages and Cost of Hiring
In summary, we have in country j :
xj = x0j
(a0jaj
) 11+α
=
(1
a1/α0j aj
) 11+α
,
wj = bj = b0j
(aja0j
) 11+α
=12
(aja0j
) 11+α
.
Note that xj < 1 and there is unemployment in the differentiated sector ifand only if a0jaα
j > 1.
In what follows assume that aA/a0A > aB/a0B , so that country B hasrelatively lower labor market frictions in the differentiated sector.
This implies bA > bB , i.e., country A has a larger hiring cost in thedifferentiated sector, and xA/x0A < xB/x0B , i.e., the sectoral labor markettightness is relatively lower in the differentiated sector of country A.
Elhanan Helpman () Tinbergen Lecture 5: Multinational Corporations June 2013 22 / 25

Other Equilibrium Conditions
A firm with productivity θ exits the industry if it cannot make profits, i.e., itcannot cover the fixed production cost fd . There exists an endogenousproductivity θd such that firms with θ < θd exit.
A firm that chooses to stay exports if exporting raises operating profits bymore than the fixed cost of exporting fx . There exists an endogenousproductivity θx > θd such that firms with θ > θx export.
A firm chooses to enter the differentiated product sector only if expectedprofits, using the optimal strategy for every θ, cover entry cost fe . Inequilibrium the two just equal.
The unemployment rate in country j is
uj =N0jL
(1− x0j
)+NjL
(1− xj
).
Elhanan Helpman () Tinbergen Lecture 5: Multinational Corporations June 2013 23 / 25

Equilibrium Cutoffs
0
xΘ
FdΘ
F
•
o45
•
A
B
cdΘ
BA bb =
•S
•C
Elhanan Helpman () Tinbergen Lecture 5: Multinational Corporations June 2013 24 / 25

Results: Trade, Unemployment, Welfare (b larger in A)
Trade:
Let bA > bB . Then: (i) A larger fraction of differentiated-sector firms exportin country B . (ii) Country B exports differentiated products on net andimports homogeneous goods. (iii) The share of intraindustry trade is smallerthe larger bA/bB is.
Unemployment:
In a symmetric world economy: (i) reductions in labor market frictions in thedifferentiated sectors at the same rate in both countries reduce aggregateunemployment if and only if a < a0 · [1+ (β− ζ) /βζ]1+α; (ii) reductions intrade impediments raise aggregate unemployment if and only if a > a0.
Welfare:
(i) A reduction in labor market frictions in country j’s differentiated sectorraises its welfare and reduces the welfare of its trade partner. (ii) Asimultaneous proportional reduction in labor market frictions in thedifferentiated sectors of both countries raises welfare in both of them. (iii) Areduction of trade impediments raises welfare in both countries=⇒bothcountries gain from trade.
Elhanan Helpman () Tinbergen Lecture 5: Multinational Corporations June 2013 25 / 25

Tinbergen Lecture 6: Trade and Inequality
Elhanan Helpman
June 2013
Elhanan Helpman () Tinbergen Lecture 6: Trade and Inequality June 2013 1 / 23

Motivation
Traditional approaches to the relationship between wage inequality andinternational trade: Stolper-Samuelson or Ricardo-Viner.
Both emphasize factor proportions and between group inequality:1 Between-group wage inequality, e.g., skilled and unskilled workers.2 Reallocations across sectors with different factor intensity and changes infactor intensity within sectors
In recent data sets it has been found that a lot of wage variation is:1 within sectors;2 within occupations;3 within-groups of workers with the same observed characteristics.
Elhanan Helpman () Tinbergen Lecture 6: Trade and Inequality June 2013 2 / 23

Decomposition of Inequality
Decompose overall wage inequality into within and betweensector-occupation components
T = W + B
1Nt
Nt
∑i=1(wit − wt )2 =
1Nt
∑k∈K
Nkt
∑i=1(wit − wkt )2 +
1Nt
∑k∈K
Nkt (wkt − wt )2
where workers are indexed by i and time by tk denotes sector, occupation or sector-occupation cellsNt is the number of workerswit is the log wage and a bar denotes a mean
Elhanan Helpman () Tinbergen Lecture 6: Trade and Inequality June 2013 3 / 23

Evidence from Brazil
Helpman, Itskhoki, Muendler and Redding (2013):
Overall Wage Inequality Level 1994 Change 1986-95Within occupation 82 92Within sector 83 73Within sector-occupation 68 66
Elhanan Helpman () Tinbergen Lecture 6: Trade and Inequality June 2013 4 / 23

Evidence from Sweden
Akerman, Helpman, Itskhoki, Muendler and Redding (2013):
Overall Wage Inequality Level 2001 Change 2001-7Within occupation 62 71Within sector 95 74Within sector-occupation 59 66
Elhanan Helpman () Tinbergen Lecture 6: Trade and Inequality June 2013 5 / 23

Within-Group Wage Inequality
Estimate Mincerian log wage equation for worker i for each year t:
wit = z′itϑt + νit
Observables (zit ): indicator variables for
Education (high-school, college degree)Age bins and male/femaleExperience quintiles
Decompose wage dispersion into observables and within-group wageinequality
var (wit ) = var(z ′it ϑt
)+ var (νit )
Decompose within-group wage inequality into within and betweensector-occupation components
Elhanan Helpman () Tinbergen Lecture 6: Trade and Inequality June 2013 6 / 23

After Controlling for Worker Characteristics
Brazil:
Level 1994 Change 1986-95Residual wage inequality 59 49– within sector-occupation 89 90
Sweden:
Level 2001 Change 2001-7Residual wage inequality 70 87– within sector-occupation 83 79
Elhanan Helpman () Tinbergen Lecture 6: Trade and Inequality June 2013 7 / 23

Between-Firm Inequality
For each sector-occupation (k) and year (t) separately, estimate a Mincerianlog wage equation:
wit = z′itϑ`t + ψj`t + νit
where i indicates worker and j denotes firm
Observables (zit ): indicator variables for education, age bins, sex, andexperience bins
Firm-occupation-year fixed effects (ψj`t ) control for overall wage differencesacross firms, including
Differences in wage premia for the same worker characteristicsDifferences in unobserved workforce composition
Decompose wage dispersion within sector-occupations into:
Observables component (dispersion of z ′it ϑkt )Between-firm component (dispersion of firm fixed effects ψj`t )Covariance of observables and firm fixed effects componentsWithin-firm component (dispersion of νit )
Elhanan Helpman () Tinbergen Lecture 6: Trade and Inequality June 2013 8 / 23

Firm-Level Effects
Brazil:
Level Change1994 1986-1995
Between-firm wage inequality 39 86Within-firm wage inequality 37 -11Worker observables 13 2Covar observables-firm effects 11 24
Sweden:
Level Change2001 2001-2007
Between-firm wage inequality 19 15Within-firm wage inequality 65 76Worker observables 16 10Covar observables-firm effects 1 0
Elhanan Helpman () Tinbergen Lecture 6: Trade and Inequality June 2013 9 / 23

Worker Heterogeneity
A limitation of the previous analysis is that all firms pay the same wages inthe differentiated sector.
Helpman, Itskhoki and Redding (2010a,b) introduce ex post workerheterogeneity.
Unobserved worker heterogeneity can help explaining inequality not driven byStolper-Samuelson or Ricardo-Viner effects, in particular in view of largeresidual inequality.Introduce a firm-specific component of inequality.
Assume now that:1 Workers are homogeneous ex ante, but draw an ability a which ismatch-specific in the differentiated sector. As a result, they are heterogeneousex post.
2 The ability a is observed neither by the worker nor by the firm.3 Assume that firm productivity and worker ability are distributed Pareto (makesclosed-form solutions possible).
4 Firms screen workers and engage in multilateral bargaining.
Elhanan Helpman () Tinbergen Lecture 6: Trade and Inequality June 2013 10 / 23

Screening
The structure of the model is the same as before, with the following twomodifications:
the production function is
y = θhγa, 0 < γ < 1
(interpretation: human capital externalities or fixed managerial time at thelevel of the firm);a firm can identify workers with productivity above ac at cost
cδaδc .
As a result, more productive firms screen to higher ability cutoffs and havebetter compositions of workforce. This generates a size-wage premium.Sectoral unemployment rate:
u = (1− σc x)NL.
Elhanan Helpman () Tinbergen Lecture 6: Trade and Inequality June 2013 11 / 23

Variation Across Firms
The model implies the following variation in wages and employment acrossfirms:
w (θ) =βγ
1+ βγ
r (θ)h(θ)
, from bargaining with equal weights
h(θ) = Υ(θ)1−β
Γ (1−k/δ) · hd ·(
θθd
) β(1−k/δ)Γ
,
w (θ) = Υ(θ)k (1−β)
δΓ · wd ·(
θθd
) βkδΓ,
where
Υ(θ) =1, θ < θx ,Υx , θ ≥ θx ,
Υx ≡ 1+ τ− β1−β
(A∗
A
) 11−β
> 1.
Elhanan Helpman () Tinbergen Lecture 6: Trade and Inequality June 2013 12 / 23

Wages in the Open Economy
Larger firms pay higher wages and exporters pay higher wages than nonexporters:
1 1.5 2 2.51
1.25
1.5
Firm Productivity, θ
Wag
e R
ate,
w( θ
)
θd θx
Elhanan Helpman () Tinbergen Lecture 6: Trade and Inequality June 2013 13 / 23

Inequality of Wages
Result: Sectoral wage inequality is larger in the open economy with selectionthan in autarky.
Result: Within a sector, the relationship between trade openness andinequality has an inverted U shape:
0 0.2 0.4 0.6 0.8 10.015
0.016
0.017
0.018
0.019
0.02
Trade Openness, ρ=θd/θx
Thei
l Ind
ex, T
w
µln(1+µ)
Elhanan Helpman () Tinbergen Lecture 6: Trade and Inequality June 2013 14 / 23

Unemployment and Welfare
Result: Let workers be risk neutral and let the expected wage outside thesector ω be invariant to trade. Then:
1 The sectoral unemployment rate u is strictly higher in the open economy thanin the closed economy.
2 Every worker’s ex ante welfare is higher in the open economy than in theclosed economy
3 Average unemployment rates decrease with the quantiles of the aggregatewage distribution:
0 0.2 0.4 0.6 0.8 10
0.1
0.2
0.3
0.4
Elhanan Helpman () Tinbergen Lecture 6: Trade and Inequality June 2013 15 / 23

Helpman, Itskhoki, Muendler and Redding (2013)Theory
Production: the production function is:
y = eθHγa, 0 < γ < 1
Screening: a firm can identify workers with productivity above ac at cost
e−ηCaδc/δ ⇒ a =
kk − 1ac
As an identifying restriction assume η ⊥ θPotential justification: θ driven primarily by technology, η by organizationalfeatures
Search and matching: DMP labor market, multilateral wage bargaining
W =βγ
1+ βγ
RH
Fixed export costs: heterogeneous
eεFx
Elhanan Helpman () Tinbergen Lecture 6: Trade and Inequality June 2013 16 / 23

Model Predictions
A firm with idiosyncratic shock θ, η, ε:
R = κrΥ1−β
Γ
(eθ) β
Γ(eη) β(1−γk )
δΓ
H = κhΥ(1−β)(1−k/δ)
Γ
(eθ) β(1−k/δ)
Γ(eη) β(1−γk )(1−k/δ)
δΓ − kδ
W = κwΥk (1−β)
δΓ
(eθ) βk
δΓ(eη) k
δ
(1+ β(1−γk )
δΓ
)
Market access variable
Υ = 1+ Ix(Υx − 1
), Υx = 1+ τ
− β1−βAxAd
Selection into exporting
Ix =
κπ
(Υ1−β
Γx − 1
)(eθ) β
Γ(eη) β(1−γk )
δΓ ≥ Fx e ε
Elhanan Helpman () Tinbergen Lecture 6: Trade and Inequality June 2013 17 / 23

Econometric Model
Empirical model of Xj = hj ,wj , ιjj :h = αh + µh ι+ u,w = αw + µw ι+ ζu + v ,ι = Iz ≥ f ,
(u, v , z
)′ ∼ N0,
σ2u 0 ρuσu0 σ2v ρv σv
ρuσu ρv σv 1
where
u = 11+χ
(βΓ θ +
(β(1−γk )
δΓ − χ)
η),
v = χ(η −Eη|u
)= χ
(η − πu
),
z = 1σ
(βΓ θ +
β(1−γk )δΓ η − ε
)= 1
σ
((1+ ζ)u + v − ε
),
χ = k/δ1−k/δ > 0 and ζ = χ(1+ π).
µh = (1− k/δ) log Υ(1−β)/Γx ,
µw = k/δ1−k/δ µh ,
f = 1σ
(απ + log Fx − log
[Υ(1−β)/Γx − 1
]).
Estimate the parameter vector Θ = αh , αw , ζ, σu , σv , ρu , ρv , µh , µw , f .
Elhanan Helpman () Tinbergen Lecture 6: Trade and Inequality June 2013 18 / 23

Estimates: Brazil 1994
Coefficient Std Errorµh 1.992 0.019µw 0.197 0.022ρu 0.023 0.004ρv 0.199 0.024f 1.341 0.006
Note: Number of observations: 91,410 (firms). Maximum likelihood estimates and robust
(sandwich-form) asymptotic standard errors.
Elhanan Helpman () Tinbergen Lecture 6: Trade and Inequality June 2013 19 / 23

Firm Moments 1994
DataAll firms Non-exp. Exporters
Mean h 2.96 2.78 4.82Mean w −0.33 −0.37 −0.01Std deviation h 1.20 1.00 1.46Std deviation w 0.43 0.43 0.38Correlation h & w 0.33 0.24 0.32
Fraction of exporters 9.0%
Note: h is firm log employment andw is firm log wage (conditional firm wage component, ψjt , from Mincer regression used as data in estimation)
ModelAll firms Non-exp. Exporters
Mean h 2.96 2.78 4.83Mean w −0.33 −0.37 0.00Std deviation h 1.20 1.05 1.05Std deviation w 0.43 0.42 0.42Correlation h & w 0.32 0.25 0.24
Fraction of exporters 9.0%
Elhanan Helpman () Tinbergen Lecture 6: Trade and Inequality June 2013 20 / 23

Worker Moments 1994
Data ModelStd deviation 0.42 0.46– non-exporters 0.42 0.42– exporters 0.35 0.42
Gini coeffi cient 0.23 0.25
90/10-ratio 2.95 3.23– 90/50 1.63 1.80– 50/10 1.81 1.80
Note: Each worker is assigned the wage of the firm (conditional firm wage component from the
Mincer regression) to construct the distribution of wages across workers. 90/10-ratio is the ratio
of the wages in the 90th percentile and the 10th percentile in the wage distribution (and similar
for 90/50 and 50/10).
Elhanan Helpman () Tinbergen Lecture 6: Trade and Inequality June 2013 21 / 23

Fit of Wage Distribution: Brazil 1994Helpman, Itskhoki, Muendler and Redding (2013)
3 2 1 0 1 2 30
0.2
0.4
0.6
0.8
1
2 1 0 1 20
0.2
0.4
0.6
0.8
1
1.2DataModel
Elhanan Helpman () Tinbergen Lecture 6: Trade and Inequality June 2013 22 / 23

Openness and Inequality: Brazil 1994Helpman, Itskhoki, Muendler and Redding (2013)
0 20% 40% 60% 80% 100%1
1.02
1.04
1.06
1.08
1.1
Elhanan Helpman () Tinbergen Lecture 6: Trade and Inequality June 2013 23 / 23