timor gap mkii alf survey interpretation report · summary the timor gap airborne laser...
TRANSCRIPT
MkII Airborne Laser Fluorosensor Survey Reprocessing And Interpretation Report:
Timor Gap, Timor Sea, Australia
Prepared For AGSO – Geoscience Australia
June 2001
Record 2001/25
AGSOCAT NO. 35635
Prepared by: Robert Cowley Signalworks Pty Ltd A.B.N. 26 066 681 598 Email: [email protected] WWW: http://www.explorationist.com/
Date: June 2001

AGSO −−−− Geoscience Australia Chief Executive Officer: Neil Williams Department of Industry, Science & Resources Minister for Industry, Science & Resources: Senator The Hon. Nick Minchin Parliamentary Secretary: The Hon. Warren Entsch, MP Commonwealth of Australia 2001 This work is copyright. Apart from any fair dealings for the purposes of study, research, criticism or review, as permitted under the Copyright Act, no part may be reproduced by any process without written permission. Inquiries should be directed to the Communications Unit, AGSO – Geoscience Australia, GPO Box 378, Canberra City, ACT, 2601. ISSN: 1039-0073 ISBN: 0 642 467048 Bibliographic reference: Cowley, R., 2001. MkII Airborne Laser Fluorosensor Survey Reprocessing And Interpretation Report: Timor Gap, Timor Sea, Australia. AGSO − Geoscience Australia, Record 2001/25. AGSOCAT 35635. AGSO − Geoscience Australia has tried to make the information in this product as accurate as possible. However, it does not guarantee that the information is totally accurate or complete. Therefore, you should not rely solely on this information when making a commercial decision.

Contents Summary 1. Introduction 2. ALF Survey Analysis
2.1 Fluor Mapping 3. Conclusions and Recommendations Appendices Appendix 1. Data Acquisition QC Appendix 2. Survey Navigation QC Appendix 3. Comparison of MkII and MkIII ALF Survey Data Appendix 4. CD Contents Figures Figure 1. The Timor Gap MkII ALF Survey Location Map Figure 2. The Timor Gap MkII ALF Survey. Figure 3. The F/R Plot for Line 21 Figure 4. Timor Gap MkII ALF Survey First Pass Fluor Map Figure 5. Timor Gap MkII ALF Survey Confident Fluor Map Figure 6. The F/R Histogram for the Confident Fluors Figure 7. Timor Gap MkII ALF Survey, Selected Spectra Figure 8. The Average Raman Peak Plotted for All Lines Figure 9. The Average Raman Variance Plotted for All Lines Figure 10. Average Raman Peak Map Figure 11. Raman Variance Map Figure 12. Smoothed F/R Map Figure 13. The Average Point Spacing Plotted for All Lines Figure 14. Comparison of Skua MkIII and Timor Sea MkII ALF Data Tables Table 1. Timor Gap ALF MkII Survey Data Acquisition Summary Table 2. Timor Gap ALF MkII Survey Line Navigation Summary

Summary The Timor Gap airborne laser fluorosensor (ALF) MkII survey was flown in 1989 by BP over the northern Bonaparte Basin (Sahul Platform, Sahul Syncline and Malita Graben). The survey was designed to detect natural oil seepage over a region of the Timor Sea, Australia, in an effort to refine the petroleum prospectivity assessment. The survey area spanned up to about 330km east to west and about 310km north to south. The line spacing was about 1,900m. A total of 1,860,650 fluorosensor spectra were recorded. This report presents a re-interpretation of the BP data by Signalworks Pty Ltd using the ALF Explorer software. A total of 5,441 confident fluors were interpreted out of the 1,860,650 recorded spectra. This is an average fluor density of 2.91 fluors per thousand spectra. The fluorescence response over the survey area consisted mostly of relatively low confidence fluors (compared to the more reliable MkIII ALF survey data). Some of the regions of increased fluor density correspond to regions having generally higher F/R values, probably caused by changing water properties. These areas may not necessarily have increased levels of hydrocarbon leakage.

Part 1. Introduction
MkII ALF Survey Interpretation Report: Timor Gap, Timor Sea, Australia
5
1. Introduction The Timor Gap airborne laser fluorosensor (ALF) MkII survey was flown in 1989 by BP over the northern Bonaparte Basin (Sahul Platform, Sahul Syncline and Malita Graben). The MkII system used a 308nm laser wavelength, which is longer than the 266nm used in the later MkIII system. The Raman peak wavelength is 344nm (293nm MkIII) and the fluorescence region is 370nm to 580nm (320nm to 580nm MkIII). Each recorded spectrum is the average of ten detected spectra. The averaging was done by BP to reduce the data recording rate, which was limited by the available 1980’s hardware. The MkIII system uses faster hardware and records all detected spectra without averaging. This report presents a re-interpretation of the original BP data using the ALF Explorer software, which consists of a database linked to a set of data processing, analysis and display modules. BP documented the original data processing and interpretation in a basic data report and interpretive data report (Walker, 1991a,b*). 208 lines were acquired at about 1,900m spacing in a NW-SE orientation and a flying height of 100m. A total of 1,860,650 spectra were collected at an average spacing of 16.9m to 28.5m. About 36,000 km of line data were acquired. Some lines in an MkII ALF survey may use the same Line and Point values as other lines. The main ALF data table in the ALF Explorer database (RawAlfData) uses the Line and Point fields as key fields, which cannot contain duplicates. Lines that contain duplicated Line and Point values are stored in separate tables (eg. RawAlfData2). The main ALF data table contains 1,758,364 ALF spectra. A second table (RawAlfData2) contains 102,286 ALF spectra.

Part 1. Introduction
MkII ALF Survey Interpretation Report: Timor Gap, Timor Sea, Australia
6
The survey area is shaded in red on the location map (Figure 1). Seven MkIII ALF surveys acquired between 1995 and 1998 in this region are shown with blue shading (Cowley, 2000a-g* and Cowley, 2001a). Other MkII ALF surveys are shaded in light green (Cowley, 2001b,c*). A total of 5,441 confident fluors were interpreted out of the 1,860,650 recorded spectra. This is an average fluor density of 2.91 fluors per thousand spectra. * Bibliographic references: Walker, N.S., 1991a. 1991 Timor Sea Airborne Laser Fluorosensor Survey for BP Developments Australia Ltd. Basic Data Report. (Timor Gap Survey.) (unpubl. report). Walker, N.S., 1991b. 1991 Timor Sea Airborne Laser Fluorosensor Survey for BP Developments Australia Ltd. Interpreted Data Report. (Timor Gap Survey.) (unpubl. report). Cowley, R., 2000a. Comparison of AGSO − Geoscience Australia North-West Shelf Airborne Laser Fluorosensor Survey Interpretations. Record 2000/27. Cowley, R., 2000b. 1996 Nancar Trough, Northern Bonaparte Basin (AC/P16) Airborne Laser Fluorosensor Survey Interpretation Report. Record 2000/28. Cowley, R., 2000c. 1996 Laminaria High, Northern Bonaparte Basin (AC/P8) Airborne Laser Fluorosensor Interpretation Report. Record 2000/29. Cowley. R., 2000d. 1998 Yampi Shelf, Browse Basin Airborne Laser Fluorosensor Survey Interpretation Report. Record 2000/30. Cowley. R., 2000e. 1996 Yampi Shelf, Browse Basin Airborne Laser Fluorosensor Survey Interpretation Report. Record 2000/31. Cowley. R., 2000f. 1996 Vulcan Sub-basin / Browse Basin Transition Airborne Laser Fluorosensor Survey Interpretation Report. Record 2000/32. Cowley. R., 2000g. 1996 Vulcan Sub-basin Airborne Laser Fluorosensor Survey Interpretation Report. Record 2000/33. Cowley. R., 2001a. Airborne Laser Fluorosensor (MkIII) Survey Reprocessing and Interpretation Report: WA-260-P, Timor Sea, Australia. Record 2001/17, AGSOCAT 35929. Cowley. R., 2001b. MkII Airborne Laser Fluorosensor Survey Reprocessing and Interpretation Report: Bonaparte Basin, Timor Sea, Australia. Record 2001/24, AGSOCAT 35930. Cowley. R., 2001c. MkII Airborne Laser Fluorosensor Survey Reprocessing and Interpretation Report: Timor Sea, Australia. Record 2001/23, AGSOCAT 34394.

Part 1. Introduction
MkII ALF Survey Interpretation Report: Timor Gap, Timor Sea, Australia
7
Figure 1. Timor Gap MkII ALF Survey Location Map. (The Timor Gap survey is shaded in red.) (Blue Areas are later MkIII ALF surveys.) (Light green area are other MkII ALF surveys .)

Part 1. Introduction
MkII ALF Survey Interpretation Report: Timor Gap, Timor Sea, Australia
8
Figure 2. The Timor Gap MkII ALF Survey.
Figure 2 shows a map of the Timor Gap MkII ALF survey, with point symbols annotated in red at a spacing of 500 points.

Part 1. Introduction
MkII ALF Survey Interpretation Report: Timor Gap, Timor Sea, Australia
9
Mapping Specifications: The geodetic coordinates of the supplied ALF data used the AGD66 geodetic datum. Because of inconsistencies in the AGD66 datum, there is no single set of transformation parameters that can accurately transform the coordinates into the WGS84 or AGD84 datums. The AGD66 datum coordinates were assumed to be approximately equal to the AGD84 coordinates for the accuracy of mapping required in this report. Projection: Southern UTM Zone 52 (Central Meridian 129 degrees east) Min Easting: 165,000 Max Easting: 485,000 Min Northing: 8,635,000 Max Northing: 8,970,000

Part 2. ALF Survey Analysis
MkII ALF Survey Interpretation Report: Timor Gap, Timor Sea, Australia
10
2. ALF Survey Analysis 2.1. Fluor Mapping A fluorescence anomaly (fluor) is detected by an increase in the area of the fluorescence response region of the ALF spectrum. For a variety of reasons the magnitude of each ALF spectrum can vary significantly from shot to shot. The fluorescence area value is usually normalized using the Raman area to produce a more consistent measure of fluorescence intensity. The ratio is called the fluorescence on Raman area ratio, usually denoted as F/R. In this analysis, the Raman area is calculated between the wavelengths 330.77nm and 360.13nm (channels 26 to 54). The fluorescence area is calculated between the wavelengths 360.13nm to 600.83nm (channels 54 to 154). Oil fluorescence usually extends over the Raman region but the Raman response distorts the value if it is calculated over this region. The F/R ratio typically shows varying intensity trends over a survey area, probably because of changing water properties. A map of the averaged F/R ratio over the Timor Sea survey is shown in Figure 13 (Appendix 1). The F/R ratio generally increases to the south and east. Localized increases in the ratio are usually seen consistently over several lines. Figure 3 shows the F/R plot for line 21. The values are low to the NW, grading to high to the SE.
Figure 3. The F/R Plot for Line 21.
Because of the changing F/R trends, a constant F/R cutoff level cannot be used to detect fluorescence anomalies (fluors). An average of the F/R ratio is used as an estimate of the background F/R level at any point. Only spectra having an F/R value significantly above the background level are selected as possible fluors. The blue line shown in Figure 3 is the (101 point) average F/R rescaled by a factor of 1.07. The rescaling moves the averaged curve above the F/R values of most of the spectra. Only spectra having an F/R value above the blue curve

Part 2. ALF Survey Analysis
MkII ALF Survey Interpretation Report: Timor Gap, Timor Sea, Australia
11
are selected as possible fluors. The scaling factor is usually selected between values of 1.05 and 1.5 for each line depending on the amount of scatter in the F/R plot. 13,261 possible fluors were selected from the raw ALF data tables. (12,744 from RawAlfData and 517 from RawAlfData2.) Figure 4 shows a map of the possible fluors.
Figure 4. Timor Gap MkII ALF Survey First Pass Flu or Map.

Part 2. ALF Survey Analysis
MkII ALF Survey Interpretation Report: Timor Gap, Timor Sea, Australia
12
The following queries was used to remove some of the noisy spectra from the picked fluors: SELECT * FROM [Sel Fluors1 Spectra Params] WHERE Fl uor_Jitter_On_Area > 0 AND Fluor_Jitter_On_Area < .0015 SELECT * FROM [Selected Fluors 2 Spectra Params] WH ERE Fluor_Jitter_On_Area > 0 AND Fluor_Jitter_On_Area < .0015 These select 5,072 and 369 (5,441 total) confident fluors from the two sets of possible fluors. These are plotted in Figure 5. Adding an F/R cutoff value of 0.4 to the queries reduced the number of selected fluors to 3,318 and 283, but this tended to preserve fluors only in the high F/R regions.
Figure 5. Timor Gap MkII ALF Survey Confident Fluo r Map.

Part 2. ALF Survey Analysis
MkII ALF Survey Interpretation Report: Timor Gap, Timor Sea, Australia
13
Figure 6. The F/R Histogram for the Confident Fluo rs.
Figure 6 shows the fluors intensity (F/R) histogram for the edited fluor picks. Because a varying fluor intensity cutoff level is used to select likely fluors, the histogram bars gradually reduce in size towards the low F/R end of the graph.
Part 2. ALF Survey Analysis
MkII ALF Survey Interpretation Report: Timor Gap, Timor Sea, Australia
14
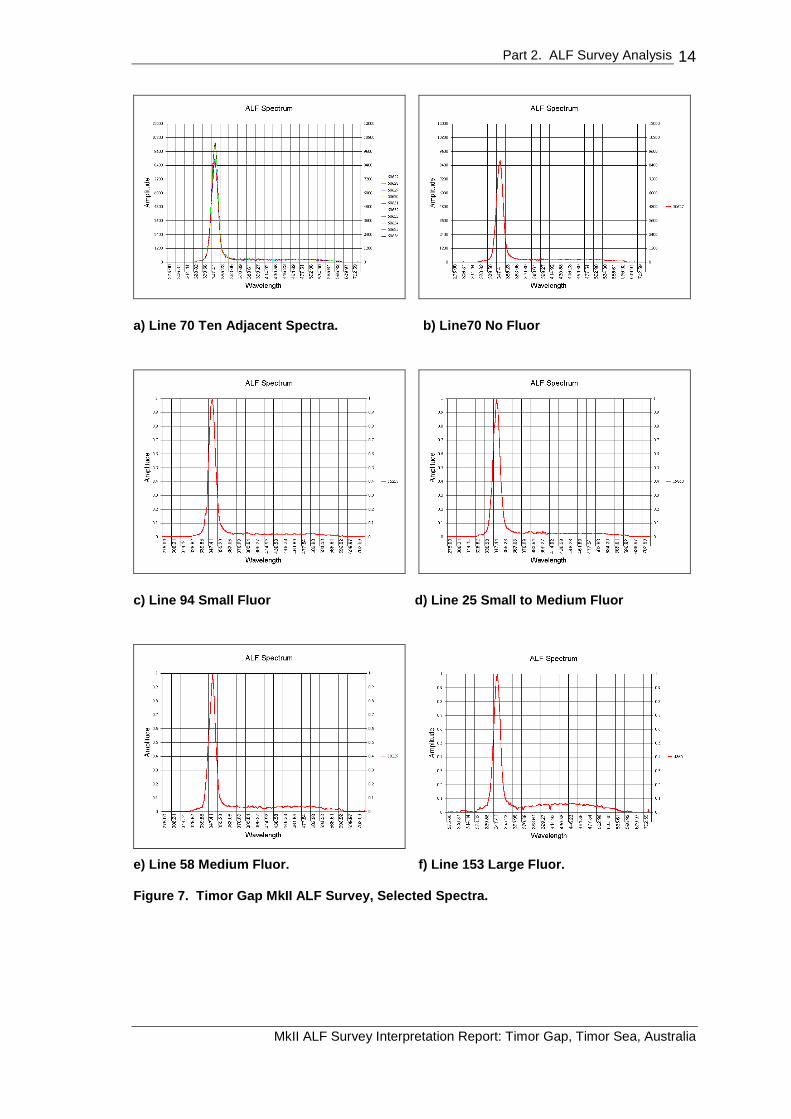
a) Line 70 Ten Adjacent Spectra. b) Line70 No Fluor
c) Line 94 Small Fluor d) Line 25 Small to Medium Fluor
e) Line 58 Medium Fluor. f) Line 153 Large Fluor.
Figure 7. Timor Gap MkII ALF Survey, Selected Spec tra.

Part 3. Conclusions and Recommendations
MkII ALF Survey Interpretation Report: Timor Gap, Timor Sea, Australia
15
3. Conclusions and Recommendations The fluorescence response over the survey area consisted mostly of relatively low confidence fluors (compared to the more reliable MkIII ALF survey data). The 10 spectra averaging method used to record the MkII data tends to filter out the isolated fluorescence response and enhance anomalous water responses. The ~2km line spacing is not sufficiently close to detect most fluor clusters. For example, the line spacing of 300m used on the nearby MkIII ALF survey over the Skua field, Timor Sea (Cowley, 2000*), was only just sufficient to detect the fluor cluster lying near that accumulation. Some of the regions of increased fluor density correspond to regions having generally higher F/R values, probably caused by changing water properties. These areas may not necessarily have increased levels of hydrocarbon leakage. The Timor Gap ALF MkII data is probably not suitable for identifying the isolated, low intensity fluors that are usually detectable on ALF MkIII surveys in the region. *Bibliographic reference: Cowley. R., 2000. 1996 Vulcan Sub-basin Airborne Laser Fluorosensor Survey Interpretation Report. Record 2000/33.

Appendix 1. Data Acquisition QC
MkII ALF Survey Interpretation Report: Timor Gap, Timor Sea, Australia
16
Appendix 1. Data Acquisition QC Line Sections Clipped Avg Raman Peak Avg Raman Variance
1 83 0 4 22 4 0 5 22 154 0 4 33 144 0 5 84 9 0 3 26 19 0 6 58 25 0 3 0
10 29 0 6 712 33 0 3 014 46 0 7 816 51 0 3 118 53 0 9 718 9 0 8 820 55 0 3 121 62 0 6 522 67 0 9 823 68 0 9 1224 73 0 3 225 75 0 17 2126 76 0 9 927 82 0 20 2528 76 0 7 1328 6 0 3 129 76 0 20 2830 81 0 9 1131 81 0 19 3032 90 0 6 1033 77 0 5 034 77 0 10 1435 87 0 5 136 75 0 3 037 78 0 6 138 81 0 10 1639 86 0 7 140 87 0 3 141 77 0 7 242 76 0 12 21
Table 1a. Timor Gap MkII ALF Survey Data Acquisiti on Summary.

Appendix 1. Data Acquisition QC
MkII ALF Survey Interpretation Report: Timor Gap, Timor Sea, Australia
17
Line Sections Clipped Avg Raman Peak Avg Raman Variance
43 86 0 7 244 80 0 3 145 79 0 8 246 82 0 14 2347 28 0 10 247 60 0 10 348 100 0 3 249 78 0 11 350 80 0 10 651 88 0 12 452 77 0 4 153 79 0 7 454 88 0 11 755 93 0 5 356 93 0 3 158 81 0 15 1660 88 0 3 162 93 0 17 2064 85 0 4 166 97 0 20 2567 103 0 5 168 115 0 4 169 105 0 11 1270 101 0 7 470 118 0 19 1871 119 0 14 1972 105 0 3 273 110 0 14 2474 119 0 9 975 122 0 17 3376 126 0 5 777 113 0 5 378 120 0 5 2879 131 0 7 880 133 0 4 181 130 0 10 2582 143 0 7 22
Table 1b. Timor Gap MkII ALF Survey Data Acquisiti on Summary (cont).

Appendix 1. Data Acquisition QC
MkII ALF Survey Interpretation Report: Timor Gap, Timor Sea, Australia
18
Line Sections Clipped Avg Raman Peak Avg Raman Variance
83 149 0 10 2684 153 0 4 185 139 0 9 886 142 0 14 2787 151 0 13 1788 142 0 4 489 143 0 13 1890 154 0 15 2291 156 0 13 1992 150 0 3 193 155 0 6 494 151 0 14 1495 159 0 10 1396 160 0 4 397 150 0 13 1898 154 0 18 1399 157 0 15 20
100 133 0 5 9100 6 0 10 24101 147 0 7 5102 148 0 21 13103 153 0 12 12104 154 0 8 22105 142 0 19 19106 146 0 14 6107 148 0 19 22108 138 0 4 2109 149 0 6 6110 155 0 21 12111 147 0 15 31112 153 0 4 6113 148 0 4 3114 145 0 27 18115 153 0 10 28116 144 0 9 12117 146 0 19 67118 153 0 27 20
Table 1c. Timor Gap MkII ALF Survey Data Acquisiti on Summary (cont).

Appendix 1. Data Acquisition QC
MkII ALF Survey Interpretation Report: Timor Gap, Timor Sea, Australia
19
Line Sections Clipped Avg Raman Peak Avg Raman Variance
119 152 0 19 77120 152 0 11 32121 147 0 3 0122 143 0 5 7123 155 0 3 1124 144 0 17 116125 146 0 7 3126 151 0 10 41127 153 0 7 5128 150 0 21 191129 147 0 5 1130 150 0 22 24131 151 0 7 1132 133 0 3 3133 137 0 7 2134 134 0 20 25135 144 0 9 2136 140 0 4 5137 129 0 2 1138 139 0 10 15139 98 0 4 3139 36 0 7 9140 126 0 8 8141 120 0 9 11142 120 0 5 3143 120 0 9 13144 112 0 9 11145 101 0 3 2146 103 0 6 14147 100 0 3 0148 90 0 9 15149 100 0 3 1150 79 0 7 12151 78 0 25 4007152 75 0 10 20153 67 0 21 1495154 65 0 5 4
Table 1d. Timor Gap MkII ALF Survey Data Acquisiti on Summary (cont).

Appendix 1. Data Acquisition QC
MkII ALF Survey Interpretation Report: Timor Gap, Timor Sea, Australia
20
Line Sections Clipped Avg Raman Peak Avg Raman Variance
155 59 0 6 6156 54 0 8 17157 48 0 8 12158 40 0 4 2159 39 0 12 28160 33 0 3 4161 28 0 12 34162 23 0 4 1163 18 0 17 353164 13 0 3 4165 6 0 17 60166 1 0 5 1168 37 0 1 0170 40 0 1 0196 23 0 10 3196 0 0 0 0196 0 0 0 0196 0 0 0 0196 0 0 0 0196 0 0 0 0196 0 0 0 0196 0 0 0 0196 0 0 0 0196 0 0 0 0196 0 0 0 0198 41 0 11 3200 36 0 12 3201 95 0 10 4202 83 0 10 2203 84 0 14 5203 84 0 14 5204 80 0 9 2204 36 0 12 3206 43 0 11 3208 37 0 10 3210 42 0 10 3212 36 0 7 3
Table 1e. Timor Gap MkII ALF Survey Data Acquisiti on Summary (cont).

Appendix 1. Data Acquisition QC
MkII ALF Survey Interpretation Report: Timor Gap, Timor Sea, Australia
21
Line Sections Clipped Avg Raman Peak Avg Raman Variance
214 42 0 6 2904 96 0 3 1905 111 0 10 22907 78 0 10 17
1 1 0 5 23 9 0 5 35 14 0 6 57 23 0 6 59 26 0 6 6
11 35 0 8 913 36 0 10 1415 49 0 11 1717 47 0 14 2219 62 0 14 2155 79 0 4 257 91 0 3 259 78 0 6 561 94 0 8 863 86 0 6 865 102 0 7 9
203 84 0 7 6205 81 0 6 8207 5 0 7 11
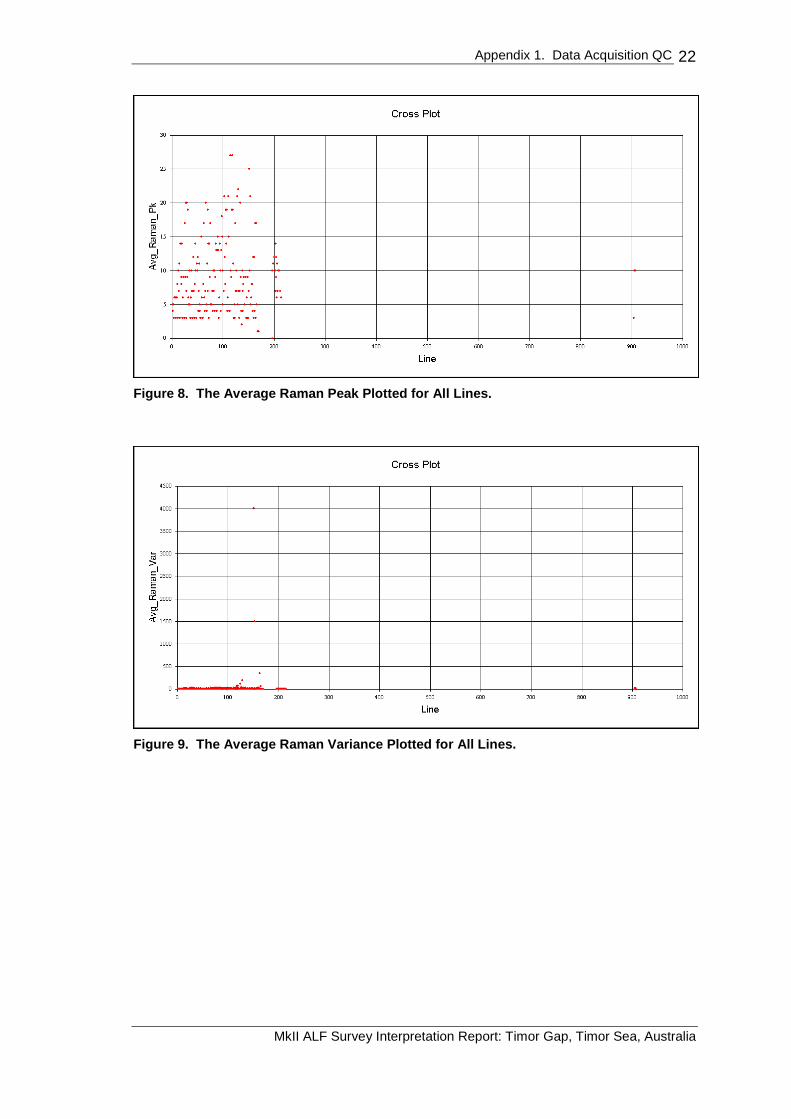
Table 1f. Timor Gap MkII ALF Survey Data Acquisiti on Summary (cont). The average Raman peak levels (averaged over each line) ranged from 0 to 27. This parameter is mapped over the survey in Figure 8. The Raman variance, calculated over 100 point windows and averaged over each line, ranged from 0 to 4000. This parameter is mapped over the survey in Figure 9. Lines 151 and 153 are extremely noisy and have very high Raman variances.
Appendix 1. Data Acquisition QC
MkII ALF Survey Interpretation Report: Timor Gap, Timor Sea, Australia
22
Figure 8. The Average Raman Peak Plotted for All L ines.
Figure 9. The Average Raman Variance Plotted for A ll Lines.

Appendix 1. Data Acquisition QC
MkII ALF Survey Interpretation Report: Timor Gap, Timor Sea, Australia
23
Figure 10. Average Raman Peak Map.

Appendix 1. Data Acquisition QC
MkII ALF Survey Interpretation Report: Timor Gap, Timor Sea, Australia
24
Figure 11. Raman Variance Map.

Appendix 1. Data Acquisition QC
MkII ALF Survey Interpretation Report: Timor Gap, Timor Sea, Australia
25
Figure 12. Smoothed F/R Map.
Figure 12 shows the smoothed F/R value over the survey area. The map shows F/R variations that can be correlated between lines.

Appendix 2. Data Navigation QC
MkII ALF Survey Interpretation Report: Timor Gap, Timor Sea, Australia
26
Appendix 2. Data Navigation QC
Line Heading (Deg)
Straight Line Distance (m)
Acquisition Time (seconds)
Avg Straight Line Velocity (km/hr) Points
Flight Distance (m)
Avg Flying Velocity
Avg Point Spacing (m)
1 224.63 172436 0 0 8385 172454.7 0 20.572 314.18 11886.5 0 0 590 11887.7 0 20.222 44.81 282584.9 0 0 15584 282720 0 18.143 224.68 301239.6 0 0 14461 301260.5 0 20.844 316.04 23100.56 0 0 1070 23180.77 0 21.76 134.9 33869.14 0 0 1976 33870.24 0 17.168 134.91 48247.6 0 0 2625 48258.43 0 18.4
10 314.76 59446.4 0 0 3000 59494.2 0 19.8412 315.13 70901.65 0 0 3320 70947.56 0 21.3814 135.01 84659.98 0 0 4715 84662.72 0 17.9616 134.85 96855.9 0 0 5248 96871.92 0 18.4718 314.92 109875.7 0 0 5413 109904.1 0 20.3118 314.63 19501.96 0 0 965 19503.73 0 20.2520 314.95 119746.2 0 0 5570 119768.2 0 21.5121 314.93 126686.6 0 0 6324 126753.8 0 20.0522 135.03 129123.2 0 0 6809 129182.7 0 18.9823 134.93 131598.5 0 0 6971 131621.5 0 18.8924 134.88 138025 0 0 7450 138130.5 0 18.5525 314.91 152147 0 0 7560 152276.5 0 20.1526 314.85 157387.9 0 0 7775 157424.4 0 20.2527 134.91 157582.7 0 0 8255 157629.2 0 19.128 314.96 155324.5 0 0 7770 155413.9 0 20.0128 314.35 14992.89 0 0 695 14997.74 0 21.6429 314.89 157127.4 0 0 7775 157181.7 0 20.2230 134.95 156054.4 0 0 8201 156199 0 19.0531 134.87 157370.3 0 0 8200 157377.2 0 19.232 134.82 154738.3 0 0 9110 154828.9 0 1733 314.87 156989.5 0 0 7831 157057 0 20.0634 314.85 157911.8 0 0 7775 157937.9 0 20.3235 135.04 158614.5 0 0 8850 158687.5 0 17.9336 314.98 159065 0 0 7555 159131.8 0 21.0737 314.86 158091 0 0 7835 158117.7 0 20.1938 134.87 156794.8 0 0 8191 156894.1 0 19.1639 134.96 158247.5 0 0 8740 158283.4 0 18.1140 134.76 159061.3 0 0 8895 159116.3 0 17.8941 314.82 158021.4 0 0 7775 158116.3 0 20.3442 314.89 157931.1 0 0 7715 157996.4 0 20.48
Table 2a. Timor Gap MkII ALF Survey Line Navigatio n Summary.
Appendix 2. Data Navigation QC
MkII ALF Survey Interpretation Report: Timor Gap, Timor Sea, Australia
27
Line Heading (Deg)
Straight Line Distance (m)
Acquisition Time (seconds)
Avg Straight Line Velocity (km/hr) Points
Flight Distance (m)
Avg Flying Velocity
Avg Point Spacing (m)
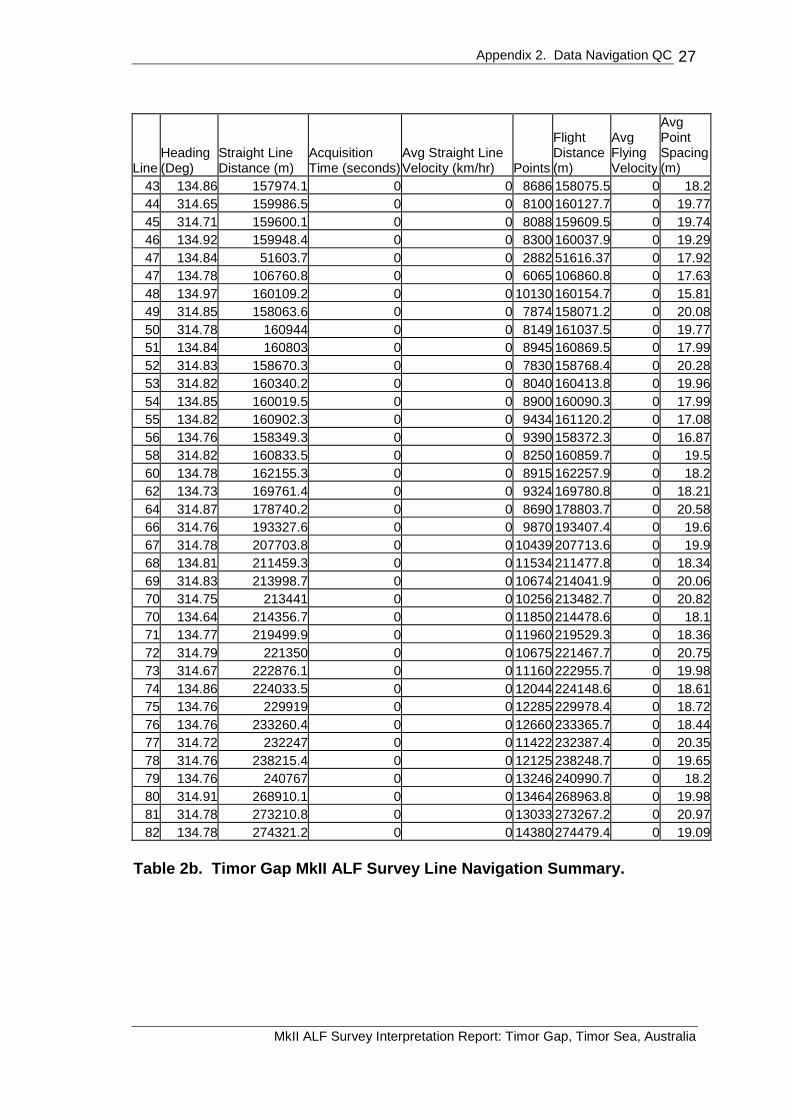
43 134.86 157974.1 0 0 8686 158075.5 0 18.244 314.65 159986.5 0 0 8100 160127.7 0 19.7745 314.71 159600.1 0 0 8088 159609.5 0 19.7446 134.92 159948.4 0 0 8300 160037.9 0 19.2947 134.84 51603.7 0 0 2882 51616.37 0 17.9247 134.78 106760.8 0 0 6065 106860.8 0 17.6348 134.97 160109.2 0 0 10130 160154.7 0 15.8149 314.85 158063.6 0 0 7874 158071.2 0 20.0850 314.78 160944 0 0 8149 161037.5 0 19.7751 134.84 160803 0 0 8945 160869.5 0 17.9952 314.83 158670.3 0 0 7830 158768.4 0 20.2853 314.82 160340.2 0 0 8040 160413.8 0 19.9654 134.85 160019.5 0 0 8900 160090.3 0 17.9955 134.82 160902.3 0 0 9434 161120.2 0 17.0856 134.76 158349.3 0 0 9390 158372.3 0 16.8758 314.82 160833.5 0 0 8250 160859.7 0 19.560 134.78 162155.3 0 0 8915 162257.9 0 18.262 134.73 169761.4 0 0 9324 169780.8 0 18.2164 314.87 178740.2 0 0 8690 178803.7 0 20.5866 314.76 193327.6 0 0 9870 193407.4 0 19.667 314.78 207703.8 0 0 10439 207713.6 0 19.968 134.81 211459.3 0 0 11534 211477.8 0 18.3469 314.83 213998.7 0 0 10674 214041.9 0 20.0670 314.75 213441 0 0 10256 213482.7 0 20.8270 134.64 214356.7 0 0 11850 214478.6 0 18.171 134.77 219499.9 0 0 11960 219529.3 0 18.3672 314.79 221350 0 0 10675 221467.7 0 20.7573 314.67 222876.1 0 0 11160 222955.7 0 19.9874 134.86 224033.5 0 0 12044 224148.6 0 18.6175 134.76 229919 0 0 12285 229978.4 0 18.7276 134.76 233260.4 0 0 12660 233365.7 0 18.4477 314.72 232247 0 0 11422 232387.4 0 20.3578 314.76 238215.4 0 0 12125 238248.7 0 19.6579 134.76 240767 0 0 13246 240990.7 0 18.280 314.91 268910.1 0 0 13464 268963.8 0 19.9881 314.78 273210.8 0 0 13033 273267.2 0 20.9782 134.78 274321.2 0 0 14380 274479.4 0 19.09
Table 2b. Timor Gap MkII ALF Survey Line Navigatio n Summary.

Appendix 2. Data Navigation QC
MkII ALF Survey Interpretation Report: Timor Gap, Timor Sea, Australia
28
Line Heading (Deg)
Straight Line Distance (m)
Acquisition Time (seconds)
Avg Straight Line Velocity (km/hr) Points
Flight Distance (m)
Avg Flying Velocity
Avg Point Spacing (m)
83 134.83 278285.8 0 0 15014 278389.3 0 18.5484 134.76 279878 0 0 15393 279934.9 0 18.1985 314.75 284615 0 0 14052 284624.5 0 20.2686 314.74 285463.2 0 0 14381 285497.6 0 19.8687 134.77 287782.3 0 0 15181 287813.5 0 18.9688 314.74 290656.2 0 0 14324 290822.2 0 20.3189 314.73 295076.3 0 0 14430 295176.5 0 20.4690 134.72 296793.4 0 0 15455 297021.3 0 19.2291 134.76 299327.8 0 0 15718 299560.3 0 19.0692 314.76 303235.3 0 0 15135 303254.8 0 20.0493 314.73 305914 0 0 15614 305982.1 0 19.694 314.74 306068.1 0 0 15185 306077.9 0 20.1695 134.74 304234.9 0 0 16034 304319.8 0 18.9896 134.75 301544.5 0 0 16145 301572.4 0 18.6897 314.74 302083.4 0 0 15124 302189.1 0 19.9898 134.71 300421.8 0 0 15560 300494.3 0 19.3199 134.52 298932.8 0 0 15744 298948 0 18.99
100 314.69 275729.1 0 0 13398 275796.3 0 20.59100 314.39 15288.23 0 0 736 15289.2 0 20.83101 314.69 298013.3 0 0 14864 298064.3 0 20.06102 314.73 296610.3 0 0 14916 296666.9 0 19.89103 134.73 293587.7 0 0 15340 293748.3 0 19.15104 134.7 292598.5 0 0 15505 292679.1 0 18.88105 314.69 292278.8 0 0 14380 292449.2 0 20.34106 314.66 290530.9 0 0 14755 290668.5 0 19.7107 134.68 289699 0 0 14905 289776.8 0 19.44108 314.65 288544.7 0 0 13955 288616.7 0 20.68109 314.69 289432.6 0 0 15040 289667.1 0 19.26110 134.69 289653.1 0 0 15561 289740.9 0 18.62111 134.67 289687.2 0 0 14825 289770.2 0 19.55112 134.68 289801 0 0 15368 289890 0 18.87113 314.66 290439.1 0 0 14963 290471.2 0 19.42114 314.65 290220.7 0 0 14641 290339.6 0 19.83115 134.67 289745.7 0 0 15345 289824.8 0 18.89116 314.64 287709.7 0 0 14545 287728.6 0 19.78117 314.66 291690 0 0 14755 291803.9 0 19.78118 134.63 291029.4 0 0 15398 291142.7 0 18.91 Table 2c. Timor Gap MkII ALF Survey Line Navigatio n Summary.

Appendix 2. Data Navigation QC
MkII ALF Survey Interpretation Report: Timor Gap, Timor Sea, Australia
29
Line Heading (Deg)
Straight Line Distance (m)
Acquisition Time (seconds)
Avg Straight Line Velocity (km/hr) Points
Flight Distance (m)
Avg Flying Velocity
Avg Point Spacing (m)
119 134.68 291423.7 0 0 15290 291434 0 19.06120 134.58 286353.3 0 0 15304 286420.2 0 18.72121 314.63 291667.7 0 0 14805 291705.2 0 19.71122 314.61 290699.5 0 0 14494 290713.3 0 20.06123 134.61 290895.9 0 0 15620 290920.7 0 18.63124 314.63 292101 0 0 14488 292128.8 0 20.17125 314.59 291637.9 0 0 14699 291656.7 0 19.84126 134.61 291715.6 0 0 15145 291729.8 0 19.26127 134.61 288149.7 0 0 15450 288252.5 0 18.66128 134.6 286273.3 0 0 15106 286440.7 0 18.96129 314.58 285134.3 0 0 14801 285169.8 0 19.27130 134.61 280464.3 0 0 15021 280508.6 0 18.68131 134.52 278750.4 0 0 15230 278830.4 0 18.31132 314.58 276923.6 0 0 13465 277048.4 0 20.58133 314.6 271907.9 0 0 13789 272097 0 19.74134 314.62 268590.3 0 0 13520 268738.2 0 19.88135 134.66 268226 0 0 14539 268308.2 0 18.46136 134.59 265537.4 0 0 14110 265693.8 0 18.83137 314.58 262469.3 0 0 13090 262580.1 0 20.06138 134.6 259924.8 0 0 14050 260062.3 0 18.51139 134.61 183353.8 0 0 9828 183379.5 0 18.66139 134.49 70054.8 0 0 3756 70056.89 0 18.66140 314.61 254178 0 0 12765 254276.4 0 19.92141 314.57 245571.3 0 0 12065 245706.3 0 20.37142 314.58 236810.5 0 0 12125 237031.8 0 19.55143 134.6 228422.9 0 0 12074 228477.6 0 18.93144 134.53 219064.2 0 0 11310 219069.2 0 19.37145 314.59 206953.5 0 0 10194 206965.4 0 20.31146 134.55 200388.4 0 0 10391 200455.8 0 19.3147 134.6 190862.9 0 0 10136 190916.2 0 18.84148 314.56 182700 0 0 9115 182767.6 0 20.06149 134.55 173864.5 0 0 10145 173876.4 0 17.14150 314.57 164349.4 0 0 7930 164355.3 0 20.73151 134.62 155754.6 0 0 7830 155758.5 0 19.9152 134.6 147228.5 0 0 7608 147242.2 0 19.36153 314.6 136836.6 0 0 6865 136842.8 0 19.94154 134.56 128980.9 0 0 6645 128987 0 19.42 Table 2d. Timor Gap MkII ALF Survey Line Navigatio n Summary.

Appendix 2. Data Navigation QC
MkII ALF Survey Interpretation Report: Timor Gap, Timor Sea, Australia
30
Line Heading (Deg)
Straight Line Distance (m)
Acquisition Time (seconds)
Avg Straight Line Velocity (km/hr) Points
Flight Distance (m)
Avg Flying Velocity
Avg Point Spacing (m)
155 314.82 118194.3 0 0 6057 118220.5 0 19.52 156 314.56 108661 0 0 5407 108662.7 0 20.1 157 134.57 96889.82 0 0 4934 96891.65 0 19.65 158 314.63 85974.44 0 0 4129 86052.75 0 20.85 159 314.57 76728.83 0 0 3915 76733.41 0 19.61 160 314.78 66683.68 0 0 3375 66689.22 0 19.77 161 134.62 56720.91 0 0 2895 56722.04 0 19.61 162 134.87 43997.35 0 0 2355 44000.9 0 18.7 163 134.65 35833.47 0 0 1820 35835.94 0 19.71 164 134.82 26686.55 0 0 1445 26687.02 0 18.49 165 314.74 15536.06 0 0 795 15536.65 0 19.59 166 314.95 5680.37 0 0 265 5680.49 0 21.6 168 314.74 75673.02 0 0 3855 75739.63 0 19.66 170 134.62 74552.47 0 0 4070 74555.56 0 18.33 196 315.13 54089.06 0 0 2403 54098.93 0 22.53 196 327.12 119.42 0 0 5 0 0 0 196 270 0 0 0 1 0 0 0 196 296.11 863.2 0 0 36 882.88 0 25.97 196 314.92 3136.1 0 0 112 3136.1 0 28.51 196 314.65 1818.24 0 0 68 1818.24 0 27.55 196 314.46 60.36 0 0 3 0 0 0 196 314.17 487.97 0 0 17 0 0 0 196 314.21 277.99 0 0 9 0 0 0 196 314.64 102.95 0 0 6 0 0 0 196 314.9 911.01 0 0 31 0 0 0 198 134.67 75751.94 0 0 4213 75756.16 0 17.99 200 314.52 75466.89 0 0 3750 75487.41 0 20.14 201 134.77 173010.3 0 0 9586 173101.9 0 18.06 202 314.76 172744.1 0 0 8405 172841.6 0 20.57 202 135.01 74796.72 0 0 4225 74886.84 0 17.73 203 314.84 170865.1 0 0 8525 170941.9 0 20.06 204 134.89 155783.9 0 0 8099 155872.9 0 19.25 204 314.68 74925.07 0 0 3699 74941.08 0 20.27 206 134.95 76242.02 0 0 4340 76315.67 0 17.59 208 316.06 78205.95 0 0 3864 78379.7 0 20.3 210 134.68 75128.94 0 0 4290 75206.35 0 17.54 212 314.82 74573.01 0 0 3688 74574.68 0 20.23 Table 2e. Timor Gap MkII ALF Survey Line Navigatio n Summary.

Appendix 2. Data Navigation QC
MkII ALF Survey Interpretation Report: Timor Gap, Timor Sea, Australia
31
Line Heading (Deg)
Straight Line Distance (m)
Acquisition Time (seconds)
Avg Straight Line Velocity (km/hr) Points
Flight Distance (m)
Avg Flying Velocity
Avg Point Spacing (m)
214 134.67 74419.13 0 0 4285 74431.77 0 17.38904 44.59 181278.1 0 0 9719 181310.3 0 18.66905 90.01 214804.6 0 0 11258 214811.4 0 19.08907 45.54 151794.5 0 0 7880 151820.3 0 19.27
1 315.54 5472.05 0 0 265 5472.34 0 20.813 134.46 16847.32 0 0 965 16847.87 0 17.55 315.46 30774.87 0 0 1500 30801.16 0 20.567 134.9 42524.68 0 0 2408 42525.13 0 17.679 314.87 54959 0 0 2669 54960.47 0 20.61
11 135.07 66222.22 0 0 3640 66224.08 0 18.213 314.67 78089.39 0 0 3745 78100.65 0 20.8715 134.91 90118.8 0 0 4920 90120.66 0 18.3217 314.9 101808.9 0 0 4870 101824 0 20.9219 134.95 115053.6 0 0 6260 115133.9 0 18.455 314.79 160977.6 0 0 8094 161136.8 0 19.9157 134.76 161308.9 0 0 9168 161345.8 0 17.659 314.74 157746.3 0 0 7875 157804 0 20.0461 134.81 165453.5 0 0 9554 167359.5 0 17.5263 314.74 174733.5 0 0 8621 174777.2 0 20.2865 134.77 183780.5 0 0 10340 183946.4 0 17.79
203 314.83 170448.5 0 0 8530 170507.9 0 19.99205 134.7 143458.6 0 0 8202 143500.8 0 17.5207 314.87 16077.88 0 0 660 16078.05 0 24.43
TOTAL 35,923,849.06 1,860,650 35,935,960.25 Table 2f. Timor Gap MkII ALF Survey Line Navigatio n Summary. A total of 1,860,650 ALF spectra were recorded on 208 lines. A total of nearly 36,000 km of lines were flown during the survey. Figure 13 shows the average point spacing plotted for all lines. The spacing typically lies between 17 and 29m. Several short line segments have a calculated average point spacing of 0 because the navigation QC module requires at least 100 points for its calculations.

Appendix 2. Data Navigation QC
MkII ALF Survey Interpretation Report: Timor Gap, Timor Sea, Australia
32
Figure 13. The Average Point Spacing Plotted for A ll Lines.

Appendix 3. Comparison of MkII and MkIII ALF Data
MkII ALF Survey Interpretation Report: Timor Gap, Timor Sea, Australia
33
Appendix 3. Comparison of MkII and MkIII ALF Survey Data Figure 14 shows a comparison of ALF MkIII survey data from the Skua region with the Timor ALF MkII data. Figure 14a shows a typical isolated MkIII fluor within ten adjacent spectra. Figure 14b shows a typical non-fluorescing spectrum. A medium intensity fluor is shown in Figure 14c. When the fluor is averaged with the surrounding non-fluor spectra (Figure 14d), the response is difficult to distinguish from the non-fluor spectra. The averaging process has tended to filter out the fluorescence response and enhance the more consistent water response. Figures 14e and 14f show a typical non-fluor and interpreted medium intensity fluor from the Timor MkII ALF survey. The refined interpretation method is required to distinguish the more subtle MkII fluors.

Appendix 3. Comparison of MkII and MkIII ALF Data
MkII ALF Survey Interpretation Report: Timor Gap, Timor Sea, Australia
34
a) Skua ALF MkIII Ten Adjacent Spectra b) Skua Line 30130 No Fluor
c) Skua Line 30130 Medium Fluor d) Skua Line 30130 Ten Spectra Averaged
e) Timor MkII Line 15 No Fluor f) Timor MkII Line 21 Medium Fluor.
Figure 14. Comparison of Skua MkIII and Timor Sea MkII ALF Data.

Appendix 4. CD Contents
MkII ALF Survey Interpretation Report: Timor Gap, Timor Sea, Australia
35
Appendix 4. CD Contents The CD contains the following files: Timor Gap MkII ALF Project.zip
the ALF Explorer project Timor Gap MkII ALF Survey Interpretation Report.doc
the interpretation report document file Timor Gap MkII ALF Survey Picked Fluors.txt
an ASCII data file of the fluors selected during the interpretation Timor Gap MkII ALF Survey Summary.xls Excel spreadsheet containing the survey acquisition and navigation QC
summaries Figures Directory containing figures used in the interpretation report