timingpro™ intelligent light glightgatespcv1 : 191126
TRANSCRIPT

TimingPro™ Intelligent Light Gates

The TimingPro™ Light Gate system consists of a Primary Light Gate with Bluetooth connectivity to a smart device or PC, a Secondary Light Gate which connects by cable to the Primary, a special solenoid attachment for g by free fall experiments, and the TimingPro™ software. Further accessories provide integration with a low friction track and dynamics trolleys, and with a conventional linear air track, offering a variety of experimental approaches to dynamics. The Primary Light Gate has a built in timer, solenoid attachment port and two channels (Primary & Secondary) on which two or more Secondary Light Gates can be daisy-chained. Internal timing is crystal controlled with a resolution of 0.1 millisecond on all experimental times. The system has several advantages over conventional timing, making use of dedicated software on PC and apps for Android/iOS devices. The software graphically displays the interruptions of the light gates and presents the timesin data tables. Data is saved as .csv files which can be opened into Excel and Word.
The Primary Light Gate has an built-in rechargeable battery which powers the Secondary Light Gate when it is connected by the link cable.The Primary Light Gate also provides power and trigger signals to the Solenoid attachment, via the dedicated cable.To conserve the battery, the solenoid detects objects and only then energises the solenoid. The solenoid winding has a resettable thermal fuse to protect it from overheating. The Primary Light Gate should be fully charged (about 8 hours) using the 9 V plugtop charger supplied, before attempting to use it in experiments. If a different charger is used, it must provide 9 V dc at 1.5 A (minimum) with the correct plug (ext 5.5 mm x 2.1 mm int) to fit the charger socket.
System description
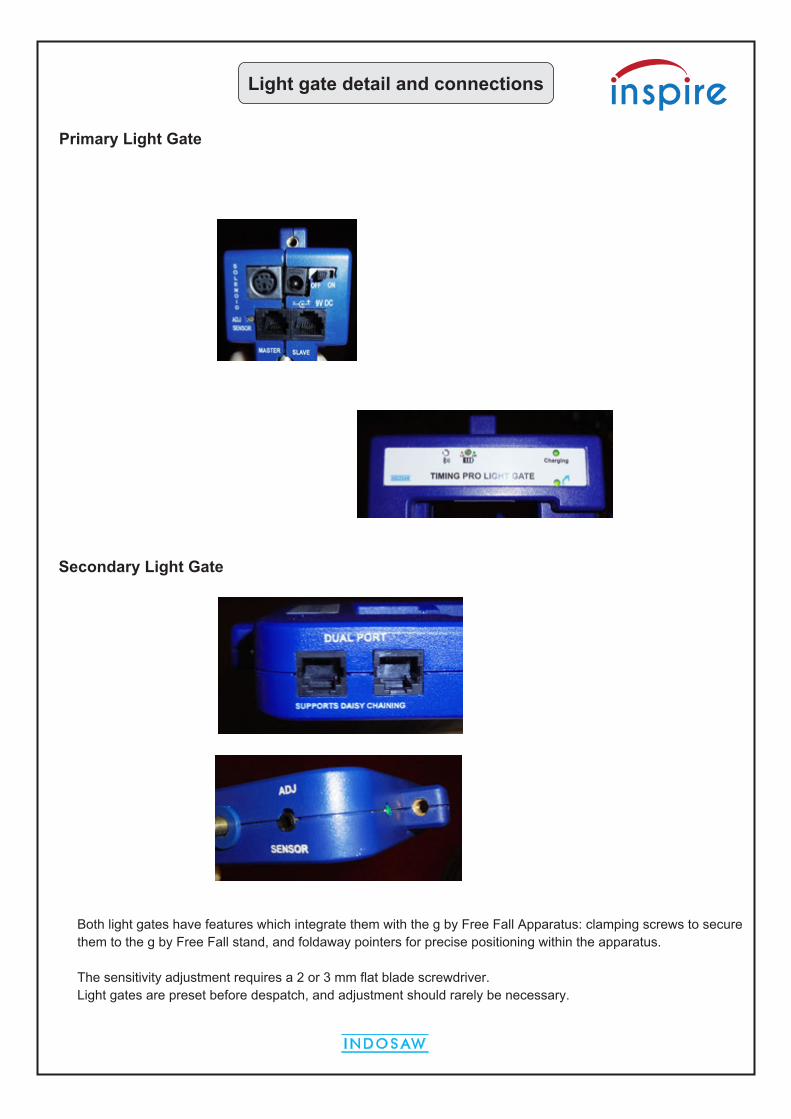
Light gate detail and connections
Primary Light Gate
Secondary Light Gate
Both light gates have features which integrate them with the g by Free Fall Apparatus: clamping screws to secure them to the g by Free Fall stand, and foldaway pointers for precise positioning within the apparatus. The sensitivity adjustment requires a 2 or 3 mm flat blade screwdriver. Light gates are preset before despatch, and adjustment should rarely be necessary.

Light gate accessories
g by Free Fall Apparatus
This apparatus helps to increase the precision and consistency of determinations of g by free fall. The scale is first fitted into the base, which has two levelling screws to ensure the scale is truly vertical. Fit the Solenoid unit to the top and clamp it in position using the two knurled knobs.
Fit the Primary Light Gate a short distance below the solenoid unit, and connect the solenoid cable to the mini-DIN socket on the light gate.
Magnetic objects such as the steel ball or dowel supplied are placed here.The Solenoid unit detects the object, provides power to hold it and the Object present LED lights up.
Both light gates have a foldaway pointer for positioning the light gateprecisely against the scale

Attachments for a variety of tracks
The rod attachments can be fitted to the Light Gates in three different orientations, for easyattachment to standard laboratory stands and bosses. A rod can be screwed in as shown.
Light Gates can be fitted to a Linear Air Track using the Light Gate Mounts, which give perfect alignment for experiments, with an integrated pointer for precise positioning.
The Law of Motion Kit has an overhead rail on to which the Light Gates can be fitted, usingthe clips shown here. The clips click on to the top of the Light Gate and slide along the rail.A small window in the clip shows the precise position, and the clip has a clamping screw.
Knobs secure the mounts on the Air track
Light Gate Mount
The clamping screw fixes the Light Gate in the chosen position
The clip clicks on to the top of the Light Gate
Pointer to theAir track scale
Light Gates fit into a slot and are clamped in place
Light gate accessories

TimingPro™ software contains general facilities plus templates for common dynamics experiments: speed, acceleration, collisions and g by free fall, using a variety of objects and masks which can be configured to suit the user's experimental needs.The software provides comprehensive graphing and analysis facilities for dynamics investigations. When TimingPro is launched, the Home screen gives the choice of Basic or Advanced functions.
Selecting g by free fall reveals three options, which are different methods for measuring g
Introducing TimingPro™ software
The Basic mode screen, whose functionsare described on the next page

Basic mode
The screen is divided into the following areas: Menu bar Icon bar
Basic mode contains all the icons that appear in TimingPro Light Gates software. The complete icon bar isshown here. Some icons only appear in the relevant experiment modes. Data tables Results tables Event graph
Status bar
Gives a summary of the current mode and any experimental settings, e.g. size of mask. File menu functions Clear the data tables and graph Open a saved or sample file Save the current experiment Print the current screen Exit TimingPro application

Basic mode - the icon bar

Gate mode: Time difference is measured from rising edge to falling edge, for every event,for each connected light gate, e.g. Primary and 1 or more Secondary light gates.
For each event, the duration of the interruption is recorded, providing data for manual calculation of speeds.
1 Gate mode: Time difference is measured from the average of rising and falling times of the first event, to the average of rising and falling times of the second event. The time difference is calculated for any connected light gates.
Using the dimensions of the 2 bar mask, the user can calculate the average speed for the moving object, at each light gate.
2 Gate mode: Time difference is measured from the average of rising and falling times of the event at the first light gate to the average of rising and falling times of the second event at the second light gate.
The software measures the time between consecutive events at two separate light gates. Using the distance between the light gates, an average speed can be calculated.
Frequency mode: captures the time data for a series of interruptions (events), countsthe number of interruptions per second, calculates and displays the frequency in Hz.If the frequency changes, it is recalculated and the frequency table is updated.If the frequency is less than 1 Hz, "NaN" appears in the frequency table.
Pendulum mode: captures every interruption of the light gate as an event and deals with the events in groups of three. The period is the time between the average of the rising and falling times of the first event and the corresponding point in the third event.
The period is only calculated after three events have occurred, then a new period is calculated as each new event is captured.
Count mode: interruptions of any connected light gates are timed, counted and totalled. The maximum counting period is 9999 seconds.
Basic mode - timing methods
In keeping with good practice in physics teaching, calculations of distance ÷ time give the speed of the object, a scalar quantity. The user is responsible for assigning direction to the motion of an object, and can then refer to the velocity of that object, which is a vector quantity.This is important in collision experiments, where conservation of momentum is explored.
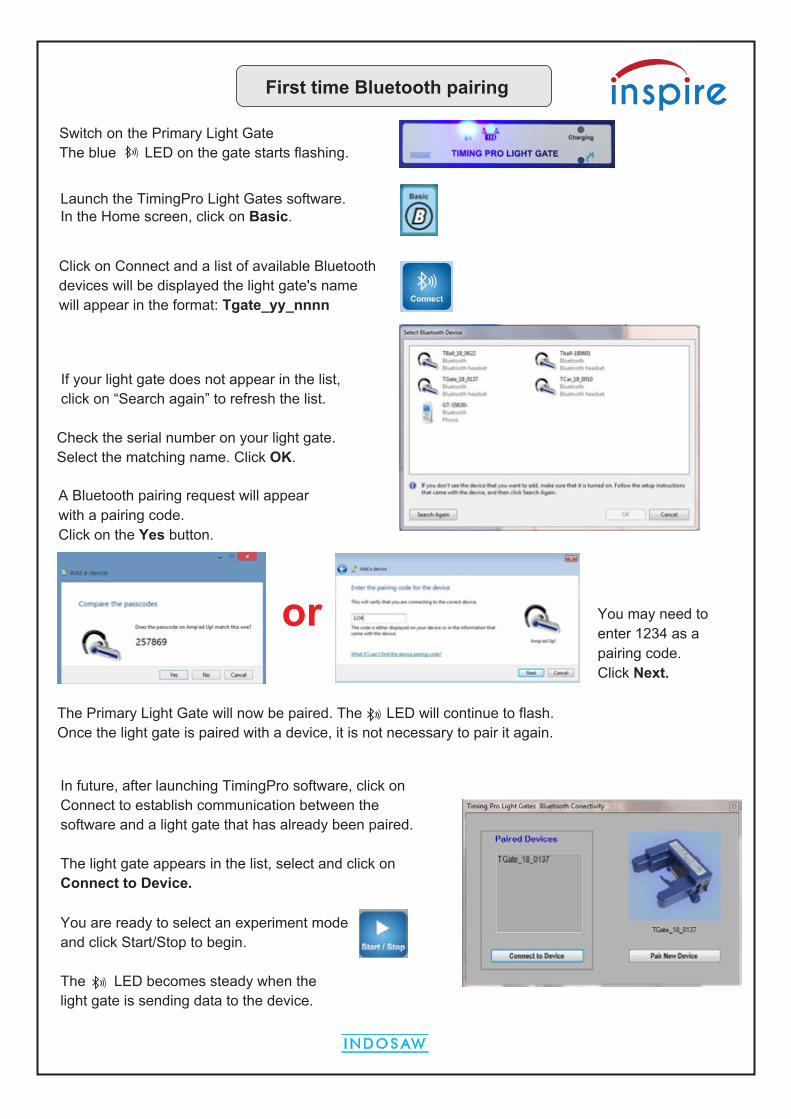
Click on Connect and a list of available Bluetooth devices will be displayed the light gate's name will appear in the format: Tgate_yy_nnnn
If your light gate does not appear in the list, click on “Search again” to refresh the list. Check the serial number on your light gate.Select the matching name. Click OK.
Launch the TimingPro Light Gates software.In the Home screen, click on Basic.
A Bluetooth pairing request will appear with a pairing code. Click on the Yes button.
The Primary Light Gate will now be paired. The LED will continue to flash.Once the light gate is paired with a device, it is not necessary to pair it again.
You may need to enter 1234 as a pairing code. Click Next.
or
Switch on the Primary Light GateThe blue LED on the gate starts flashing.
In future, after launching TimingPro software, click on Connect to establish communication between the software and a light gate that has already been paired. The light gate appears in the list, select and click onConnect to Device. You are ready to select an experiment modeand click Start/Stop to begin. The LED becomes steady when the light gate is sending data to the device.
First time Bluetooth pairing
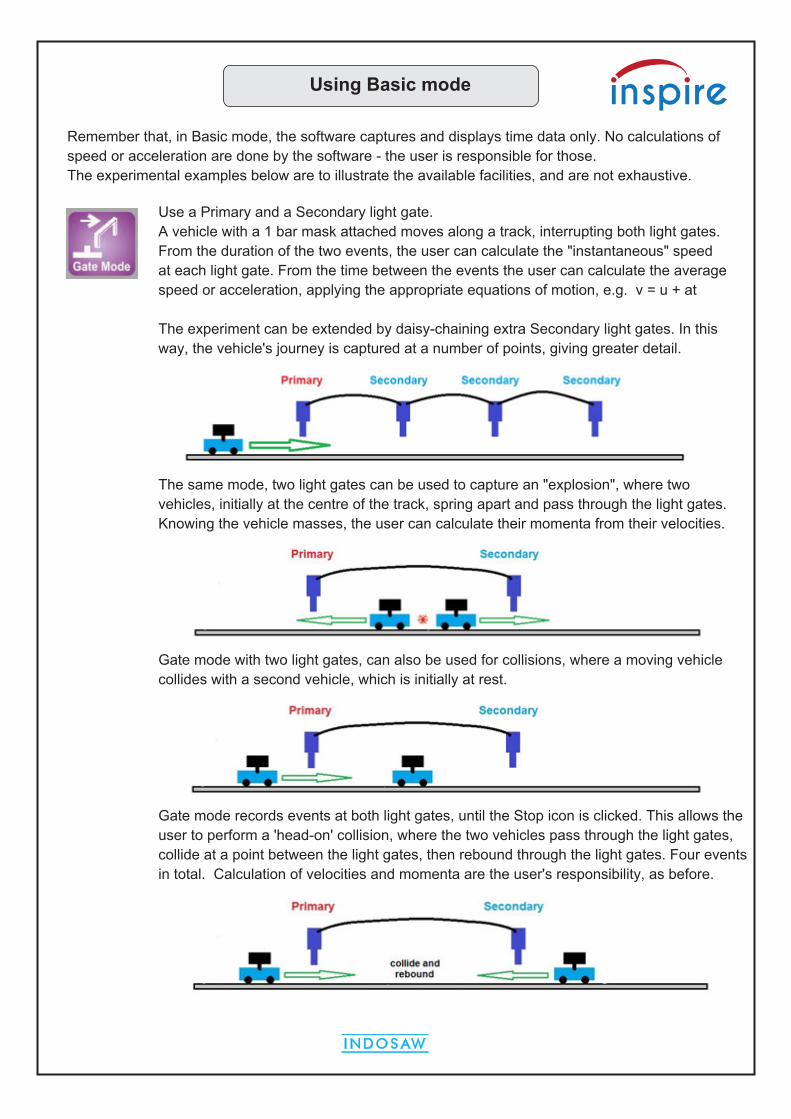
Remember that, in Basic mode, the software captures and displays time data only. No calculations of speed or acceleration are done by the software - the user is responsible for those.The experimental examples below are to illustrate the available facilities, and are not exhaustive.
Using Basic mode
Use a Primary and a Secondary light gate. A vehicle with a 1 bar mask attached moves along a track, interrupting both light gates. From the duration of the two events, the user can calculate the "instantaneous" speed at each light gate. From the time between the events the user can calculate the average speed or acceleration, applying the appropriate equations of motion, e.g. v = u + at The experiment can be extended by daisy-chaining extra Secondary light gates. In this way, the vehicle's journey is captured at a number of points, giving greater detail. The same mode, two light gates can be used to capture an "explosion", where two vehicles, initially at the centre of the track, spring apart and pass through the light gates.Knowing the vehicle masses, the user can calculate their momenta from their velocities. Gate mode with two light gates, can also be used for collisions, where a moving vehiclecollides with a second vehicle, which is initially at rest. Gate mode records events at both light gates, until the Stop icon is clicked. This allows the user to perform a 'head-on' collision, where the two vehicles pass through the light gates, collide at a point between the light gates, then rebound through the light gates. Four eventsin total. Calculation of velocities and momenta are the user's responsibility, as before.

Using Basic mode - continued
1 Gate mode: using a 2 bar mask, time difference is calculated from two consecutive interruptions as shown Time difference is calculated for consecutive interruptions at each connected light gate.
Using the dimensions of the 2 bar mask, users can calculate an average speed forthe moving object, during the events at each light gate. 1 Gate mode records events at both light gates, until the Stop icon is clicked. This method can be used for any of the experiments described in the previous page, and potentially gives greater accuracy than Gate mode, although the dimensions of the masks are important factors in the calculations.
2 Gate mode: using a 1 bar mask, time difference is calculated from two interruption events as shown, at two separate light gates. Using the distance between the light gates, the time between events, and the dimensionsof the mask, users have a choice of calculation method, using the equations of motion, tofind the average speed or acceleration. The software will collect data from several "runs", so experiments such as investigationof Newton's Second Law can be repeated with different masses providing the accelerating force, and all the data can be saved as one file. Clicking on Stop ends data collection for the session.
Remember that, in Basic mode, the software captures and displays time data only. No calculations of speed or acceleration are done by the software - the user is responsible for those. Advanced mode, accessed from the Home screen, provides templates for specific experiments, captures time data and includes calculation of results.

T 2lg
g 42 l
T2
=
=
Pendulum mode: supports a range of investigations into the behaviour of pendulums. In the experiment shown, the Primary Light Gate is fitted toa tall laboratory stand, using the rod attachment. Three pendulums of different lengths can be aligned with thelight gate, so that the bob interrupts the light gate as it swings. LaunchTimingPro software, and select Basic Connect the Primary Light Gate. Click on the Pendulum icon Set the pendulum swinging, making sure it does not hit the light gate. Click on to capture data. Click to end the session. A typical session, showing individual event times to the left of the graph, the regular pulse of the pendulum in the graph, and calculated periods for the pendulum in the table to the right. The time periods, T, can be used along with l, the length of the pendulum, to plot a graph. T vs l will give a curve, T² vs l will give a straight line, whose gradient should be 4π²/g thus verifying the formula Alternatively, values of T and l can be substituted in the formula to give a value for g, acceleration due to gravity. If a Primary and a Secondary light gate are aligned with the pendulum, two sets of data are captured. Do you expect the periods of the pendulum to be the same, regardless of the position of the light gate?
Using Basic mode: Pendulum

Using Basic mode - Frequency
Frequency measurementThe light gates and software are capable of capturing very rapid interruptions in the Frequency mode. With careful positioning, a guitar or violin string can be aligned with the light beam. When plucked or bowed, the string rapidly blocks and unblocks the light gate. A number of trials may be necessary to capture a clear sample. It might be necessary to slacken adjacent strings to make room for the light gate.Having the string close to the light gate aperture increases the chance of success. Zooming in on the graph will reveal sections of regular interruptions. Some typical frequencies: Bass guitar, low E = 41 Hz Guitar, low E = 82 Hz Violin, G string = 196 Hz In a similar way, the frequency of strings on a sonometer can be captured.
Frequency mode: captures the time data for a series of interruptions (events), countsthe number of interruptions per second, then calculates and displays the frequency in Hz. In the sample below, the data table to the left contains raw data for interruptions.The event graph shows the frequency increasing and the small table to the right shows thefrequencies calculated from the time data. Each frequency has an Exp No, which correlates with the data table, where the Exp Noappears next to the events that were used to calculate that frequency. Use Zoom in and the Cursor to explore the time values used to calculate any frequency.

Using Basic mode - Count
Count mode: interruptions of any connected light gates are timed, counted and totalled. The maximum counting period is 9999 seconds, a little over two and a half hours. The Primary Light Gate has a long battery life when fully charged, but connection to the charger is advisable to avoid loss of data in a long experiment session. Consider the following behavioural experiment.Two cages are connected by two tubes, both wide enough for a mouse to pass through.Light gates are placed so that they detect the mouse passing through either tube. One cage is warm,the other cold. Food is supplied inthe cold cage. The two tubes can be modified to test themouse's preferencesfor dark or light, rough orsmooth passage between the cages. However the tubes are modified, eg. by lining with sandpaper, or wrapping with black material, there must be apertures for the light gate beam to pass through. Events (mouse passing through) are timed and counted for both light gates, providing evidence of the mouse's behaviour and preferences. Count mode will find other applications, based on students' own experiment designs.

Advanced functions
From the Home screen, click on the Advanced icon
to reveal the Advanced functions:
The Advanced functions have dedicated screens with only the essential icons in the icon bar.The blue and brown icons remain the same for each function screen: So only the purple icons will be shown below.
There is a new icon, Setup, which allows the user to enter dimensions and select other parameters for each function

Advanced functions - continued
The distance between the light gates must be entered, and the dimensions of the mask. Click on Start A 2 bar mask passes through both light gates, to capture initial and final speeds, from which the acceleration is calculated. The software times out after one capture.
The dimensions of the mask must be entered. Click on Start A 3 bar mask passes through a light gate, and the acceleration is calculated. Click on Stop OR The software times out when it has capturedfour accelerations.

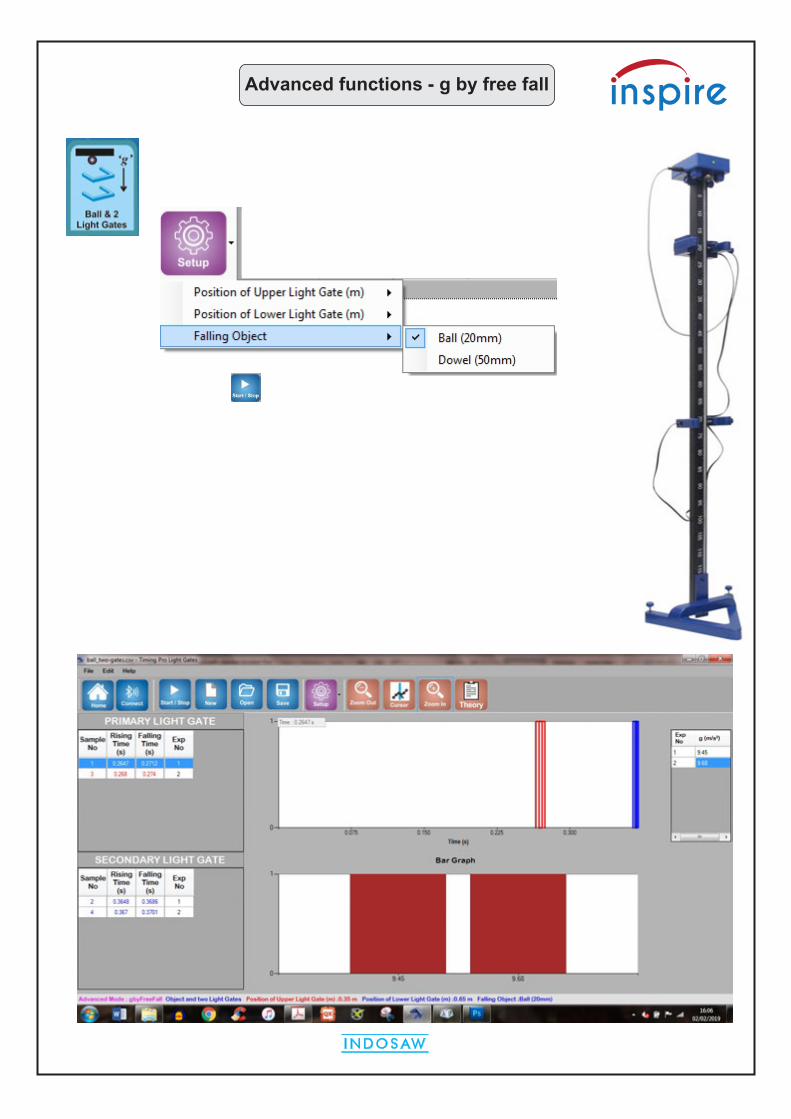
Advanced functions - g by free fall
Clicking on this icon reveals three different methods for determining g.
For each drop, which can be from a range of heights entered via Setup, the software calculates a value of g.A point is added to the graphs of h vs t and h vs t² The coefficient of t² in h vs t is ½ g and the gradient of the h vs t² graph is also ½ g. In the example above, that is 4.84, giving a value for g of 9.68 m/s²

'g' by Free Fall Stand.
Advanced functions - g by free fall
Clicking on New will clear the results. Clicking on Start, without clicking New, allows for results to be addedto the data tables and overlaid in the graph. New data is identified as Exp No 2, Exp No 3 etc.Zoom in and the Cursor provide tools for exploring the data in detail.
The same screen displays results from using the Fence mask with the g by Free Fall apparatus.When Start is clicked, the solenoid releases the Fence mask to fall through the Primary Light Gate. This description also applies to the Fence mode, when used directly from the Advanced menu screen.
Advanced functions - g by free fall
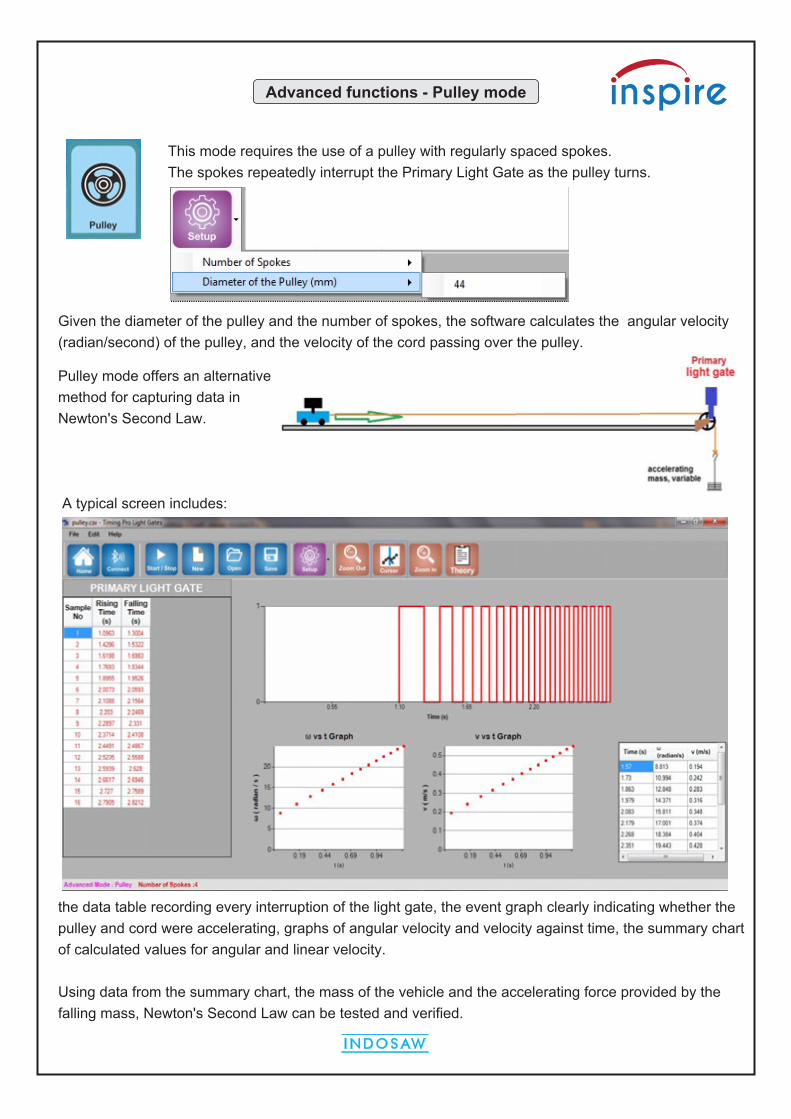
Advanced functions - Pulley mode
This mode requires the use of a pulley with regularly spaced spokes. The spokes repeatedly interrupt the Primary Light Gate as the pulley turns. Given the diameter of the pulley and the number of spokes, the software calculates the angular velocity (radian/second) of the pulley, and the velocity of the cord passing over the pulley.
Pulley mode offers an alternative method for capturing data in Newton's Second Law. A typical screen includes: the data table recording every interruption of the light gate, the event graph clearly indicating whether thepulley and cord were accelerating, graphs of angular velocity and velocity against time, the summary chart of calculated values for angular and linear velocity. Using data from the summary chart, the mass of the vehicle and the accelerating force provided by the falling mass, Newton's Second Law can be tested and verified.

Suggested experiments
Daisychaining On page 11, we described how a number of Secondary Light Gates can be connected to the Primary Light Gate, to capture more detailof the vehicle's journey. It is for the user to decide, how they want their data to appear in the tables and event graph. Loop the loop - car on a vertical circular trackThe car needs to be fitted with a suitable mask - black card attached using BluTac is ideal.The light gates can be daisy-chained and positioned to capture the car's speed as it enters the loop, and its speed as it passes through the top of the loop. If more light gates are available, the speed of the car can be captured at different points withinthe loop and as it exits the loop. Knowing the speed on entry and exit, the car's energy can be calculated - how much is lost as it loops the loop?How does this compare with the car's potential energy at the top of the loop? The mask that interrupts the light gate is not moving in a straight line. How much error does this introduce? PendulumAn alternative pendulum can be created, using a metre rule with a hole near one end, supported on a metal pivot so that it can swing freely. The lower end of the rule can be aligned so that it swings through the light gate. With minimal prompting, students must find the period of the pendulum and (assuming the value of g) check that the formula agrees with their result. They need to realise that the length of this pendulum is NOT the distance from the pivot to the lower end, but is the distance from the pivot to the centre of gravity of the rule. Once this is taken into account, the formula and pendulum should agree.
T 2lg
=

Curriculum references
Using the Light Gates and TimingPro software supports and contributes to the following practical requirements of A-level Physics syllabuses. Edexcel Core Practical 1: Determine the acceleration of a freely falling object.Students should:10. be able to draw and interpret displacement-time, velocity-time and acceleration-time graphs Edexcel Core practical 9: Investigate the relationship between the force exerted on an object and its change of momentum (Newton's second law).Topic 2: Mechanics 22. know the principle of conservation of linear momentum, understand how to relate this to Newton’s laws of motion and understand how to apply this to problems in one dimension. 28. know, and understand how to apply, the principle of conservation of energy including use of work done, gravitational potential energy and kinetic energy. Topic 6: Further Mechanics 97. understand how to use the equation, impulse = FΔt =Δp (Newton’s second law of motion)99. understand how to apply conservation of linear momentum to problems in two dimensions. 101. understand how to determine whether a collision is elastic or inelastic. Practical techniques:3. Use methods to increase accuracy of measurements, such as timing over multiple oscillations, or use of fiduciary marker, set square or plumb line. 11. Use ICT such as computer modelling, or data logger with a variety of sensors to collect data, or use of software to process data. AQA Required practical 3: Determination of g by a free-fall method.3.4.1.3 Motion along a straight line Measurements and calculations from displacement–time, velocity–time and acceleration–time graphs3.4.1.5 Newton’s laws of motion. Students can verify Newton’s second law of motion. 3.4.1.6 Momentum. Conservation of linear momentum. Applied quantitatively to problems in one dimension.Elastic and inelastic collisions; explosions. Impact forces are related to contact times (eg kicking a football, crumplezones, packaging). Apply conservation of momentum and rate of change of momentum to a range of examples. 3.4.1.8 Conservation of energy. Quantitative and qualitative application of energy conservation to examples involving gravitational potential energy, kinetic energy, work done against resistive forces. 3.6.1.2 Simple harmonic motion. Analysis of characteristics of simple harmonic motion (SHM). Graphical representations linking the variations of displacement, velocity and acceleration with time. MS 0.3, 1.2, 3.7 / AT d Students should be able to identify random and systematic errors in the experiment and suggest ways to remove them.MS 3.9 Determine g from a graph. OCR Practical Activity Group 1 Investigating motion - Acceleration of free fall. 3.1.2 Linear motion (b) (i) acceleration g of free fall (b) (ii) techniques and procedures used to determine the acceleration of free fall using trapdoor and electromagnet arrangement or light gates and timer. OCR Practical activity 10: Simple harmonic motion Investigating the factors affecting the period of a simple harmonic oscillator.3.5.1 Newton’s laws of motion 3.5.2 Collisions: the principle of conservation of momentum Techniques and procedures used to investigate the motion and collisions of objects. 5.3.1 Simple harmonic oscillations: graphical methods to relate the changes in displacement, velocity and acceleration during simple harmonic motion. HSW4 Carry out experimental and investigative activities including risk management, in a range of contexts.HSW6 Evaluate methodology, evidence and data, and resolve conflicting evidence.