timing of network deployment and use - home - ofcom · timing of network deployment and use ....
TRANSCRIPT
Application of spectrum liberalisation and trading to the mobile sector – A further consultation
Annex 12
1 Timing of network deployment and use Introduction
A12.1 This Annex considers the main timing inputs we use in our analysis. These are:
ranges of likely timings for the deployment and use of mobile broadband technologies in the frequency bands of interest to this consultation
illustrative network roll-out profiles for the deployment of mobile broadband networks, using the frequency bands of interest, for a number of different sizes of network (long-run number of sites) and deployment strategies
A12.2 These inputs are important for our analysis because, as a consequence of our decision to liberalise spectrum, operators with 900 MHz spectrum may be able to provide mobile broadband services at a lower cost, or to higher quality than operators without it. However, in the future, 800 MHz spectrum is likely to become available, and this may be used to provide similar services at a similar cost.
A12.3 The timing inputs presented here are used in the cost difference analysis, and in the competition effects modelling (Annex 9). The latter examines the consequences if use of 900 MHz spectrum does provide better quality, and access to 900 MHz turns out to be restricted to a small number of operators. The period during which 900 MHz spectrum may be in use, but 800 MHz spectrum may not, is of particular significance for that analysis.
A12.4 We have sought advice from relevant experts and, when possible, also used information from operators to inform the inputs used here. However, these inputs are subject to considerable uncertainty. For this reason, we have produced ranges for all dates of interest, rather than precise forecasts.
Overview
A12.5 In this Annex, we:
Identify milestones of relevance to the analysis
Identify the sequence of events and processes that will need to happen if those milestones are to be reached, and their dependencies
Identify inputs detailing when each of these events may occur
Chart inputs and dependencies in Gantt charts
Arrive at likely timings for the deployment of technologies in bands of interest
Describe our methodology for developing roll-out profiles
Present our list of illustrative roll out profiles
1

Application of spectrum liberalisation and trading to the mobile sector – A further consultation
A12.6 The sections on inputs, dependencies and Gantt charts show how we arrive at results in a great deal of detail. Readers that are interested mainly in the consequences for other parts of the analysis may skip these and read only the milestones, conclusions and roll out profiles sections.
Milestones of relevance to the analysis
A12.7 This section describes the main milestones that are relevant to our analysis.
A12.8 We have focused on specific technologies that are likely to use liberalised 900 MHz and 800 MHz spectrum. These are UMTS 9001, and LTE 8002.
A12.9 The milestones for each of these technologies are:
When the service could be used by early adopters at an initial level of service. As an example of what this initial level of service may be, we consider deployment in urban and dense urban areas.
When the service could be used by early adopters, at a full level of service, covering also suburban areas.
When the service might be adopted by almost all data users.
A12.10 The competition effects analysis uses these milestones to identify a period of reduced competitive intensity during which only operators with 900 MHz spectrum are able to provide a high quality mobile broadband service and operators with only higher frequency spectrum are at a competitive disadvantage. The period of reduced competitive intensity is assumed to begin when incumbent operators start providing high quality mobile broadband using 900 MHz spectrum and end when other operators provide a comparable high quality mobile broadband service using 800 MHz spectrum.
A12.11 The cost difference analysis is concerned with these milestones because 900 MHz and 800 MHz spectrum allow deployment of services with a lower number of sites than 2100 MHz spectrum does, under a number of scenarios. The cost difference analysis uses these milestones to identify the dates at which operators may be able to start deploying networks using either 900MHz or 800MHz spectrum, the dates at which they may then be able to stop expanding their 2100 MHz networks, and the dates later on when they may be able to decommission parts of their 2100 MHz networks.
Dependencies
A12.12 This section explains the main processes and events that need to take place before a given level of service can be offered or take-up achieved.
1 It is also a possibility that 900 MHz could be used for LTE, rather than UMTS. This is captured under the economic analysis where we consider the possibility that UMTS 900 is not rolled out. In this case, the competition effects and cost difference analysis become trivial, and we do not need a separate scenario. 2 i.e. a future 800 MHz version of the 3rd generation partnership project (3GPP) standard for Evolved Universal Terrestrial Radio Access
2

Application of spectrum liberalisation and trading to the mobile sector – A further consultation
A12.13 A service will be in use when three inputs are in place: spectrum, user equipment (including handsets and dongles), and network. Each of these is also dependent on other events.
UMTS 900
A12.14 Figure 1 shows a high level view of the main processes, events and dependencies required for UMTS 900 to be in use and is explained in more detail below. The chart shows three direct dependencies for the service to be in use: spectrum, network and user equipment. Each of these have their own dependencies:
Spectrum depends on our decision on liberalisation and on the necessary time for 900 MHz incumbents to clear existing GSM 900 use.
The network will be ready after an operator has time to deploy a sufficient number of sites with UMTS 900 equipment, and test and optimise these sites (UMTS 900 netowrk equipment is already available) Before starting deployment, operators need certainty about access to liberalised spectrum, which comes from our decision to liberalise (for an incumbent), or a spectrum auction (for someone acquiring some 900 MHz spectrum, if there is such an auction). Finally, before they can start testing the network, the spectrum needs to be clear and available for use.
User equipment needs to be in the hands of users in order for them to benefit from use of the new network. Therefore there has to be sufficient time for UMTS 900 capable 3G handsets, dongles and data cards to be taken up by users. UMTS 900 capable user equipment is available but the great majority of user equipment currently in use does not support UMTS 900.
3

Application of spectrum liberalisation and trading to the mobile sector – A further consultation
Figure 1 - Processes, events and dependencies preceding use of UMTS 900
LTE 800
Service in use
Spectrum is ready
Network is ready User equipment in hands of
users
Our decision Users take up user equipment
Auction (if we are looking
at acquirer)
Certainty about spectrum
Time to deploy sufficient
number of sites
Time to clear spectrum
Time to test/optimise
network
Legend
Dependency
Process or
A12.15 Figure 2 shows the main dependencies for LTE 800, explained in more detail below. As in the previous example, each of the main inputs needed for service has its own dependencies:
Spectrum depends on the Digital Switchover (DSO) process, and on international negotiations to determine how spectrum can be used for potential mobile use.
The network will be ready after an operator has time to deploy a sufficient number of sites, and test and optimise these sites. Before starting deployment, they need certainty about access to the spectrum, which should come from the Digital Dividend spectrum auction. They also need network equipment, which does not yet exist for LTE 800. Network equipment will be available after standards for LTE 800 are finalised, and manufacturers have sufficient time to start production. Finally they need to be able to use the spectrum in order to test the network.
User equipment needs to be in the hands of users. Again, user equipment for this band does not exist yet. Therefore, there has to be sufficient time for standards to be agreed by the industry, followed by sufficient time for the industry to make equipment available, and for equipment to be adopted by users.
4

Application of spectrum liberalisation and trading to the mobile sector – A further consultation
Figure 2 - Processes, events and dependencies for use of LTE 800
Inputs
A12.16 This section lists plausible dates and durations for the events and processes shown under the “dependencies” section. Where there are some uncertainties over timing we present a range. These are then combined in the next section in Gantt charts.
A12.17 We show below the inputs we use for UMTS 900.
Service in use
Network is ready User equipment in the hands of users
Auction of 800 MHz
Users take up user equipment
Certainty about spectrum
Time to deploy sufficient number of
sites
DSO / international negotiations
Standards for LTE 800 agreed
Network manufacturer lead
time
User equipment manufacturer lead
time
Network equipment available
User equipment available
Time to test /optimise network
Spectrum is ready
Legend
Process or event
Dependency
5

Application of spectrum liberalisation and trading to the mobile sector – A further consultation
Table 1 - Inputs – UMTS 900
Input Value Our decision Mid 2009 / end 2009 Time to organise an auction 1 year Time for clearing – no intervention 18 months – 2 years Time for clearing – intervention 2 years User equipment take-up (by early adopters) No later than mid – 2011 User equipment take-up (by majority of data users)
Mid 2013 (or 2.5 years after equipment adoption by early adopters)
Time to deploy first sites (in urban / dense urban areas) after certainty about spectrum
No longer than 2 years
Time to test and optimise first sites, (in urban / dense urban areas) and requiring full use of cleared spectrum (ie excluding everything that can be done before spectrum is fully cleared)
6 months – 1 year
Time to deploy sites areas across entire 80% population area
3 – 4 years
A12.18 We present below the rationale behind each of these inputs:
A12.19 Our decision. The range allows for the time to incorporate responses to this consultation into our analysis and decision.
A12.20 Time to organise an auction. This is based on our experience on auctions and our expectations of the complexity of the process.
A12.21 Time for clearing. We have examined the work likely to be involved in clearing spectrum in Annex 16. The time required is likely to be linked to the quantity of spectrum to be cleared. If we do not mandate any release, and in the event that each of the two operators will clear a block for their own use, the tasks required seem to be possible to complete in 18 months. We use 2 years as a conservative maximum time. If we mandate one block release, two years are likely to provide sufficient time for clearing.
A12.22 User equipment take-up for early adopters. We reproduce below an illustration of how take up of UMTS 900 capable equipment could grow (Figure 3). This illustrative chart was produced using a 20 month average user equipment replacement cycle. This is an example figure based on typical contract lengths of 18 months for handsets and 24 months for dongles and assumes that consumers with the most interest in mobile data are likely to upgrade their equipment at end of contract. In each given year, a growing proportion of customers replacing user equipment (handsets or dongles) would acquire a UMTS 900 capable replacement. This yearly proportion is shown below as a line; the bars show the accumulated total number of UMTS 900 capable devices in use.
6

Application of spectrum liberalisation and trading to the mobile sector – A further consultation
Figure 3 – Illustrative take-up of UMTS 900 capable user equipment
0%
10%
20%
30%
40%
50%
60%
70%
80%
90%
100%
2008 2009 2010 2011 2012 2013 2014 2015
UMTS 900 take up over total subscribers of a 900 MHz operator
User equipment is Early adopters have UMTS 900
Most data users have UMTS 900 mostly UMTS 2100 - only
UMTS 900 capable handsets / dongles as % of equipment in use
UMTS 900 capable as % of handsets / dongles acquired in a given year
A12.23 We believe that those users who use data the most, and care most about the quality of user experience in mobile data will be among the first to migrate to UMTS 900, as they have the most incentive to do so. One plausible view of market segmentation is that around 10%3 of users may form this category.
A12.24 The illustrative timeline above shows that a group this size could have UMTS 900 handsets as early as 2010. We conservatively use mid-2011 as an input. It is possible that adoption could happen earlier, but it turns out that earlier adoption would not impact the analysis, as there are other constraints in the critical path (as shown later in the Gantt charts).
A12.25 User equipment take-up for almost all data users. The sources for segmentation of users mentioned above suggest that around half of mobile subscribers are not likely to use data services, even in the medium term. Therefore, it is possible that all data users will be equipped with UMTS 900 capable devices at some point shortly after take up of UMTS 900 capable devices grows above 50% of the subscriber base. We think that there is ample opportunity for most data users to have taken up UMTS 900 capable devices by 2013, or around 2.5 years after take up by early adopters, as shown in Figure 3.
A12.26 Time to deploy sites in urban / dense urban areas. This process starts from the point at which an operator starts planning the network, which could be at the time of spectrum certainty, or even before, if the operator is sufficiently interested in deploying mobile broadband. We use two years to account for this initial deployment. We assume that the number of sites required in these areas should be
3 This has been checked against, and is broadly consistent with the following sources: Analysys, “3G Network Evolution from 2007 to 2012: HSPA+, LTE, WiMAX and femtocells”; Arthur D.Little, “In the eye of the telecom-media storm”, 27 March 2008 Point Topic “Mobile Broadband Survey – Future usage
7
Application of spectrum liberalisation and trading to the mobile sector – A further consultation
no greater than 2,000 sites, as shown in Annex 13 (for the higher demand scenario).
A12.27 Time to test / optimise first sites (in urban / dense urban areas), following spectrum clearance. Network operators could potentially start installing equipment as soon as they have certainty about spectrum use. However, the equipment needs to be tested and optimised using cleared spectrum. We expect that there will be a gap between spectrum availability and the time when sites in the main urban and dense urban areas can be put to full use. We expect that operators would be able to start planning the network before the spectrum is cleared, and possibly visiting sites to start equipment installation. We believe the network could be in full use between 6 months and one year after spectrum clearance.
A12.28 In considering this timing we have taken account of the fact that operators may be conducting engineering works to allow spectrum clearance at the same time, as described in Annex 16. We do not believe that this concurrent work is likely to create significant delays in the timeline for deployment of UMTS 900, as site visits motivated by spectrum clearance could also be used to install UMTS 900 equipment.
A12.29 Time to deploy sites in urban, dense urban and suburban areas We expect that the number of sites needed should be not much more than 7,000 sites (as in the results in Annex 13 for the higher demand scenario).
A12.30 There are limits on the number of sites that can be deployed per year, because of practical difficulties of resourcing site visits, and for completely new sites, acquiring the physical site. These limits are looser for upgrades than they are for new sites.
A12.31 We believe that a reasonable assumption is that operators are able to deploy up to 1,500 new sites or 3,000 upgrades per year, or any combination of the two. However a more moderate pace would be 1,000 new sites, or 2,000 upgrades a year; we will calculate results for both. We believe that these numbers are broadly consistent with real world business plans, based on information provided to us by operators.
A12.32 Accounting again for the initial time for planning the network, and the number of sites mentioned above, we find that deploying the network is likely to take a total time of between 3 and 4 years.
A12.33 The Gantt charts for LTE 800 uses similar inputs, and some additional inputs shown below:
8

Application of spectrum liberalisation and trading to the mobile sector – A further consultation
Table 2 - Additional inputs – LTE 800
Input Value Auction 2010 Spectrum ready to be used Late 2012 – end 2013 LTE 800 standards completed Mid 2010 – mid 2011 Network manufacturer lead time (from standard to equipment available)
6 – 18 months
User equipment manufacturer lead time 1 – 2.5 years
User equipment take-up (by early adopters – 10% of subscribers) – assuming that 800 MHz operator will promote rapid take-up to catch up with 900 MHz operator
1.5 years
User equipment take-up (by majority of data users)
2.5 years after take up by early adopters
A12.34 Auction We are presently working towards organising auctions for the Digital Dividend spectrum. This process is still in progress. We currently believe that the relevant auction is likely to occur during 2010. (see http://www.ofcom.org.uk/consult/condocs/800mhz/)
A12.35 Spectrum ready to be used. The range shown here is for UK-wide use of the spectrum. The earliest date reflects the timing for the Digital Switchover process which is expected to conclude for the UK in late 2012. The actual date of availability will depend on whether Ofcom proceeds with its proposals to re-organise the frequencies covered by the digital dividend so that the whole of 790-862 MHz is made available4. If those proposals are adopted then the whole of the band will not be made available until a later date. The end of 2013 has been used below as a reasonable estimate of when that might be. However, it is possible that some of the band could be made available earlier as the process and time which will be needed to clear the band varies between different channels.
A12.36 LTE 800 standards completed. We expect that LTE at 800 MHz is not likely to be part of release 9 of the 3GPP LTE standards, which is expected by around end of 2009. The standardisation is likely to have to wait for current work at CEPT. Overall, we believe that between mid 2010 and mid 2011 is a reasonable range for this milestone.
A12.37 Network equipment manufacturer lead time. This measures the gap between standards completion and standards-compliant network equipment being made available. We think this is subject to some uncertainty, and we use a wide range of between 6 months and 18 months.
A12.38 User equipment manufacturer lead time. This measures the gap between standards completion and user equipment being available, with sufficient choice so that it is attractive to consumers. Because of the larger scale of production, and more complex issues surrounding consumer choice, we think this lead time is longer and more uncertain than for network equipment. We use a range between one and two and a half years to reflect this added uncertainty.
A12.39 User equipment take-up (for early adopters). The overall arguments are similar to those in the UMTS 900 case. However, we use a shorter time scale in this case (1.5
4 see www.ofcom.org.uk/consult/condocs/800MHz
9

Application of spectrum liberalisation and trading to the mobile sector – A further consultation
years), as the 800 MHz operator would be likely to be under pressure to catch up with a 900 MHz competitor who has launched earlier. Under these circumstances, they are more likely to use strategies to encourage user equipment take up, for those subscribers who care most about mobile data.
A12.40 User equipment take-up (for majority of data users). As described in the UMTS 900 case.
Gantt charts
A12.41 The dependencies and inputs shown in the previous sections can be put together in Gantt charts in order to generate results. We generate separate Gantt charts covering the scenarios described below. For each scenario, we provide an early version of the scenario, and a late version, to derive a range.
Scenario Spectrum band Option Operator Early / late version
A 900 MHz Liberalisation in hands of incumbents
Incumbent Early
B 900 MHz Liberalisation in hands of incumbents
Incumbent Late
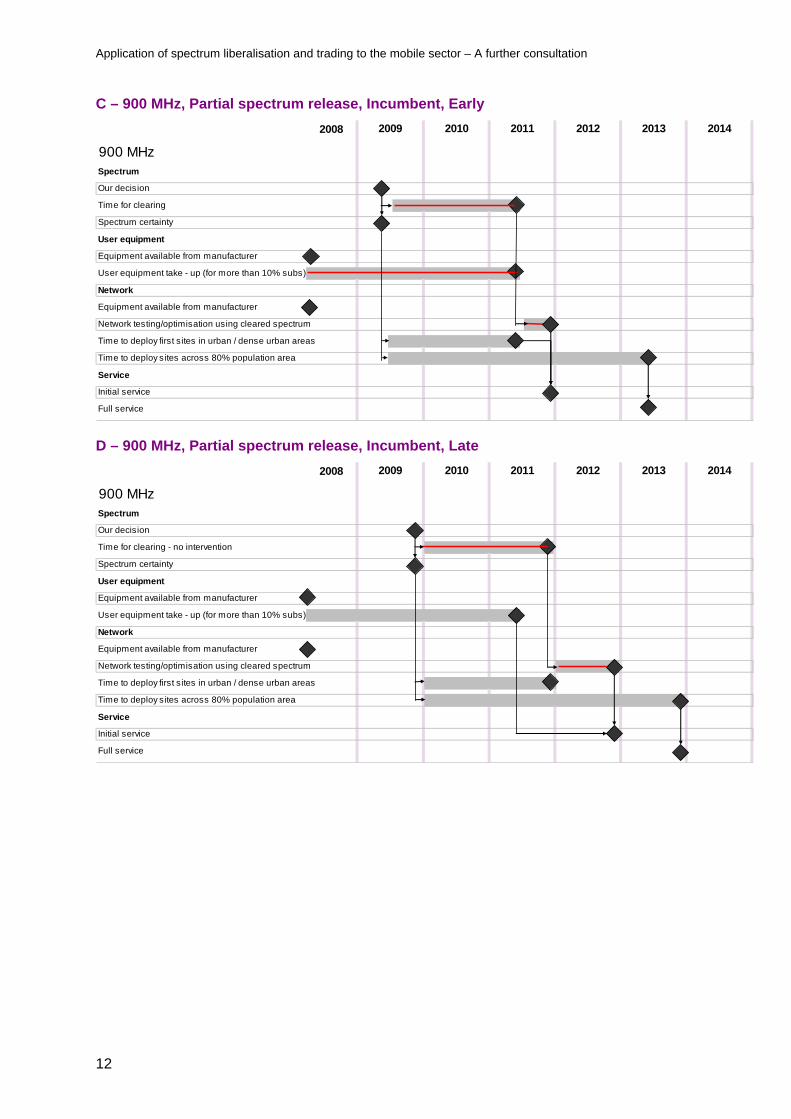
C 900 MHz Partial spectrum release
Incumbent Early
D 900 MHz Partial spectrum release
Incumbent Late
E 900 MHz Partial spectrum release
Acquirer Early
F 900 MHz Partial spectrum release
Acquirer Late
G 800 MHz Any Acquirer Early
H 800 MHz Any Acquirer Late
A12.42 Each of the Gantt charts that follow highlights the critical path (for the initial level of service) in red, and shows the points at which the initial level of service (in urban / dense urban areas) and full level of service (including suburban) are reached.
A12.43 The charts show milestones, processes and dependencies as illustrated in Figure 4 below. Some dependencies are omitted for legibility, but should be readily understandable in the context. For the full list of dependencies, refer to the dependencies section.
Figure 4 – Key to Gantt charts
A12.44 Milestone Task/ process Critical path Dependency
10

Application of spectrum liberalisation and trading to the mobile sector – A further consultation
A – 900 MHz, Liberalisation in hands of incumbents, Incumbent, Early
2008
900 MHz Spectrum
Our decision
Time for clearing
Spectrum certainty
User equipment
Equipment available from manufacturer
User equipment take - up (for more than 10% subs)
Network
Equipment available from manufacturer
Network testing/optimisation using cleared spectrum
Time to deploy first sites in urban / dense urban areas
Time to deploy sites across 80% population area
Service
Initial service
Full service
2009 2010 2011 2012 2013 2014
B – 900 MHz, Liberalisation in hands of incumbents, Incumbent, Late
2008
900 MHzSpectrum
Our decision
Time for clearing - no intervention
Spectrum certainty
User equipment
Equipment available from manufacturer
User equipment take - up (for more than 10% subs)
Network
Equipment available from manufacturer
Network testing/optimisation using cleared spectrum
Time to deploy first sites in urban / dense urban areas
Time to deploy sites across 80% population area
Service
Initial service
Full service
2013 20142009 2010 2011 2012
11
Application of spectrum liberalisation and trading to the mobile sector – A further consultation
C – 900 MHz, Partial spectrum release, Incumbent, Early
2008
900 MHz Spectrum
Our decision
Time for clearing
Spectrum certainty
User equipment
Equipment available from manufacturer
User equipment take - up (for more than 10% subs)
Network
Equipment available from manufacturer
Network testing/optimisation using cleared spectrum
Time to deploy first sites in urban / dense urban areas
Time to deploy sites across 80% population area
Service
Initial service
Full service
2013 20142009 2010 2011 2012
D – 900 MHz, Partial spectrum release, Incumbent, Late
2008
900 MHzSpectrum
Our decision
Time for clearing - no intervention
Spectrum certainty
User equipment
Equipment available from manufacturer
User equipment take - up (for more than 10% subs)
Network
Equipment available from manufacturer
Network testing/optimisation using cleared spectrum
Time to deploy first sites in urban / dense urban areas
Time to deploy sites across 80% population area
Service
Initial service
Full service
2009 2010 2011 2012 2013 2014
12

Application of spectrum liberalisation and trading to the mobile sector – A further consultation
E – 900 MHz, Partial spectrum release, Acquirer, Early
2008
900 MHz Spectrum
Our decision
Time for clearing
Auction / Spectrum certainty
User equipment
Equipment available from manufacturer
User equipment take - up (for more than 10% subs)
Network
Equipment available from manufacturer
Network testing/optimisation using cleared spectrum
Time to deploy first sites in urban / dense urban areas
Time to deploy sites across 80% population area
Service
Initial service
Full service
2013 20142009 2010 2011 2012
F – 900 MHz, Partial spectrum release, Acquirer, Late
2008
900 MHz Spectrum
Our decision
Time for clearing
Auction / Spectrum certainty
User equipment
Equipment available from manufacturer
User equipment take - up (for more than 10% subs)
Network
Equipment available from manufacturer
Network testing/optimisation using cleared spectrum
Time to deploy first sites in urban / dense urban areas
Time to deploy sites across 80% population area
Service
Initial service
Full service
2009 2010 2011 2012 2013 2014
13

Application of spectrum liberalisation and trading to the mobile sector – A further consultation
G – 800 MHz, Early
2008
800 MHzSpectrum
Auction
Spectrum certainty
Spectrum ready to be used
Standardisation
LTE 800 standardisation
User equipment
Equipment available from manufacturer
User equipment take - up (for more than 10 % subscribers)
Network
Equipment available from manufacturer
Network testing/optimisation using cleared spectrum
Time to deploy sites in urban / dense urban areas
Time to deploy sites across 80% population area
Service
Initial service
Full service
2013 2014 20152009 2010 2011 2012
H – 800 MHz, Late
2008
800 MHzSpectrum
Auction
Spectrum certainty
Spectrum ready to be used
Standardisation
LTE 800 standardisation
User equipment
Equipment available from manufacturer
User equipment take - up (for more than 10 % subscribers)
Network
Equipment available from manufacturer
Network testing/optimisation using cleared spectrum
Time to deploy sites in urban / dense urban areas
Time to deploy sites across 80% population area
Service
Initial service
Full service
2009 2010 2011 2012 2013 2014 2015
Likely timings for the deployment of technologies in bands of interest
A12.45 We show here the main conclusions for the competition effects analysis and the cost difference analysis. As described previously, the competition effects analysis is concerned with the existence of a period of reduced competition, when a limited number of operators with 900 MHz spectrum may be able to offer a differentiated service, before operators with 800 MHz spectrum can do likewise.
A12.46 Table 3 and Table 4 summarise the main conclusions of the Gantt analysis, from this point of view.
14

Application of spectrum liberalisation and trading to the mobile sector – A further consultation
Table 3 Conclusions of interest for the competition effects analysis: Milestones for use of 900 MHz if we were to liberalise in the hands of the incumbents
Milestone Early date Late date Initial service (in urban / dense urban areas)
Mid 2011 End 2012
Full service (including suburban areas)
Mid 2013 End 2013
Table 4 - Conclusions of interest for the competition effects analysis: Milestones for use of 800 MHz
Milestone Early date Late date Initial service (in urban / dense urban areas)
Mid 2013 Mid 2015
Full service (including suburban areas)
Mid 2014 End 2015
A12.47 Note that, when an operator with 800 MHz spectrum launches an initial level of service (mid 2013-mid 2015), the UMTS 900 network is already reaching full service (mid 2013-end 2013)). Therefore, the operator with 800 MHz spectrum is only able to catch up when they too are able to move to full service (mid 2014-end 2015).
A12.48 On the basis of this analysis, the maximum time during which an operator with 900 MHz spectrum would be ahead is 4.5 years (between UMTS 900 launching an initial service early in mid 2011, and LTE 800 reaching a developed level of service at end of 2015).
A12.49 The minimum time would be 1.5 years (between end of 2012 for UMTS 900, and mid 2014 for LTE 800).
Methodology for developing roll out profiles
A12.50 Having determined the likely timing ranges for deployment of mobile broadband technologies in the various frequency bands of interest, we now go on to develop illustrative network roll-out profiles for the deployment of mobile broadband networks. These roll-out profiles consider each of the frequency bands of interest, a number of different sizes of network (long-run number of sites) and are used for different comparisons. These network roll-out profiles form an essential input to our assessment of the differences in the costs to deploy and operate various scales of mobile broadband network, using spectrum in different frequency bands.
A12.51 This section explains the methodology for setting up illustrative roll-out profiles, the main variables used and their values.
A12.52 Our main interest is in understanding the differences in cost of mobile broadband networks built to deliver essentially the same level of service but using spectrum in different frequency bands. The majority of our analysis is therefore concerned with pairs of network roll-out profiles – one for each of two different operators, having access to different bands of spectrum, both of whom are faced with the challenge of remaining competitive in the face of network enhancements by the other. These pairs of roll out profiles are intended to represent networks that match the same level of quality, on a year-by-year basis. For this reason, we refer to these comparisons as “matching” comparisons.
15
Application of spectrum liberalisation and trading to the mobile sector – A further consultation
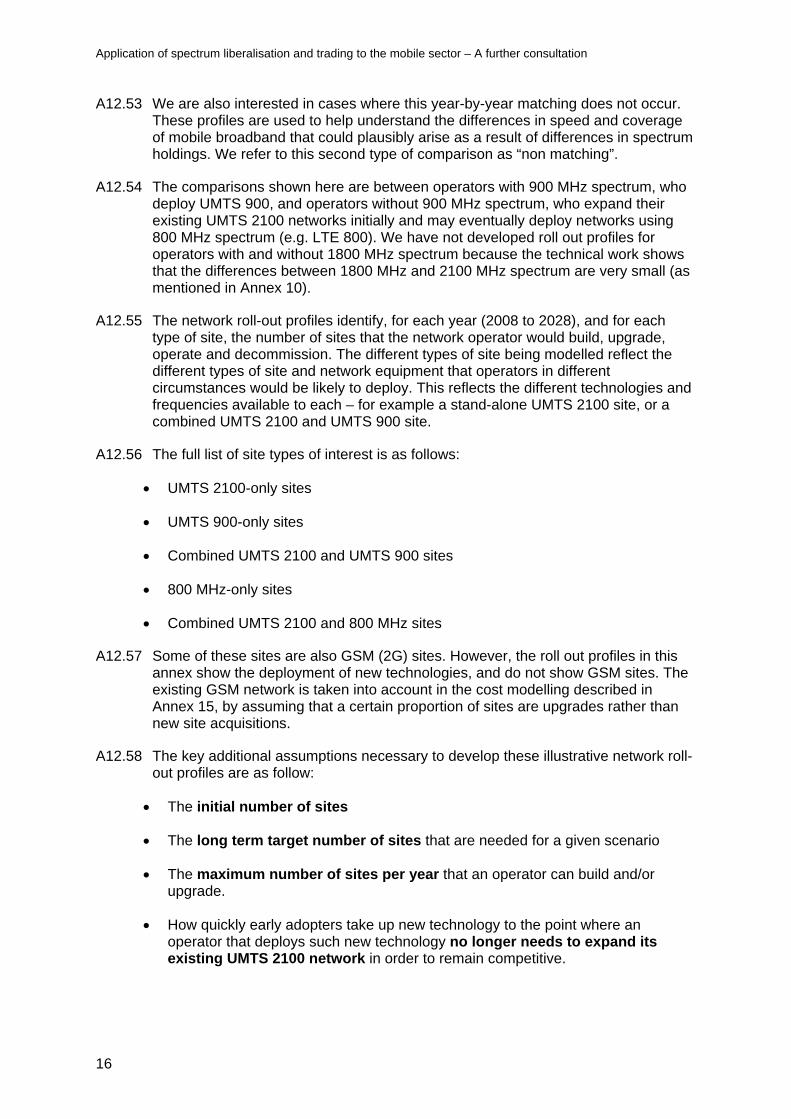
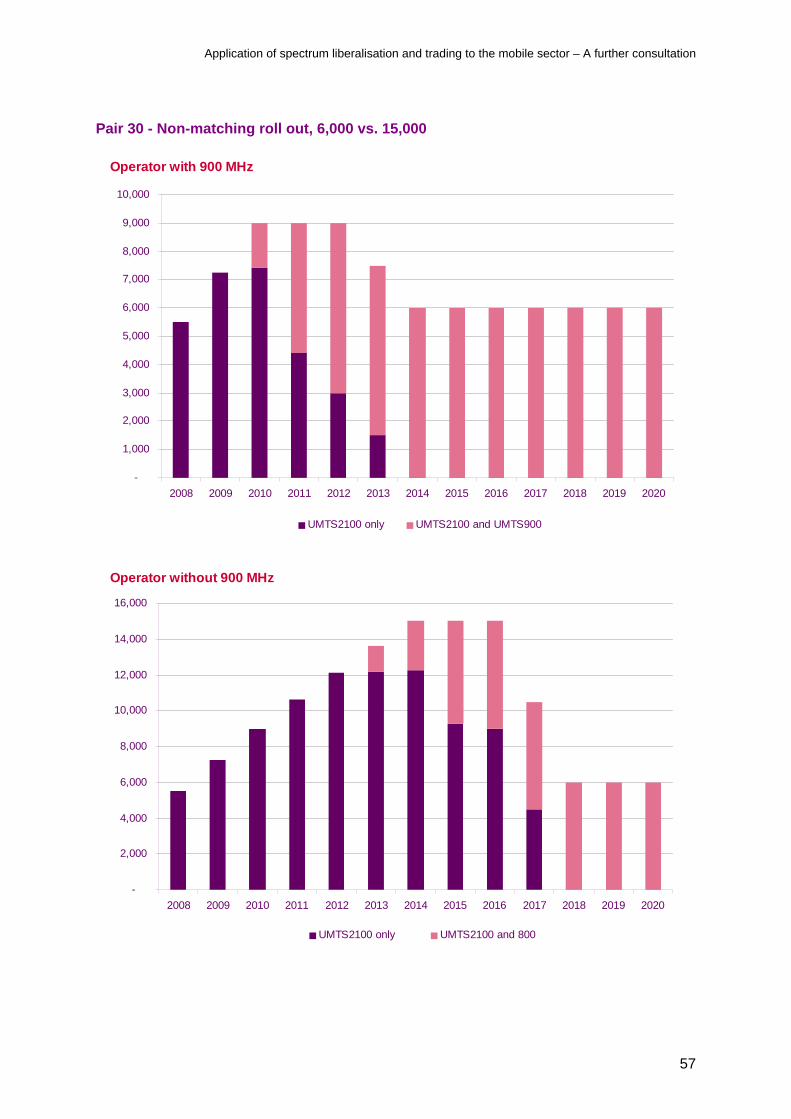
A12.53 We are also interested in cases where this year-by-year matching does not occur. These profiles are used to help understand the differences in speed and coverage of mobile broadband that could plausibly arise as a result of differences in spectrum holdings. We refer to this second type of comparison as “non matching”.
A12.54 The comparisons shown here are between operators with 900 MHz spectrum, who deploy UMTS 900, and operators without 900 MHz spectrum, who expand their existing UMTS 2100 networks initially and may eventually deploy networks using 800 MHz spectrum (e.g. LTE 800). We have not developed roll out profiles for operators with and without 1800 MHz spectrum because the technical work shows that the differences between 1800 MHz and 2100 MHz spectrum are very small (as mentioned in Annex 10).
A12.55 The network roll-out profiles identify, for each year (2008 to 2028), and for each type of site, the number of sites that the network operator would build, upgrade, operate and decommission. The different types of site being modelled reflect the different types of site and network equipment that operators in different circumstances would be likely to deploy. This reflects the different technologies and frequencies available to each – for example a stand-alone UMTS 2100 site, or a combined UMTS 2100 and UMTS 900 site.
A12.56 The full list of site types of interest is as follows:
UMTS 2100-only sites
UMTS 900-only sites
Combined UMTS 2100 and UMTS 900 sites
800 MHz-only sites
Combined UMTS 2100 and 800 MHz sites
A12.57 Some of these sites are also GSM (2G) sites. However, the roll out profiles in this annex show the deployment of new technologies, and do not show GSM sites. The existing GSM network is taken into account in the cost modelling described in Annex 15, by assuming that a certain proportion of sites are upgrades rather than new site acquisitions.
A12.58 The key additional assumptions necessary to develop these illustrative network roll-out profiles are as follow:
The initial number of sites
The long term target number of sites that are needed for a given scenario
The maximum number of sites per year that an operator can build and/or upgrade.
How quickly early adopters take up new technology to the point where an operator that deploys such new technology no longer needs to expand its existing UMTS 2100 network in order to remain competitive.
16
Application of spectrum liberalisation and trading to the mobile sector – A further consultation
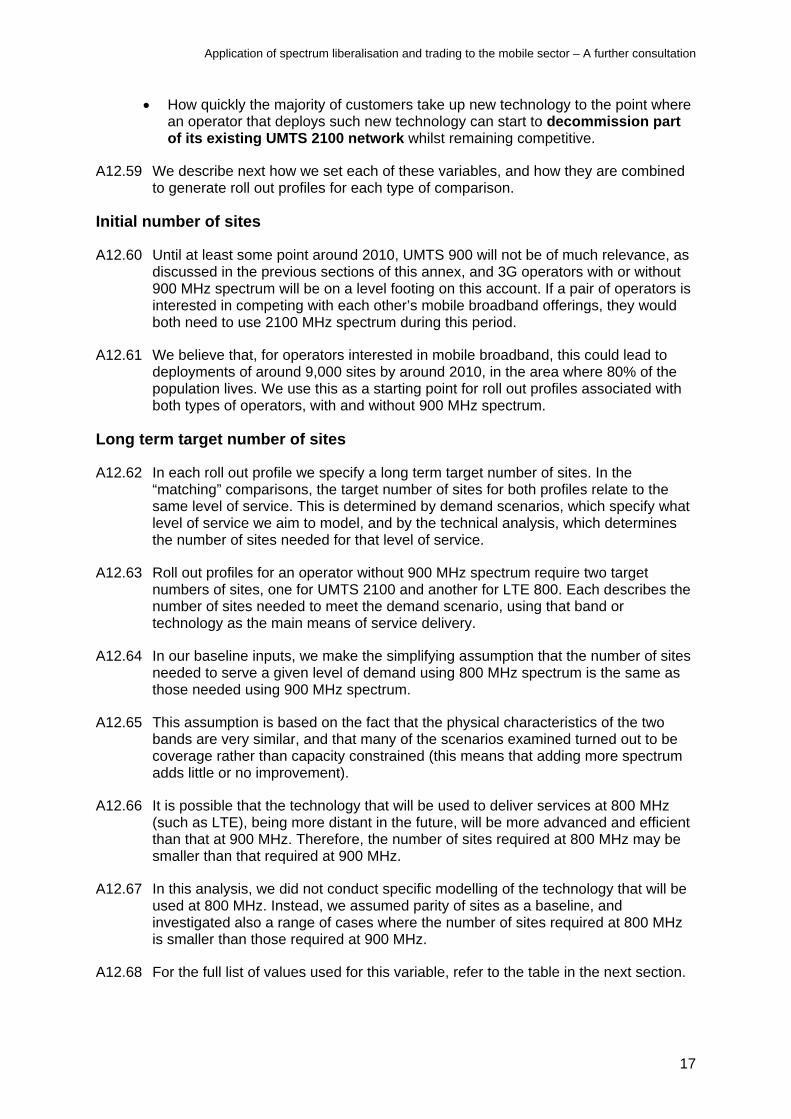
How quickly the majority of customers take up new technology to the point where an operator that deploys such new technology can start to decommission part of its existing UMTS 2100 network whilst remaining competitive.
A12.59 We describe next how we set each of these variables, and how they are combined to generate roll out profiles for each type of comparison.
Initial number of sites
A12.60 Until at least some point around 2010, UMTS 900 will not be of much relevance, as discussed in the previous sections of this annex, and 3G operators with or without 900 MHz spectrum will be on a level footing on this account. If a pair of operators is interested in competing with each other’s mobile broadband offerings, they would both need to use 2100 MHz spectrum during this period.
A12.61 We believe that, for operators interested in mobile broadband, this could lead to deployments of around 9,000 sites by around 2010, in the area where 80% of the population lives. We use this as a starting point for roll out profiles associated with both types of operators, with and without 900 MHz spectrum.
Long term target number of sites
A12.62 In each roll out profile we specify a long term target number of sites. In the “matching” comparisons, the target number of sites for both profiles relate to the same level of service. This is determined by demand scenarios, which specify what level of service we aim to model, and by the technical analysis, which determines the number of sites needed for that level of service.
A12.63 Roll out profiles for an operator without 900 MHz spectrum require two target numbers of sites, one for UMTS 2100 and another for LTE 800. Each describes the number of sites needed to meet the demand scenario, using that band or technology as the main means of service delivery.
A12.64 In our baseline inputs, we make the simplifying assumption that the number of sites needed to serve a given level of demand using 800 MHz spectrum is the same as those needed using 900 MHz spectrum.
A12.65 This assumption is based on the fact that the physical characteristics of the two bands are very similar, and that many of the scenarios examined turned out to be coverage rather than capacity constrained (this means that adding more spectrum adds little or no improvement).
A12.66 It is possible that the technology that will be used to deliver services at 800 MHz (such as LTE), being more distant in the future, will be more advanced and efficient than that at 900 MHz. Therefore, the number of sites required at 800 MHz may be smaller than that required at 900 MHz.
A12.67 In this analysis, we did not conduct specific modelling of the technology that will be used at 800 MHz. Instead, we assumed parity of sites as a baseline, and investigated also a range of cases where the number of sites required at 800 MHz is smaller than those required at 900 MHz.
A12.68 For the full list of values used for this variable, refer to the table in the next section.
17

Application of spectrum liberalisation and trading to the mobile sector – A further consultation
Maximum number of sites per year
A12.69 As explained earlier in this annex, we believe that deployment of up to 1,500 new sites or 3,000 upgrades per year is likely to be achievable by an operator interested in mobile broadband. A less aggressive pace of deployment would be 1,000 sites or 2,000 upgrades.
A12.70 The roll out profiles showing the deployment of UMTS 900 are always bound by the above constraints. However, in many scenarios the number of sites needed to provide a given level of service using UMTS 2100 is several times larger than that needed using UMTS 900.
A12.71 It follows that it is often not possible to produce pairs of roll out profiles that provide the same level of service, using UMTS 900 and UMTS 2100, and enforce the maximum number of sites per year for both operators. In other words, the number of sites per year that the operator without 900 MHz may need to deploy to keep pace with the UMTS 900 operator may be impractical.
A12.72 A cost difference can be interpreted as a financial barrier for the UMTS 2100 operator to match the service offered by an operator with UMTS 900. The difficulty in acquiring sites at the required pace is an additional, non-financial barrier. In order to show the full amount of the financial barrier separately from the non-financial barrier, we measure the costs of the full number of sites they would need to acquire, even if the acquisition of sites at that pace may be impractical.
A12.73 For this reason, the roll out profiles for “matching” comparisons do not enforce a maximum number of sites per year for the UMTS 2100 roll out when it is being matched to a UMTS 900 roll out.
A12.74 Instead, we derive the number of sites that the UMTS 2100 network would have to have in order to match the same service as that offered by the operator with 900 MHz spectrum. This is calculated via the site ratio provided by the technical analysis, which is scenario dependent. The number of UMTS 2100-only sites that the operator with 900 MHz spectrum has is also added to the total number of sites that the operator without 900 MHz needs.
A12.75 The table below summarises the values for this variable, in “matching” and “non matching” comparisons. For each case, we show maximum site deployments for new sites, and for upgrades. We also consider feasible any mix of the two numbers. For example, the lower end of the range below is enforced as 1,000 new sites, or 2,000 upgrades. We consider a combination of 500 new sites plus 1,000 upgrades to be equally feasible. In other words, one new site can be traded for two upgrades, for the purposes of this cap.
Table 5 – Values used for “maximum number of sites per year” in different comparisons
Operator with 900 MHz spectrum
Operator without 900 MHz spectrum
“Matching” comparison 1,000 – 1,500 new sites or (2,000 – 3,000 upgrades)
As many sites as needed to match 900 MHz service (even if impractical)
“Non matching” comparison 1,000 – 1,500 new sites or (2,000 – 3,000 upgrades)
1,000 – 1,500 new sites or (2,000 – 3,000 upgrades)
18

Application of spectrum liberalisation and trading to the mobile sector – A further consultation
Date when operators no longer need to expand their existing UMTS 2100 network
A12.76 We believe that this will be possible when an initial level of service is provided using 900 MHz or 800 MHz spectrum (as described previously, coverage in urban and dense urban areas), and user equipment is in the hand of those users who care about mobile data the most (“early adopters”).
A12.77 The range of dates when this may happen is taken from the roll out profiles shown earlier, and are summarised below in Table 6.
Table 6 - Range of dates when operators can stop expanding their UMTS 2100 network
Earliest Latest Source Operators with 900 MHz spectrum
2011 2012 Gantt charts A-F
Operators without 900 MHz spectrum (but who acquire 800 MHz spectrum)
2013 2015 Gantt charts G-H
Date when operators can decommission part of their UMTS 2100 network
A12.78 We believe that this will be possible when a developed level of service is provided using 900 MHz or 800 MHz spectrum (coverage in urban, dense urban and suburban areas), and user equipment is in the hand of the majority of subscribers with an interest in mobile data. These dates are extracted from the Gantt charts, as shown in Table 7.
A12.79 After this date, the roll out profiles show all UMTS 2100-only sites being decommissioned. However, UMTS 2100 equipment is kept in sites shared with 900 MHz or 800 MHz equipment. This is intended to reflect the likely desire of operators to provide continuing service for legacy users.
Table 7 – Derivation of range of dates when UMTS 900 operators can decommission part of their UMTS 2100 network
Earliest Latest Source
User equipment – early adopters
No later than mid 2011 Gantt charts A-F
User equipment – for most data users
No later than end 2013 The date in the previous row, plus 2.5 years (as discussed in the inputs section)
Full level of service Mid 2013 End 2014 Gantt charts A-F Date when operators can start decommissioning part of their UMTS 2100 network
2013 2014 Point at which user equipment is in hands of most data users and there is a full level of service, as described in rows above
19

Application of spectrum liberalisation and trading to the mobile sector – A further consultation
Table 8 - Derivation of range of dates when 800 MHz operators can decommission part of their UMTS 2100 network
Earliest Latest Source
User equipment – early adopters
Mid 2013 Mid 2015 Gantt charts G-H
User equipment – for most data users
End 2015 End 2017 The dates in the previous row, plus 2.5 years (as discussed in inputs section)
Full level of service Mid 2014 End 2015 Gantt charts G-H Date when operators can start decommissioning part of their UMTS 2100 network
2015 2017 Point at which user equipment is in hands of most data users and there is a full level of service, as described in rows above
A12.80 In addition to the ranges above, we also present a roll out profile where decommissioning never happens.
An example pair of roll out profiles using a fixed maximum of sites per year
A12.81 We show next a pair of matching roll out profiles, in Figure 5. The inputs used to create these roll out profiles are shown below, in Table 9 and Table 10.
Table 9 – Inputs used in example pair of roll out profiles for operator with 900 MHz
Target UMTS 900 sites
Stop growing 2100 MHz network
Decommission 2100-only sites
Sites deployed per year
7,300 2011 2013 1,000
Table 10 - Inputs used in example roll out profile for operator without 900 MHz
Target UMTS 2100 sites
Target 800 MHz sites
Stop growing 2100 MHz network
Decommission 2100-only sites
Sites deployed per year
21,096 7,300 2013 2015 As many as needed to match 900 MHz service
A12.82 We quote the limit of sites deployed per year for the case where all sites are new sites. But as mentioned earlier, twice as many upgrades are also allowed in lieu of new sites. Although GSM sites are not shown for simplicity; we simply assume that a fixed percentage of GSM sites may be suitable for upgrades, as explained in Annex 15.
A12.83 For the operator without 900 MHz spectrum the absence of a limit on the number of sites deployed per year implies that the roll-out profile is not intended to be a realistically achievable roll-out target, as discussed earlier. The following features may strike a reader as unrealistic, but are explained by the purposes of the cost difference metric as follows:
There is a sudden surge in sites in 2011. This is the year when UMTS 900 take-up is sufficiently high so that the UMTS 900 operator can benefit from its UMTS 900 network. As a result, an operator without 900 MHz would have to deploy a large number of sites to keep up.
20

Application of spectrum liberalisation and trading to the mobile sector – A further consultation
A large number of 800 MHz sites is deployed in 2011. This is to avoid overstating the cost difference. When the operator is expanding its 2100 MHz network (in 2011), it also deploys 800 MHz equipment, to avoid the costs of two visits to the site. We consider this to be realistic so long as the operator has access to equipment by then.
21

Application of spectrum liberalisation and trading to the mobile sector – A further consultation
Figure 5 - Example pair of roll out profiles
Operator with 900 MHz
-
1,000
2,000
3,000
4,000
5,000
6,000
7,000
8,000
9,000
10,000
2008 2009 2010 2011 2012 2013 2014 2015 2016 2017 2018 2019 2020
UMTS2100 only UMTS2100 and UMTS900
Operator without 900 MHz
-
5,000
10,000
15,000
20,000
25,000
2008 2009 2010 2011 2012 2013 2014 2015 2016 2017 2018 2019 2020
UMTS2100 only UMTS2100 and 800
22

Application of spectrum liberalisation and trading to the mobile sector – A further consultation
23
List of illustrative roll out profiles
A12.84 The following table show the inputs used in all of the roll out profiles to follow. The table is organised as follows:
Matching comparisons This includes variations on the number of target sites, and on timing inputs. It also includes profiles meant to represent less densely populated areas
Non-matching comparisons These are roll out profiles developed for comparisons where the level of service provided by the pair of networks are not designed to match year-by-year
A12.85 Site numbers are rounded to the nearest hundred.
Application of spectrum liberalisation and trading to the mobile sector – A further consultation
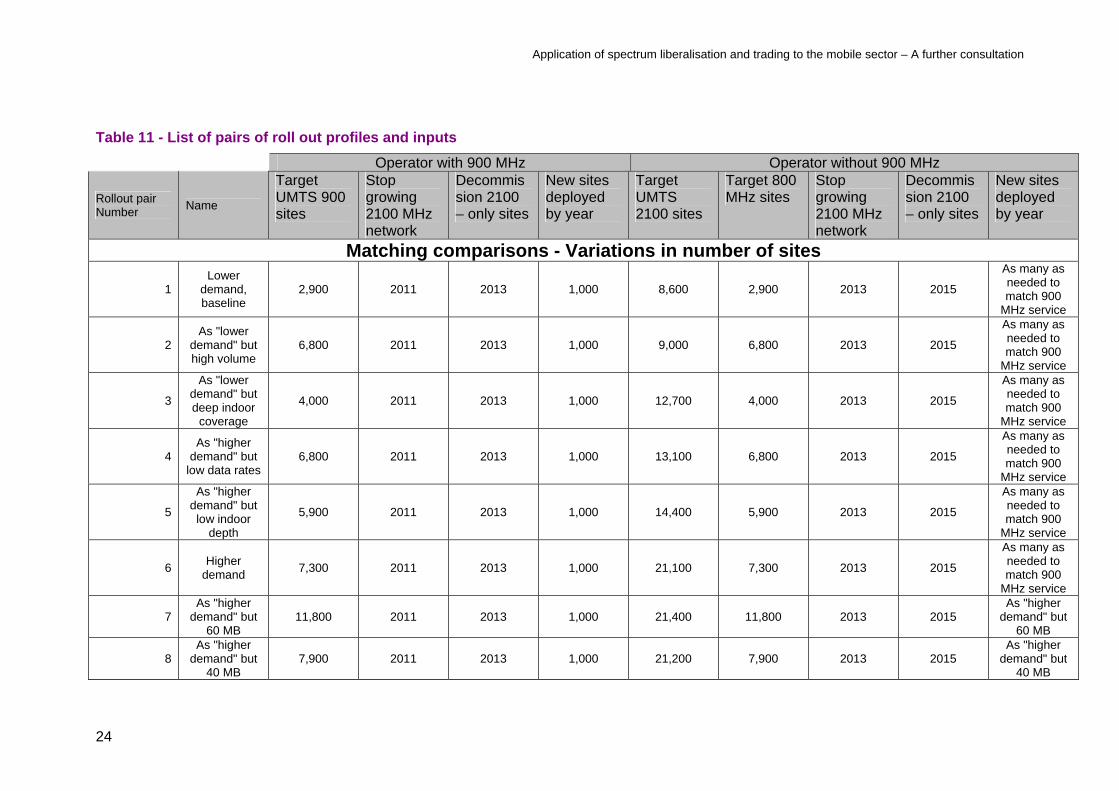
Table 11 - List of pairs of roll out profiles and inputs
Operator with 900 MHz Operator without 900 MHz
Rollout pair Number
Name
Target UMTS 900 sites
Stop growing 2100 MHz network
Decommission 2100 – only sites
New sites deployed by year
Target UMTS 2100 sites
Target 800 MHz sites
Stop growing 2100 MHz network
Decommission 2100 – only sites
New sites deployed by year
Matching comparisons - Variations in number of sites
1 Lower
demand, baseline
2,900 2011 2013 1,000 8,600 2,900 2013 2015
As many as needed to match 900
MHz service
2 As "lower
demand" but high volume
6,800 2011 2013 1,000 9,000 6,800 2013 2015
As many as needed to match 900
MHz service
3
As "lower demand" but deep indoor
coverage
4,000 2011 2013 1,000 12,700 4,000 2013 2015
As many as needed to match 900
MHz service
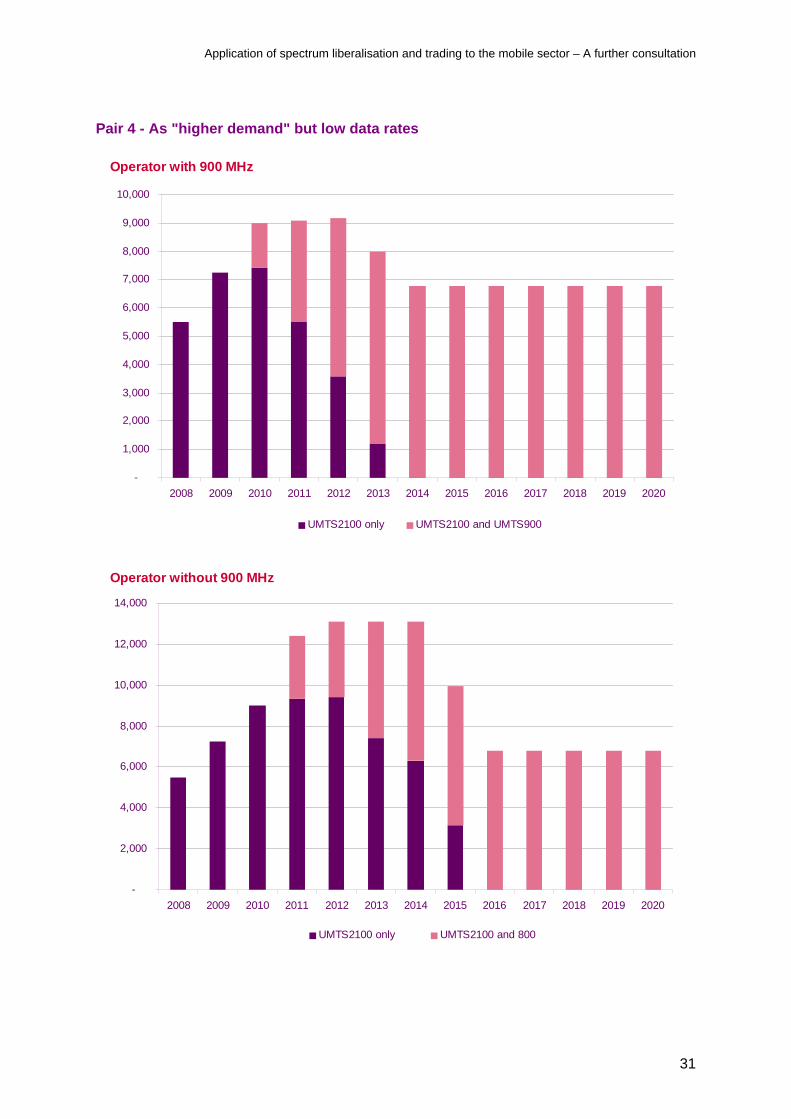
4 As "higher
demand" but low data rates
6,800 2011 2013 1,000 13,100 6,800 2013 2015
As many as needed to match 900
MHz service
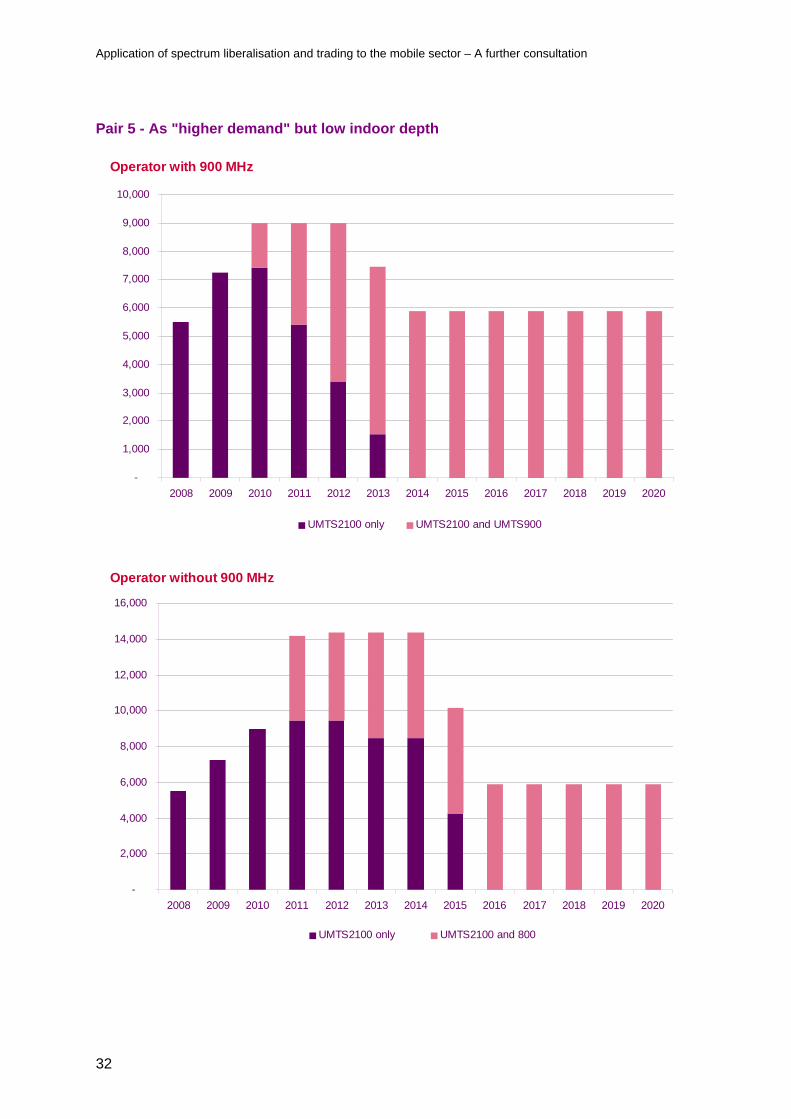
5
As "higher demand" but low indoor
depth
5,900 2011 2013 1,000 14,400 5,900 2013 2015
As many as needed to match 900
MHz service
6 Higher
demand 7,300 2011 2013 1,000 21,100 7,300 2013 2015
As many as needed to match 900
MHz service
7 As "higher
demand" but 60 MB
11,800 2011 2013 1,000 21,400 11,800 2013 2015 As "higher
demand" but 60 MB
8 As "higher
demand" but 40 MB
7,900 2011 2013 1,000 21,200 7,900 2013 2015 As "higher
demand" but 40 MB
24
Application of spectrum liberalisation and trading to the mobile sector – A further consultation
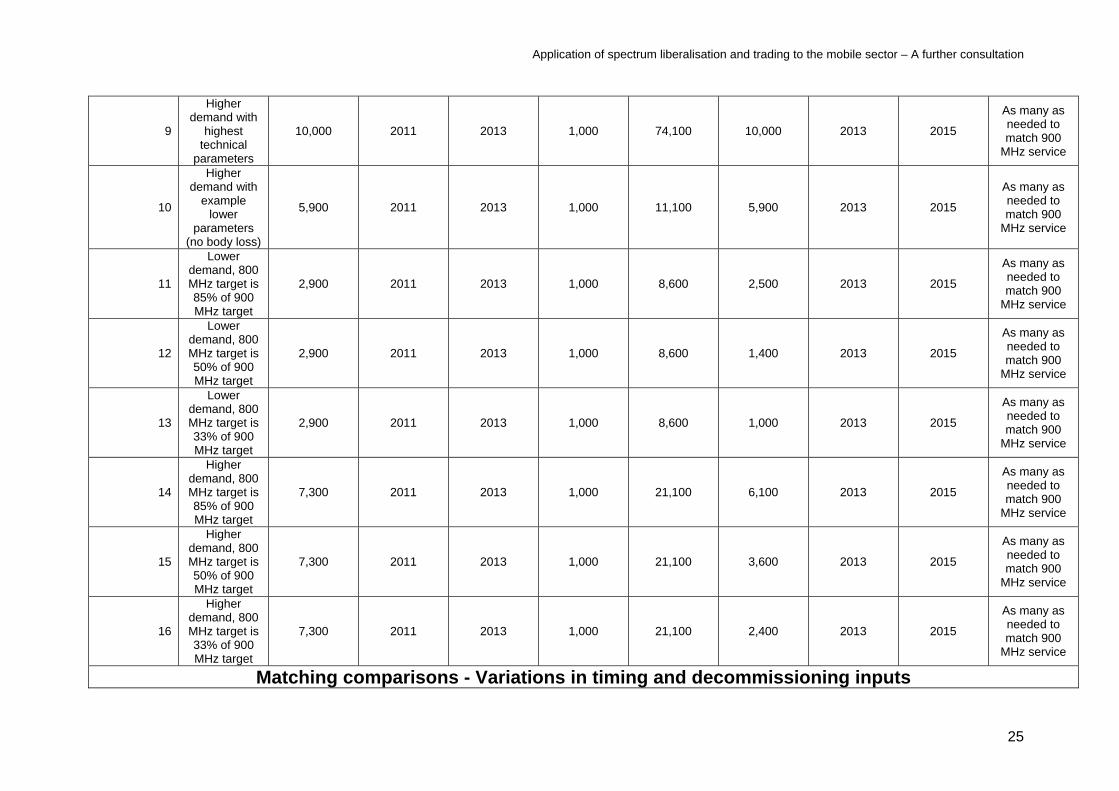
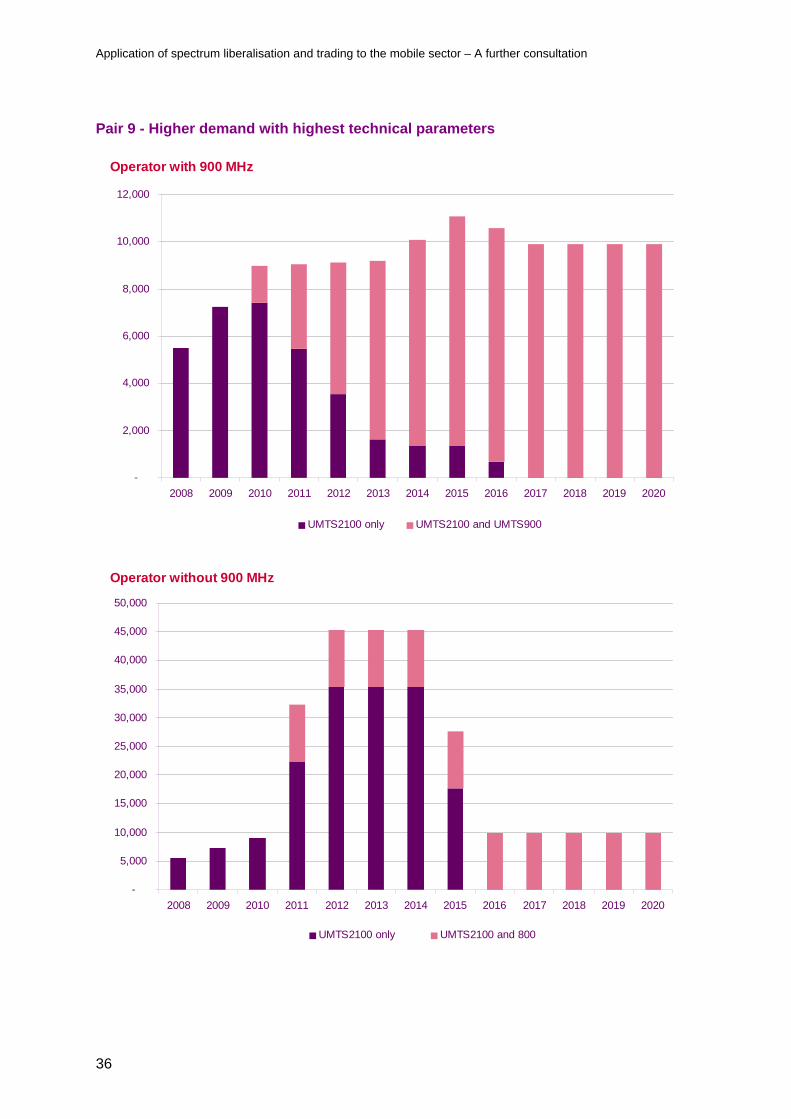
9
Higher demand with
highest technical
parameters
10,000 2011 2013 1,000 74,100 10,000 2013 2015
As many as needed to match 900
MHz service
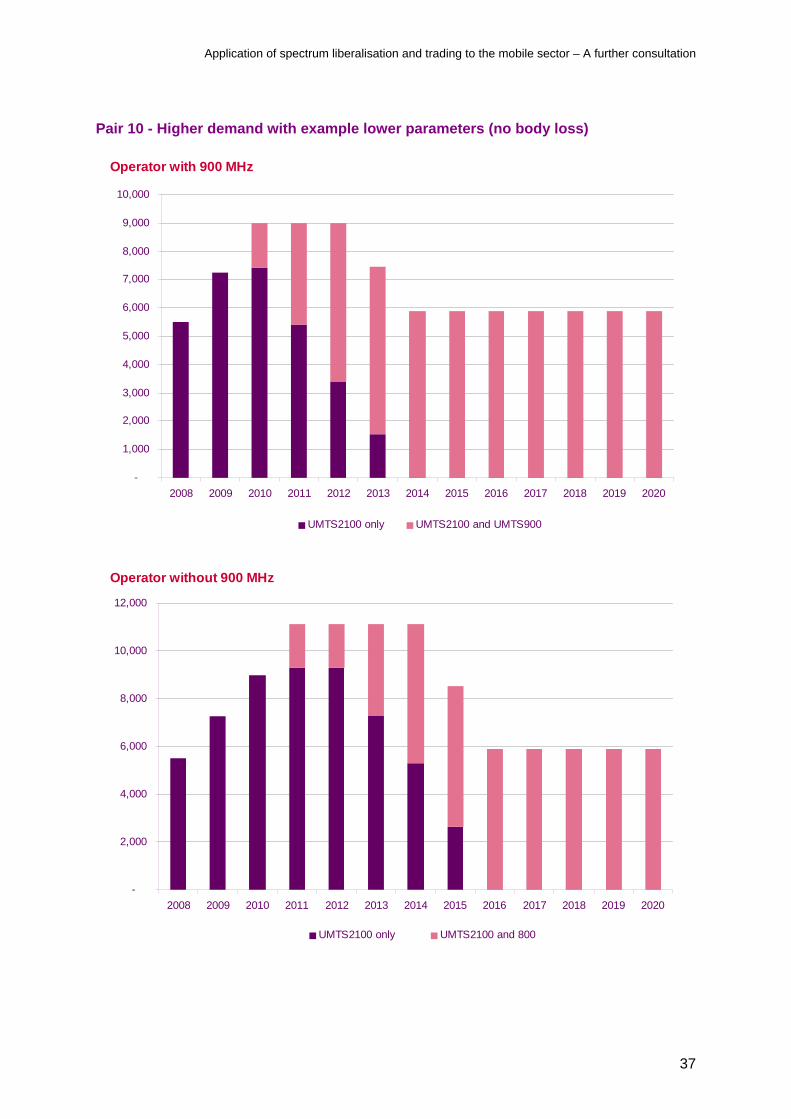
10
Higher demand with
example lower
parameters (no body loss)
5,900 2011 2013 1,000 11,100 5,900 2013 2015
As many as needed to match 900
MHz service
11
Lower demand, 800 MHz target is 85% of 900 MHz target
2,900 2011 2013 1,000 8,600 2,500 2013 2015
As many as needed to match 900
MHz service
12
Lower demand, 800 MHz target is 50% of 900 MHz target
2,900 2011 2013 1,000 8,600 1,400 2013 2015
As many as needed to match 900
MHz service
13
Lower demand, 800 MHz target is 33% of 900 MHz target
2,900 2011 2013 1,000 8,600 1,000 2013 2015
As many as needed to match 900
MHz service
14
Higher demand, 800 MHz target is 85% of 900 MHz target
7,300 2011 2013 1,000 21,100 6,100 2013 2015
As many as needed to match 900
MHz service
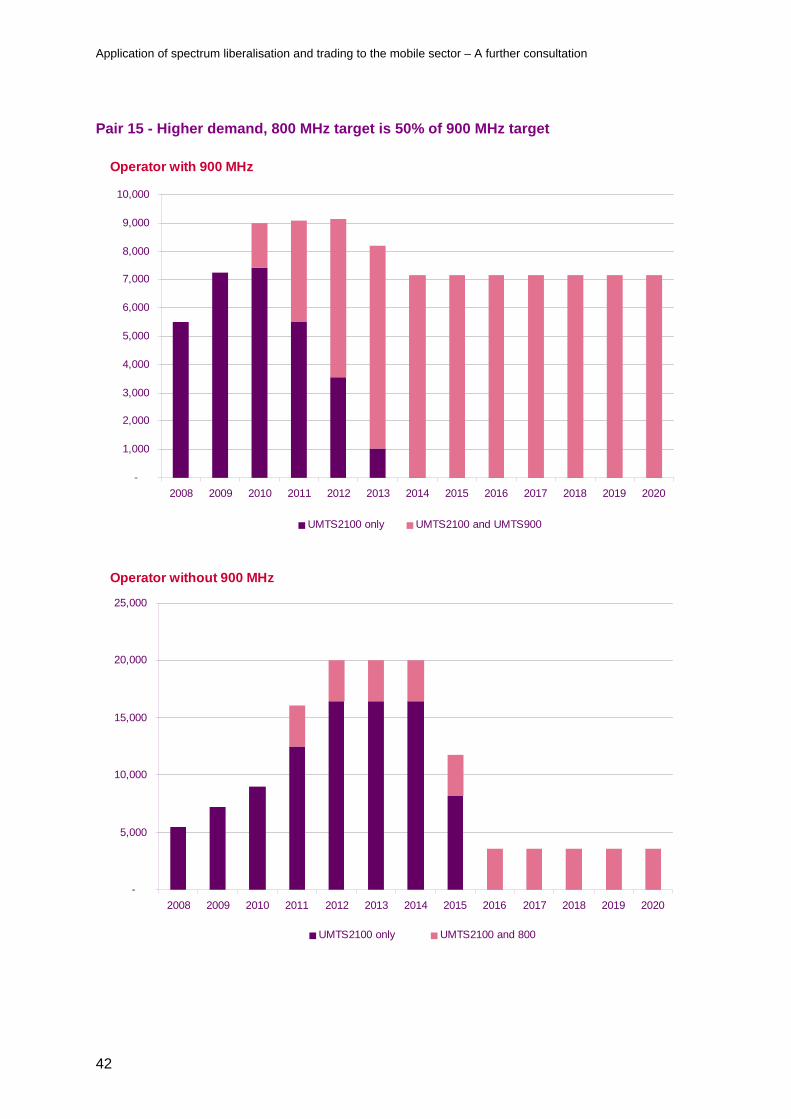
15
Higher demand, 800 MHz target is 50% of 900 MHz target
7,300 2011 2013 1,000 21,100 3,600 2013 2015
As many as needed to match 900
MHz service
16
Higher demand, 800 MHz target is 33% of 900 MHz target
7,300 2011 2013 1,000 21,100 2,400 2013 2015
As many as needed to match 900
MHz service
Matching comparisons - Variations in timing and decommissioning inputs
25

Application of spectrum liberalisation and trading to the mobile sector – A further consultation
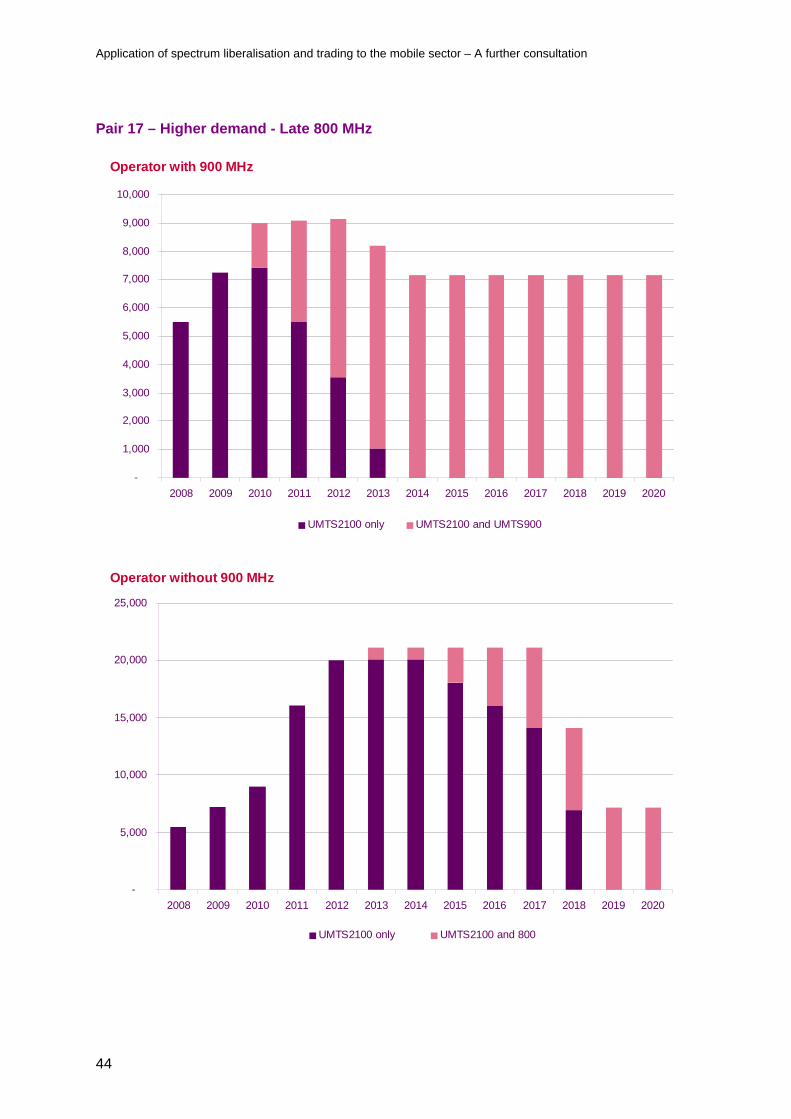
17 Higher
demand - Late 800 MHz
7,300 2011 2013 1,000 21,100 7,300 2015 2017
As many as needed to match 900
MHz service
18
Higher demand -
Late UMTS 900
7,300 2012 2014 1,000 21,100 7,300 2013 2015
As many as needed to match 900
MHz service
19
Higher demand -
Late 900 and 800 MHz
7,300 2012 2014 1,000 21,100 7,300 2015 2017
As many as needed to match 900
MHz service
20
Higher demand -
decommission an year
later
7,300 2011 2014 1,000 21,100 7,300 2013 2016
As many as needed to match 900
MHz service
21
Higher demand- no decommissio
ning
7,300 2011 Never 1,000 21,100 7,300 2013 Never
As many as needed to match 900
MHz service
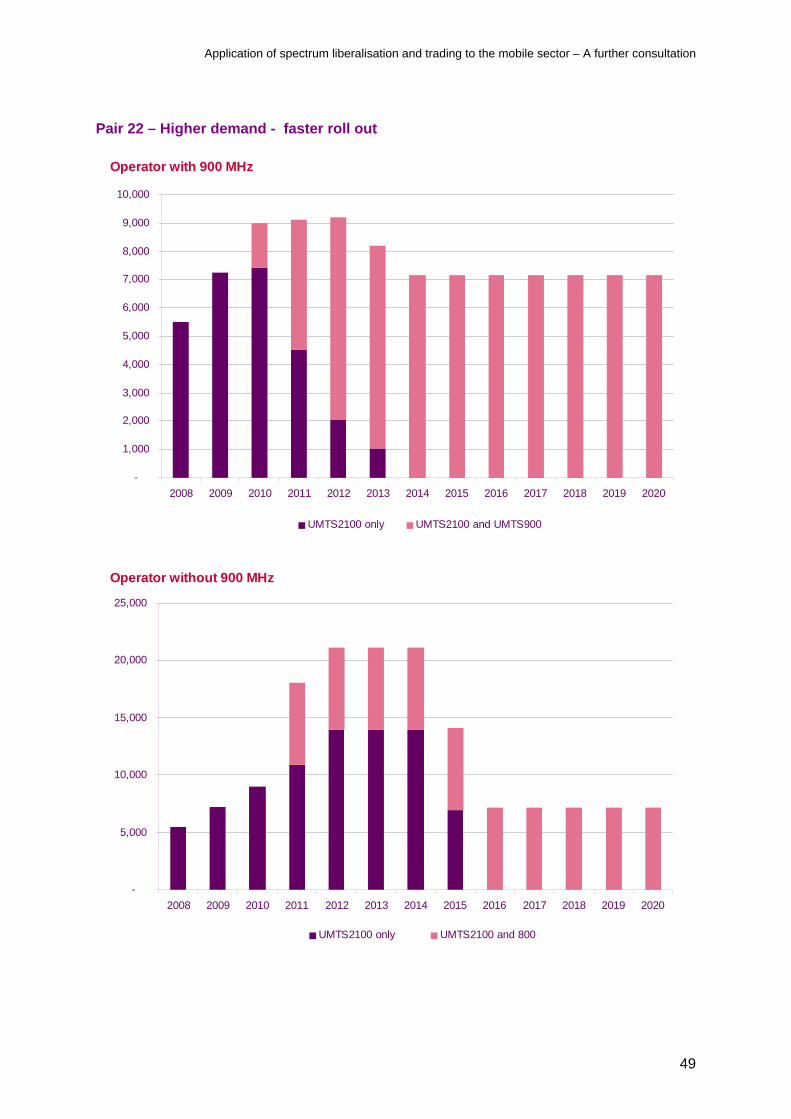
22 Higher
demand - faster roll out
7,300 2011 2013 1,500 21,100 7,300 2013 2015
As many as needed to match 900
MHz service
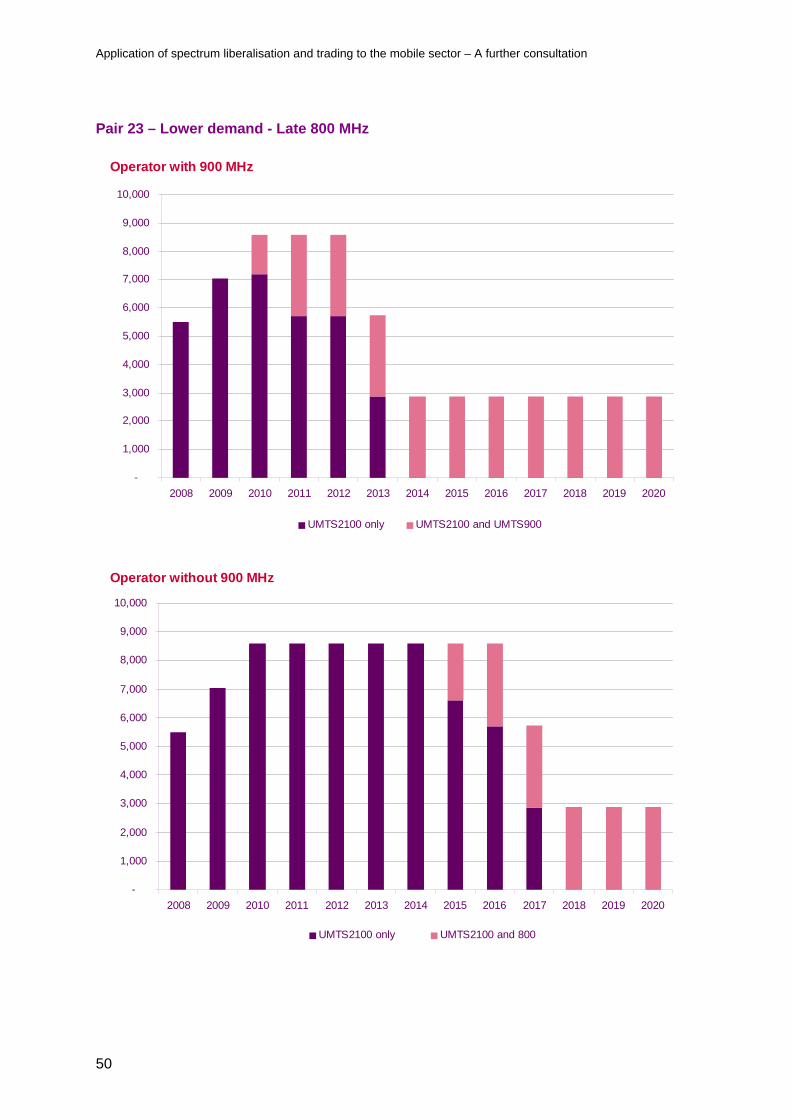
23 Lower
demand - Late 800 MHz
2,900 2011 2013 1,000 8,600 2,900 2015 2017
As many as needed to match 900
MHz service
24
Lower demand -
Late UMTS 900
2,900 2012 2014 1,000 8,600 2,900 2013 2015
As many as needed to match 900
MHz service
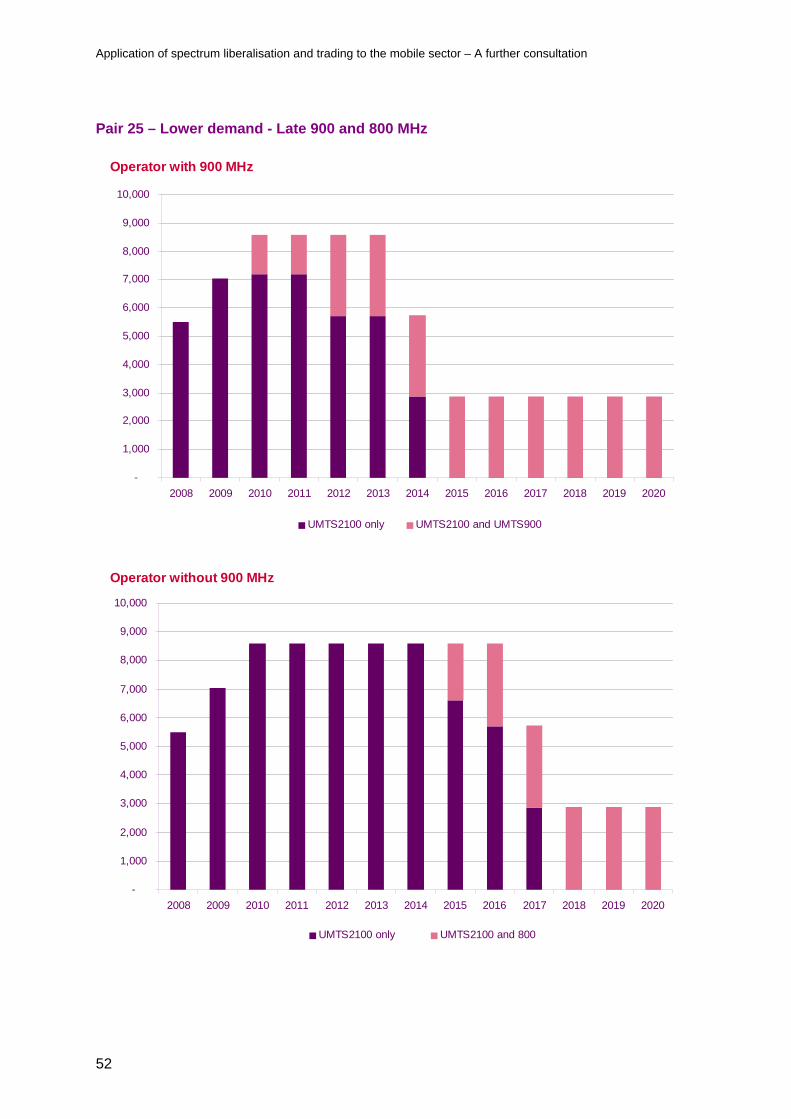
25
Lower demand -
Late 900 and 800 MHz
2,900 2012 2014 1,000 8,600 2,900 2015 2017
As many as needed to match 900
MHz service
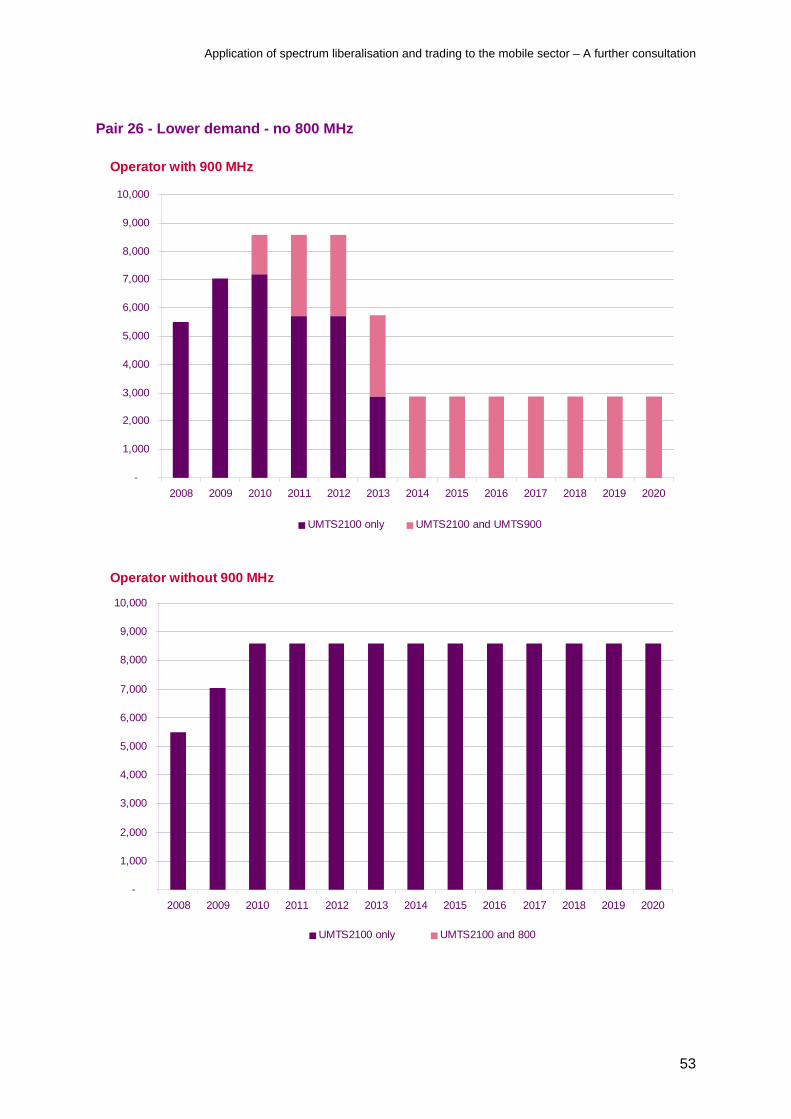
26 Lower
demand - no 800 MHz
2,900 2011 2013 1,000 8,600 2,900 N/A N/A
As many as needed to match 900
MHz service
26

Application of spectrum liberalisation and trading to the mobile sector – A further consultation
27
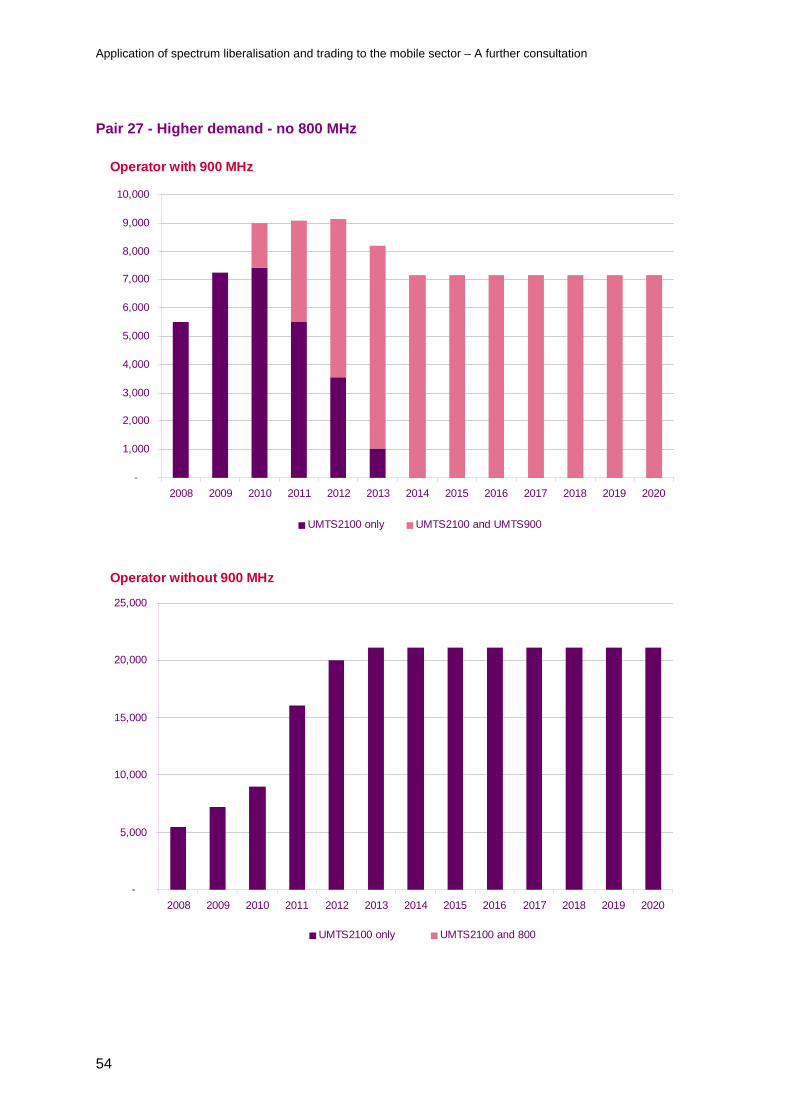
27 Higher
demand - no 800 MHz
7,300 2011 2013 1,000 21,100 7,300 N/A N/A
As many as needed to match 900
MHz service
Matching comparisons – Less densely populated areas
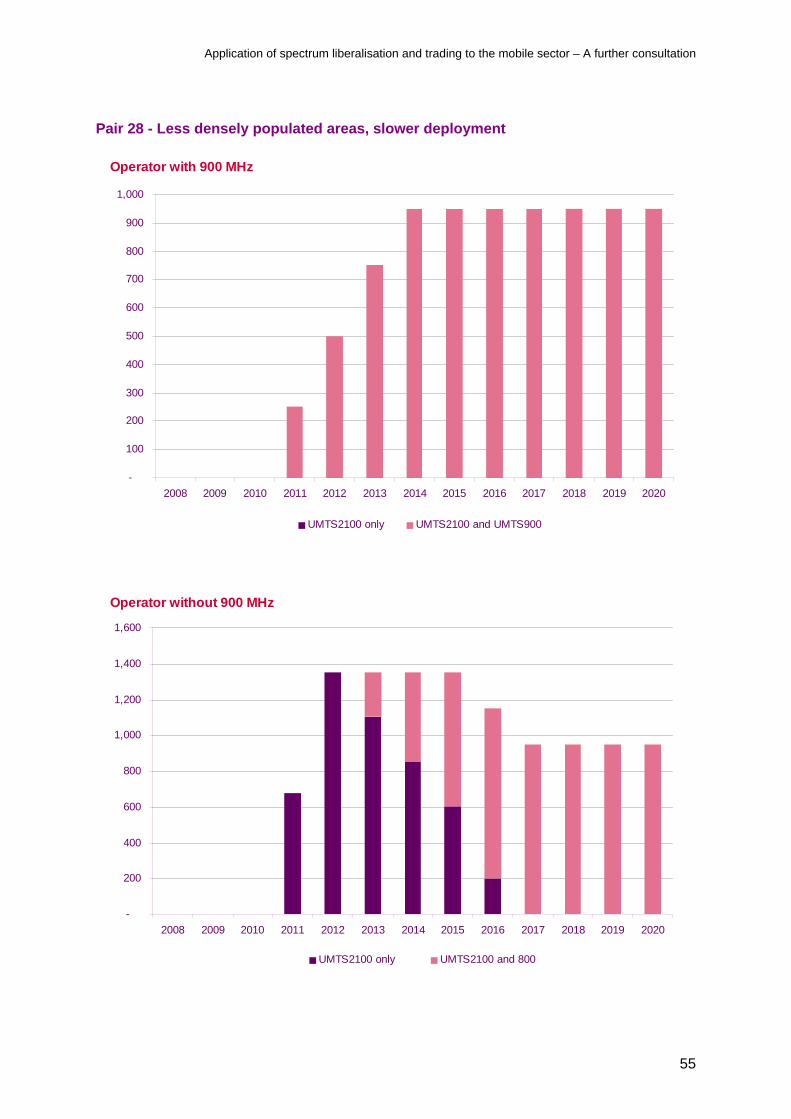
28
Less densely populated
areas, slower deployment
900 2011 2013 125 2,600 900 2013 2015
As many as needed to match 900
MHz service
29
Less densely populated
areas, faster deployment
900 2011 2013 250 2,600 900 2013 2015
As many as needed to match 900
MHz service
Non-matching comparisons
30 Non-matching roll out, 6000
vs. 15,000 6,000 2011 2013 1,500 15,000 6,000 2015 2017 1500
31 Non-matching roll out, 7,300
vs. 15,000 7,300 2011 2013 1,500 15,000 7,300 2015 2017 1500
32 Non-matching roll out, 7,300
vs. 9,000 7,300 2011 2013 1,500 9,000 7,300 2013 2015 1500

Application of spectrum liberalisation and trading to the mobile sector – A further consultation
Pair 1 - Lower demand, baseline
Operator with 900 MHz
-
1,000
2,000
3,000
4,000
5,000
6,000
7,000
8,000
9,000
10,000
2008 2009 2010 2011 2012 2013 2014 2015 2016 2017 2018 2019 2020
UMTS2100 only UMTS2100 and UMTS900
Operator without 900 MHz
-
1,000
2,000
3,000
4,000
5,000
6,000
7,000
8,000
9,000
10,000
2008 2009 2010 2011 2012 2013 2014 2015 2016 2017 2018 2019 2020
UMTS2100 only UMTS2100 and 800
28

Application of spectrum liberalisation and trading to the mobile sector – A further consultation
Pair 2 - As "lower demand" but high volume
Operator with 900 MHz
-
1,000
2,000
3,000
4,000
5,000
6,000
7,000
8,000
9,000
10,000
2008 2009 2010 2011 2012 2013 2014 2015 2016 2017 2018 2019 2020
UMTS2100 only UMTS2100 and UMTS900
Operator without 900 MHz
-
1,000
2,000
3,000
4,000
5,000
6,000
7,000
8,000
9,000
10,000
2008 2009 2010 2011 2012 2013 2014 2015 2016 2017 2018 2019 2020
UMTS2100 only UMTS2100 and 800
29

Application of spectrum liberalisation and trading to the mobile sector – A further consultation
Pair 3 - As "lower demand" but deep indoor coverage
Operator with 900 MHz
-
1,000
2,000
3,000
4,000
5,000
6,000
7,000
8,000
9,000
10,000
2008 2009 2010 2011 2012 2013 2014 2015 2016 2017 2018 2019 2020
UMTS2100 only UMTS2100 and UMTS900
Operator without 900 MHz
-
2,000
4,000
6,000
8,000
10,000
12,000
14,000
2008 2009 2010 2011 2012 2013 2014 2015 2016 2017 2018 2019 2020
UMTS2100 only UMTS2100 and 800
30
Application of spectrum liberalisation and trading to the mobile sector – A further consultation
Pair 4 - As "higher demand" but low data rates
Operator with 900 MHz
-
1,000
2,000
3,000
4,000
5,000
6,000
7,000
8,000
9,000
10,000
2008 2009 2010 2011 2012 2013 2014 2015 2016 2017 2018 2019 2020
UMTS2100 only UMTS2100 and UMTS900
Operator without 900 MHz
-
2,000
4,000
6,000
8,000
10,000
12,000
14,000
2008 2009 2010 2011 2012 2013 2014 2015 2016 2017 2018 2019 2020
UMTS2100 only UMTS2100 and 800
31
Application of spectrum liberalisation and trading to the mobile sector – A further consultation
Pair 5 - As "higher demand" but low indoor depth
Operator with 900 MHz
-
1,000
2,000
3,000
4,000
5,000
6,000
7,000
8,000
9,000
10,000
2008 2009 2010 2011 2012 2013 2014 2015 2016 2017 2018 2019 2020
UMTS2100 only UMTS2100 and UMTS900
Operator without 900 MHz
-
2,000
4,000
6,000
8,000
10,000
12,000
14,000
16,000
2008 2009 2010 2011 2012 2013 2014 2015 2016 2017 2018 2019 2020
UMTS2100 only UMTS2100 and 800
32

Application of spectrum liberalisation and trading to the mobile sector – A further consultation
Pair 6 - Higher demand
Operator with 900 MHz
-
1,000
2,000
3,000
4,000
5,000
6,000
7,000
8,000
9,000
10,000
2008 2009 2010 2011 2012 2013 2014 2015 2016 2017 2018 2019 2020
UMTS2100 only UMTS2100 and UMTS900
Operator without 900 MHz
-
1,000
2,000
3,000
4,000
5,000
6,000
7,000
8,000
9,000
10,000
2008 2009 2010 2011 2012 2013 2014 2015 2016 2017 2018 2019 2020
UMTS2100 only UMTS2100 and 800
33

Application of spectrum liberalisation and trading to the mobile sector – A further consultation
Pair 7 - As "higher demand" but 60 MB
Operator with 900 MHz
-
2,000
4,000
6,000
8,000
10,000
12,000
14,000
2008 2009 2010 2011 2012 2013 2014 2015 2016 2017 2018 2019 2020
UMTS2100 only UMTS2100 and UMTS900
Operator without 900 MHz
-
2,000
4,000
6,000
8,000
10,000
12,000
14,000
16,000
2008 2009 2010 2011 2012 2013 2014 2015 2016 2017 2018 2019 2020
UMTS2100 only UMTS2100 and 800
34

Application of spectrum liberalisation and trading to the mobile sector – A further consultation
Pair 8 - As "higher demand" but 40 MB
Operator with 900 MHz
-
1,000
2,000
3,000
4,000
5,000
6,000
7,000
8,000
9,000
10,000
2008 2009 2010 2011 2012 2013 2014 2015 2016 2017 2018 2019 2020
UMTS2100 only UMTS2100 and UMTS900
Operator without 900 MHz
-
2,000
4,000
6,000
8,000
10,000
12,000
14,000
16,000
18,000
20,000
2008 2009 2010 2011 2012 2013 2014 2015 2016 2017 2018 2019 2020
UMTS2100 only UMTS2100 and 800
35
Application of spectrum liberalisation and trading to the mobile sector – A further consultation
Pair 9 - Higher demand with highest technical parameters
Operator with 900 MHz
-
2,000
4,000
6,000
8,000
10,000
12,000
2008 2009 2010 2011 2012 2013 2014 2015 2016 2017 2018 2019 2020
UMTS2100 only UMTS2100 and UMTS900
Operator without 900 MHz
-
5,000
10,000
15,000
20,000
25,000
30,000
35,000
40,000
45,000
50,000
2008 2009 2010 2011 2012 2013 2014 2015 2016 2017 2018 2019 2020
UMTS2100 only UMTS2100 and 800
36
Application of spectrum liberalisation and trading to the mobile sector – A further consultation
Pair 10 - Higher demand with example lower parameters (no body loss)
Operator with 900 MHz
-
1,000
2,000
3,000
4,000
5,000
6,000
7,000
8,000
9,000
10,000
2008 2009 2010 2011 2012 2013 2014 2015 2016 2017 2018 2019 2020
UMTS2100 only UMTS2100 and UMTS900
Operator without 900 MHz
-
2,000
4,000
6,000
8,000
10,000
12,000
2008 2009 2010 2011 2012 2013 2014 2015 2016 2017 2018 2019 2020
UMTS2100 only UMTS2100 and 800
37

Application of spectrum liberalisation and trading to the mobile sector – A further consultation
Pair 11 - Lower demand, 800 MHz target is 85% of 900 MHz target
Operator with 900 MHz
-
1,000
2,000
3,000
4,000
5,000
6,000
7,000
8,000
9,000
10,000
2008 2009 2010 2011 2012 2013 2014 2015 2016 2017 2018 2019 2020
UMTS2100 only UMTS2100 and UMTS900
Operator without 900 MHz
-
1,000
2,000
3,000
4,000
5,000
6,000
7,000
8,000
9,000
10,000
2008 2009 2010 2011 2012 2013 2014 2015 2016 2017 2018 2019 2020
UMTS2100 only UMTS2100 and 800
38

Application of spectrum liberalisation and trading to the mobile sector – A further consultation
Pair 12 - Lower demand, 800 MHz target is 50% of 900 MHz target
Operator with 900 MHz
-
1,000
2,000
3,000
4,000
5,000
6,000
7,000
8,000
9,000
10,000
2008 2009 2010 2011 2012 2013 2014 2015 2016 2017 2018 2019 2020
UMTS2100 only UMTS2100 and UMTS900
Operator without 900 MHz
-
1,000
2,000
3,000
4,000
5,000
6,000
7,000
8,000
9,000
10,000
2008 2009 2010 2011 2012 2013 2014 2015 2016 2017 2018 2019 2020
UMTS2100 only UMTS2100 and 800
39

Application of spectrum liberalisation and trading to the mobile sector – A further consultation
Pair 13 - Lower demand, 800 MHz target is 33% of 900 MHz target
Operator with 900 MHz
-
1,000
2,000
3,000
4,000
5,000
6,000
7,000
8,000
9,000
10,000
2008 2009 2010 2011 2012 2013 2014 2015 2016 2017 2018 2019 2020
UMTS2100 only UMTS2100 and UMTS900
Operator without 900 MHz
-
1,000
2,000
3,000
4,000
5,000
6,000
7,000
8,000
9,000
10,000
2008 2009 2010 2011 2012 2013 2014 2015 2016 2017 2018 2019 2020
UMTS2100 only UMTS2100 and 800
40

Application of spectrum liberalisation and trading to the mobile sector – A further consultation
Pair 14 - Higher demand, 800 MHz target is 85% of 900 MHz target
Operator with 900 MHz
-
1,000
2,000
3,000
4,000
5,000
6,000
7,000
8,000
9,000
10,000
2008 2009 2010 2011 2012 2013 2014 2015 2016 2017 2018 2019 2020
UMTS2100 only UMTS2100 and UMTS900
Operator without 900 MHz
-
5,000
10,000
15,000
20,000
25,000
2008 2009 2010 2011 2012 2013 2014 2015 2016 2017 2018 2019 2020
UMTS2100 only UMTS2100 and 800
41
Application of spectrum liberalisation and trading to the mobile sector – A further consultation
Pair 15 - Higher demand, 800 MHz target is 50% of 900 MHz target
Operator with 900 MHz
-
1,000
2,000
3,000
4,000
5,000
6,000
7,000
8,000
9,000
10,000
2008 2009 2010 2011 2012 2013 2014 2015 2016 2017 2018 2019 2020
UMTS2100 only UMTS2100 and UMTS900
Operator without 900 MHz
-
5,000
10,000
15,000
20,000
25,000
2008 2009 2010 2011 2012 2013 2014 2015 2016 2017 2018 2019 2020
UMTS2100 only UMTS2100 and 800
42

Application of spectrum liberalisation and trading to the mobile sector – A further consultation
Pair 16 - Higher demand, 800 MHz target is 33% of 900 MHz target
Operator with 900 MHz
-
1,000
2,000
3,000
4,000
5,000
6,000
7,000
8,000
9,000
10,000
2008 2009 2010 2011 2012 2013 2014 2015 2016 2017 2018 2019 2020
UMTS2100 only UMTS2100 and UMTS900
Operator without 900 MHz
-
5,000
10,000
15,000
20,000
25,000
2008 2009 2010 2011 2012 2013 2014 2015 2016 2017 2018 2019 2020
UMTS2100 only UMTS2100 and 800
43
Application of spectrum liberalisation and trading to the mobile sector – A further consultation
Pair 17 – Higher demand - Late 800 MHz
Operator with 900 MHz
-
1,000
2,000
3,000
4,000
5,000
6,000
7,000
8,000
9,000
10,000
2008 2009 2010 2011 2012 2013 2014 2015 2016 2017 2018 2019 2020
UMTS2100 only UMTS2100 and UMTS900
Operator without 900 MHz
-
5,000
10,000
15,000
20,000
25,000
2008 2009 2010 2011 2012 2013 2014 2015 2016 2017 2018 2019 2020
UMTS2100 only UMTS2100 and 800
44

Application of spectrum liberalisation and trading to the mobile sector – A further consultation
Pair 18 – Higher demand - Late UMTS 900
Operator with 900 MHz
-
1,000
2,000
3,000
4,000
5,000
6,000
7,000
8,000
9,000
10,000
2008 2009 2010 2011 2012 2013 2014 2015 2016 2017 2018 2019 2020
UMTS2100 only UMTS2100 and UMTS900
Operator without 900 MHz
-
2,000
4,000
6,000
8,000
10,000
12,000
14,000
16,000
18,000
2008 2009 2010 2011 2012 2013 2014 2015 2016 2017 2018 2019 2020
UMTS2100 only UMTS2100 and 800
45

Application of spectrum liberalisation and trading to the mobile sector – A further consultation
Pair 19 – Higher demand - Late 900 and 800 MHz
Operator with 900 MHz
-
1,000
2,000
3,000
4,000
5,000
6,000
7,000
8,000
9,000
10,000
2008 2009 2010 2011 2012 2013 2014 2015 2016 2017 2018 2019 2020
UMTS2100 only UMTS2100 and UMTS900
Operator without 900 MHz
-
5,000
10,000
15,000
20,000
25,000
2008 2009 2010 2011 2012 2013 2014 2015 2016 2017 2018 2019 2020
UMTS2100 only UMTS2100 and 800
46

Application of spectrum liberalisation and trading to the mobile sector – A further consultation
Pair 20 – Higher demand - decommission a year later
Operator with 900 MHz
-
1,000
2,000
3,000
4,000
5,000
6,000
7,000
8,000
9,000
10,000
2008 2009 2010 2011 2012 2013 2014 2015 2016 2017 2018 2019 2020
UMTS2100 only UMTS2100 and UMTS900
Operator without 900 MHz
-
5,000
10,000
15,000
20,000
25,000
2008 2009 2010 2011 2012 2013 2014 2015 2016 2017 2018 2019 2020
UMTS2100 only UMTS2100 and 800
47

Application of spectrum liberalisation and trading to the mobile sector – A further consultation
Pair 21 – Higher demand - no decommissioning
Operator with 900 MHz
-
1,000
2,000
3,000
4,000
5,000
6,000
7,000
8,000
9,000
10,000
2008 2009 2010 2011 2012 2013 2014 2015 2016 2017 2018 2019 2020
UMTS2100 only UMTS2100 and UMTS900
Operator without 900 MHz
-
5,000
10,000
15,000
20,000
25,000
2008 2009 2010 2011 2012 2013 2014 2015 2016 2017 2018 2019 2020
UMTS2100 only UMTS2100 and 800
48
Application of spectrum liberalisation and trading to the mobile sector – A further consultation
Pair 22 – Higher demand - faster roll out
Operator with 900 MHz
-
1,000
2,000
3,000
4,000
5,000
6,000
7,000
8,000
9,000
10,000
2008 2009 2010 2011 2012 2013 2014 2015 2016 2017 2018 2019 2020
UMTS2100 only UMTS2100 and UMTS900
Operator without 900 MHz
-
5,000
10,000
15,000
20,000
25,000
2008 2009 2010 2011 2012 2013 2014 2015 2016 2017 2018 2019 2020
UMTS2100 only UMTS2100 and 800
49
Application of spectrum liberalisation and trading to the mobile sector – A further consultation
Pair 23 – Lower demand - Late 800 MHz
Operator with 900 MHz
-
1,000
2,000
3,000
4,000
5,000
6,000
7,000
8,000
9,000
10,000
2008 2009 2010 2011 2012 2013 2014 2015 2016 2017 2018 2019 2020
UMTS2100 only UMTS2100 and UMTS900
Operator without 900 MHz
-
1,000
2,000
3,000
4,000
5,000
6,000
7,000
8,000
9,000
10,000
2008 2009 2010 2011 2012 2013 2014 2015 2016 2017 2018 2019 2020
UMTS2100 only UMTS2100 and 800
50

Application of spectrum liberalisation and trading to the mobile sector – A further consultation
Pair 24 – Lower demand - Late UMTS 900
Operator with 900 MHz
-
1,000
2,000
3,000
4,000
5,000
6,000
7,000
8,000
9,000
10,000
2008 2009 2010 2011 2012 2013 2014 2015 2016 2017 2018 2019 2020
UMTS2100 only UMTS2100 and UMTS900
Operator without 900 MHz
-
1,000
2,000
3,000
4,000
5,000
6,000
7,000
8,000
9,000
10,000
2008 2009 2010 2011 2012 2013 2014 2015 2016 2017 2018 2019 2020
UMTS2100 only UMTS2100 and 800
51
Application of spectrum liberalisation and trading to the mobile sector – A further consultation
Pair 25 – Lower demand - Late 900 and 800 MHz
Operator with 900 MHz
-
1,000
2,000
3,000
4,000
5,000
6,000
7,000
8,000
9,000
10,000
2008 2009 2010 2011 2012 2013 2014 2015 2016 2017 2018 2019 2020
UMTS2100 only UMTS2100 and UMTS900
Operator without 900 MHz
-
1,000
2,000
3,000
4,000
5,000
6,000
7,000
8,000
9,000
10,000
2008 2009 2010 2011 2012 2013 2014 2015 2016 2017 2018 2019 2020
UMTS2100 only UMTS2100 and 800
52
Application of spectrum liberalisation and trading to the mobile sector – A further consultation
Pair 26 - Lower demand - no 800 MHz
Operator with 900 MHz
-
1,000
2,000
3,000
4,000
5,000
6,000
7,000
8,000
9,000
10,000
2008 2009 2010 2011 2012 2013 2014 2015 2016 2017 2018 2019 2020
UMTS2100 only UMTS2100 and UMTS900
Operator without 900 MHz
-
1,000
2,000
3,000
4,000
5,000
6,000
7,000
8,000
9,000
10,000
2008 2009 2010 2011 2012 2013 2014 2015 2016 2017 2018 2019 2020
UMTS2100 only UMTS2100 and 800
53
Application of spectrum liberalisation and trading to the mobile sector – A further consultation
Pair 27 - Higher demand - no 800 MHz
Operator with 900 MHz
-
1,000
2,000
3,000
4,000
5,000
6,000
7,000
8,000
9,000
10,000
2008 2009 2010 2011 2012 2013 2014 2015 2016 2017 2018 2019 2020
UMTS2100 only UMTS2100 and UMTS900
Operator without 900 MHz
-
5,000
10,000
15,000
20,000
25,000
2008 2009 2010 2011 2012 2013 2014 2015 2016 2017 2018 2019 2020
UMTS2100 only UMTS2100 and 800
54
Application of spectrum liberalisation and trading to the mobile sector – A further consultation
Pair 28 - Less densely populated areas, slower deployment
Operator with 900 MHz
-
100
200
300
400
500
600
700
800
900
1,000
2008 2009 2010 2011 2012 2013 2014 2015 2016 2017 2018 2019 2020
UMTS2100 only UMTS2100 and UMTS900
Operator without 900 MHz
-
200
400
600
800
1,000
1,200
1,400
1,600
2008 2009 2010 2011 2012 2013 2014 2015 2016 2017 2018 2019 2020
UMTS2100 only UMTS2100 and 800
55

Application of spectrum liberalisation and trading to the mobile sector – A further consultation
Pair 29 - Less densely populated areas, faster deployment
Operator with 900 MHz
-
100
200
300
400
500
600
700
800
900
1,000
2008 2009 2010 2011 2012 2013 2014 2015 2016 2017 2018 2019 2020
UMTS2100 only UMTS2100 and UMTS900
Operator without 900 MHz
-
500
1,000
1,500
2,000
2,500
3,000
2008 2009 2010 2011 2012 2013 2014 2015 2016 2017 2018 2019 2020
UMTS2100 only UMTS2100 and 800
56
Application of spectrum liberalisation and trading to the mobile sector – A further consultation
Pair 30 - Non-matching roll out, 6,000 vs. 15,000
Operator with 900 MHz
-
1,000
2,000
3,000
4,000
5,000
6,000
7,000
8,000
9,000
10,000
2008 2009 2010 2011 2012 2013 2014 2015 2016 2017 2018 2019 2020
UMTS2100 only UMTS2100 and UMTS900
Operator without 900 MHz
-
2,000
4,000
6,000
8,000
10,000
12,000
14,000
16,000
2008 2009 2010 2011 2012 2013 2014 2015 2016 2017 2018 2019 2020
UMTS2100 only UMTS2100 and 800
57

Application of spectrum liberalisation and trading to the mobile sector – A further consultation
Pair 31 - Non-matching roll out, 7,300 vs. 15,000
Operator with 900 MHz
-
1,000
2,000
3,000
4,000
5,000
6,000
7,000
8,000
9,000
10,000
2008 2009 2010 2011 2012 2013 2014 2015 2016 2017 2018 2019 2020
UMTS2100 only UMTS2100 and UMTS900
Operator without 900 MHz
-
2,000
4,000
6,000
8,000
10,000
12,000
14,000
16,000
2008 2009 2010 2011 2012 2013 2014 2015 2016 2017 2018 2019 2020
UMTS2100 only UMTS2100 and 800
58

Application of spectrum liberalisation and trading to the mobile sector – A further consultation
59
Pair 32 - Non-matching roll out, 7,300 vs. 9,000
Operator with 900 MHz
-
1,000
2,000
3,000
4,000
5,000
6,000
7,000
8,000
9,000
10,000
2008 2009 2010 2011 2012 2013 2014 2015 2016 2017 2018 2019 2020
UMTS2100 only UMTS2100 and UMTS900
Operator without 900 MHz
-
1,000
2,000
3,000
4,000
5,000
6,000
7,000
8,000
9,000
10,000
2008 2009 2010 2011 2012 2013 2014 2015 2016 2017 2018 2019 2020
UMTS2100 only UMTS2100 and 800