time to hit the road: a new map for energy i synergies will abound, with huge opportunities in...
TRANSCRIPT
Navigating the Energy sector in recent months has been challenging for many investors, to say the least. However, we believe this may actually be a compelling time to add exposure to natural-resources stocks. Three reasons underpin our conviction:
1. Oil prices and related equities will bottom — and rally — before supply and demand reach balance.
2. Oil’s price floor is near $30 a barrel; any lower than that will lead to a sharp supply response.
3. Companies’ margins are reaching bottom, providing significant potential upside to profitability.
A Race to the BottomAfter witnessing — and surviving — the recent volatility, we can say only two things with confidence:
■ $30 oil is wreaking havoc on supply investments and arresting growth.
■ Supply and demand have accelerated toward balance.
Even the most conservative demand assumptions would still factor in naturally declining oilfields, which are constantly pulling the market toward balance. The recent downturn has clearly impacted supply, as evidenced by energy giants like ExxonMobil forecasting flat production growth through 2020 and others like EOG Resources and Anadarko Petroleum guiding to negative growth for 2016. Market balance is just a matter of time, and volatility only shortens investors’ time horizons. At some point this year or next, we will begin to see supply and demand balancing, but when will the equities discount that?
Time To HiT THe Road: a New map foR eNeRgy iNvesTiNgGlobal Natural Resources Semiannual Report
Authored by: Robin Wehbé, CFA, CMT
Navigating the Energy sector in recent months has been challenging for many investors, to say the least. However, this may actually be a compelling time to add exposure to natural-resources stocks. Portfolio Manager Robin Wehbe, CFA, CMT, explains why.
Spring 2016
2
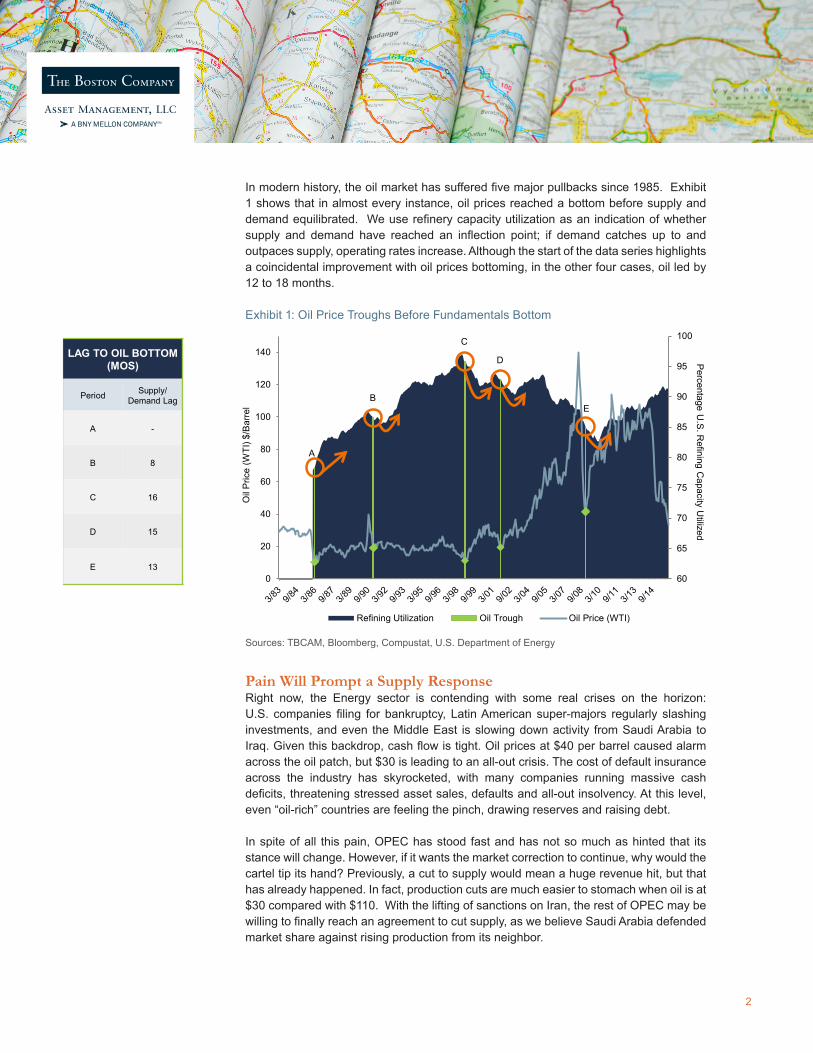
In modern history, the oil market has suffered five major pullbacks since 1985. Exhibit 1 shows that in almost every instance, oil prices reached a bottom before supply and demand equilibrated. We use refinery capacity utilization as an indication of whether supply and demand have reached an inflection point; if demand catches up to and outpaces supply, operating rates increase. Although the start of the data series highlights a coincidental improvement with oil prices bottoming, in the other four cases, oil led by 12 to 18 months.
Exhibit 1: Oil Price Troughs Before Fundamentals Bottom
Sources: TBCAM, Bloomberg, Compustat, U.S. Department of Energy
Pain Will Prompt a Supply ResponseRight now, the Energy sector is contending with some real crises on the horizon: U.S. companies filing for bankruptcy, Latin American super-majors regularly slashing investments, and even the Middle East is slowing down activity from Saudi Arabia to Iraq. Given this backdrop, cash flow is tight. Oil prices at $40 per barrel caused alarm across the oil patch, but $30 is leading to an all-out crisis. The cost of default insurance across the industry has skyrocketed, with many companies running massive cash deficits, threatening stressed asset sales, defaults and all-out insolvency. At this level, even “oil-rich” countries are feeling the pinch, drawing reserves and raising debt.
In spite of all this pain, OPEC has stood fast and has not so much as hinted that its stance will change. However, if it wants the market correction to continue, why would the cartel tip its hand? Previously, a cut to supply would mean a huge revenue hit, but that has already happened. In fact, production cuts are much easier to stomach when oil is at $30 compared with $110. With the lifting of sanctions on Iran, the rest of OPEC may be willing to finally reach an agreement to cut supply, as we believe Saudi Arabia defended market share against rising production from its neighbor.
LAG TO OIL BOTTOM (MOS)
Period Supply/ Demand Lag
A -
B 8
C 16
D 15
E 1360
65
70
75
80
85
90
95
100
0
20
40
60
80
100
120
140
Percentage U
.S. R
efining Capacity U
tilized
Oil
Pric
e (W
TI) $
/Bar
rel
Refining Utilization Oil Trough Oil Price (WTI)
A
B
C
D
E

3
But OPEC is not the only player with something to lose. Brazil cannot afford to see Petrobras — one of the country’s largest companies and employers — fail, especially with a significant amount of foreign-owned debt. The company has been aggressively cutting spending, yet its cash burn remains severe.
At $30 to $35 a barrel, oil supply evaporates, but if prices fall any lower, we could see a more pronounced supply cut and more insolvency. Volatility may remain fierce, but a lower oil price will be its own rapid cure.
Upside AheadFrom the trough, oil stocks tend to bounce with vigor. In 2009, the S&P North American Natural Resource Sector Index rallied almost 38% after a very painful 2008. While we do not expect great upside in oil, we are currently at or very near trough margins, as revenues have been hit and costs have yet to fully adjust. We view stocks as too heavily discounted and forward earnings estimates as too low.
Exhibit 2 highlights the importance of buying the equities as close to oil’s bottom as possible. Waiting for the trough in earnings is too late, as evidenced by the very mixed results shown in the table and chart. Equities have fared poorly as oil falls, only to rebound strongly in the following two years (with brief exceptions caused by the Gulf War and the Sept. 11 attacks). As history illustrates, stocks often move well in advance of the margin trough.
Exhibit 2: Waiting for Earnings to Bottom Is Too Late
*Gulf War **9/11. Sources: TBCAM, Bloomberg, Compustat, U.S. Department of Energy
OIL TROUGH EBIT TROUGH
Period Trough Date
Prior YrPerf
Next Year Perf
Second Year Perf
Growth Rate
Trough Date
Prior YrPerf
Next Year Perf
Second Year Perf
Growth Rate
Oil to EBIT
Troughs (Mos)
A 03/86 -11.8% 42.0% -5.9% 15.6% 07/87 87.6% -19.1% 30.4% 2.7% 16
B 02/91 0.1% -14.6% 23.3% 2.6%* 07/92 1.2% 17.8% -3.2% 6.8% 17
C 11/98 -14.6% 21.6% 27.7% 24.6% 07/99 24.2% 13.6% 9.8% 11.7% 8
D 11/01 -14.6% -18.6% 31.1% 3.3%** 11/02 -18.6% 31.1% 52.6% 41.4% 12
E 01/09 -41.9% 41.7% 40.1% 40.9% 12/09 48.5% 25.9% 1.7% 13.2% 11
0
20
40
60
80
100
120
140
160
180
200
0
20
40
60
80
100
120
140
160
180
200 Cum
ulative Grow
th of S&
P 500 E
nergy Sector
Oil
Pric
e (W
TI) $
/Bar
rel
S&P 500 Energy Sector Oil Trough EBIT Trough Oil Price (WTI)

4
Many pundits have been pinpointing the $50-a-barrel level as the new mid-cycle Goldilocks, supporting some investment but not too much. How do they arrive at this number? How are they discounting $50 oil?
The first thing that Wall Street does when oil prices fall is slash energy companies’ earnings and revenue estimates. What takes time — and what many analysts underestimate and underappreciate — is the level of cost cuts. Their estimates are largely based on oil-price forecasts and some tweaks to historical costs. Thus, marginal savings to costs have most analysts agreeing that $50 is the new reinvestment level. However, we believe cost savings will be far more substantial, especially as the pain clears out all the weak operators.
Exhibit 3 charts the time and depth of margins as well as their surprisingly symmetrical recovery. Note that the most recent pullback in margins is the longest, deepest and lowest absolute level we have seen in recent history. Why do margins rebound so quickly and how might this cycle exemplify a similarly bewildering recovery?
Exhibit 3: Charting Margin Recoveries
Margin Symmetry: Oil Troughs, Margins Contract, Margins Expand
Sources: TBCAM, Bloomberg, Compustat, U.S. Department of Energy
0
5
10
15
20
25
0
20
40
60
80
100
120
140
EB
IT Margin (%
)S
&P
500 Energy S
ector
Oil
(WTI
) $/B
arre
l
EBIT Margins EBIT Trough Oil Trough Oil Price (WTI)
TROUGH TO PEAK EBIT MARGINS
Period Peak Date
Peak Level
Trough Date
Trough Level
Length of Contraction
(Mos)
Peak-Trough Decline
Subsequent Expansion Height
A 01/86 13.3% 07/87 9.1% 18 -4.2% 18 2.6%
B 01/89 11.7% 07/92 7.4% 42 -4.3% 66 4.7%
C 01/98 12.1% 07/99 6.3% 18 -5.8% 28 8.8%
D 11/01 15.1% 11/02 8.0% 12 -7.1% 57 11.4%
E 08/07 19.4% 12/09 8.8% 28 -10.6% 24 8.5%
F 12/11 17.3% 12/15 1.6% 48 -15.7% ? ?
?

5
Synergies will abound, with huge opportunities in operations, financials and management. Think of this analogy:
After a warm, sunny spring, both you and your neighbor want to build patios, so you head to the local hardware store to rent some power tools and supplies. You put down your credit card, despite the high interest rate, because you want to enjoy the summer on your new patio. You and your neighbor also engage in a bidding war for help, as the teenagers in your neighborhood are in high demand. You also decide that a fence dividing your yards — and new patios — would give you more privacy.
Contrast the combined cost of labor, resources, time and financing with this scenario:
After a period of gloomy weather and a poor job market, you decide to use the piles of cash you’ve stashed under your mattress. You go to the hardware store and pay cash for your tools, and local teenagers are ready to build you a patio because you’re the only person in town who is hiring. Because you want to enjoy your outdoor space alone, you buy your neighbor’s house and tear it down — it’s too expensive to maintain, anyway. Voila, a patio and privacy, with no costly interest, no expensive rental tools and cheap labor. You don’t even have to put up a fence!
As this example illustrates on a much smaller scale, companies with large balance sheets can devour ones teetering on insolvency, use their balance sheet as cheaper financing, eliminate vast amounts of overhead from executives to headquarters, and certainly have less need for limited-value-adding fences. Consider the geography of the Permian Basin: a large, flat, open range dotted with drill rigs, separated by seemingly random chain-link fences marked by different corporate logos. How many public E&P companies do we need? We can drill oil for less money, and eventually we will.

6
The Overcapitalization HangoverWhile we believe commodity prices are near a bottom and the sector looks attractive, the overcapitalization and efficiencies we will eventually see are likely to keep rallies subdued. Short-cycle investments will bring on incremental supply without large project spending, which will keep markets closer to balance.
But in that dynamic, there is reinvestment, and we look for leverage to activity, not price. Revenue equals price times volume. While we may trade the cycle opportunistically, we favor companies that create value with activity, not price, and that are focused on volume leverage.
We are, however, steering clear of equipment and infrastructure. The past commodity cycle’s ferocity since 2000 has only been equaled by investment in supply. A lot has been built — from drill rigs to pipelines, to iron ore and copper mines, to ghost cities in China. Much of this is not needed for the next cycle, and management teams and investors, having barely survived the last cycle, will be loath to deploy capital toward long-cycle projects. Anything that can be put into a “backlog” or requires a team of engineers or involves significant capital will likely be shunned, and investment prioritization will be on short-cycle and cash returns.
Opportunities Across the Value Chain
Producers Servicers Transporters Processors Manufacturers
Exploration & Production
(E&P)
Energy Services
MLPs, Railways, Shipping
Refining, LNG, Terminals/Ports
Fuel, Plastics, Coatings, Fertilizers
Own the Oil Extract the Oil Move the Oil Aggregate & Upgrade the Oil
Buy Oil Derivatives, Sell
Final Product
Oil price sensitive – short
investmentcycle limits
upside
Activity sensitive –
benefit from volume growth
Volume sensitive –
benefit from fixed investment
growth
High barriers to entry creates bottleneck,
benefits from oversupplied oil
End consumer exposed,
benefit from stable oil to
execute business model
Neutral Very Attractive Unattractive Very Attractive Attractive

7
About the Author
Robin Wehbé, CFA, CMT Managing Director, Portfolio ManagerRobin is a senior research analyst on The Boston Company’s Global Research team, covering the energy sector. He is also is the lead portfolio manager of The Boston Company’s Global Natural Resources and Global Independence strategies, which take a bottom-up macro approach to investing. In addition, he serves as a member of the Global Insight team, a group of the firm’s investment leaders. In 2006, Robin joined The Boston Company as a global basic materials analyst. Since then, Robin has designed and launched the Global Natural Resources strategy in 2008, became the lead manager of the Dreyfus Natural Resources mutual fund in 2009, and launched the firm’s long/short natural-resources strategy in addition to designing and launching the Global Independence strategy in 2013. Before coming to the firm, Robin worked as a research analyst covering basic materials at State Street Global Advisors, where he began macro-focused investing in 2003 as part of the company’s Global Strategy team. He holds a B.S. from Lehigh University and an M.B.A. and an M.S.F. from the Carroll School of Management at Boston College. He holds both the Chartered Financial Analyst® and the Chartered Market Technician designations. He is a member of the Boston Security Analysts Society and the Market Technicians Association.
DisclosureAny statements of opinion constitute only current opinions of The Boston Company Asset Management, LLC (TBCAM), which are subject to change and which TBCAM does not undertake to update. Due to, among other things, the volatile nature of the markets and the investment areas discussed herein, they may only be suitable for certain investors.This publication or any portion thereof may not be copied or distributed without prior written approval from TBCAM. Statements are correct as of the date of the material only. This document may not be used for the purpose of an offer or solicitation in any jurisdiction or in any circumstances in which such offer or solicitation is unlawful or not authorised. The information in this publication is for general information only and is not intended to provide specific investment advice or recommendations for any purchase or sale of any specific security.Some information contained herein has been obtained from third party sources that are believed to be reliable, but the information has not been independently verified by TBCAM. TBCAM makes no representations as to the accuracy or the completeness of such information.Listed securities are being presented for illustrative purposes only. This is not a recommendation to buy, sell, or hold these securities.No investment strategy or risk management technique can guarantee returns or eliminate risk in any market environment.CFA® and Chartered Financial Analyst® are registered trademarks owned by CFA Institute.CMT® and Chartered Market Technician® are registered trademarks owned by Market Technicians Association.For more market perspectives and insights from our teams, please visit,http://www.thebostoncompany.com/web/tbc/literature