time-resolved wavelength modulation spectroscopy measurements of ho_2 kinetics
TRANSCRIPT

Time-resolved wavelength modulationspectroscopy measurements of HO2 kinetics
Craig A. Taatjes and Daniel B. Oh
High-frequency wavelength modulation spectroscopy ~WMS! has been applied to the detection of thehydroperoxyl radical ~HO2! in a laser photolysis and long-path absorption pump-probe kinetics reactorwith a near-infrared distributed feedback diode laser. The HO2 is formed by the 355-nm photolysis ofCl2 in the presence of CH3OH and O2 and monitored by a phase-sensitive detection of the second-harmonic ~2f ! signal in the 2n1 band with a 1.5-mm diode laser directly modulated at 5 MHz. Themeasured 2f WMS signal is calibrated by direct absorption and converted to an absolute number densitywith the known absorption line strength of the HO2 line at 6625.80 cm21. The utility of time-resolvedWMS as a second-order kinetics probe is demonstrated through the measurement of the HO2 self-reactionrate constant at 295 K. © 1997 Optical Society of America
1. Introduction
The hydroperoxyl radical ~HO2! is an important in-termediate in hydrocarbon combustion with its criti-cal role in the initiation of autoignition1,2 and inatmospheric chemistry.3 In combustion kinetics,studies of HO2 reactions, where many important re-actions are much slower than the self-reaction, a lowHO2 concentration is required. This requirement,in turn, calls for a sensitive means of detecting HO2with sufficient time resolution to yield kinetic param-eters. Conventional optical detection methods havelimited usefulness because the UV absorption spec-trum of HO2 is broad and structureless due to pre-dissociation and is overlapped by many other species,including alkyl peroxy radicals.
Diode-laser-based detection methods can providethe needed sensitivity and selectivity. High-frequency wavelength modulation spectroscopy~WMS! gives excellent detection limits even whenrelatively weak near-infrared transitions are used.Reports of detection sensitivities close to the detectorshot-noise limit have appeared under favorable con-ditions.4,5 Time resolution that is useful for gas ki-
C. A. Taatjes is with the Combustion Research Facility, MailStop 9055, Sandia National Laboratories, Livermore, California94551-0969. D. B. Oh is with Southwest Sciences, Incorporated,1570 Pacheco Street, Suite E-11, Santa Fe, New Mexico 87505.
Received 15 August 1996; revised manuscript received 10 March1997.
0003-6935y97y245817-05$10.00y0© 1997 Optical Society of America
netics studies has been demonstrated with FMspectroscopy,6 and transient FM spectroscopy hasnow found applications in the spectroscopy of reactivespecies7 and in the study of chemical kinetics in thepseudo-first-order limit.8 However, the applicationof high-frequency WMS to time-resolved gas phasekinetics study or application of modulation tech-niques to second-order kinetics has not, to our knowl-edge, been clearly demonstrated. We distinguishFM from WMS because of the frequency of the mod-ulation used. Although the difference may seemonly semantic, WMS can be much easier to imple-ment because the lower-frequency ~;10 MHz! elec-tronic components are simpler to use than are themicrowave components needed for FM spectroscopyat near-IR wavelengths.
In addition to the high detection sensitivity, speciesselectivity, and the time resolution required, thediode-laser-based WMS measurement should be pro-portional to the time-dependent concentration of themonitored species, and the calibration step should beconvenient and reliable. The optical signal result-ing from WMS measurement is linearly proportionalto the absolute absorbance in optically thin limit ~ab-sorbance of ;1% or less!, and the proportionality con-stant is established easily by comparison with directabsorption measurement. Though not utilized inthis experiment, the near-IR WMS signal can be de-tected with an InGaAs photodiode detector capable ofsimultaneously monitoring ac ~WMS! and dc ~I0! com-ponents for real-time normalization of the WMS sig-nal. The reliability of calibration is often limited bythe signal level of the direct absorption measurement
20 August 1997 y Vol. 36, No. 24 y APPLIED OPTICS 5817

and not by the WMS detection. We also note thatHO2 kinetics can be probed in the mid-IR with lead-salt diode lasers when vibrational fundamentalbands are accessed. All three band strengths havebeen determined experimentally,9,10 and much stron-ger HO2 absorption lines are available. High-frequency WMS11,12 and FM13,14 spectroscopyutilizing lead-salt diode lasers are well established.
Some of the considerations of using laser photolysisto prepare the reactant and to monitor either thereactant or the product concentration with a time-resolved absorption technique include ~1! thenanosecond-to-microsecond time scale for the colli-sional thermalization of the nascent reactant or prod-uct should be fast compared with the reaction rates tobe studied; and ~2! the periodic probe beam steering,termed thermal lensing, that is caused by the radialacoustic waves formed inside the cylindrical photol-ysis cell by the photolysis pulse should be minimized.As discussed below, the 2f WMS signal is relatedlinearly to the change in absorbance.
In the present research we describe the utility oftime-resolved WMS as a kinetics probe, includingapplication to second-order reaction kinetics whereabsolute concentrations of reactants need to be mea-sured. We directly modulated a distributed feed-back diode laser operating at 1.5 mm usingmodulation of the injection current, and the laser isused to probe the HO2 radical in the n1 first overtoneband. The midterm ~;45 min! stability of the 2fWMS signal calibration in our setup was found to be614%, as measured by the deviation in measuredHO2 self-reaction rate constants.
2. Experiment
The hydroperoxyl radical is produced by photolysis ofchlorine in the presence of methanol and oxygen withthe following reaction sequence:
Cl23hn
2Cl,
Cl 1 CH3OH3 CH2OH 1 HCl, (1)
CH2OH 1 O23HO2 1 CH2O. (2)
Rate constants for reactions ~1! and ~2! are 5.7 310211 cm3 molecule21 s21 and 9.1 3 10212 cm3 mol-ecule21 s21, respectively.15 Species concentrationsare chosen so that production of HO2 would be essen-tially complete before any reactions of HO2 tookplace; specifically the contribution of Cl 1 HO2 andCH2OH 1 HO2 reactions are minimized. However,measurements made at higher initial Cl concentra-tions, even where secondary reactions of intermedi-ate products with HO2 are evident, give results forthe HO2 self-reaction rate constant in agreementwith the other determinations.
The experimental apparatus is shown schemati-cally in Fig. 1. The reaction cell is a 150-cm-longstainless-steel cell equipped with 3° wedged CaF2windows. Flows of 1% Cl2 in He, 10% O2 in Ar, neatCH3OH, and Ar buffer are controlled by mass flowcontrollers. Pressures are measured with a capaci-
5818 APPLIED OPTICS y Vol. 36, No. 24 y 20 August 1997
tance manometer attached to the outlet of the cell,and the total pressure ~50 Torr in the present exper-iments! is controlled actively with a butterfly valve inthe outlet. The Cl2 is photolyzed with between 35and 70 mJypulse of 355-nm light from a Nd:YAGlaser. We combined the photolysis beam with thediode laser probe beam using a dichroic mirror. Asecond dichroic mirror removes the pump beam whileallowing the near-IR beam probe beam to make asecond pass through the cell. The probe beam is anoutput from a distributed feedback InGaAsP diodelaser that is frequency modulated at 5 MHz when theinjection current is modulated directly. The trans-mitted diode beam is imaged onto either an InGaAsor a Ge photodiode. The output of the photodiode isthen filtered and demodulated at twice the frequencyof modulation ~2f !, and the resulting demodulatedsignal is amplified and digitized with a digital oscil-loscope. Spectra are taken with a gated integratoryboxcar averager combination.
To calibrate the 2f WMS absorption signal, directabsorption spectra of HO2 are taken with a dc-coupledphotodiode detector while the diode laser current isramped slowly. We measured the transmitted powerwithout HO2 ~I0! by chopping the diode beam. Thesignal is amplified 100 to 1000 times, and the resultantdirect absorption line shapes are fitted to a Voigt pro-file. We took transient HO2 traces using both directabsorption and 2f WMS under the same photolysisconditions, with the diode laser frequency fixed at thecenter of the absorption. The peak transient absorp-tion, taken at the highest point in the HO2 time evo-lution, is then used in conjunction with the measuredline profiles to calibrate the 2f WMS signal strength.Figure 2 shows a FM and a direct absorption scan overthe pair of HO2 lines at 6625.80 and 6625.68 cm21 as~a! and ~b!, respectively. The dashed curve in Fig. 2~b!is a fit to a Voigt profile that was used to estimate thepeak absorbance. Under the conditions of the exper-iment ~50-Torr total pressure!, collisional broadening
Fig. 1. Schematic of the experimental apparatus. The demodu-lated signal is amplified by a variable-gain amplifier with a variablehigh-pass and low-pass filter. Typically the signal was low-passfiltered at 100 kHz, which determines the detection bandwidth.RF, relative frequency; IF, intermediate frequency; LO, local oscil-lator.

contributes approximately 60% to the observed line-width.
Photolysis of the Cl2yCH3OHyO2 mixtures giveslarge 2f WMS signals at the 2n1 transition. Peakabsorption of ;0.1% at the 6625.8-cm21 line is at-tainable under typical conditions ~approximately 175mTorr each of Cl2 and O2 and 250 mTorr CH3OH at50-Torr total pressure! with 75 mJypulse of 355-nmlight. The detected 2f WMS signals show a signal-to-noise ratio of ;10 for single-shot detection. Fromthe previously measured absorption line strengths ofHO2 at 6625.8 cm21,16,17 we calculate a minimumdetectable concentration ~single-shot signal-to-noiseratio of 1! of approximately 3 3 1013 HO2 moleculescm23 at 295 K. This performance corresponds to aminimum detectable absorbance of 5 3 1024 in a1-MHz detection bandwidth, or 5 3 1027 in a 1-Hzdetection bandwidth assuming a square-root im-provement of the signal-to-noise ratio with increasedsignal-averaging time. This noise estimate does notinclude the contribution of the thermal-lensing noisetransmitted through amplitude modulation of theprobe laser intensity, which is shown for a directabsorption measurement in the insert of Fig. 3.Thermal lensing, which is an important noise sourcein many laser pump-probe experiments, is consider-ably reduced in WMS detection and contributes prin-cipally by way of residual amplitude modulation.The minimum detectable absorbance observed in thepresent time-resolved experiments is comparable toour previously reported mid-IR diode laser modula-
Fig. 2. Spectra of HO2 formed by photolysis of Cl2yCH3OHyO2
mixtures with ~a! 2f WMS detection and ~b! direct absorption.The acquisition conditions are identical. We used the Voigt fit~dashed curve! to the direct absorption lines to calibrate the 2fWMS signal for absolute HO2 concentration measurements, usingthe line strengths of Ref. 17.
tion experiments11,12 and is ;30 times the detectorshot-noise limit.
3. Results and Discussion
This study demonstrates the utility of time-resolved2f detection signal of WMS as a tool to study reactionkinetics, including second-order reactions. Al-though pseudo-first-order kinetic studies requiremeasurement of only relative concentration, asecond-order reaction kinetic study such as the HO2self-reaction requires absolute concentration mea-surements. Figure 3 shows a time-resolved 2f WMSsignal detected at the optimum detection phase ~i.e.,the strongest 2f WMS signal!. Use of such a time-resolved 2f WMS signal for kinetics studies also re-quires that the observed signal be related easily tothe time-dependent concentration of the absorbingspecies. Once the 2f WMS signal is calibratedagainst a direct absorption spectrum at a given de-tection electronics setting ~i.e., detection phase, mod-ulation frequency, etc.!, any drifts in the calibrationfactor will stem from ~1! drifts in the diode laseroutput frequency or power that are due to tempera-ture and injection currect drift; and ~2! drifts in ex-perimental conditions such as total cell pressure,precursor gas flows and compositions, and the pump-probe beam overlap.
A direct absorption spectrum acquired immedi-ately after a 2f WMS measurement under identicalexperimental conditions is used to calibrate the 2fsignal level to the absorbance. The absorbance isthen converted into absolute HO2 concentration withthe measured HO2 line strength of Ref. 17 to calcu-late the peak cross section and the optical pathlength. The calibrated 2f WMS trace and severalsuccessive traces taken at varying @Cl2# are shown in
Fig. 3. Experimental time-resolved 2f WMS traces of HO2, takenunder the optimum detection phase setting for maximum 2f signalintensity. The insert shows a time-resolved direct absorptionmeasurement with the probe laser tuned off the HO2 absorptionfeature and indicates the extent of probe beam steering by thethermal lensing. The contribution of thermal-lensing noise at themodulation frequency is much smaller than for direct absorptionand results almost exclusively from residual amplitude modula-tion.
20 August 1997 y Vol. 36, No. 24 y APPLIED OPTICS 5819
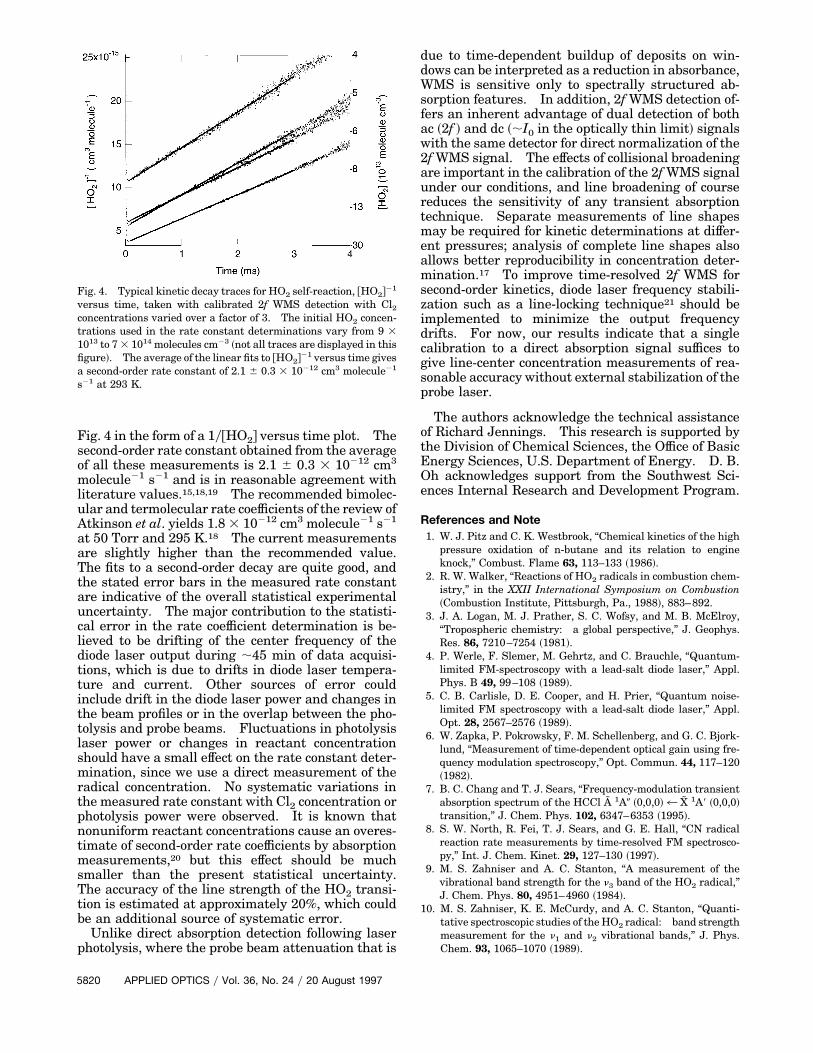
Fig. 4 in the form of a 1y@HO2# versus time plot. Thesecond-order rate constant obtained from the averageof all these measurements is 2.1 6 0.3 3 10212 cm3
molecule21 s21 and is in reasonable agreement withliterature values.15,18,19 The recommended bimolec-ular and termolecular rate coefficients of the review ofAtkinson et al. yields 1.8 3 10212 cm3 molecule21 s21
at 50 Torr and 295 K.18 The current measurementsare slightly higher than the recommended value.The fits to a second-order decay are quite good, andthe stated error bars in the measured rate constantare indicative of the overall statistical experimentaluncertainty. The major contribution to the statisti-cal error in the rate coefficient determination is be-lieved to be drifting of the center frequency of thediode laser output during ;45 min of data acquisi-tions, which is due to drifts in diode laser tempera-ture and current. Other sources of error couldinclude drift in the diode laser power and changes inthe beam profiles or in the overlap between the pho-tolysis and probe beams. Fluctuations in photolysislaser power or changes in reactant concentrationshould have a small effect on the rate constant deter-mination, since we use a direct measurement of theradical concentration. No systematic variations inthe measured rate constant with Cl2 concentration orphotolysis power were observed. It is known thatnonuniform reactant concentrations cause an overes-timate of second-order rate coefficients by absorptionmeasurements,20 but this effect should be muchsmaller than the present statistical uncertainty.The accuracy of the line strength of the HO2 transi-tion is estimated at approximately 20%, which couldbe an additional source of systematic error.
Unlike direct absorption detection following laserphotolysis, where the probe beam attenuation that is
Fig. 4. Typical kinetic decay traces for HO2 self-reaction, @HO2#21
versus time, taken with calibrated 2f WMS detection with Cl2concentrations varied over a factor of 3. The initial HO2 concen-trations used in the rate constant determinations vary from 9 31013 to 7 3 1014 molecules cm23 ~not all traces are displayed in thisfigure!. The average of the linear fits to @HO2#21 versus time givesa second-order rate constant of 2.1 6 0.3 3 10212 cm3 molecule21
s21 at 293 K.
5820 APPLIED OPTICS y Vol. 36, No. 24 y 20 August 1997
due to time-dependent buildup of deposits on win-dows can be interpreted as a reduction in absorbance,WMS is sensitive only to spectrally structured ab-sorption features. In addition, 2f WMS detection of-fers an inherent advantage of dual detection of bothac ~2f ! and dc ~;I0 in the optically thin limit! signalswith the same detector for direct normalization of the2f WMS signal. The effects of collisional broadeningare important in the calibration of the 2f WMS signalunder our conditions, and line broadening of coursereduces the sensitivity of any transient absorptiontechnique. Separate measurements of line shapesmay be required for kinetic determinations at differ-ent pressures; analysis of complete line shapes alsoallows better reproducibility in concentration deter-mination.17 To improve time-resolved 2f WMS forsecond-order kinetics, diode laser frequency stabili-zation such as a line-locking technique21 should beimplemented to minimize the output frequencydrifts. For now, our results indicate that a singlecalibration to a direct absorption signal suffices togive line-center concentration measurements of rea-sonable accuracy without external stabilization of theprobe laser.
The authors acknowledge the technical assistanceof Richard Jennings. This research is supported bythe Division of Chemical Sciences, the Office of BasicEnergy Sciences, U.S. Department of Energy. D. B.Oh acknowledges support from the Southwest Sci-ences Internal Research and Development Program.
References and Note1. W. J. Pitz and C. K. Westbrook, “Chemical kinetics of the high
pressure oxidation of n-butane and its relation to engineknock,” Combust. Flame 63, 113–133 ~1986!.
2. R. W. Walker, “Reactions of HO2 radicals in combustion chem-istry,” in the XXII International Symposium on Combustion~Combustion Institute, Pittsburgh, Pa., 1988!, 883–892.
3. J. A. Logan, M. J. Prather, S. C. Wofsy, and M. B. McElroy,“Tropospheric chemistry: a global perspective,” J. Geophys.Res. 86, 7210–7254 ~1981!.
4. P. Werle, F. Slemer, M. Gehrtz, and C. Brauchle, “Quantum-limited FM-spectroscopy with a lead-salt diode laser,” Appl.Phys. B 49, 99–108 ~1989!.
5. C. B. Carlisle, D. E. Cooper, and H. Prier, “Quantum noise-limited FM spectroscopy with a lead-salt diode laser,” Appl.Opt. 28, 2567–2576 ~1989!.
6. W. Zapka, P. Pokrowsky, F. M. Schellenberg, and G. C. Bjork-lund, “Measurement of time-dependent optical gain using fre-quency modulation spectroscopy,” Opt. Commun. 44, 117–120~1982!.
7. B. C. Chang and T. J. Sears, “Frequency-modulation transientabsorption spectrum of the HCCl A 1A0 ~0,0,0!4 X 1A9 ~0,0,0!transition,” J. Chem. Phys. 102, 6347–6353 ~1995!.
8. S. W. North, R. Fei, T. J. Sears, and G. E. Hall, “CN radicalreaction rate measurements by time-resolved FM spectrosco-py,” Int. J. Chem. Kinet. 29, 127–130 ~1997!.
9. M. S. Zahniser and A. C. Stanton, “A measurement of thevibrational band strength for the n3 band of the HO2 radical,”J. Chem. Phys. 80, 4951–4960 ~1984!.
10. M. S. Zahniser, K. E. McCurdy, and A. C. Stanton, “Quanti-tative spectroscopic studies of the HO2 radical: band strengthmeasurement for the n1 and n2 vibrational bands,” J. Phys.Chem. 93, 1065–1070 ~1989!.

1
1
1
2
2
11. D. S. Bomse, A. C. Stanton, and J. A. Silver, “Frequency mod-ulation and wavelength modulation spectroscopies: compar-ison of experimental methods using a lead-salt diode laser,”Appl. Opt. 31, 718–731 ~1992!.
12. J. A. Silver, “Frequency-modulation spectroscopy for trace spe-cies detection: theory and comparison among experimentalmethods,” Appl. Opt. 31, 707–717 ~1992!.
13. M. Gehrtz, W. Lenth, A. T. Young, and H. S. Johnston, “Highfrequency-modulation spectroscopy with a lead-salt diode la-ser,” Opt. Lett. 11, 132–134 ~1986!.
14. D. E. Cooper and J. P. Watjen, “Two-tone optical heterodynespectroscopy with a tunable lead-salt diode laser,” Opt. Lett.11, 606–608 ~1986!.
15. R. Atkinson, D. L. Baulch, R. A. Cox, R. F. Hampson, Jr., J. A.Kerr, and J. Troe, “Evaluated kinetic and photochemical datafor atmospheric chemistry. Supplement IV. IUPAC sub-committee on gas kinetic data evaluation for atmosphericchemistry,” J. Phys. Chem. Ref. Data 21, 1125–1568 ~1992!.
16. T. J. Johnson, F. G. Wienhold, J. P. Burrows, G. W. Harris, and
H. Burkhard, “Measurements of line strengths in the HO2 n1
overtone band at 1.5 mm using an InGaAsP laser,” J. Phys.Chem. 95, 6499–6502 ~1991!.
7. S ~293 K! 5 2.4 3 10221 cm2 molecule21 cm21 for the HO2 2n1
line at 6625.8 cm21; D. B. Oh, M. E. Paige, A. C. Stanton, andJ. A. Silver, manuscript in preparation ~1997!.
8. M. M. Maricq and J. J. Szente, “A kinetic study of the reactionbetween ethylperoxy radicals and HO2,” J. Phys. Chem. 98,2078–2082 ~1994!.
9. D. L. Baulch, C. J. Cobos, R. A. Cox, C. Esser, P. Frank, Th.Just, J. A. Kerr, M. J. Pilling, J. Troe, R. W. Walker, and J.Warnatz, “Evaluated kinetic data for combustion modeling,” J.Phys. Chem. Ref. Data 21, 411–429 ~1992!.
0. A. Fahr and A. H. Laufer, “Errors associated with nonuniformconcentrations upon rate constants using absorption tech-niques,” Int. J. Chem. Kinet. 25, 1029–1035 ~1993!.
1. D. S. Bomse, “Dual-modulation laser line-locking scheme,”Appl. Opt. 30, 2922–2924 ~1991!.
20 August 1997 y Vol. 36, No. 24 y APPLIED OPTICS 5821