time-resolved analysis of density f resonant air-methane flame using ... · the cone mean solid...
TRANSCRIPT

1
ISABE-2007-1187
TIME-RESOLVED ANALYSIS OF DENSITY FLUCTUATIONS IN A RESONANT AIR-METHANE FLAME USING DUAL LASER VIBROMETRY FOR GAS TURBINE COMBUSTOR QUALIFICATION TESTS
Fabrice Giuliani, Andreas Lang, Thomas Leitgeb,
Jakob Woisetschläger, Franz Heitmeir Combustion Department, Institute for Thermal Turbomachinery and Machine
Dynamics, Graz University of Technology, 8010 Graz, Austria
Abstract A diagnostic technique based on laser interferometry is used to observe the fluctuation of density in a flame. The idea is to develop a sensing technique able to detect combustion instability, based on a sensible line-of-sight, laser-based optical method: the laser vibrometry. A test case involving an atmospheric premixed air-methane burner is presented. We show with the help of support measurement techniques that the sensitivity of the dual laser vibrometry (DLV) technique regarding combustion stability is very high. For the researcher, this is a new tool for describing turbulent flames. For the engineer, DLV is recommended as a benchmark method for fast characterisation of the flame stability during the qualification tests of a gas turbine combustor. DLV finally represents an option as an in-situ combustion stability monitoring technique. Nomenclature P’ acoustic pressure Q’ unsteady heat release R Rayleigh criterion [1] S Swirl number Uref reference velocity in axial
direction at the injector venturi outlet
V volume φ Equivalence ratio ρ’ density fluctuation τ period DLV Dual laser vibrometry GT Gas turbine PDF Probability density function
Introduction The Combustion Department at the Graz University of Technology (TU Graz) specialises on the development of strategies for embedded combustion stability monitoring, in order to detect the presence of combustion instabilities in a GT combustor. Figure 1 displays two strategies, first with optical elements placed in the diffuser that observe the flame through the cooling holes, and second with wall-mounted pressure sensors placed inside the diffuser or directly on the flame tube if the local conditions allow it. This paper focuses on the first option.
Mirror
Fast pressure sensors
Laser/photosensor
Spectral analysis
Ad - hoc filtering
Phase - locked trigger
Towards conditioned measurement
techniques / control
t
I
f
I
I
tI
t
Mirror
Fast pressure sensors
Laser/photosensor
Spectral analysis
Ad - hoc filtering
Phase - locked trigger
Towards conditioned measurement
techniques / control
t
I
t
I
f
I
f
I
I
t
II
tI
t
II
t
Figure 1: Strategies for flame stability monitoring, and signal conditioning for control purpose.
The Rayleigh criterion, as defined more than a century ago [1], remains the reference concept on the condition of existence of a combustion instability. Putnam and Dennis [2] expressed the criterion as follows:
∫ ∫=τ
τV
ddVQPR ''
where P’ is the local pressure fluctuation - of acoustic or hydrodynamic origin - and Q′ the local
Copyright ©2007 by the American Institute of Aeronautics and Astronautics Inc. All rights reserved
2
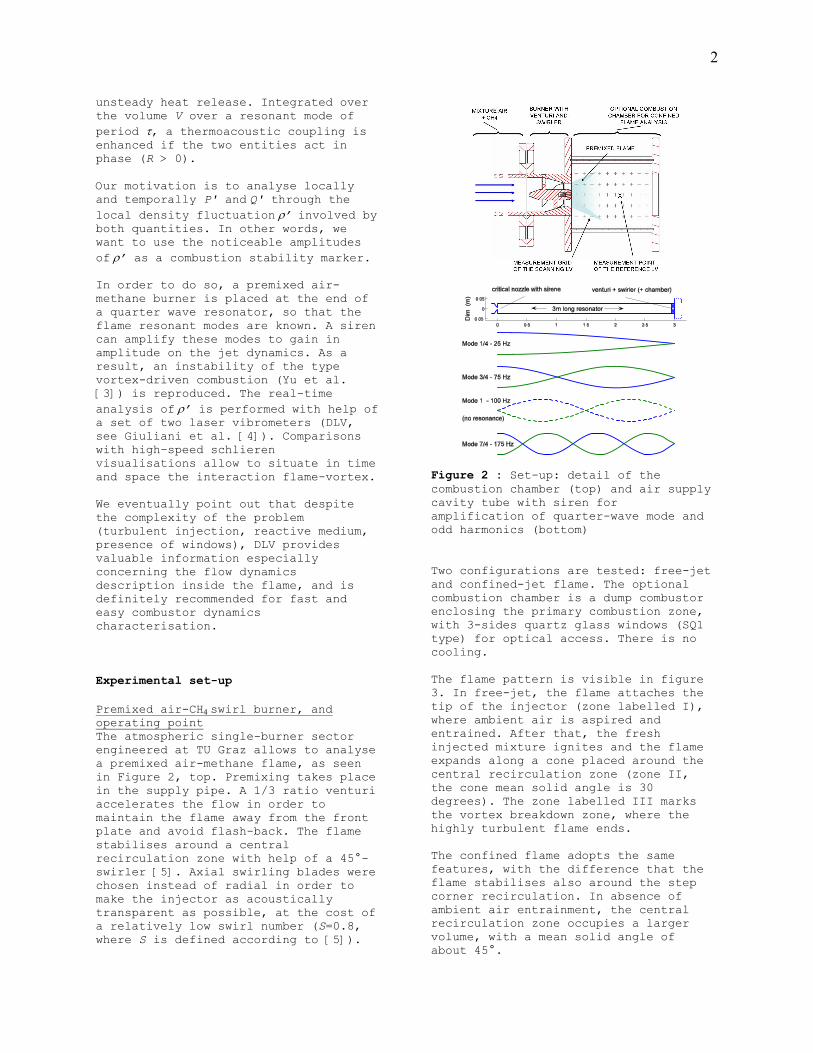
unsteady heat release. Integrated over the volume V over a resonant mode of period τ, a thermoacoustic coupling is enhanced if the two entities act in phase (R > 0). Our motivation is to analyse locally and temporally P′ and Q′ through the local density fluctuation ρ’ involved by both quantities. In other words, we want to use the noticeable amplitudes of ρ’ as a combustion stability marker. In order to do so, a premixed air-methane burner is placed at the end of a quarter wave resonator, so that the flame resonant modes are known. A siren can amplify these modes to gain in amplitude on the jet dynamics. As a result, an instability of the type vortex-driven combustion (Yu et al. [3]) is reproduced. The real-time analysis of ρ’ is performed with help of a set of two laser vibrometers (DLV, see Giuliani et al. [4]). Comparisons with high-speed schlieren visualisations allow to situate in time and space the interaction flame-vortex. We eventually point out that despite the complexity of the problem (turbulent injection, reactive medium, presence of windows), DLV provides valuable information especially concerning the flow dynamics description inside the flame, and is definitely recommended for fast and easy combustor dynamics characterisation. Experimental set-up Premixed air-CH4 swirl burner, and operating point The atmospheric single-burner sector engineered at TU Graz allows to analyse a premixed air-methane flame, as seen in Figure 2, top. Premixing takes place in the supply pipe. A 1/3 ratio venturi accelerates the flow in order to maintain the flame away from the front plate and avoid flash-back. The flame stabilises around a central recirculation zone with help of a 45°-swirler [5]. Axial swirling blades were chosen instead of radial in order to make the injector as acoustically transparent as possible, at the cost of a relatively low swirl number (S=0.8, where S is defined according to [5]).
Figure 2 : Set-up: detail of the combustion chamber (top) and air supply cavity tube with siren for amplification of quarter-wave mode and odd harmonics (bottom) Two configurations are tested: free-jet and confined-jet flame. The optional combustion chamber is a dump combustor enclosing the primary combustion zone, with 3-sides quartz glass windows (SQ1 type) for optical access. There is no cooling. The flame pattern is visible in figure 3. In free-jet, the flame attaches the tip of the injector (zone labelled I), where ambient air is aspired and entrained. After that, the fresh injected mixture ignites and the flame expands along a cone placed around the central recirculation zone (zone II, the cone mean solid angle is 30 degrees). The zone labelled III marks the vortex breakdown zone, where the highly turbulent flame ends. The confined flame adopts the same features, with the difference that the flame stabilises also around the step corner recirculation. In absence of ambient air entrainment, the central recirculation zone occupies a larger volume, with a mean solid angle of about 45°.
3
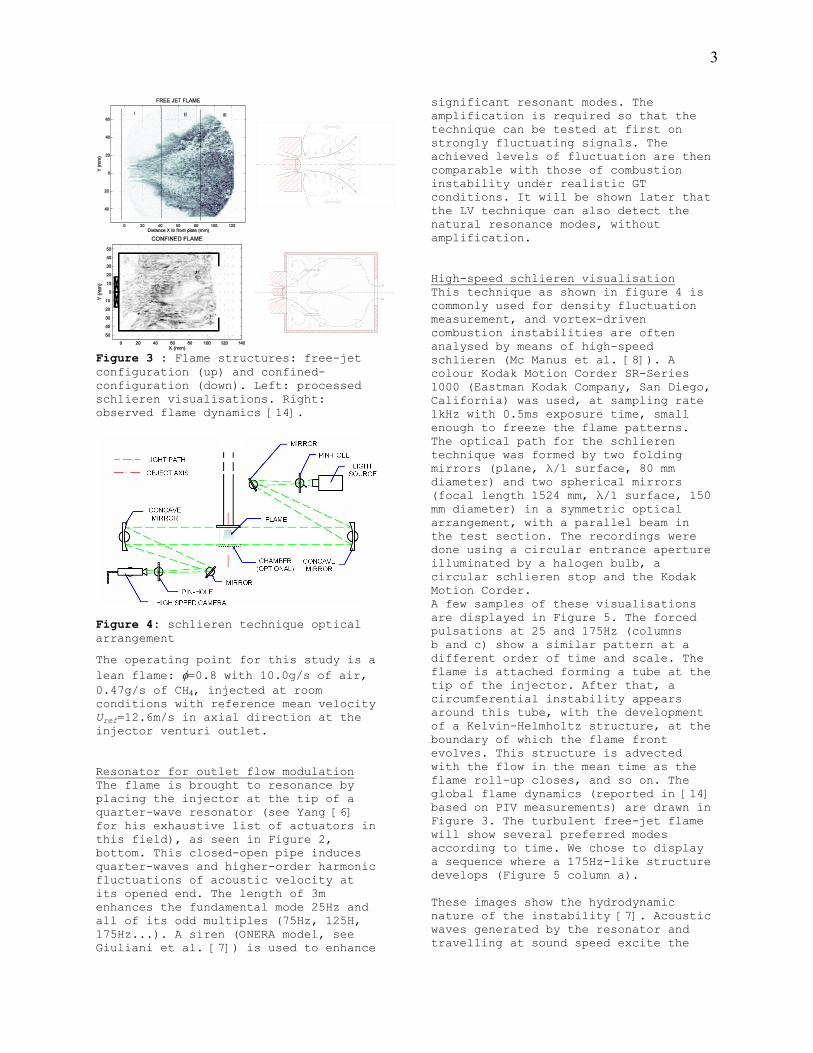
Figure 3 : Flame structures: free-jet configuration (up) and confined-configuration (down). Left: processed schlieren visualisations. Right: observed flame dynamics [14].
Figure 4: schlieren technique optical arrangement
The operating point for this study is a lean flame: φ=0.8 with 10.0g/s of air, 0.47g/s of CH4, injected at room conditions with reference mean velocity Uref=12.6m/s in axial direction at the injector venturi outlet. Resonator for outlet flow modulation The flame is brought to resonance by placing the injector at the tip of a quarter-wave resonator (see Yang [6] for his exhaustive list of actuators in this field), as seen in Figure 2, bottom. This closed-open pipe induces quarter-waves and higher-order harmonic fluctuations of acoustic velocity at its opened end. The length of 3m enhances the fundamental mode 25Hz and all of its odd multiples (75Hz, 125H, 175Hz...). A siren (ONERA model, see Giuliani et al. [7]) is used to enhance
significant resonant modes. The amplification is required so that the technique can be tested at first on strongly fluctuating signals. The achieved levels of fluctuation are then comparable with those of combustion instability under realistic GT conditions. It will be shown later that the LV technique can also detect the natural resonance modes, without amplification. High-speed schlieren visualisation This technique as shown in figure 4 is commonly used for density fluctuation measurement, and vortex-driven combustion instabilities are often analysed by means of high-speed schlieren (Mc Manus et al. [8]). A colour Kodak Motion Corder SR-Series 1000 (Eastman Kodak Company, San Diego, California) was used, at sampling rate 1kHz with 0.5ms exposure time, small enough to freeze the flame patterns. The optical path for the schlieren technique was formed by two folding mirrors (plane, λ/1 surface, 80 mm diameter) and two spherical mirrors (focal length 1524 mm, λ/1 surface, 150 mm diameter) in a symmetric optical arrangement, with a parallel beam in the test section. The recordings were done using a circular entrance aperture illuminated by a halogen bulb, a circular schlieren stop and the Kodak Motion Corder. A few samples of these visualisations are displayed in Figure 5. The forced pulsations at 25 and 175Hz (columns b and c) show a similar pattern at a different order of time and scale. The flame is attached forming a tube at the tip of the injector. After that, a circumferential instability appears around this tube, with the development of a Kelvin-Helmholtz structure, at the boundary of which the flame front evolves. This structure is advected with the flow in the mean time as the flame roll-up closes, and so on. The global flame dynamics (reported in [14] based on PIV measurements) are drawn in Figure 3. The turbulent free-jet flame will show several preferred modes according to time. We chose to display a sequence where a 175Hz-like structure develops (Figure 5 column a). These images show the hydrodynamic nature of the instability [7]. Acoustic waves generated by the resonator and travelling at sound speed excite the

4
jet envelope and trigger the construction of ring vortices at the injector outlet periphery. After that these structures detach from the front plate and follow the flow, travelling through the mixing layer at a very low Mach number (a fraction of the inlet velocity injection Uref, usually about the half of it, see Panda et al. [9]). a - natural b – 25 Hz c – 175 Hz
Figure 5: High-speed schlieren visualisations (1000 fps) in free-jet configuration. a: natural resonance. b: amplification 25Hz. c: amplification 175Hz. All consecutive pictures are chosen and arranged so that one complete pulsation cycle is visible for the modes 25Hz and 175Hz. Inverted greyscale.
Figure 6: Principle of laser vibrometry
Dual-laser vibrometry (DLV) technique In order to refine the analysis of these transported ring vortices, a dual-laser vibrometry arrangement was used (see Giuliani et al. [4, 14] for technical details). LV principles Laser vibrometry (LV) was originally developed for surface vibration analysis [10]. The principle of LV is shown in Figure 6. A laser interference pattern between a reference beam and an object beam (reflecting on the studied surface) is analysed. If the surface moves (on this sketch, if the mirror is mobile), the path difference between the two beams changes and so the interference. In order to detect vibration amplitudes greater than the laser wavelength, and to distinguish a forward from a backward motion, a Bragg cell is used to slightly shift the reference beam wavelength (similar trick as the one used for LDA). Steady state is then represented by a fixed frequency corresponding to the modulated interference. Any surface motion will provoke a Doppler effect (compressive or expansive) on this carrier wave. A frequency demodulation allows to get back to both vibration frequency and motion amplitude of the object surface. Mayrhofer and Woisetschläger [11] used a variant of this technique for density fluctuation analysis of ambient air, keeping the geometrical path constant (Figure 6: the object surface is a mirror at rest) so that mainly density fluctuation alter the optical path, advancing (negative density gradient) or retreating (positive gradient) the phase front of light. As a result, LV can detect the presence of passing-by vortical structures, essentially driven by local pressure fluctuations. Giuliani et al. [4] extended then this use with two instruments (Dual LV - DLV) to the analysis of density fluctuation resulting from combined pressure and temperature fluctuations through a turbulent flame. LV has the advantage of a better sensitivity in comparison with classical line-of-sight laser transmission measurement, plus the fact that the object beam light passes twice through the measurement volume. The devices used, two models Polytech OVD
5
353 (Polytec, Waldbronn, Germany), are compact systems, user-friendly and fast to set-up. Building the vortex flowmaps This method performs a time correlation between two LV simultaneous signals related to the same travelling structure, at two different measurement points. Dual LV technique has one moving device scanning through a measurement grid, and a fixed one providing a reference signal (see Figure 2, top, for the measurement grid and reference position).
a) Peak detection and phase shift measurement
b) PDF of coherence
between the two LV signals
c) Filter 1: previous * local gain
d) Filter 2: Abel transform
(previous)
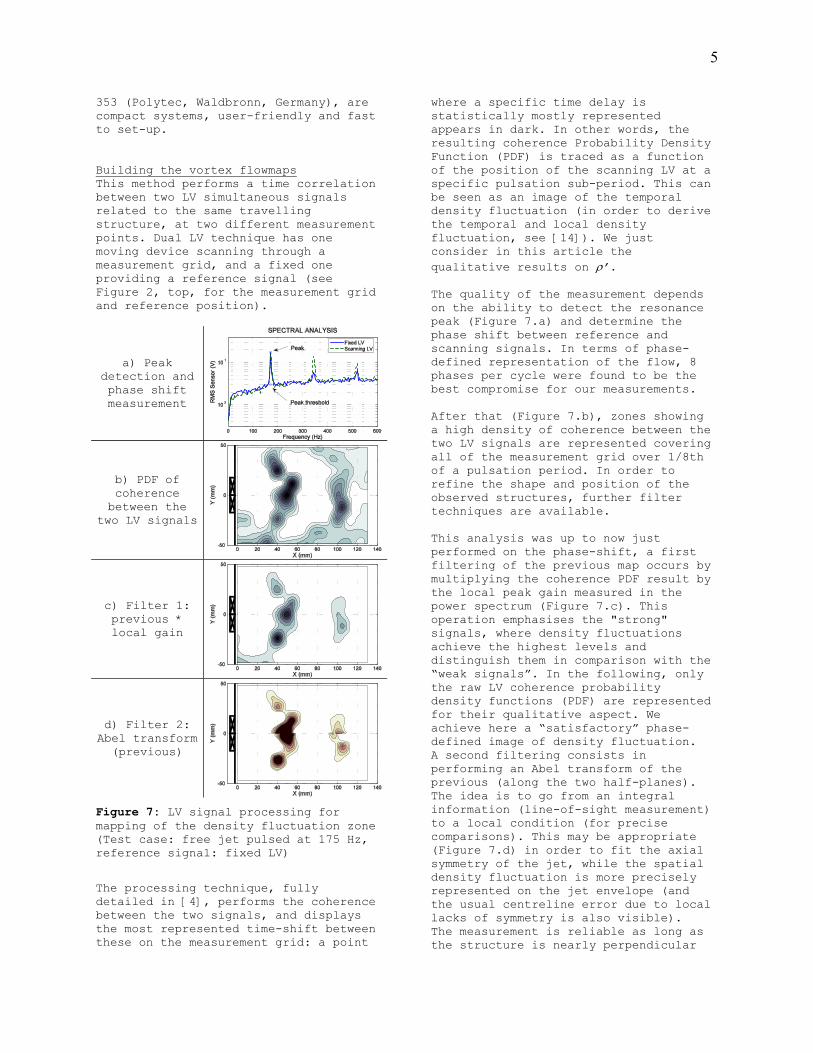
Figure 7: LV signal processing for mapping of the density fluctuation zone (Test case: free jet pulsed at 175 Hz, reference signal: fixed LV)
The processing technique, fully detailed in [4], performs the coherence between the two signals, and displays the most represented time-shift between these on the measurement grid: a point
where a specific time delay is statistically mostly represented appears in dark. In other words, the resulting coherence Probability Density Function (PDF) is traced as a function of the position of the scanning LV at a specific pulsation sub-period. This can be seen as an image of the temporal density fluctuation (in order to derive the temporal and local density fluctuation, see [14]). We just consider in this article the qualitative results on ρ’. The quality of the measurement depends on the ability to detect the resonance peak (Figure 7.a) and determine the phase shift between reference and scanning signals. In terms of phase-defined representation of the flow, 8 phases per cycle were found to be the best compromise for our measurements. After that (Figure 7.b), zones showing a high density of coherence between the two LV signals are represented covering all of the measurement grid over 1/8th of a pulsation period. In order to refine the shape and position of the observed structures, further filter techniques are available. This analysis was up to now just performed on the phase-shift, a first filtering of the previous map occurs by multiplying the coherence PDF result by the local peak gain measured in the power spectrum (Figure 7.c). This operation emphasises the "strong" signals, where density fluctuations achieve the highest levels and distinguish them in comparison with the “weak signals”. In the following, only the raw LV coherence probability density functions (PDF) are represented for their qualitative aspect. We achieve here a “satisfactory” phase-defined image of density fluctuation. A second filtering consists in performing an Abel transform of the previous (along the two half-planes). The idea is to go from an integral information (line-of-sight measurement) to a local condition (for precise comparisons). This may be appropriate (Figure 7.d) in order to fit the axial symmetry of the jet, while the spatial density fluctuation is more precisely represented on the jet envelope (and the usual centreline error due to local lacks of symmetry is also visible). The measurement is reliable as long as the structure is nearly perpendicular
6
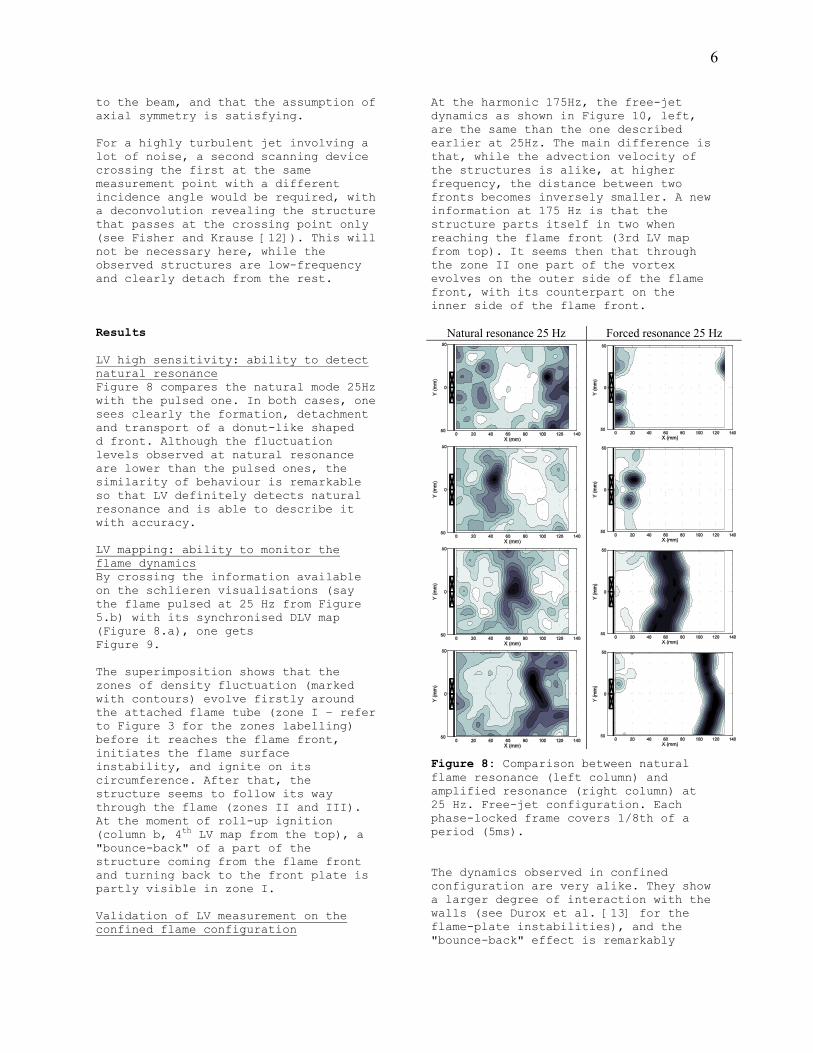
to the beam, and that the assumption of axial symmetry is satisfying. For a highly turbulent jet involving a lot of noise, a second scanning device crossing the first at the same measurement point with a different incidence angle would be required, with a deconvolution revealing the structure that passes at the crossing point only (see Fisher and Krause [12]). This will not be necessary here, while the observed structures are low-frequency and clearly detach from the rest. Results LV high sensitivity: ability to detect natural resonance Figure 8 compares the natural mode 25Hz with the pulsed one. In both cases, one sees clearly the formation, detachment and transport of a donut-like shaped d front. Although the fluctuation levels observed at natural resonance are lower than the pulsed ones, the similarity of behaviour is remarkable so that LV definitely detects natural resonance and is able to describe it with accuracy. LV mapping: ability to monitor the flame dynamics By crossing the information available on the schlieren visualisations (say the flame pulsed at 25 Hz from Figure 5.b) with its synchronised DLV map (Figure 8.a), one gets Figure 9. The superimposition shows that the zones of density fluctuation (marked with contours) evolve firstly around the attached flame tube (zone I – refer to Figure 3 for the zones labelling) before it reaches the flame front, initiates the flame surface instability, and ignite on its circumference. After that, the structure seems to follow its way through the flame (zones II and III). At the moment of roll-up ignition (column b, 4th LV map from the top), a "bounce-back" of a part of the structure coming from the flame front and turning back to the front plate is partly visible in zone I. Validation of LV measurement on the confined flame configuration
At the harmonic 175Hz, the free-jet dynamics as shown in Figure 10, left, are the same than the one described earlier at 25Hz. The main difference is that, while the advection velocity of the structures is alike, at higher frequency, the distance between two fronts becomes inversely smaller. A new information at 175 Hz is that the structure parts itself in two when reaching the flame front (3rd LV map from top). It seems then that through the zone II one part of the vortex evolves on the outer side of the flame front, with its counterpart on the inner side of the flame front.
Natural resonance 25 Hz Forced resonance 25 Hz
Figure 8: Comparison between natural flame resonance (left column) and amplified resonance (right column) at 25 Hz. Free-jet configuration. Each phase-locked frame covers 1/8th of a period (5ms). The dynamics observed in confined configuration are very alike. They show a larger degree of interaction with the walls (see Durox et al. [13] for the flame-plate instabilities), and the "bounce-back" effect is remarkably

7
evolving around the corner recirculation. The question if, by a. 25 Hz - Forced b. 175 Hz - Forced
Figure 9: Superposed flame dynamics with corresponding density fluctuation
contours. Left: pulsation 25Hz. Right: 175Hz
a. Free jet b. Confined jet
Figure 10: Comparison between free-jet (left column) and confined flame dynamics (right column), at 175Hz resonance mode (amplified). Each phase-locked frame covers 1/8th of a period (~0.7ms) means of adequate time-delays related to the mode and to the wall geometry, such a "bounce-back" can close the loop by bringing energy to the next structure forming at the burner outlet and thus sustain a preferred instability mode remains open. It must be noted that the confined geometry hardly disturbed the DLV measurements. We stress here out the possibility to use the DLV method in presence of multiple windows. Conclusions Laser vibrometry has proven itself as a valuable method for time-resolved measurements of density fluctuations in
8
a resonant premixed flame. The refined information due to its high sensitivity extends the information previously obtained with schlieren visualisations. Provided an optical access is possible (also with multiple windows), DLV can detect organised ρ’ structures directly in the flame, without need of seeding the flow. A single LV device can deliver a highly reliable signal reference for any commanded measurement technique for time-averaged combustion diagnostic. DLV measurements provide an alternate method for non-intrusive observation of coherent structures in turbulent flows (isothermal as well as reactive), characterisation of their size and evolution in time and space. Among the results of the study, we established a similarity of behaviour between the natural structures and the excited ones with help of the siren, and a similarity of behaviour between enclosed and free jet flame dynamics. We observed the complex exchange between the triggered ρ’ structure around the flame envelope, with possible pairing effect and partial “bounce-back” of these structures. The DLV technique would provide valuable information in a GT test-facility. Performing a similar dynamical analysis of structures on an industrial configuration would contribute to the know-why on a specific instability problem. The next research programme at TU Graz will focus on the quantification of the density fluctuations with help of DLV, towards the determination of local energy exchanges. Acknowledgments The present work was supported by the European Commission as part of the Integrated Project ”New Aeroengine Core Concepts” (NEWAC, AIP5-CT-2006-030876), which is gratefully acknowledged. Thanks to Pierre Gajan and Alain Strzelecki from ONERA Centre de Toulouse (French Aerospace Lab), France, for lending us the siren. Common ONERA - TU Graz research activities are supported by the ÖAD
(Austrian Academic Exchange Bureau, programme ”Amadée 2006-2007” – project Nr. 4/2006) which is gratefully acknowledged. References [1] J. Rayleigh, The Theory of Sound, Vol. 2, Dover, N.Y.C., 1945.
[2] A. Putnam, W. Dennis, Trans. ASME 75 (15).
[3] K. H. Yu, A. Trouve, J. W. Daily, Journal of Fluid Mechanics 232 (1991) 47–72.
[4] F. Giuliani, B. Wagner, J. Woisetschläger, F. Heitmeir, in: ASME Turbo Expo 2006: Power for Land, Sea and Air, Barcelona, Spain, 2006, GT2006-90413.
[5] J. Beér, N. Chigier, Combustion Aerodynamics, Applied Science publishers Ltd, 1972, pp. 100–146.
[6] V. Yang, in: Active control of Engine Dynamics, RTO AVT - VKI Special Course, Brussels, Belgium, 2001.
[7] F. Giuliani, P. Gajan, O. Diers, M. Ledoux, in: Proceedings of the Combustion Institute, Vol. 29, The Combustion Institute, pp. 91–98, 2002.
[8] K. McManus, T. Poinsot, S. Candel, Prog. Energy Combust. Sci. 19 (1993) 1–29.
[9] J. Panda, K. McLaughlin, in: 28th Aerospace Sciences Meeting, 1990, AIAA 1990-0506.
[10] A. Levin, in: T. EP (Ed.), Third international conference on vibration measurements by laser techniques, Vol. SPIE Proc Series 3411, 1999, pp. 61–67.
[11] N. Mayrhofer, J. Woisetschläger, Experiments in fluids 31 (2001) 153–161.
[12] M. Fisher, F. Krause, J. Fluid Mech. 28 (4) (1967) 705–717.
[13] D. Durox, T. Schuller, S. Candel, in: Proceedings of the Combustion Institute, Vol. 29, pp. 69–76, The Combustion Institute, 2002.
[14] F. Giuliani, A. Lang, T. Leitgeb, J. Woisetschläger, F. Heitmeir. Using Dual Laser Vibrometry to monitor the stability of gas turbine combustion. Proceedings of the third European Combustion Meeting (ECM). The Combustion Institute, Chania, Greece, Apr. 11-13 2007.

9