time out london - audience personas
TRANSCRIPT
1
Time Out LondonAudience Personas
2
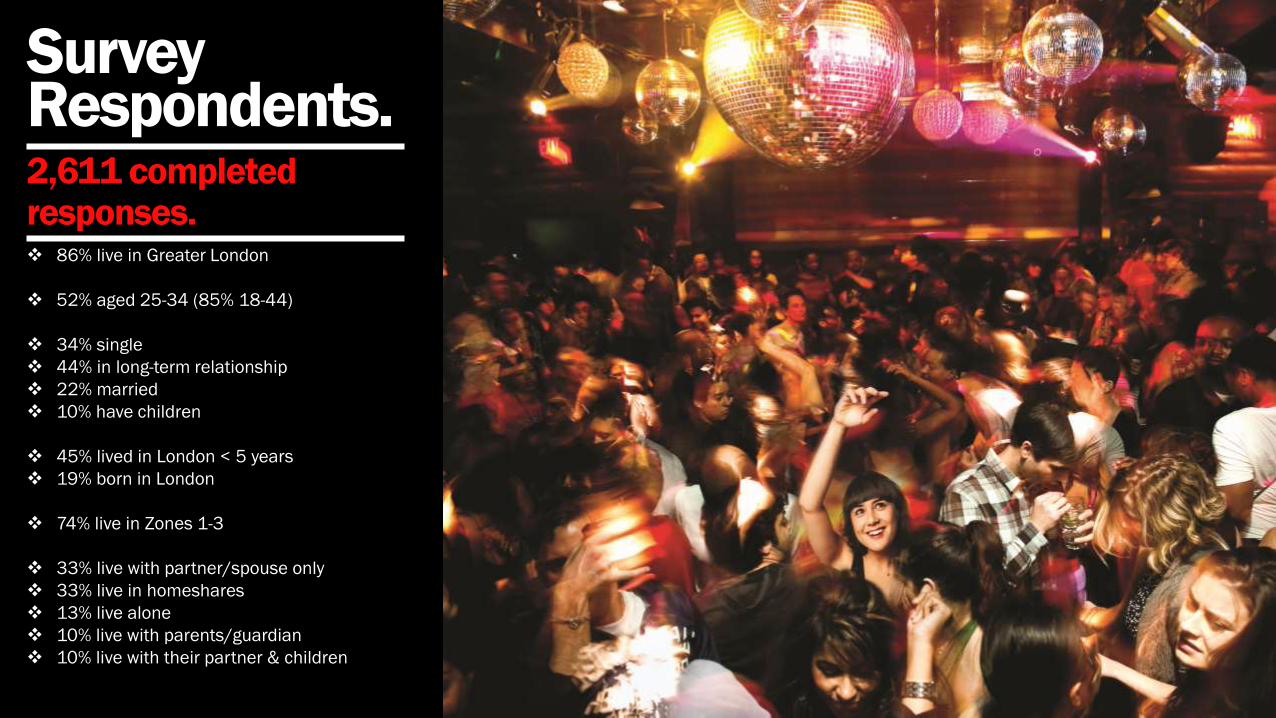
Survey Respondents.2,611 completed responses. 86% live in Greater London
52% aged 25-34 (85% 18-44)
34% single
44% in long-term relationship
22% married
10% have children
45% lived in London < 5 years
19% born in London
74% live in Zones 1-3
33% live with partner/spouse only
33% live in homeshares
13% live alone
10% live with parents/guardian
10% live with their partner & children
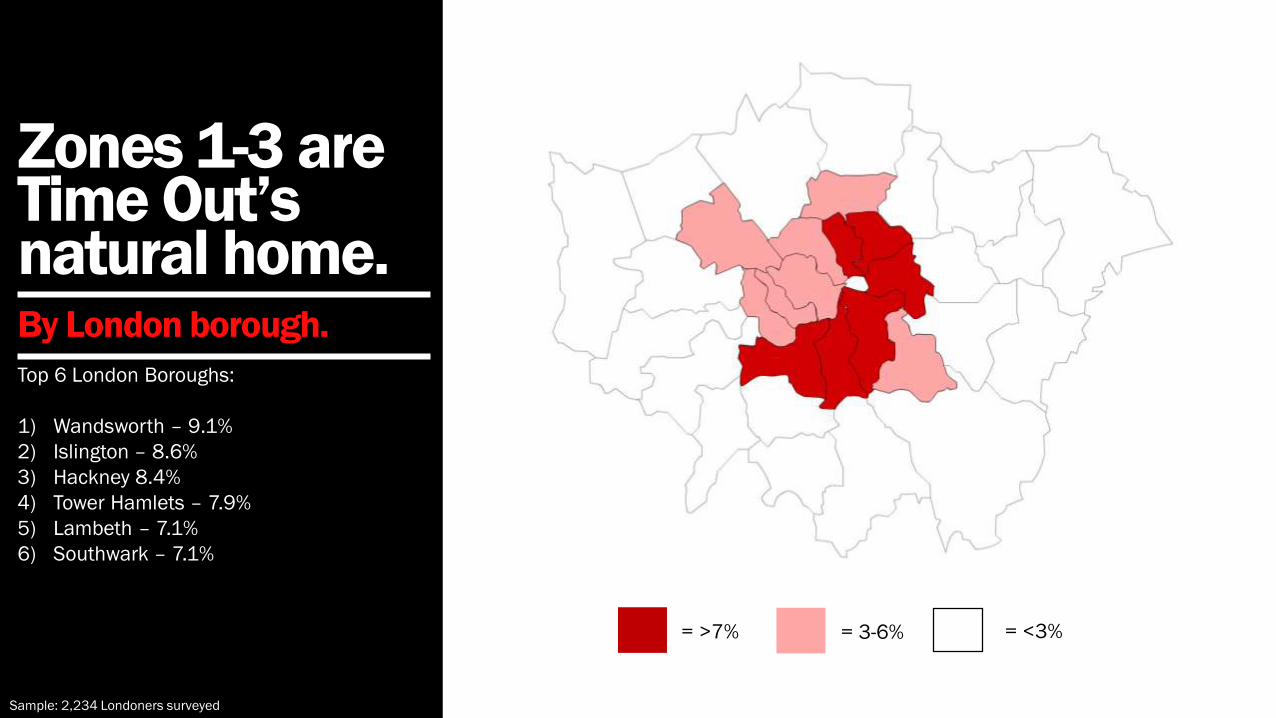
Zones 1-3 are Time Out’s natural home.By London borough.
Top 6 London Boroughs:
1) Wandsworth – 9.1%
2) Islington – 8.6%
3) Hackney 8.4%
4) Tower Hamlets – 7.9%
5) Lambeth – 7.1%
6) Southwark – 7.1%
= >7% = 3-6% = <3%
Sample: 2,234 Londoners surveyed
4
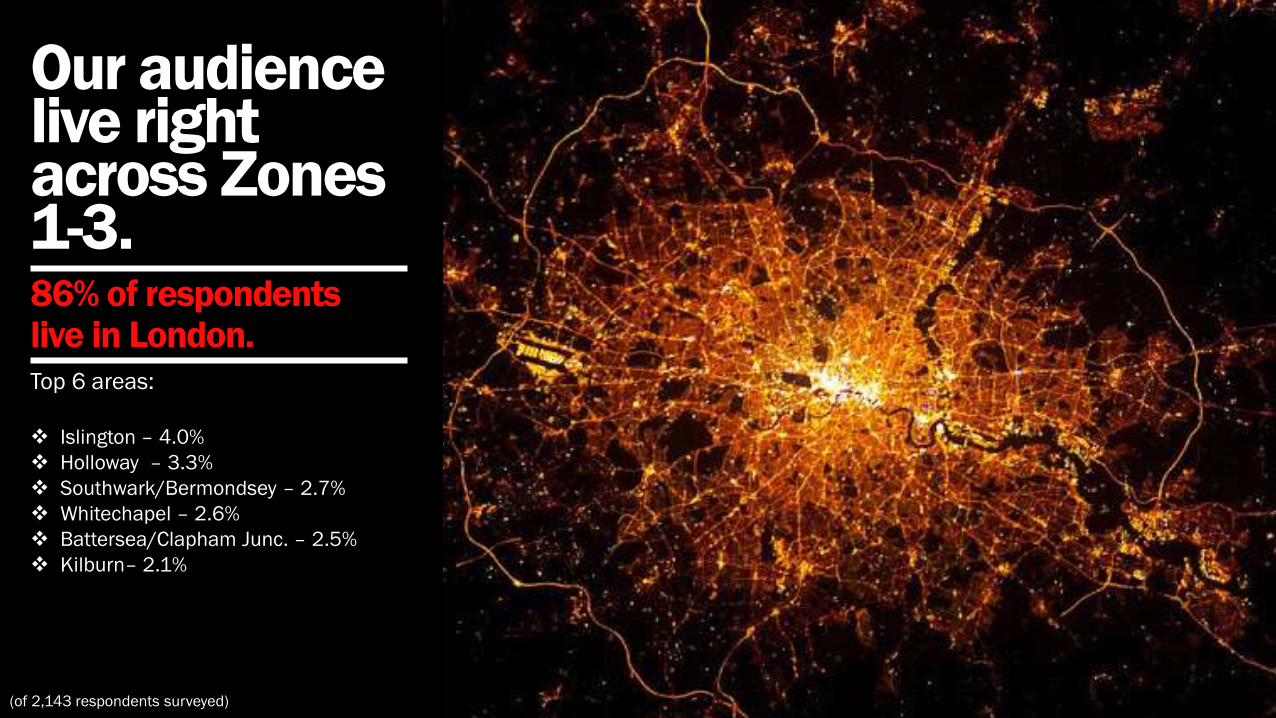
Our audience live right across Zones 1-3.86% of respondents live in London.Top 6 areas:
Islington – 4.0%
Holloway – 3.3%
Southwark/Bermondsey – 2.7%
Whitechapel – 2.6%
Battersea/Clapham Junc. – 2.5%
Kilburn– 2.1%
(of 2,143 respondents surveyed)
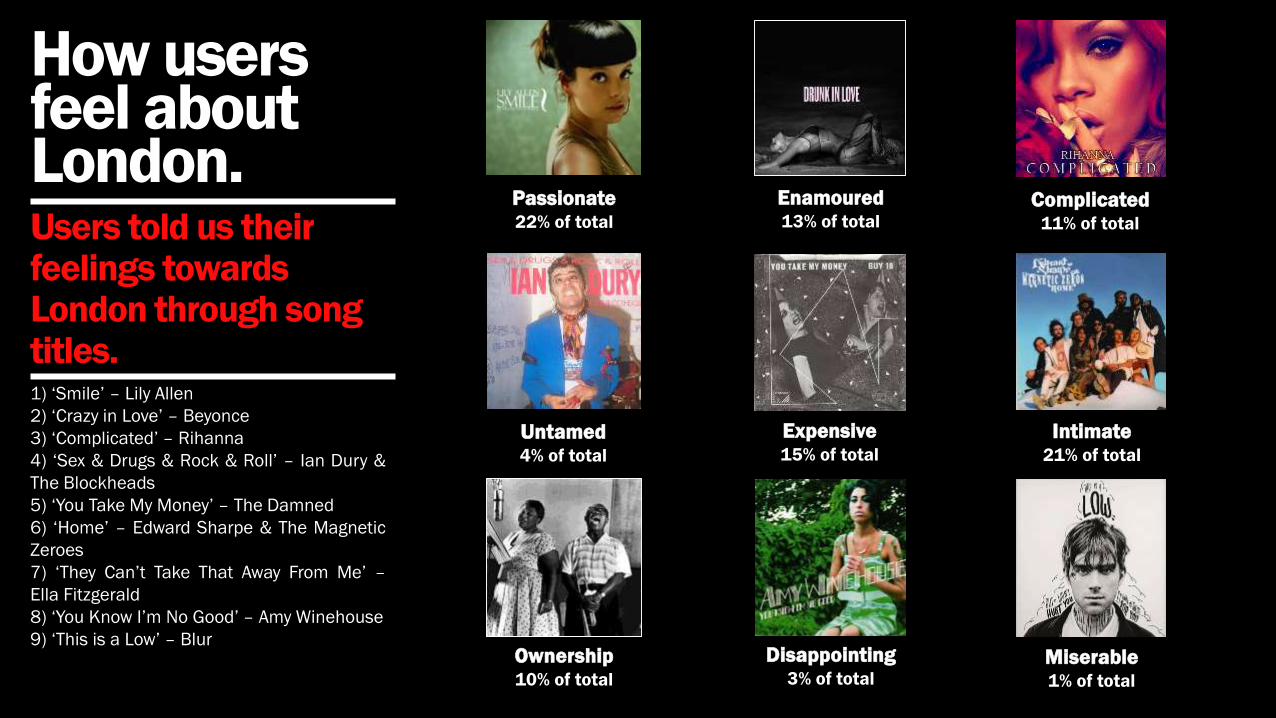
How users feel about London.Users told us their feelings towards London through song titles.1) ‘Smile’ – Lily Allen
2) ‘Crazy in Love’ – Beyonce
3) ‘Complicated’ – Rihanna
4) ‘Sex & Drugs & Rock & Roll’ – Ian Dury &
The Blockheads
5) ‘You Take My Money’ – The Damned
6) ‘Home’ – Edward Sharpe & The Magnetic
Zeroes
7) ‘They Can’t Take That Away From Me’ –
Ella Fitzgerald
8) ‘You Know I’m No Good’ – Amy Winehouse
9) ‘This is a Low’ – Blur
Passionate22% of total
Enamoured13% of total
Complicated11% of total
Untamed4% of total
Expensive15% of total
Intimate21% of total
Ownership10% of total
Disappointing3% of total
Miserable1% of total
6
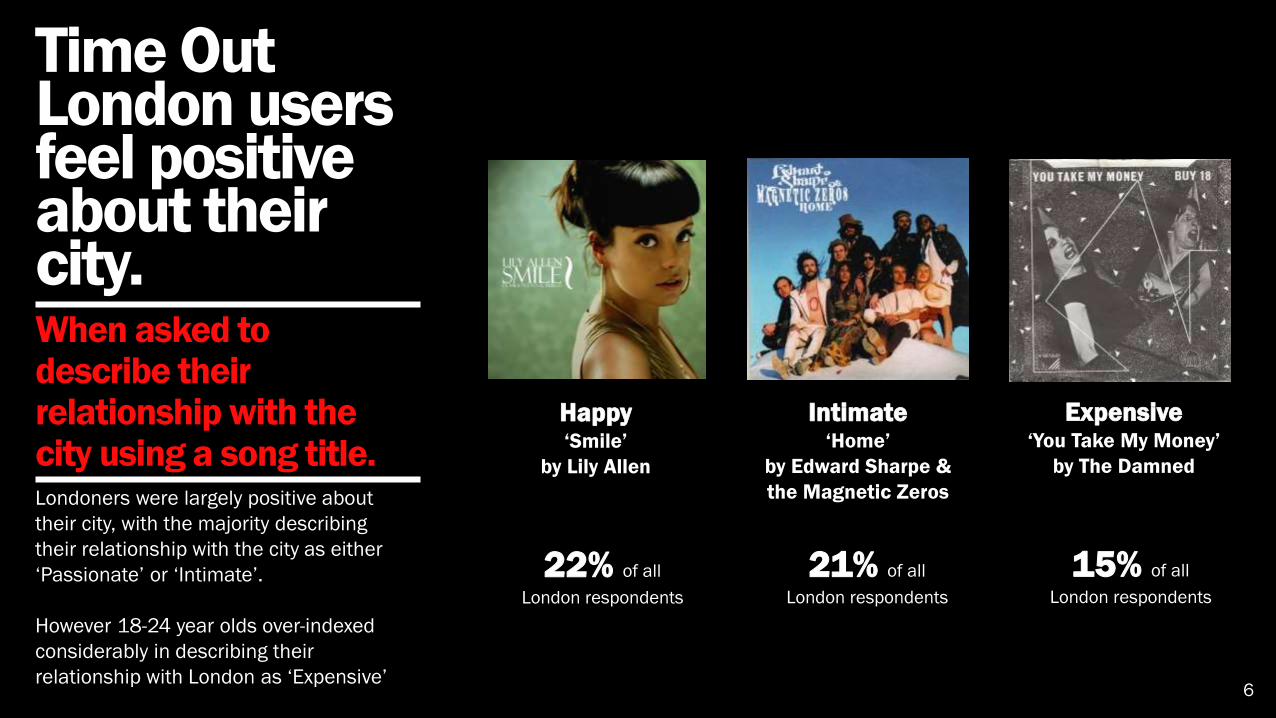
Happy‘Smile’
by Lily Allen
Intimate‘Home’
by Edward Sharpe &
the Magnetic Zeros
Expensive‘You Take My Money’
by The Damned
22% of all
London respondents
21% of all
London respondents
15% of all
London respondents
Time Out London users feel positive about their city.When asked to describe their relationship with the city using a song title.Londoners were largely positive about
their city, with the majority describing
their relationship with the city as either
‘Passionate’ or ‘Intimate’.
However 18-24 year olds over-indexed
considerably in describing their
relationship with London as ‘Expensive’
7
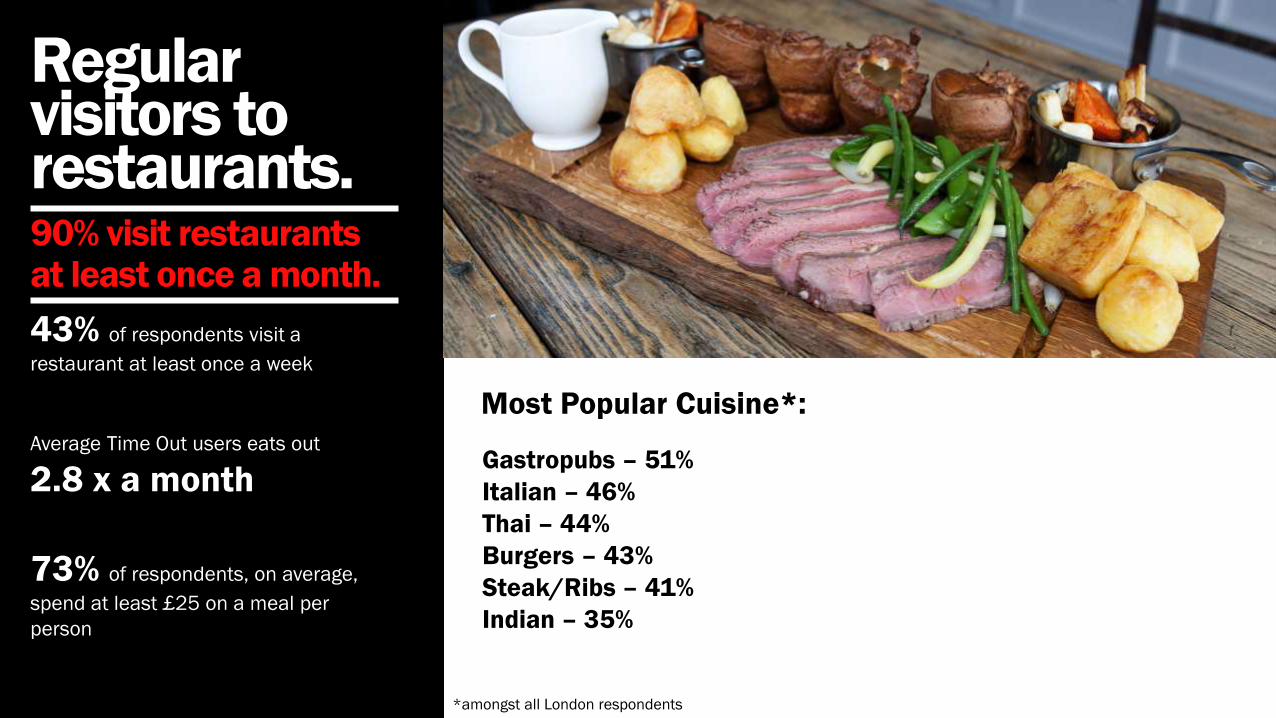
Regular visitors to restaurants.90% visit restaurants at least once a month.
43% of respondents visit a
restaurant at least once a week
Average Time Out users eats out
2.8 x a month
73% of respondents, on average,
spend at least £25 on a meal per
person
Most Popular Cuisine*:
Gastropubs – 51%
Italian – 46%
Thai – 44%
Burgers – 43%
Steak/Ribs – 41%
Indian – 35%
*amongst all London respondents
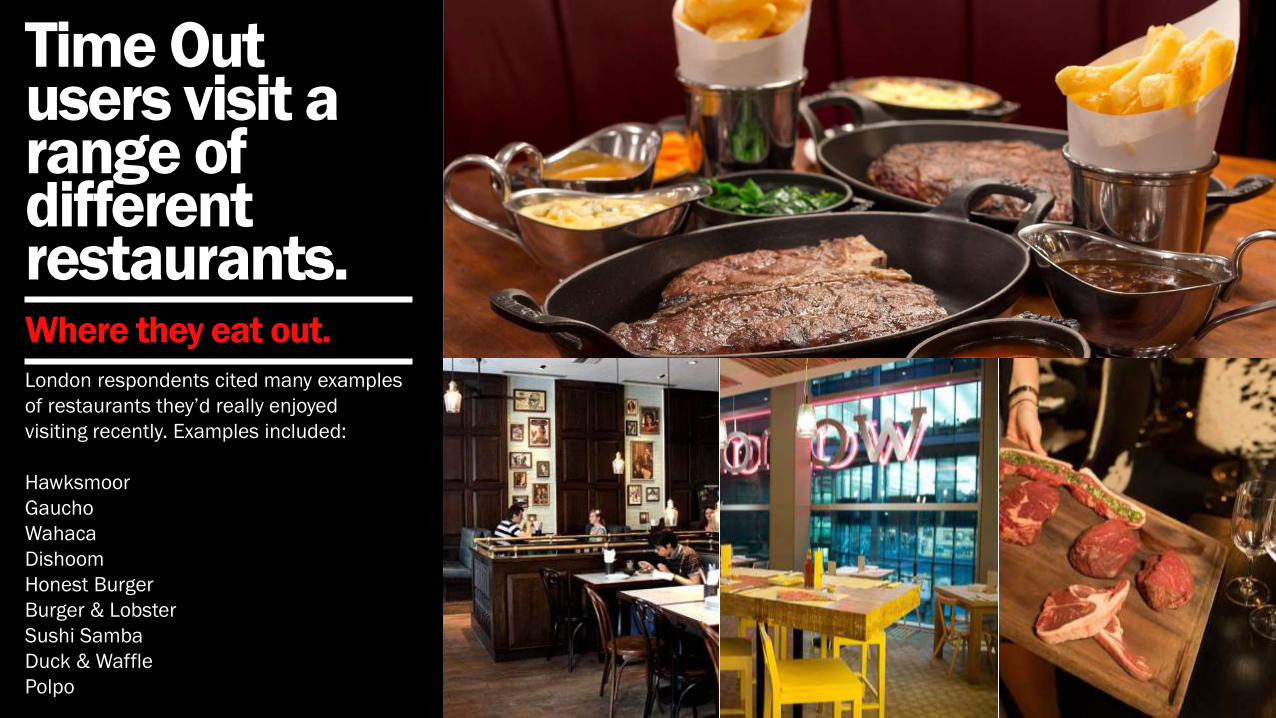
Time Out users visit a range of different restaurants.Where they eat out.
London respondents cited many examples
of restaurants they’d really enjoyed
visiting recently. Examples included:
Hawksmoor
Gaucho
Wahaca
Dishoom
Honest Burger
Burger & Lobster
Sushi Samba
Duck & Waffle
Polpo
9
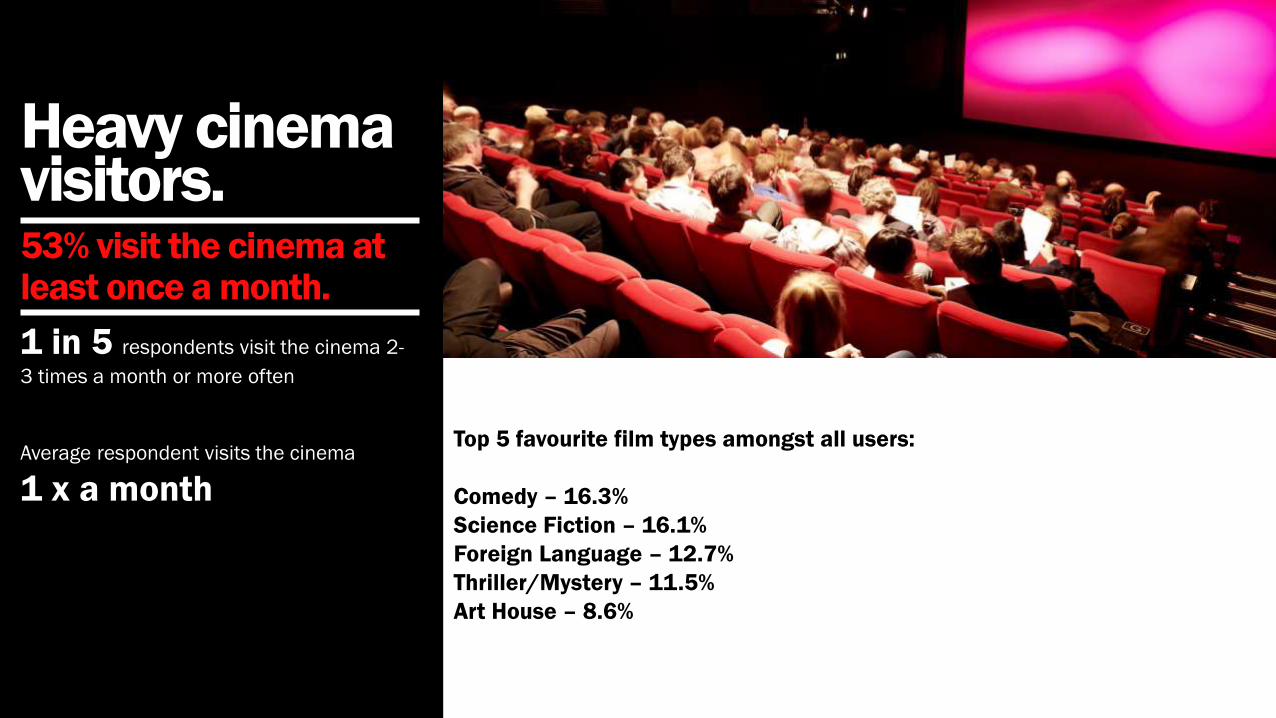
Heavy cinema visitors.53% visit the cinema at least once a month.
1 in 5 respondents visit the cinema 2-
3 times a month or more often
Average respondent visits the cinema
1 x a month
Top 5 favourite film types amongst all users:
Comedy – 16.3%
Science Fiction – 16.1%
Foreign Language – 12.7%
Thriller/Mystery – 11.5%
Art House – 8.6%
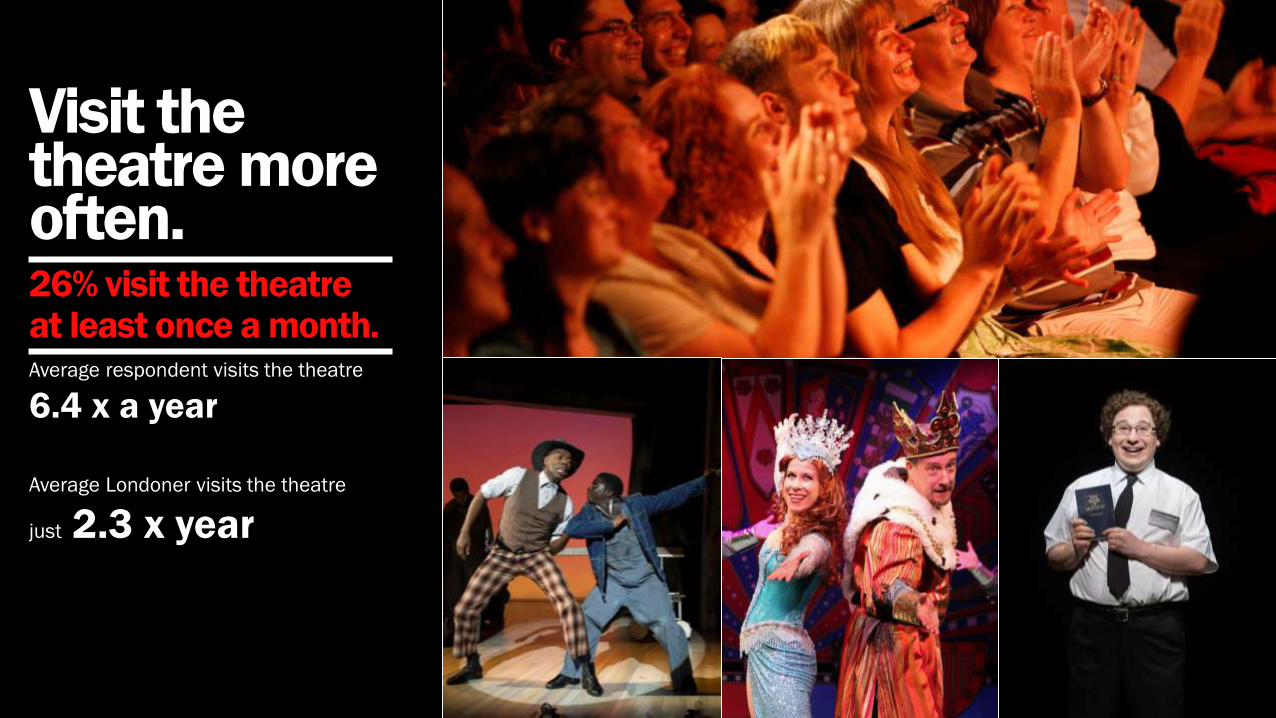
Visit the theatre more often.26% visit the theatre at least once a month.Average respondent visits the theatre
6.4 x a year
Average Londoner visits the theatre
just 2.3 x year
11
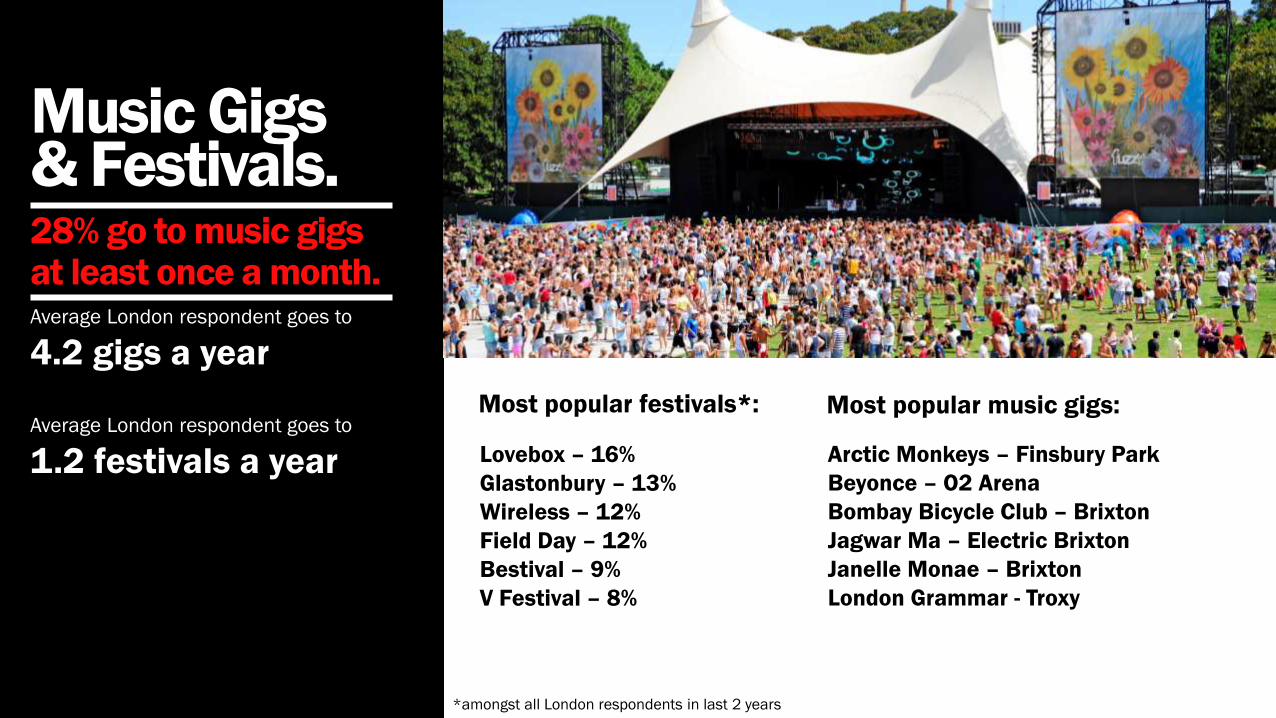
Music Gigs & Festivals.28% go to music gigs at least once a month.Average London respondent goes to
4.2 gigs a year
Average London respondent goes to
1.2 festivals a year
Most popular festivals*:
*amongst all London respondents in last 2 years
Lovebox – 16%
Glastonbury – 13%
Wireless – 12%
Field Day – 12%
Bestival – 9%
V Festival – 8%
Most popular music gigs:
Arctic Monkeys – Finsbury Park
Beyonce – O2 Arena
Bombay Bicycle Club – Brixton
Jagwar Ma – Electric Brixton
Janelle Monae – Brixton
London Grammar - Troxy
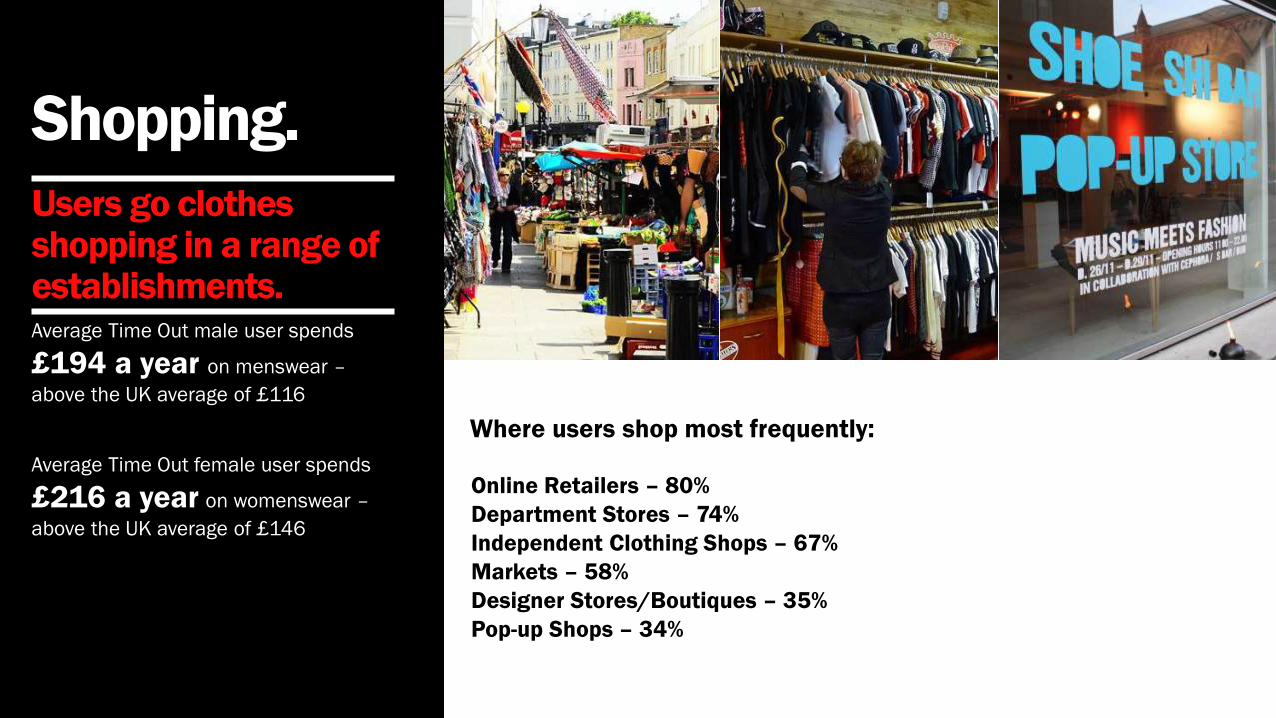
Shopping.
Users go clothes shopping in a range of establishments.Average Time Out male user spends
£194 a year on menswear –
above the UK average of £116
Average Time Out female user spends
£216 a year on womenswear –
above the UK average of £146
Where users shop most frequently:
Online Retailers – 80%
Department Stores – 74%
Independent Clothing Shops – 67%
Markets – 58%
Designer Stores/Boutiques – 35%
Pop-up Shops – 34%
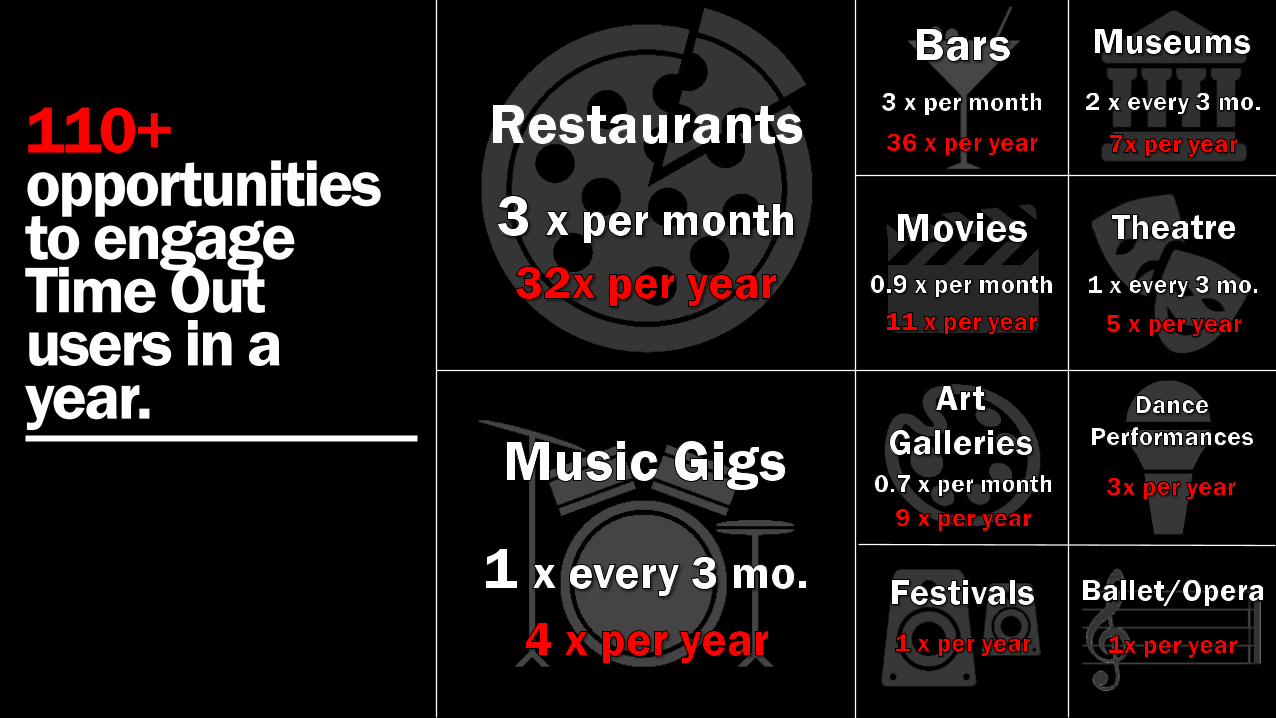
110+ opportunities to engage Time Out users in a year.
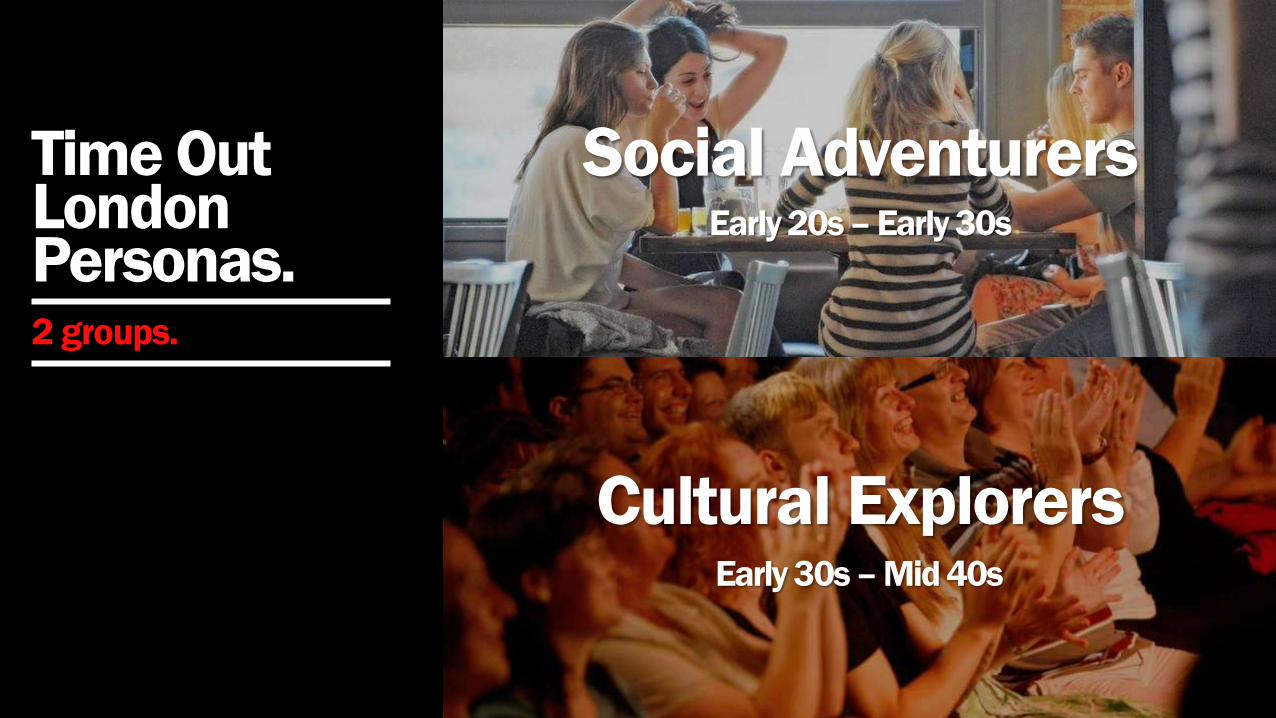
Time Out London Personas.2 groups.
Social AdventurersEarly 20s – Early 30s
Cultural ExplorersEarly 30s – Mid 40s
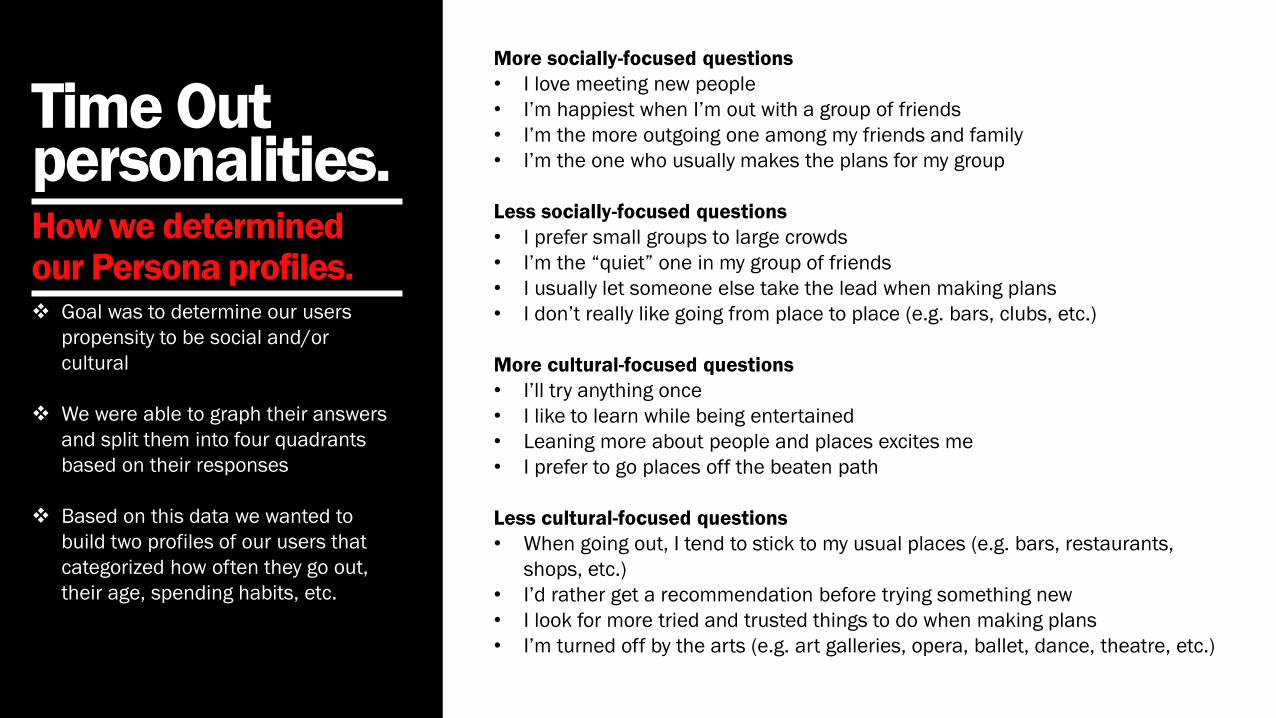
Time Out personalities.How we determined our Persona profiles. Goal was to determine our users
propensity to be social and/or
cultural
We were able to graph their answers
and split them into four quadrants
based on their responses
Based on this data we wanted to
build two profiles of our users that
categorized how often they go out,
their age, spending habits, etc.
More socially-focused questions
• I love meeting new people
• I’m happiest when I’m out with a group of friends
• I’m the more outgoing one among my friends and family
• I’m the one who usually makes the plans for my group
Less socially-focused questions
• I prefer small groups to large crowds
• I’m the “quiet” one in my group of friends
• I usually let someone else take the lead when making plans
• I don’t really like going from place to place (e.g. bars, clubs, etc.)
More cultural-focused questions
• I’ll try anything once
• I like to learn while being entertained
• Leaning more about people and places excites me
• I prefer to go places off the beaten path
Less cultural-focused questions
• When going out, I tend to stick to my usual places (e.g. bars, restaurants,
shops, etc.)
• I’d rather get a recommendation before trying something new
• I look for more tried and trusted things to do when making plans
• I’m turned off by the arts (e.g. art galleries, opera, ballet, dance, theatre, etc.)
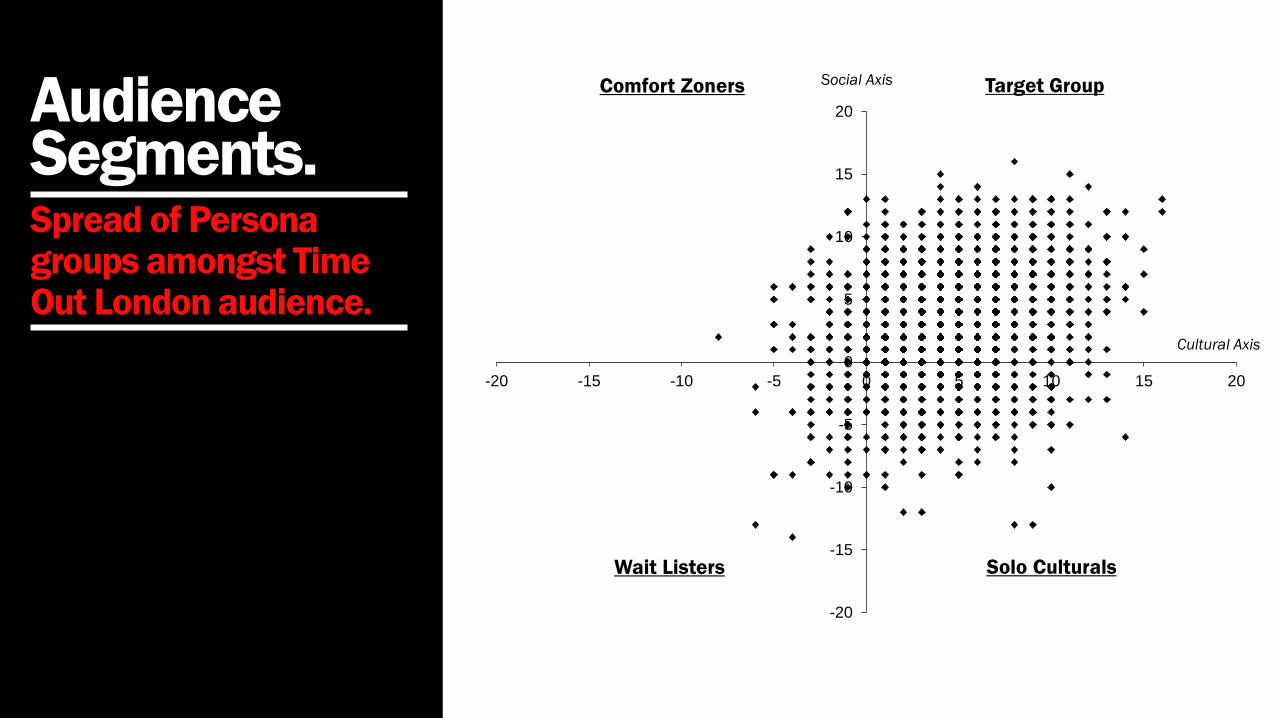
Audience Segments.Spread of Persona groups amongst Time Out London audience.
-20
-15
-10
-5
0
5
10
15
20
-20 -15 -10 -5 0 5 10 15 20
Comfort Zoners Target Group
Wait Listers Solo Culturals
Social Axis
Cultural Axis
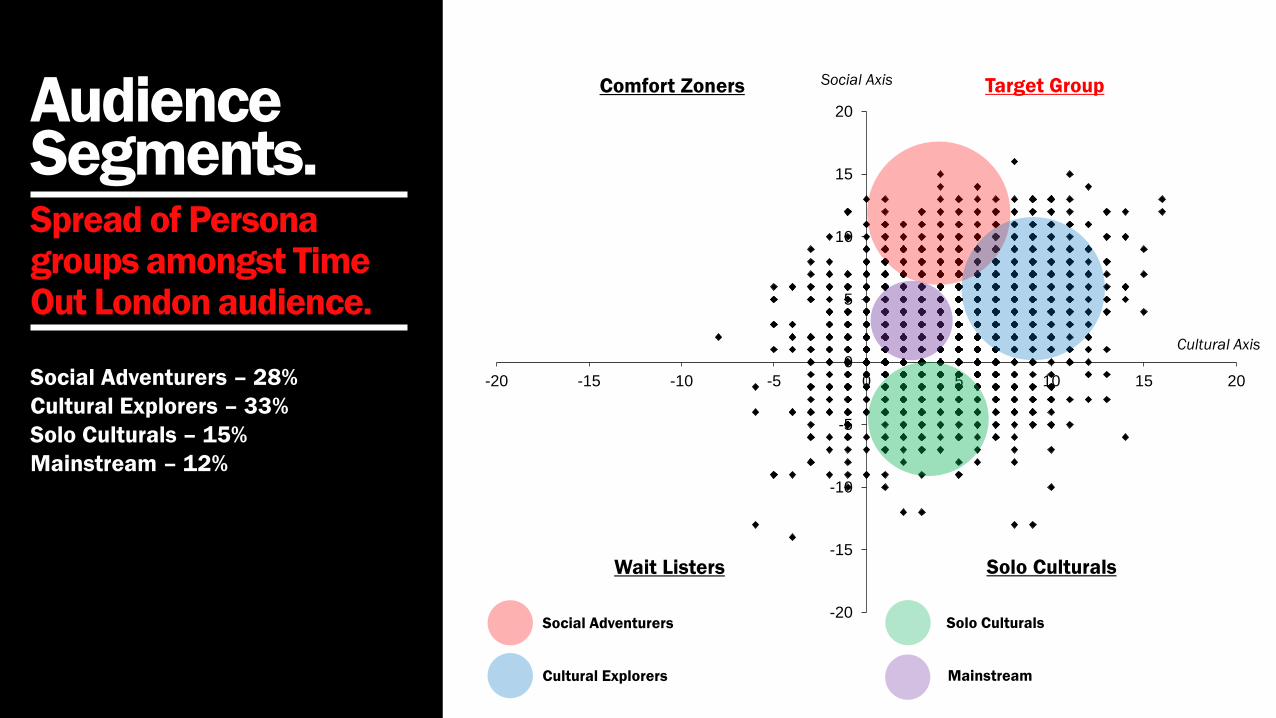
Audience Segments.Spread of Persona groups amongst Time Out London audience.
Social Adventurers – 28%
Cultural Explorers – 33%
Solo Culturals – 15%
Mainstream – 12%
-20
-15
-10
-5
0
5
10
15
20
-20 -15 -10 -5 0 5 10 15 20
Comfort Zoners Target Group
Wait Listers Solo Culturals
Social Adventurers
Cultural Explorers
Solo Culturals
Mainstream
Social Axis
Cultural Axis
18
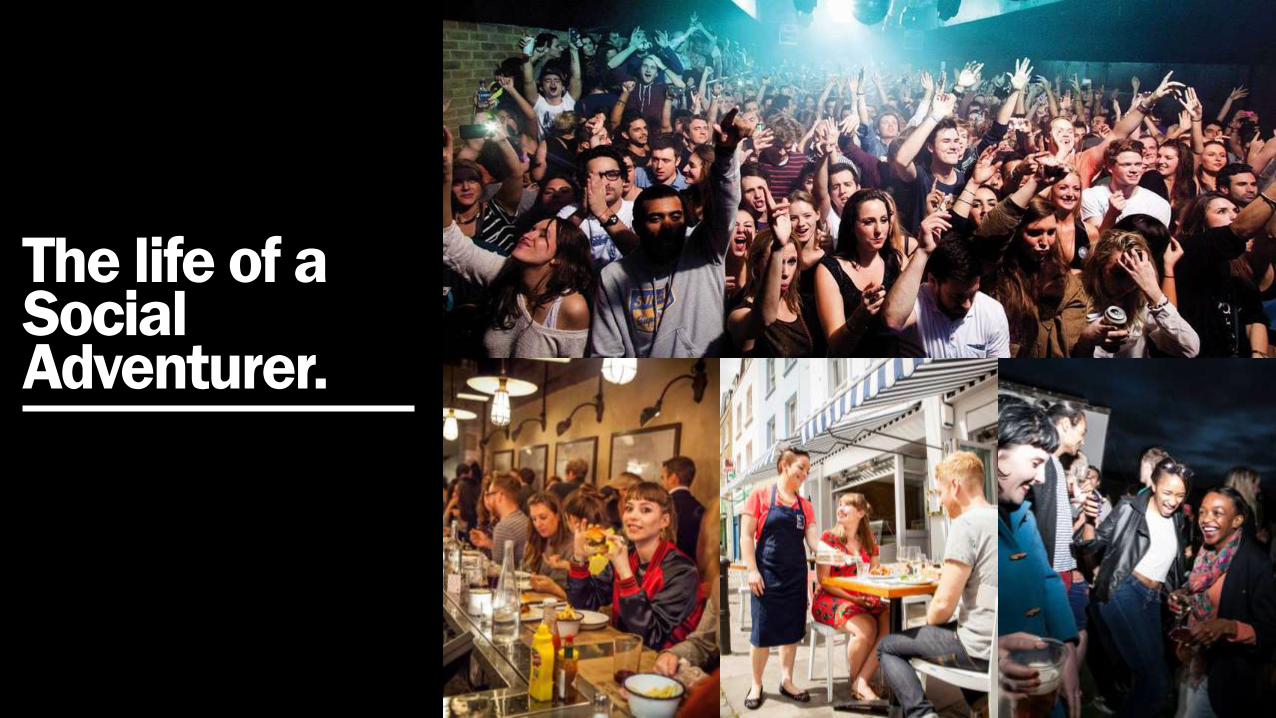
The life of a Social Adventurer.
19
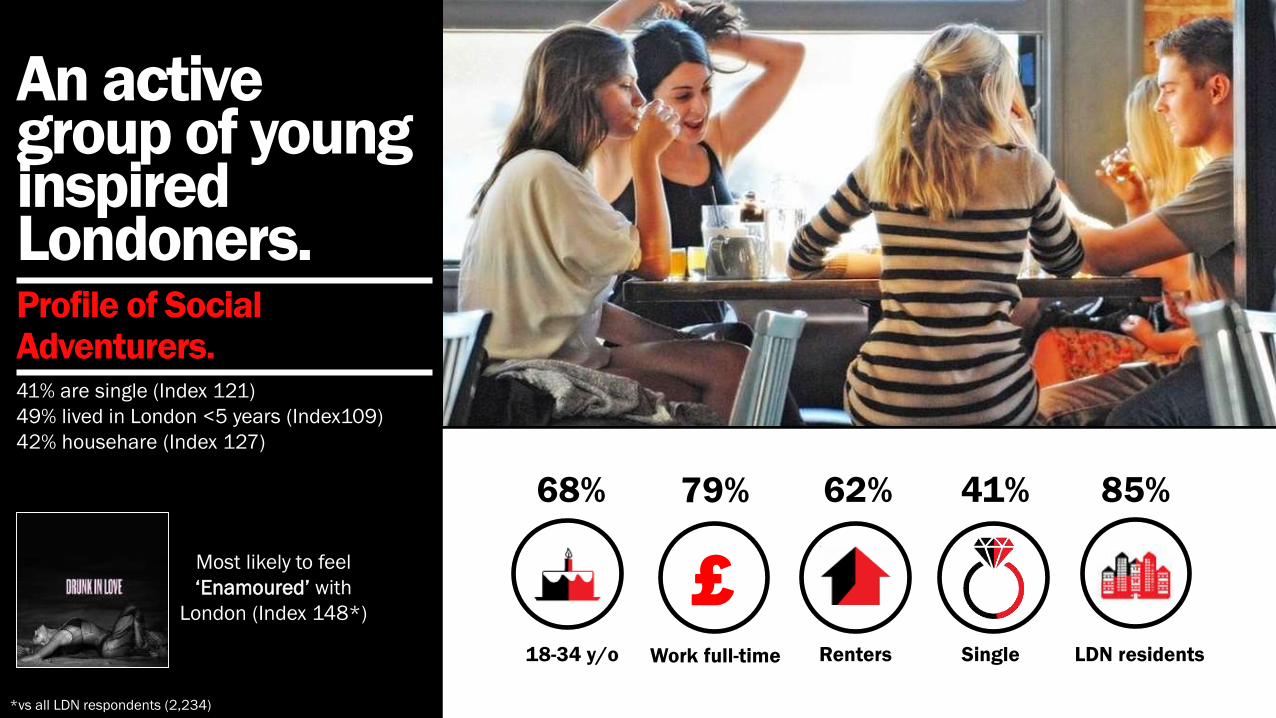
An active group of young inspired Londoners.Profile of Social Adventurers.41% are single (Index 121)
49% lived in London <5 years (Index109)
42% househare (Index 127)
18-34 y/o
68% 79%
Work full-time
62%
Renters
41%
Single
85%
LDN residents
£Most likely to feel
‘Enamoured’ with
London (Index 148*)
*vs all LDN respondents (2,234)
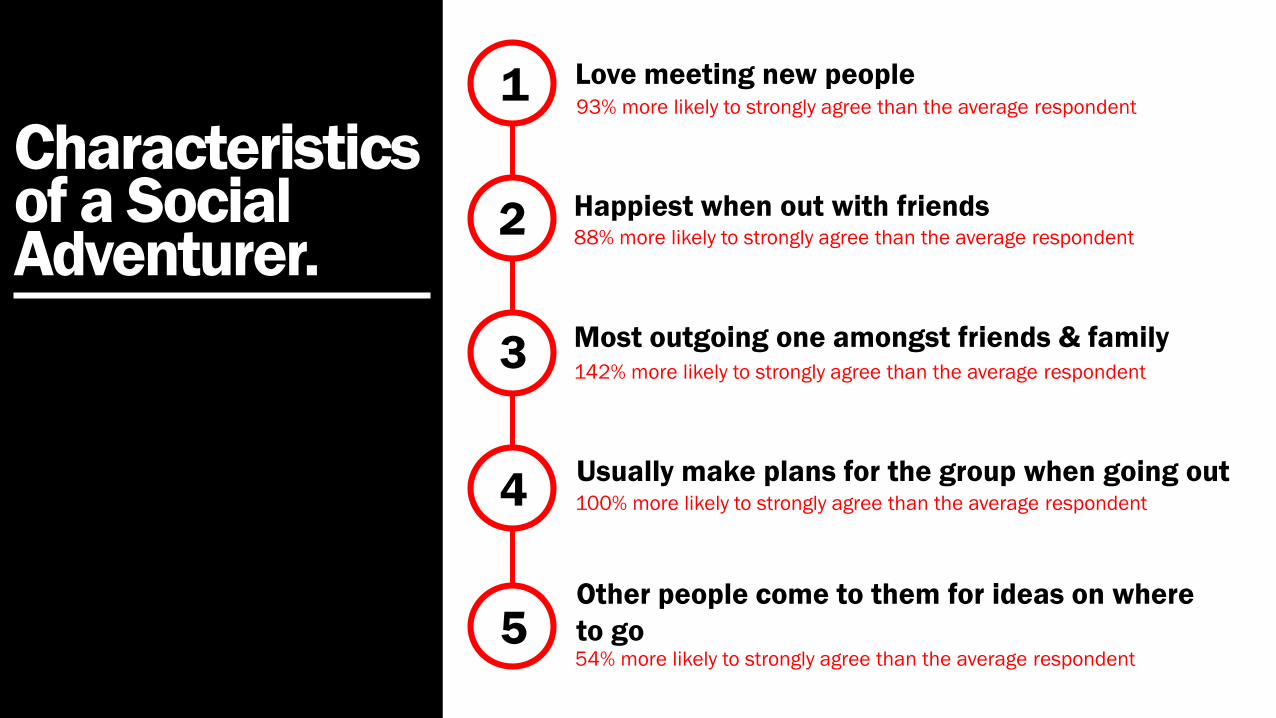
Characteristics of a Social Adventurer.
1 Love meeting new people93% more likely to strongly agree than the average respondent
Happiest when out with friends88% more likely to strongly agree than the average respondent
Most outgoing one amongst friends & family 142% more likely to strongly agree than the average respondent
Usually make plans for the group when going out100% more likely to strongly agree than the average respondent
Other people come to them for ideas on where
to go54% more likely to strongly agree than the average respondent
2
3
4
5
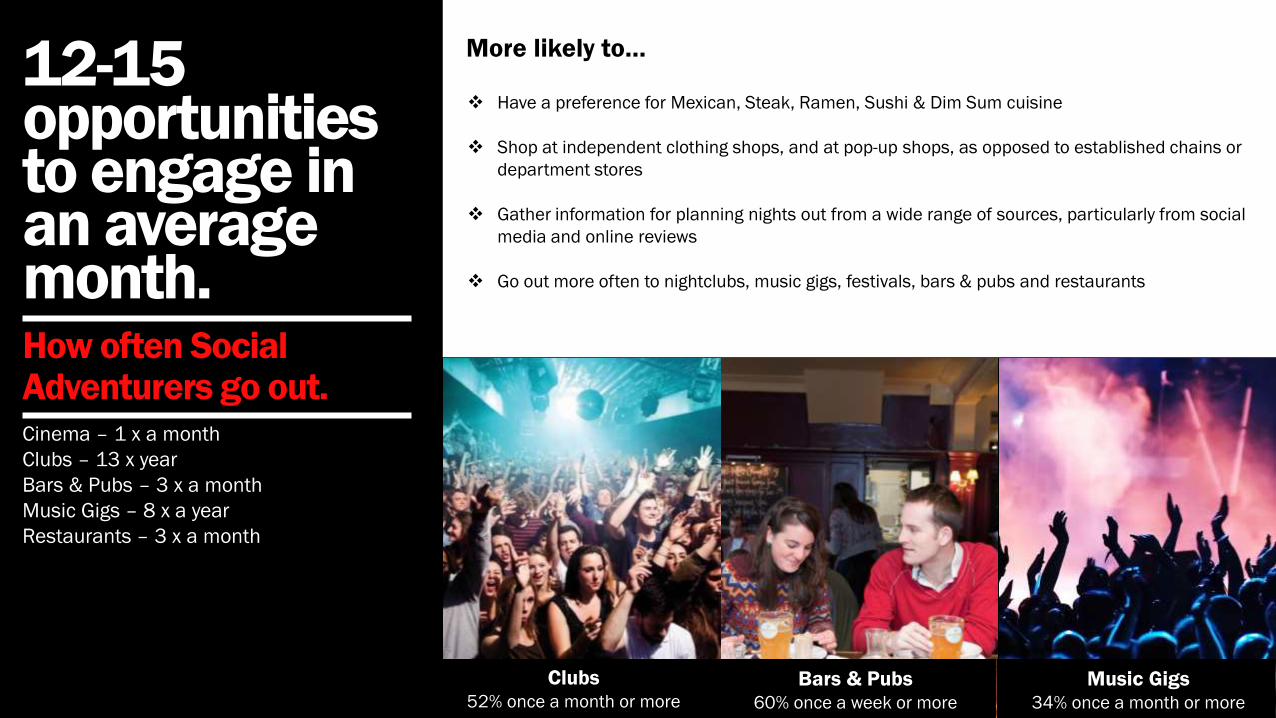
12-15 opportunities to engage in an average month.How often Social Adventurers go out.Cinema – 1 x a month
Clubs – 13 x year
Bars & Pubs – 3 x a month
Music Gigs – 8 x a year
Restaurants – 3 x a month
Have a preference for Mexican, Steak, Ramen, Sushi & Dim Sum cuisine
Shop at independent clothing shops, and at pop-up shops, as opposed to established chains or
department stores
Gather information for planning nights out from a wide range of sources, particularly from social
media and online reviews
Go out more often to nightclubs, music gigs, festivals, bars & pubs and restaurants
More likely to…
Clubs52% once a month or more
Bars & Pubs60% once a week or more
Music Gigs34% once a month or more

The life of a Cultural Explorer.
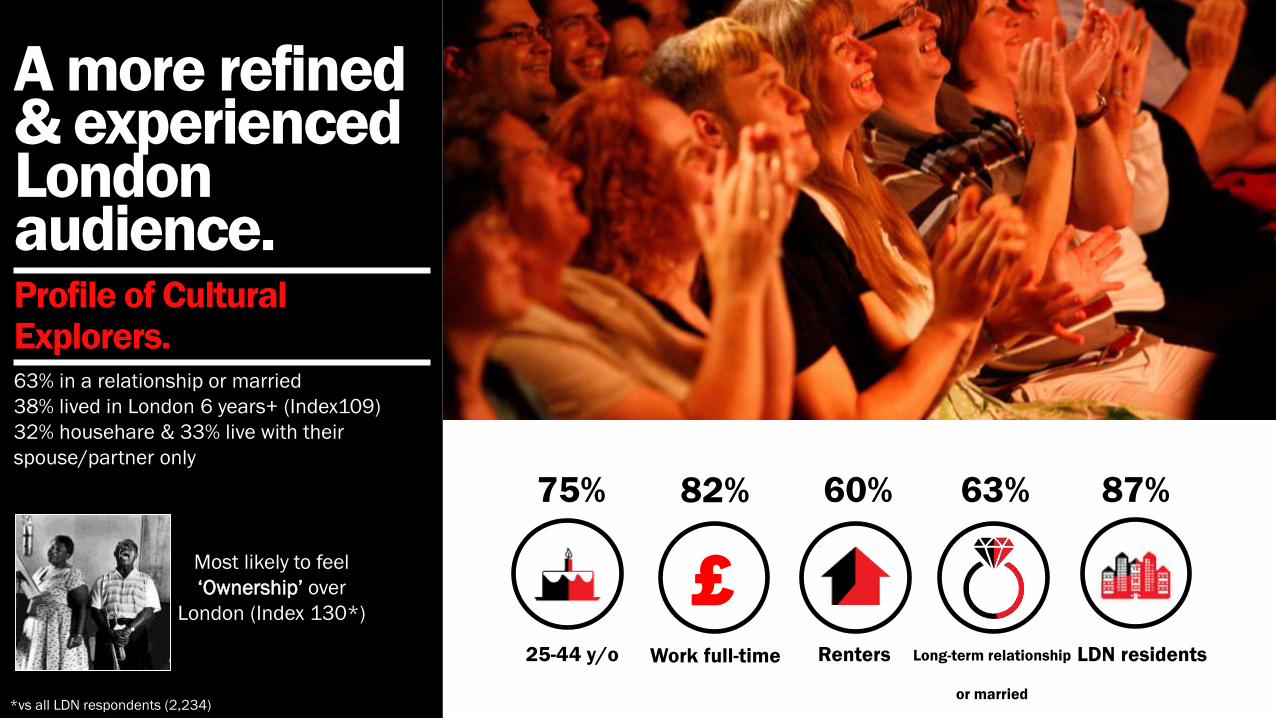
A more refined & experienced London audience.Profile of Cultural Explorers.63% in a relationship or married
38% lived in London 6 years+ (Index109)
32% househare & 33% live with their
spouse/partner only
25-44 y/o
75% 82%
Work full-time
60%
Renters
63%
Long-term relationship
or married
87%
LDN residents
£Most likely to feel
‘Ownership’ over
London (Index 130*)
*vs all LDN respondents (2,234)
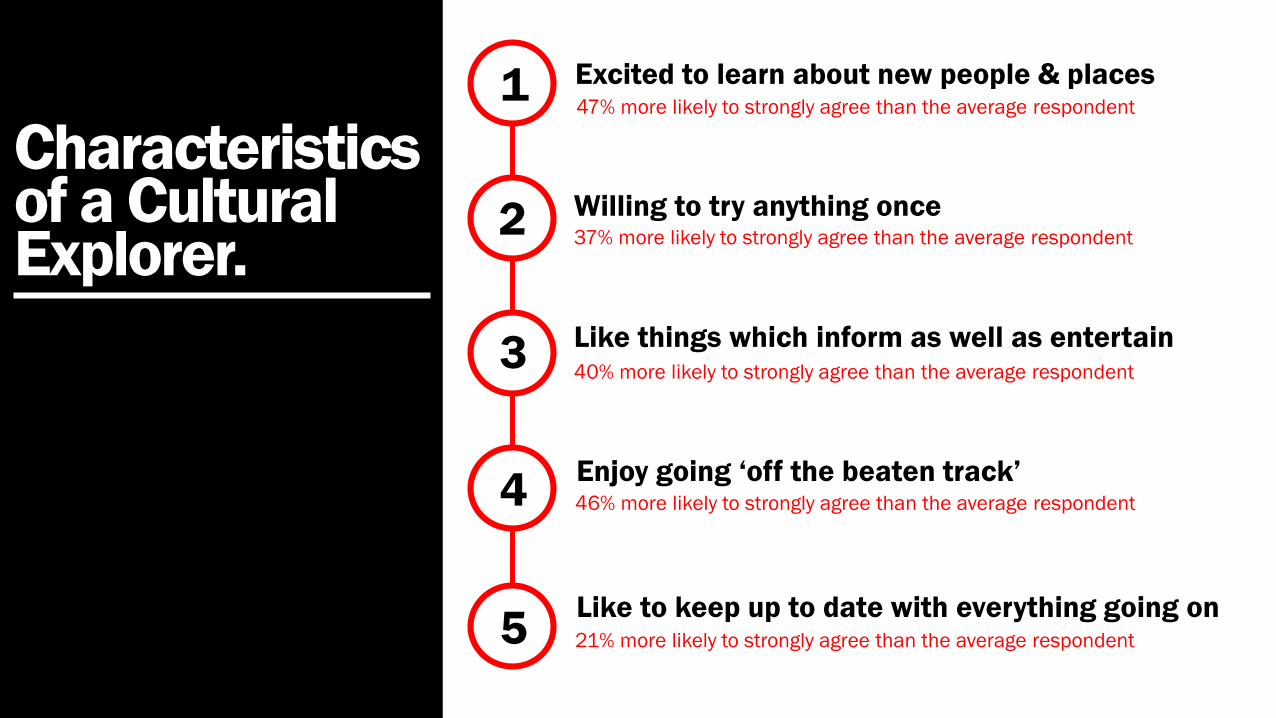
Characteristics of a Cultural Explorer.
1 Excited to learn about new people & places47% more likely to strongly agree than the average respondent
37% more likely to strongly agree than the average respondent
Like things which inform as well as entertain40% more likely to strongly agree than the average respondent
Enjoy going ‘off the beaten track’46% more likely to strongly agree than the average respondent
Like to keep up to date with everything going on21% more likely to strongly agree than the average respondent
2
3
4
5
Willing to try anything once
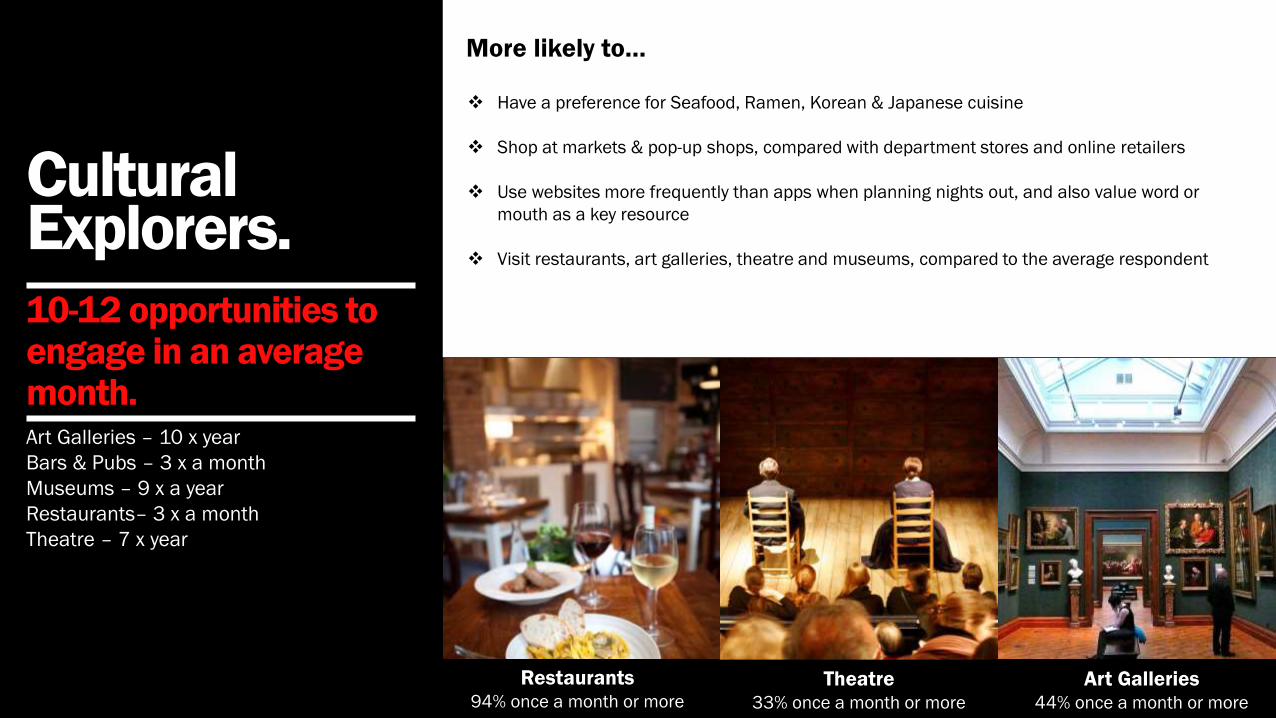
Cultural Explorers.10-12 opportunities to engage in an average month.Art Galleries – 10 x year
Bars & Pubs – 3 x a month
Museums – 9 x a year
Restaurants– 3 x a month
Theatre – 7 x year
Restaurants94% once a month or more
Theatre33% once a month or more
Art Galleries44% once a month or more
Have a preference for Seafood, Ramen, Korean & Japanese cuisine
Shop at markets & pop-up shops, compared with department stores and online retailers
Use websites more frequently than apps when planning nights out, and also value word or
mouth as a key resource
Visit restaurants, art galleries, theatre and museums, compared to the average respondent
More likely to…
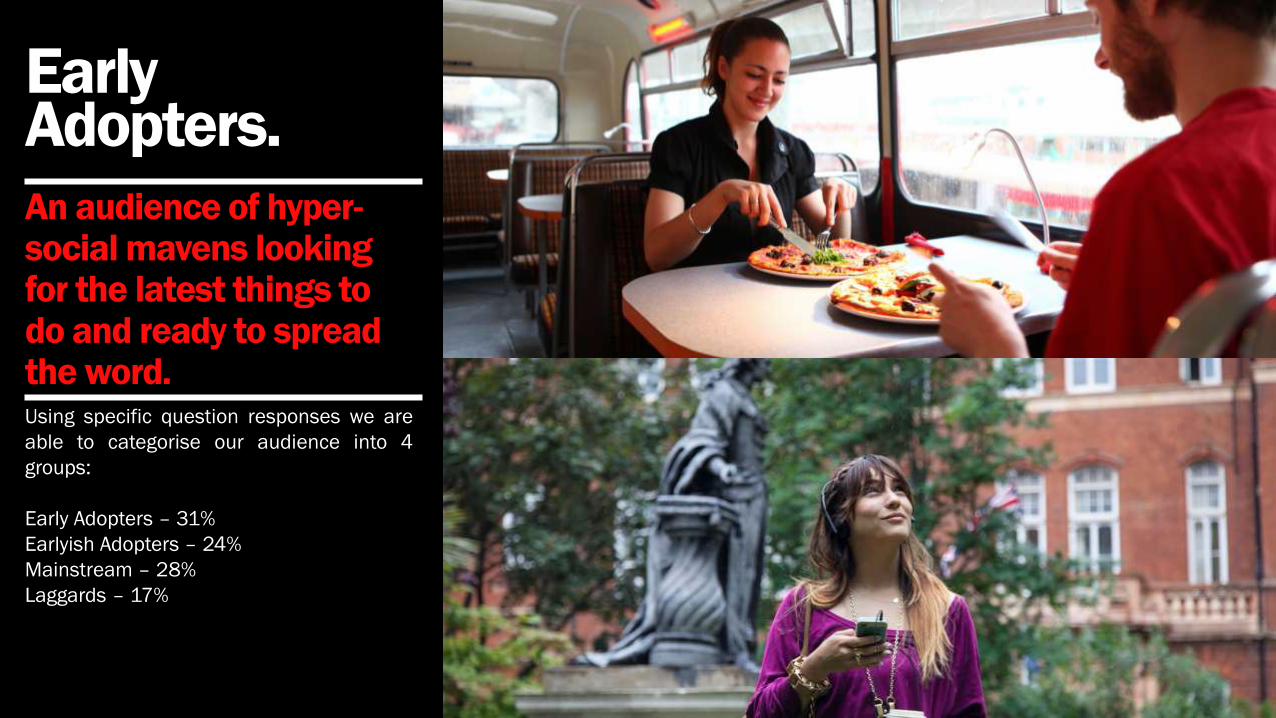
Early Adopters.An audience of hyper-social mavens looking for the latest things to do and ready to spread the word.Using specific question responses we are
able to categorise our audience into 4
groups:
Early Adopters – 31%
Earlyish Adopters – 24%
Mainstream – 28%
Laggards – 17%
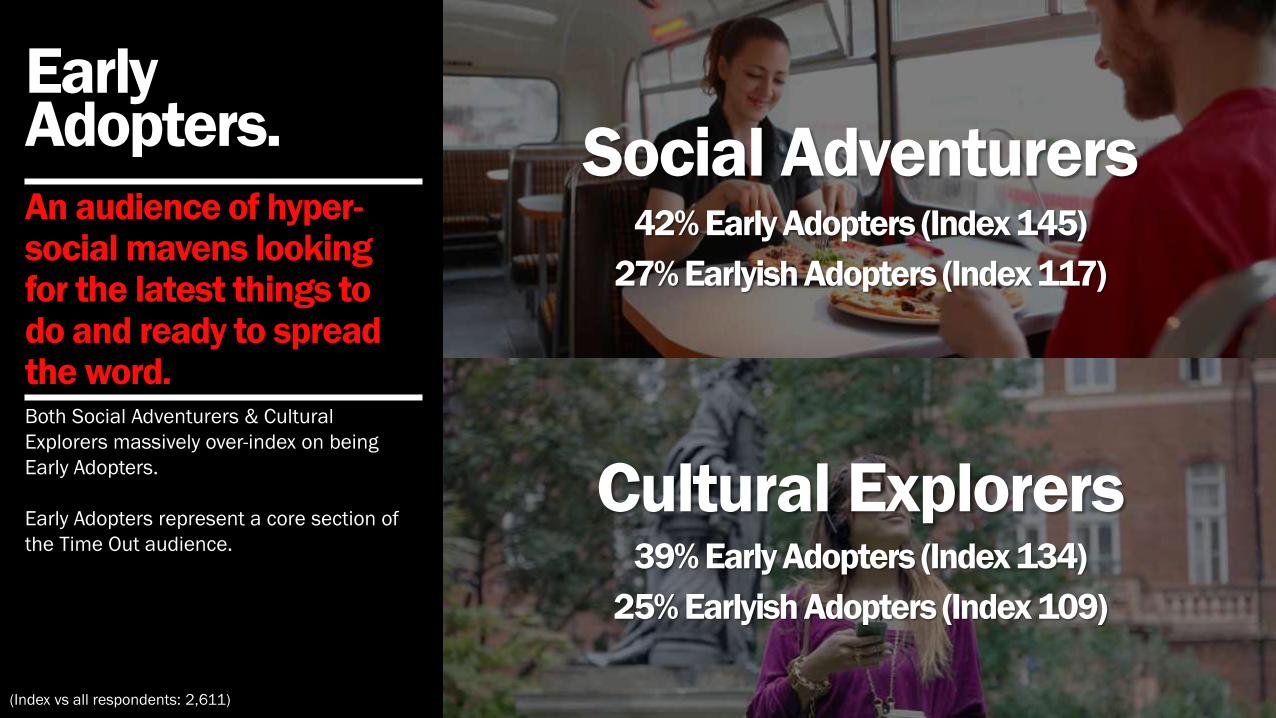
Early Adopters.An audience of hyper-social mavens looking for the latest things to do and ready to spread the word.Both Social Adventurers & Cultural
Explorers massively over-index on being
Early Adopters.
Early Adopters represent a core section of
the Time Out audience.
Social Adventurers42% Early Adopters (Index 145)
27% Earlyish Adopters (Index 117)
Cultural Explorers39% Early Adopters (Index 134)
25% Earlyish Adopters (Index 109)
(Index vs all respondents: 2,611)

28
Time Out Londoncompetitors
29
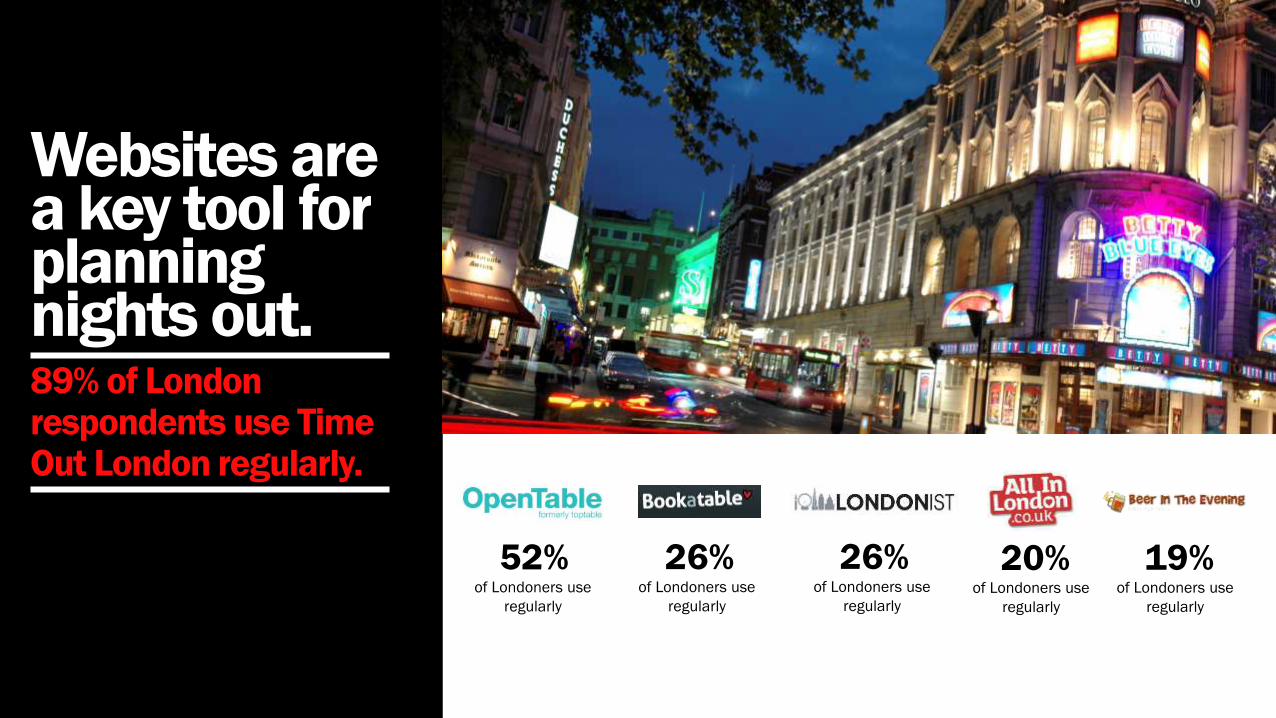
Websites are a key tool for planning nights out.89% of London respondents use Time Out London regularly.
52% 26% 26% 20% 19%of Londoners use
regularly
of Londoners use
regularly
of Londoners use
regularly
of Londoners use
regularly
of Londoners use
regularly
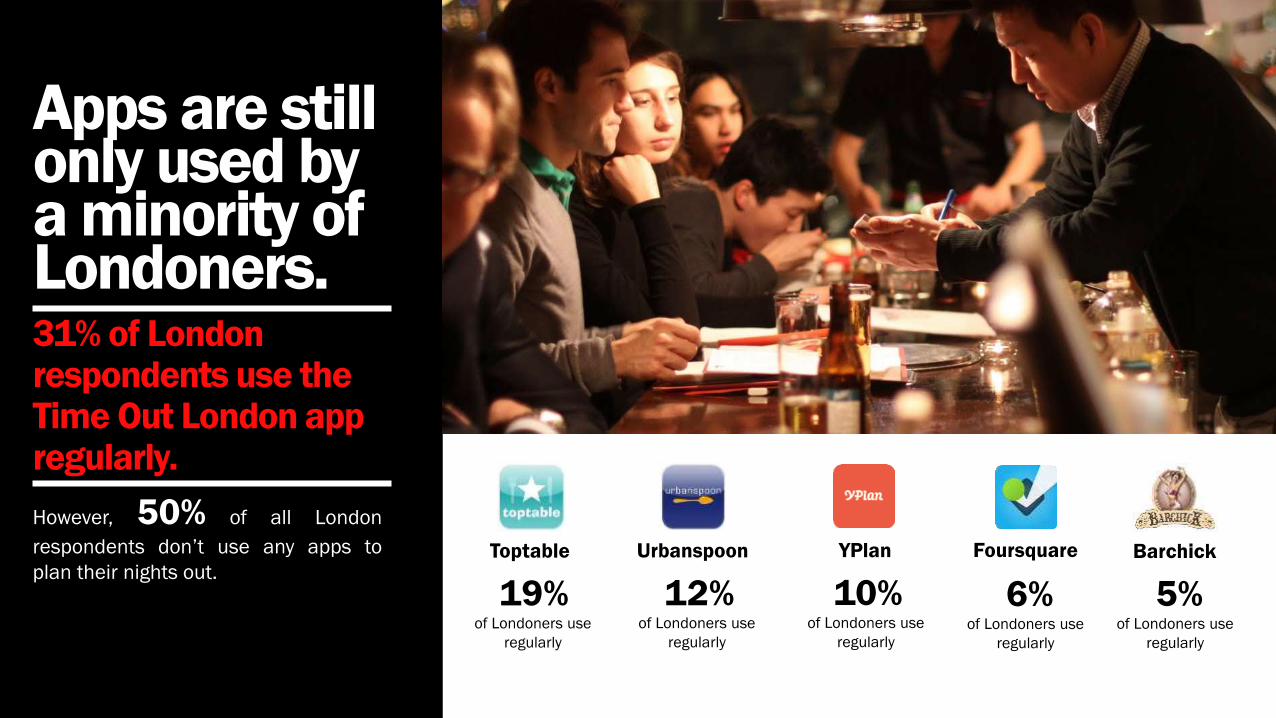
Apps are still only used by a minority of Londoners.31% of London respondents use the Time Out London app regularly.
However, 50% of all London
respondents don’t use any apps to
plan their nights out.
19% 12% 10% 6% 5%of Londoners use
regularly
of Londoners use
regularly
of Londoners use
regularly
of Londoners use
regularly
of Londoners use
regularly
Toptable Urbanspoon YPlan Foursquare Barchick
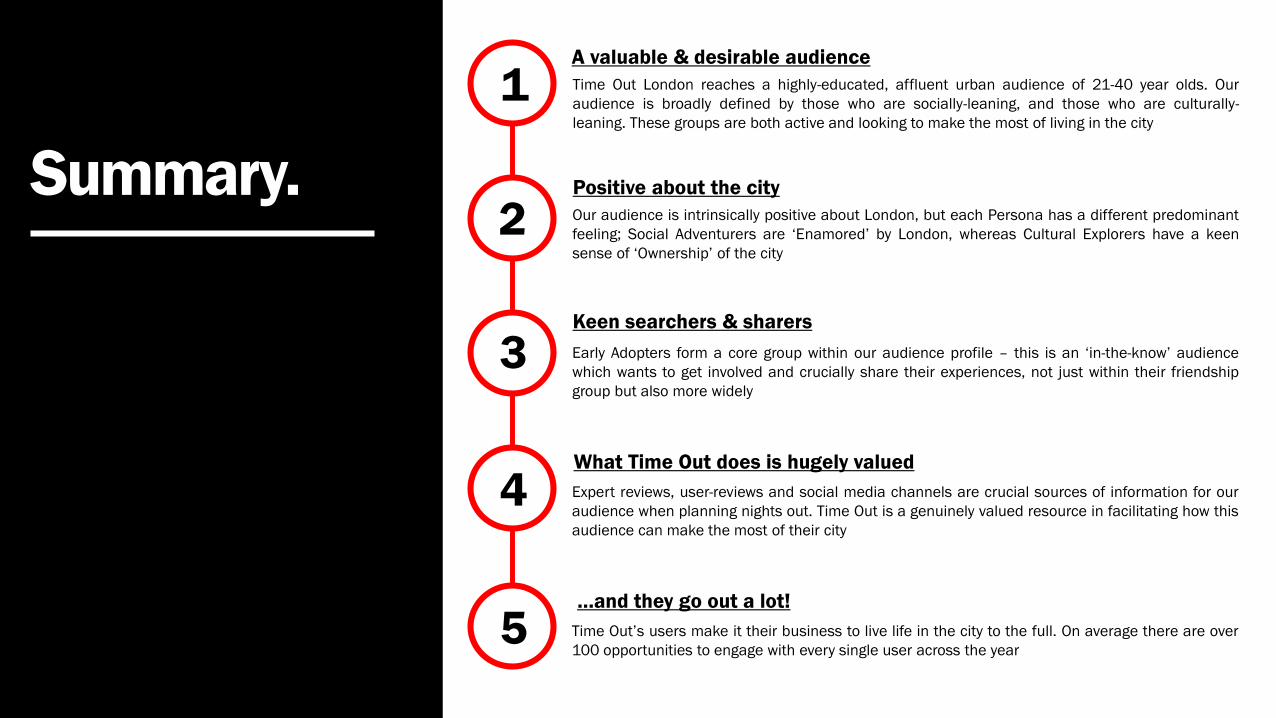
Summary.
1 Time Out London reaches a highly-educated, affluent urban audience of 21-40 year olds. Our
audience is broadly defined by those who are socially-leaning, and those who are culturally-
leaning. These groups are both active and looking to make the most of living in the city
2
3
4
5
Our audience is intrinsically positive about London, but each Persona has a different predominant
feeling; Social Adventurers are ‘Enamored’ by London, whereas Cultural Explorers have a keen
sense of ‘Ownership’ of the city
Early Adopters form a core group within our audience profile – this is an ‘in-the-know’ audience
which wants to get involved and crucially share their experiences, not just within their friendship
group but also more widely
Expert reviews, user-reviews and social media channels are crucial sources of information for our
audience when planning nights out. Time Out is a genuinely valued resource in facilitating how this
audience can make the most of their city
A valuable & desirable audience
Positive about the city
Keen searchers & sharers
What Time Out does is hugely valued
…and they go out a lot!
Time Out’s users make it their business to live life in the city to the full. On average there are over
100 opportunities to engage with every single user across the year
Appendix

Time Out personalities.How we determined our Persona profiles. Goal was to determine our users
propensity to be social and/or
cultural
We were able to graph their answers
and split them into four quadrants
based on their responses
Based on this data we wanted to
build two profiles of our users that
categorized how often they go out,
their age, spending habits, etc.
More socially-focused questions
• I love meeting new people
• I’m happiest when I’m out with a group of friends
• I’m the more outgoing one among my friends and family
• I’m the one who usually makes the plans for my group
Less socially-focused questions
• I prefer small groups to large crowds
• I’m the “quiet” one in my group of friends
• I usually let someone else take the lead when making plans
• I don’t really like going from place to place (e.g. bars, clubs, etc.)
More cultural-focused questions
• I’ll try anything once
• I like to learn while being entertained
• Leaning more about people and places excites me
• I prefer to go places off the beaten path
Less cultural-focused questions
• When going out, I tend to stick to my usual places (e.g. bars, restaurants,
shops, etc.)
• I’d rather get a recommendation before trying something new
• I look for more tried and trusted things to do when making plans
• I’m turned off by the arts (e.g. art galleries, opera, ballet, dance, theatre, etc.)
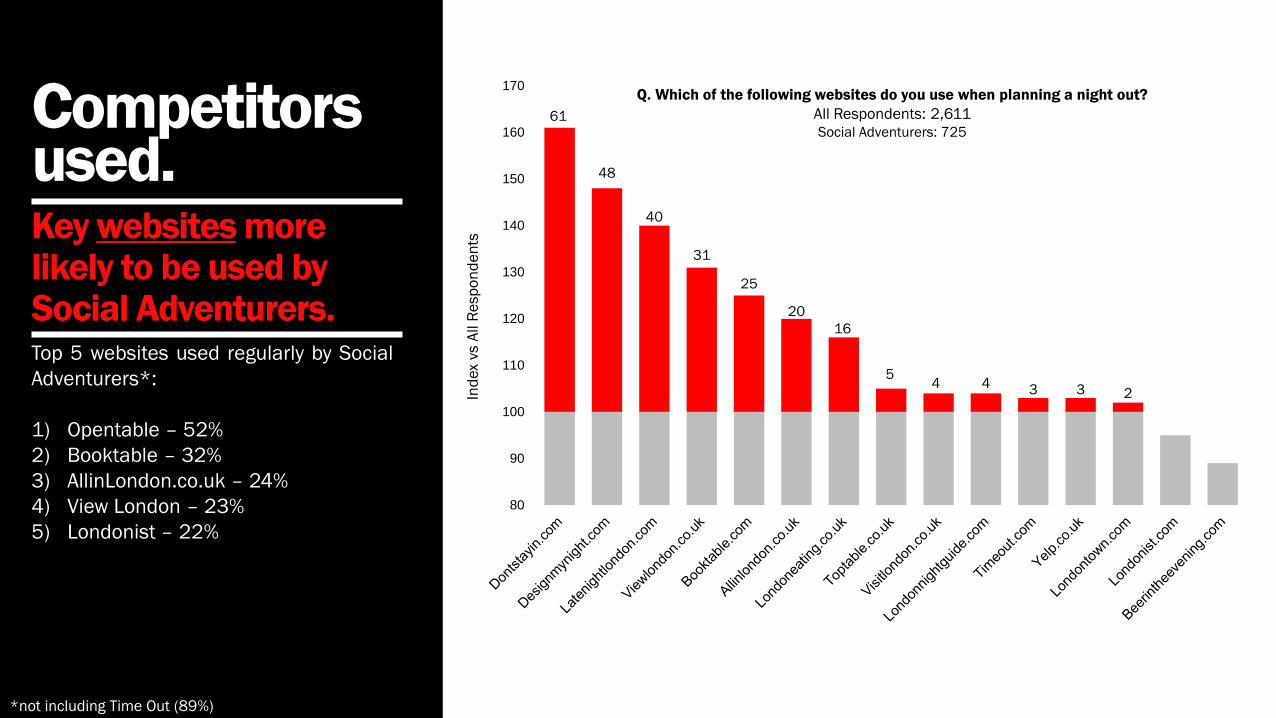
Competitors used.Key websites more likely to be used by Social Adventurers.Top 5 websites used regularly by Social
Adventurers*:
1) Opentable – 52%
2) Booktable – 32%
3) AllinLondon.co.uk – 24%
4) View London – 23%
5) Londonist – 22%
61
48
40
31
25
20
16
54 4 3 3 2
80
90
100
110
120
130
140
150
160
170
Ind
ex
vs A
ll R
esp
on
de
nts
Q. Which of the following websites do you use when planning a night out?
All Respondents: 2,611
Social Adventurers: 725
*not including Time Out (89%)
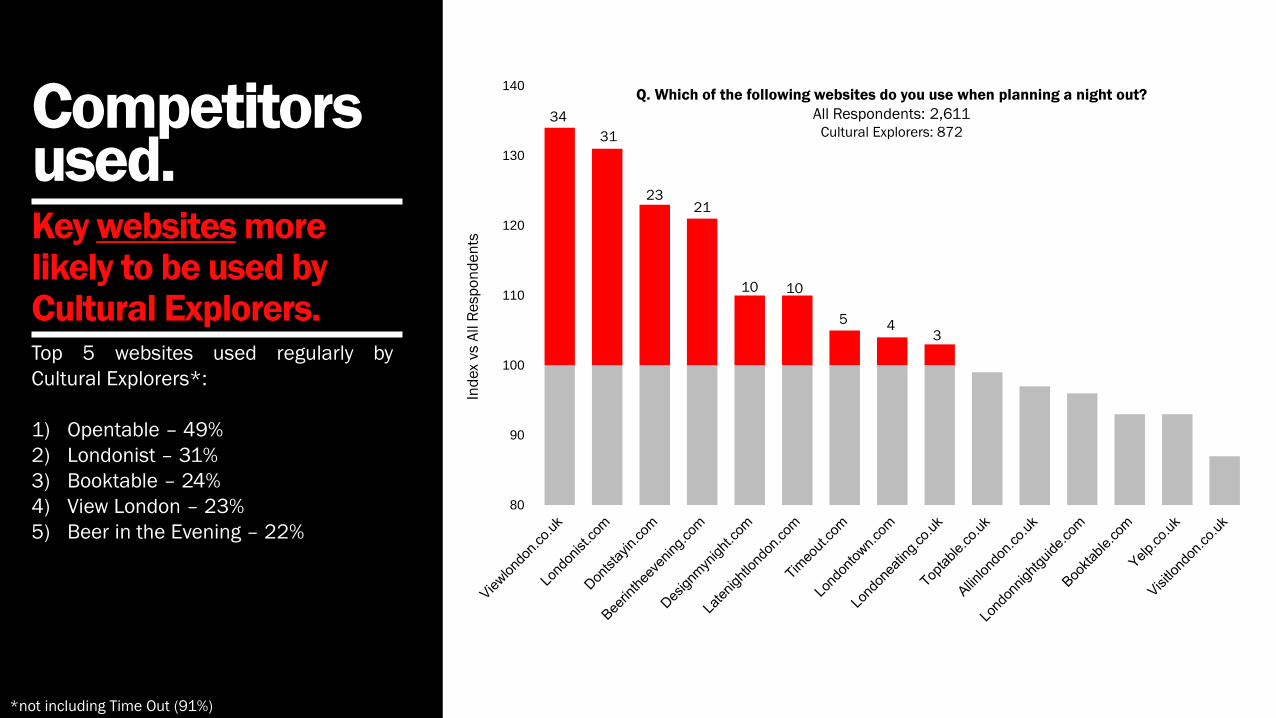
Competitors used.Key websites more likely to be used by Cultural Explorers.Top 5 websites used regularly by
Cultural Explorers*:
1) Opentable – 49%
2) Londonist – 31%
3) Booktable – 24%
4) View London – 23%
5) Beer in the Evening – 22%
34
31
2321
10 10
5 43
80
90
100
110
120
130
140
Ind
ex
vs A
ll R
esp
on
de
nts
Q. Which of the following websites do you use when planning a night out?
All Respondents: 2,611
Cultural Explorers: 872
*not including Time Out (91%)
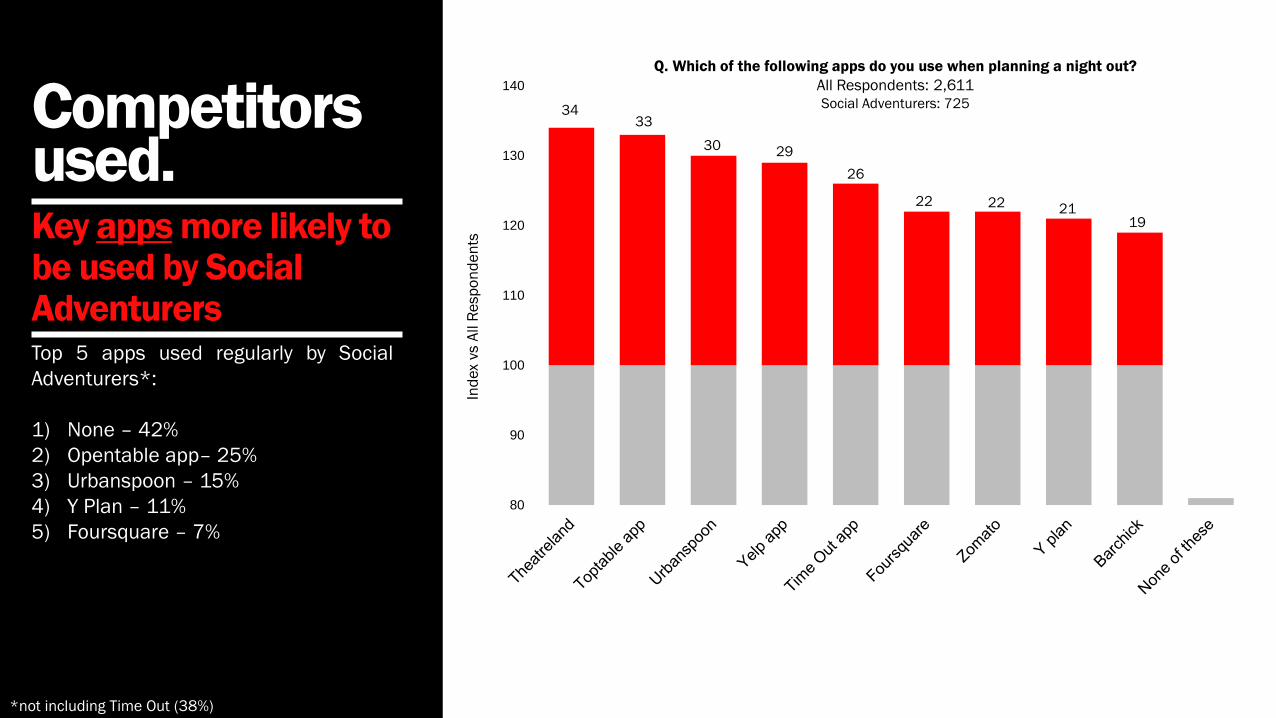
Competitors used.Key apps more likely to be used by Social AdventurersTop 5 apps used regularly by Social
Adventurers*:
1) None – 42%
2) Opentable app– 25%
3) Urbanspoon – 15%
4) Y Plan – 11%
5) Foursquare – 7%
3433
30 29
26
22 22 2119
80
90
100
110
120
130
140
Ind
ex
vs A
ll R
esp
on
de
nts
Q. Which of the following apps do you use when planning a night out?
All Respondents: 2,611
Social Adventurers: 725
*not including Time Out (38%)
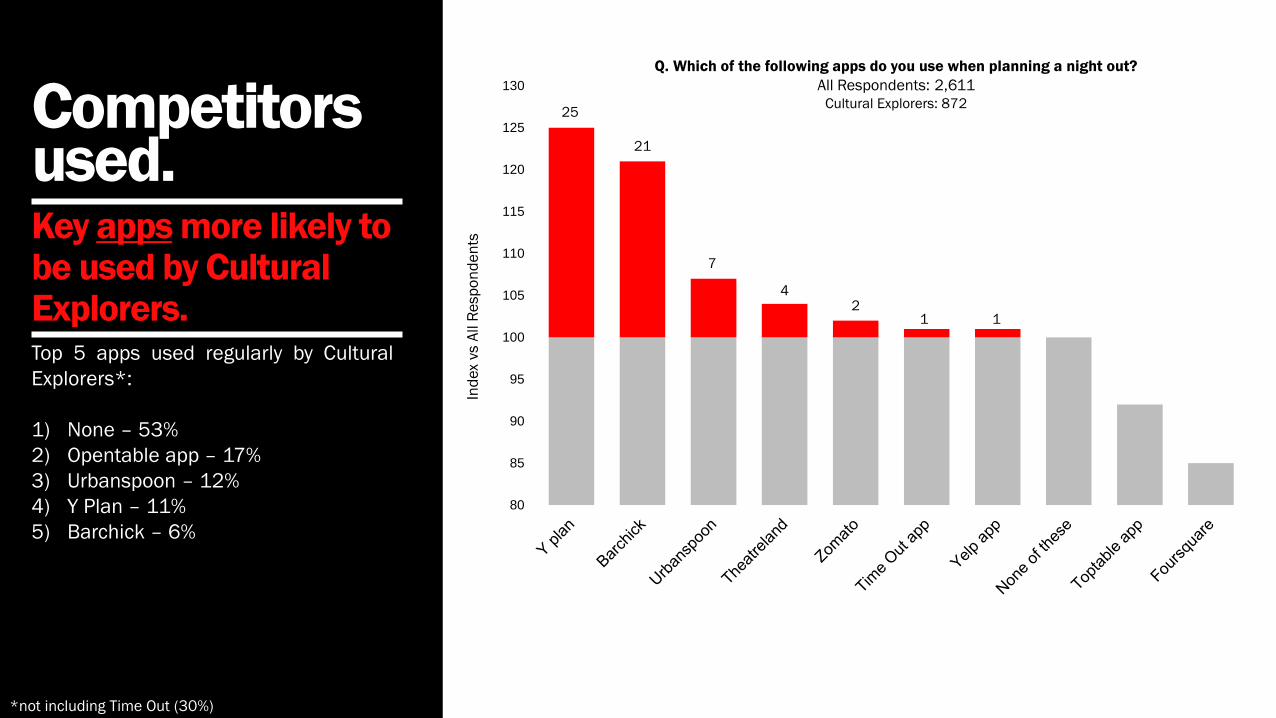
Competitors used.Key apps more likely to be used by Cultural Explorers.Top 5 apps used regularly by Cultural
Explorers*:
1) None – 53%
2) Opentable app – 17%
3) Urbanspoon – 12%
4) Y Plan – 11%
5) Barchick – 6%
25
21
7
42
1 1
80
85
90
95
100
105
110
115
120
125
130
Ind
ex
vs A
ll R
esp
on
de
nts
Q. Which of the following apps do you use when planning a night out?
All Respondents: 2,611
Cultural Explorers: 872
*not including Time Out (30%)
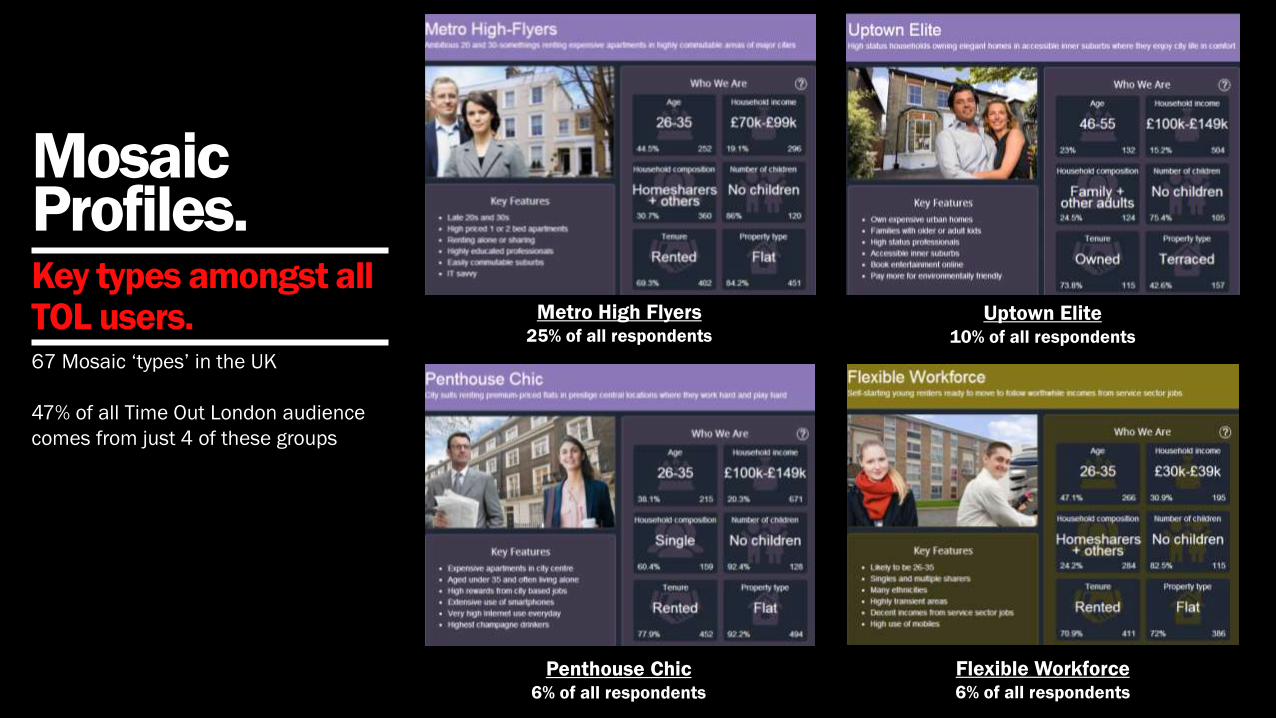
Mosaic Profiles.Key types amongst all TOL users.67 Mosaic ‘types’ in the UK
47% of all Time Out London audience
comes from just 4 of these groups
Metro High Flyers25% of all respondents
Uptown Elite10% of all respondents
Penthouse Chic6% of all respondents
Flexible Workforce6% of all respondents
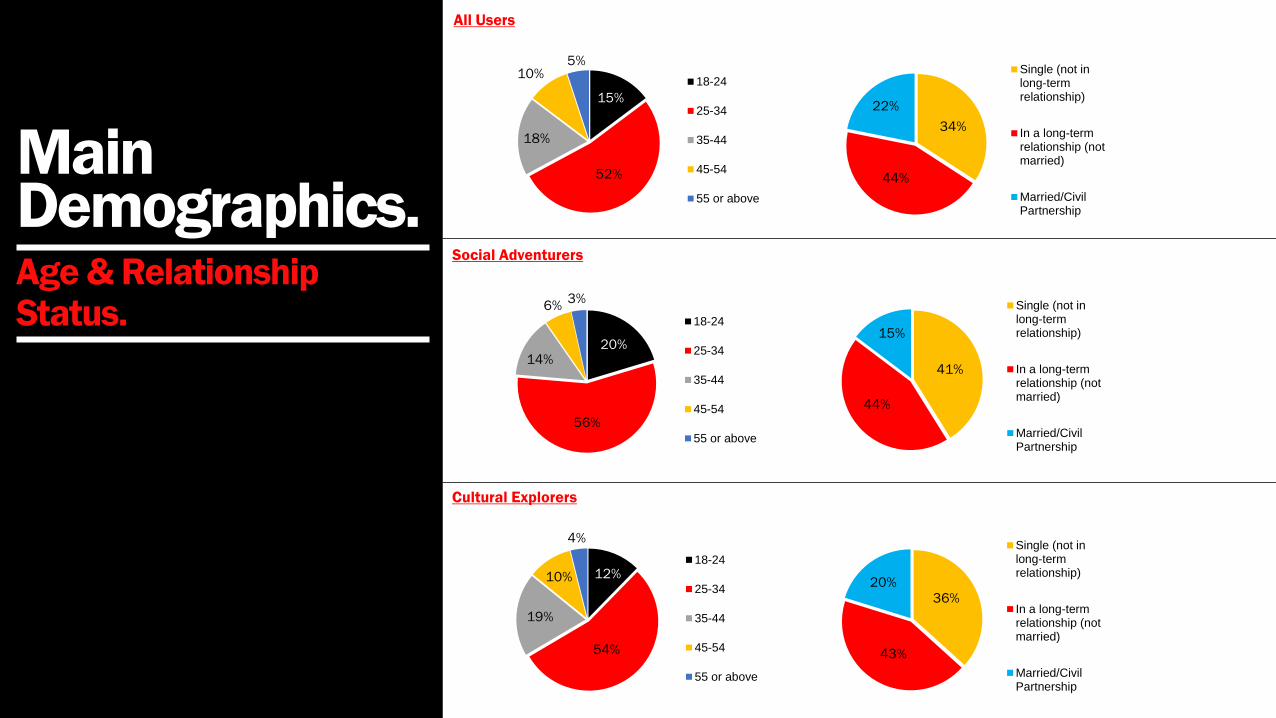
Main Demographics.Age & Relationship Status.
All Users
Social Adventurers
Cultural Explorers
15%
52%
18%
10%5%
18-24
25-34
35-44
45-54
55 or above
34%
44%
22%
Single (not inlong-termrelationship)
In a long-termrelationship (notmarried)
Married/CivilPartnership
20%
56%
14%
6%3%
18-24
25-34
35-44
45-54
55 or above
41%
44%
15%
Single (not inlong-termrelationship)
In a long-termrelationship (notmarried)
Married/CivilPartnership
12%
54%
19%
10%
4%
18-24
25-34
35-44
45-54
55 or above
36%
43%
20%
Single (not inlong-termrelationship)
In a long-termrelationship (notmarried)
Married/CivilPartnership
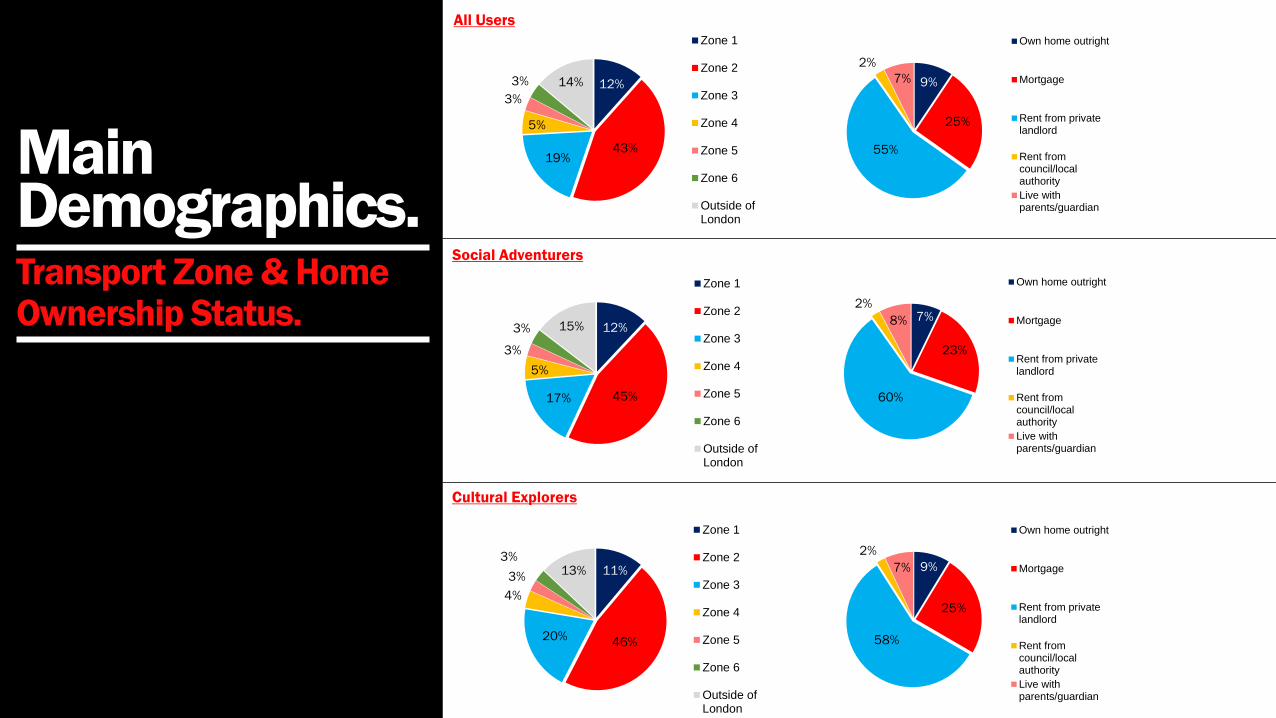
Main Demographics.Transport Zone & Home Ownership Status.
All Users
Social Adventurers
Cultural Explorers
12%
43%19%
5%
3%
3% 14%
Zone 1
Zone 2
Zone 3
Zone 4
Zone 5
Zone 6
Outside ofLondon
9%
25%
55%
2%
7%
Own home outright
Mortgage
Rent from privatelandlord
Rent fromcouncil/localauthority
Live withparents/guardian
12%
45%17%
5%
3%
3% 15%
Zone 1
Zone 2
Zone 3
Zone 4
Zone 5
Zone 6
Outside ofLondon
7%
23%
60%
2%
8%
Own home outright
Mortgage
Rent from privatelandlord
Rent fromcouncil/localauthority
Live withparents/guardian
11%
46%20%
4%
3%
3%13%
Zone 1
Zone 2
Zone 3
Zone 4
Zone 5
Zone 6
Outside ofLondon
9%
25%
58%
2%
7%
Own home outright
Mortgage
Rent from privatelandlord
Rent fromcouncil/localauthority
Live withparents/guardian