time – money – people - assets
TRANSCRIPT

Resourcing Strategy Time – Money – People - Assets
Addendum to revised Delivery Program 2018-2022

2
Strategy Background
Section 403 of the Local Government Act 1993 (the Act) requires Council to have a long-term
strategy called a Resourcing Strategy. The resourcing strategy is to include long-term financial
planning, workforce management planning and asset management planning.
The Resourcing Strategy is part of a set of plans and strategies established under section 406 of the
Act known as Integrated Planning and Reporting (IP&R) guidelines.
The IP&R framework is built on a quadruple bottom line, that is, the pillars of sustainability of
economy, social, environmental and civic leadership. The plans reinforce the imperative of the
integration of sustainability into Council’s core business.
The framework is summarised in the following diagram:
While the Community Strategic Plan 2017-2027 provides a vehicle for expressing long-term
community aspirations, these goals and objectives can not be achieved without sufficient resources
(time, money, people and assets) to carry them out. Some strategies identified in the Community
Strategic Plan are the responsibility of Council, while others are the responsibility of other levels of
government and others rely on input from community groups or individuals. The Resourcing Strategy
addresses the strategies that are the responsibility of Council.

3
Armidale Regional Council Profile
The Armidale Regional Council (ARC) area is located in the New England region of New South Wales,
about halfway between Sydney and Brisbane.
Some of the key economic indicators available for the region are:
Population 30,779 persons
Average Annual Population Growth Rate Approx. 0.6%
Land Area 8,630km2
Population Density 0.04 persons per hectare
Gross Regional Produce $1.54 billion
Largest Industries
Education and Training
Agriculture, Forestry and Fishing
Health Care and Social Assistance
ARC was formed by the amalgamation of Armidale Dumaresq Council and Guyra Shire Council on 12
May 2016. The former councils were found to be financially unsustainable under the “fit for the
future” framework established by the NSW Government. The resulting council was left with the
responsibility of a large rural road network and the same level of services spread over a ratepayer
base of around 13,340 rateable assessments.
Merging two entities identified as financially unsustainable does not immediately improve the long
term financial outlook for the new entity. As the new entity, ARC must develop the required
strategies to achieve a financially sustainable outlook.
ARC’s relatively low population density means that it has a lower rate base than city-based
regions from which to raise revenues to maintain infrastructure and provide services. Underpinning
this challenge is the NSW local government environment of rate capping, which limits the amount of
taxation-based revenue that can be raised as well as the restrictions placed on types of charges that
can be raised and setting of amounts for statutory fees and charges.
Strategy Overview
The Resourcing Strategy provides Council with an agreed roadmap for managing its financial
resources and is aligned with the objectives and priorities of the 2020-21 Operational Plan.
Council's Resourcing Strategy consists of three sections:
1. Long term financial plan incorporating the 2020-21 budget;
2. Workforce management plan; and
3. Asset management planning.
Long Term Financial Plan
This Plan reflects Council's desire and capacity to deliver the strategies, initiatives, works and
programs identified in the Community Strategic Plan, Delivery Program and Operational Plan. The
Plan is underpinned by the Financial Policy and Strategy 2017-2021. The Plan includes:
• The 2020-21 budget;
• Projected financial position over a ten year timeframe (2020-21 to 2029-2030);
• Key assumptions used to develop forecasts;
• Sensitivity analysis and financial modelling of different forecast scenarios; and
• Key performance indicator results.

4
Workforce Management Plan 2018-2022
Council’s workforce planning addresses the people resourcing requirements of the Delivery Program
and Operational Plan. It ensures Council has the people best able to achieve its strategic direction
and deliver appropriate services and programs effectively and efficiently. The plan includes:
• Analysis of current workforce and identification of gaps;
• Forecasts of workforce requirements;
• Strategies to address gaps; and
• Methods of periodic monitoring and evaluation.
Asset Management Planning
Council has a significant portfolio of community infrastructure assets under its care and control. The
Asset Management Strategy accounts for and plans for all of the existing assets, and any new asset
solutions proposed in the Community Strategic Plan and Delivery Program.
The Asset Management Strategy is underpinned by an Asset Management Policy and sub-plans that
identify all built assets under Council's ownership and outlines the risk management strategies for
them.
Financial Sustainability
Financial sustainability for local governments is critical as they are responsible for directly providing
the community with a wide range of public services and community infrastructure and facilities. This
requires local governments to hold and maintain a significant base of infrastructure assets, which
necessitates not only substantial initial investments but also continued expenditure to maintain and
renew assets over the course of their respective useful lives.
There are many definitions of financial sustainability with the definition developed by NSW Treasury
Corporation being:
A local government will be financially sustainable over the long term when it is able to generate
sufficient funds to provide the levels of service and infrastructure agreed with its community.
Council has recognised that financial sustainability requires the following:
• Council must achieve a fully funded operating position;
• Council must maintain sufficient cash reserves;
• Council must have an appropriate funded capital program;
• Council must maintain its asset base; and
• And expenditure on assets should be driven by asset management plans.
As with many local governments, a major challenge for Council is the management of ageing assets
in need of renewal and replacement. Infrastructure assets such as roads, bridges, pathways, kerbs,
stormwater drains and public buildings present particular challenges as their condition and longevity
can be difficult to determine. The creation of new assets also presents challenges in terms of funding
for initial construction and ongoing service costs.
Council also recognises and is responding to some impactful environmental and social challenges
over the past few years including drought, bushfires and COVID-19. These challenges have an
enormous bearing on the resources of Council and the delivery of services, both in the short and
long-term.

5
2020-21 Budget &
Long Term Financial Plan
6
2020-21 Budget
Introduction
Council’s 2020/21 budget has been developed in accordance with the Financial Policy and Strategy
2017-2021, which advocates for a financially sustainable position. Financial sustainability is
measured through Council’s financial results including the performance against key benchmarks
developed by the NSW Office of Local Government.
Over the last 2 financial years Council has improved on previous reported results in key areas of
financial sustainability including operating performance results and cash results.
This was necessitated by budget forecasts for significant operating deficits and very low levels of
cash reserves. The 2018/19 financial year saw actual reported results increase positively across all
key performance indicators and the 2019/20 financial year was on a similar trajectory if not for the
impacts outlined below.
The 2019/20 financial year is noted as being highly unusual with the combined impacts of drought,
fire, flood and pandemic in one financial period.
From a budgetary perspective, the 2019/20 financial year has been significantly impacted by two key
events:
1. Ongoing severe drought conditions have negatively impacted Council’s Water Fund by around
$6.3 million. This includes around $3.3 million in net costs associated with drought response,
communications, rebate programs and bore drilling and around a $3 million reduction in
revenue from water usage charges resulting from decreased water usage.
2. The impact of COVID-19 shutdowns has had a negative impact on the local economy and also
Council’s General Fund budget outlook. The impact on the 2019/20 budget is estimated to result
in a loss of revenue in the order of $700,000 predominantly relating to airport user charges and
decreased rent and lease income. The impact on the 2020/21 budget is forecast to be a loss of
revenue of $925,000 although could be much higher due to the flow on impacts to the local
economy that may take some time to realise.
The region also experienced bushfires and flooding leading to additional negative budgetary and
cash impacts.
For the 2020/21 financial year, an extensive process has been undertaken in order to deliver a
budget that attempts to mitigate these impacts as far as possible without cuts to services. While
holding or reducing expenditure has occurred where possible, there has also been provision made
around economic recovery including providing funding and support for business stimulus. A key
initiative will be the development of a Business Ecosystem as a centralised coordinator of
investment promotion and a one-sop service centre for investors and business operators. Council
also plans to deliver a $40 million capital program to assist with local investment and employment
including finalisation of Stage 1 of the Airport Business Park.
Due to the above factors, a key focus of the development of the 2020/21 budget has been to
minimise operating deficits across all funds and, where possible, redirect funding to economic
recovery initiatives to assist with the response to COVID-19 impacts. The budget position will be
supported with strategies to ensure that costs are tightly controlled and that financial management
across the business is a key priority during a challenging economic period.

7
There will be a detrimental impact to Council’s operating result and key performance indicators as a
result of the current conditions and associated impacts on Council’s budget with the operating
performance ratio and the asset renewals ratio being most impacted.
The 2020/21 budget includes a consolidated operating deficit of $2.3 million with the following fund
operating deficit results:
General Fund ($1,456,477)
Water Fund ($621,045)
Sewer Fund ($205,177)
Consolidated ($2,282,699)
Council is forecasting an unrestricted cash position of around $3 million by 30 June 2021. The
unrestricted cash position is important as it is Council’s main buffer for unexpected events, such as
natural disasters. The level of unrestricted cash forecast in the 2020/21 budget would only cover
Council’s operational costs for around 3-4 weeks if a situation occurred where Council was unable to
receive payments.
While it would be desirable to further improve the cash position beyond this from a financial risk
perspective, Council recognises that it will be necessary to divert funding to the economic recovery
associated with COVID-19 and, as a result, has increased funding to areas where economic recovery
is a key focus as well as continuing to support a large capital program.
Unbudgeted Supporting Documents and Initiatives
Council has a large number of supporting documents that may be in the form of a plan, strategy,
study, or similar, that have potential actions but have not yet been funded through the Delivery
Program or Operational Plan process. The Operational Plan and budget are the tools used to allocate
the limited resources available to Council to the highest level needs and priorities.
The large volume of supporting documents provide clear, longer term intent and direction for
Council in terms of what it would like to do and what it will endeavour to do with the resources that
may be available. These supporting documents are important in planning future services and are
used to identify and respond to opportunities for future external funding and/or an increase or
redirection of existing funding.
There are a large number of other potential initiatives or programs that have not been included in
the financial estimates at this stage, due to the lack of certainty around the timing, funding and/or
probability of completion. These initiatives or projects may be introduced through the budget review
process when they reach a point of clarity and funding is available that enables their inclusion.
Budget Process
Council prepares an annual budget and long term financial plan in line with the requirements of the
Local Government Act 1993. However, it is important to recognise that a budget is an estimate
prepared at a point in time and is therefore subject to change. Thus, to recognise amendments to
the budget quarterly budget reviews are performed throughout the financial year. As Council’s
funding sources are relatively fixed, it is important that any reviews to the budget do not
significantly detrimentally impact the forecast operating and cash results.

8
Operating Budget
The operating budget contains revenue and expenditure that is classified in accordance with the
Australian Accounting Standards as operating and not capital. The budget is also presented in the
format required by the Australian Accounting Standards being a set of financial statements
including:
• Income Statement;
• Balance Sheet;
• Cashflow Statement; and
• Equity Statement.
Council is required by the Local Government Act 1993 to account for and show the budget separately
for:
• Water Fund;
• Sewer Fund; and
• General Fund (everything else).
The main categories of revenue and expenditure shown in the operating budget are outlined below.
Rates and Annual Charges
Information on the amounts set for rates and annual charges are contained in the Revenue Policy
2020-2021, which is a separate document also adopted as part of the budget.
Council levies a range of ordinary rates for different categories of land as well as annual charges for
water, sewer, waste and drainage.
Increases in rate income are subject to annual determination by the Independent Pricing and
Regulatory Tribunal (IPART). For the 2020-21 financial year, IPART has set a rate peg of 2.6%. The
rate peg determines the maximum percentage amount by which a council may increase its general
income for the year. The rate peg applies to general income in total, and not to individual
ratepayers’ rates. This cap only applies to income contained in the general income calculation and
therefore does not apply to annual charges.
Rates Harmonisation
Since amalgamation of Armidale Dumaresq and Guyra Shire Council in 2016 Council has been
required to maintain two rating systems for the local government area. This was due to a four year
rate freeze imposed by the NSW Government. This meant that Council could not adjust rates beyond
the rate peg in the first four years after amalgamation which saw different rates being paid in the
former local government areas.
Under current legislation Council must maintain one consistent rating structure to ensure a fairer
and more equitable system across all rating categories within the Armidale Regional Local
Government Area. This will take effect from 1 July 2021 and will only affect general rates. There will
be no increase in total rates collected by Council due to harmonisation, but the structure and
distribution between rating sub-categories will change as a result.
Council has performed modelling on the current rating structure and determined that the most
impacted categories and sub-categories from harmonisation will be:
• Residential Non-Urban
• Business Non-Urban
• Farmland

9
This is based on a harmonisation model that seeks to minimise individual impacts on ratepayers.
The challenge in harmonising rates is recognised by the NSW Government. The Minister for Local
Government has committed to taking a bill to the Parliament early next year which would provide
options for Council to implement rates harmonisation more gradually. There is no guarantee that
the bill will be passed by Parliament so we must continue under the current law and current date of
July 1 2021.
Equalisation of Services and Charges
Harmonisation of services and charges is continuing in order to establish equity and consistency
across the Armidale Regional Council region. A key area of focus for harmonisation in the 2020-21
financial year is the harmonisation of water, sewerage and waste charges. Changes included in the
2020-21 budget and revenue policy in order to achieve this outcome are:
• Water consumption charges will be harmonised with the overall yield achieved similar to
previous years;
• Sewerage charges will be harmonised with the overall yield achieved similar to previous years;
• Progression towards harmonisation of rural waste management charges; and
• The Waterfall Way Landfill Levy will be levied on all properties.
In addition, a new charge to cover the additional operational costs of the Waterfall Way Landfill has
been introduced at $65 per property and will apply to all properties in the region.
Further information on Council’s rates and annual charges are contained in the 2020-2021 Revenue
Policy.
Special Rate Variation (SRV)
What is a Special Rate Variation?
An SRV is a way of lifting ordinary rate revenue above the rate peg. They are often necessary due to:
• The historical level of rates is unsustainable;
• Cost drivers rise faster than inflation;
• Population growth creates costs that outstrip the revenue back to local government; and
• New costs are created without a source of funding e.g. cost shifting, economic growth,
community expectation, natural disasters, climate change.
SRVs used to be applied for sparingly but this has increased in recent years due to a focus on
financial sustainability and growing awareness of significant local government asset management
challenges.
History of Special Rate Variations
In comparison with other NSW councils, Armidale-Dumaresq and Guyra Shire Councils used the SRV
process minimally over the past decades. Compared with other NSW councils, ratepayers in this
region have experienced modest rates increases over 20 years+.
The table below indicates temporary SRVs that were used to increase rates revenue for a temporary
period of five to ten years. The percentage increases include the SRV and the annual rate peg. The
table starts in 2005/06, and before that year the Councils had not applied for or been granted any
SRV since 1997/98.

10
Council 2005/06 2006/07 2007/08 2008/09 2009/10 2010/11 2011/12 2012/13 2013/14 2014/15
Rate Peg 3.50% 3.60% 3.40% 3.20% 3.50% 2.60% 2.80% 3.60% 3.40% 2.30%
Armidale
Dumaresq
5.78%
(expired
2013/14)
12.30%
(expires
2020/21)
Guyra
Shire
8.43%
(expired
2013/14)
8.00%
permanent
It can be seen from the above table that temporary SRVs have been used as an additional source of
funding by both the former Armidale Dumaresq and Guyra Shire Councils for the last 15 years.
Background
On 3 June 2014, the NSW Independent Pricing and Regulatory Tribunal (IPART) approved Special
Rate Variations for the former Guyra Shire Council and Armidale Dumaresq Council. It was
determined that Guyra Shire Council may increase its general rate income by 8.0%, including the
rate peg of 2.3%. The increase above the rate peg can be retained in the Councils general income
base permanently. It was determined that Armidale Dumaresq Council may increase its general rate
income by 12.3%, including the rate peg of 2.3%. The increase above the rate peg can be retained in
the Councils general income base for 7 years, being 2014-15 to 2020-21.
As at 30 June 2021, the temporary SRV of 10% (above the rate peg) applied by the former Armidale
Dumaresq Council over a seven year period will expire, reducing Council’s overall rates income by
$1.5 million annually. Income generated from the temporary SRV has paid for the maintenance and
renewal of community assets including roads, bridges, storm water drainage, buildings and other
community facilities in accordance with the following graph.
Roads
$5,133,756
52%
Stormwater
Drainage
$2,671,599
27%
Recreation and
Facilities
$990,091
10%
Buildings
$1,019,000
11%
SRV Asset Renewal $9.8 Million

11
Proposed 2021/22 SRV Application
To maintain current levels of service Council must apply this year to the NSW Independent Pricing &
Regulatory Tribunal (IPART) to have the temporary SRV made permanent. Before making a
submission, Council will consult the community on three options for an SRV including a higher SRV
amount to allow for further investment in maintaining infrastructure, in particular renewal works on
roads, footpaths, community buildings and other structures. On 28 October 2020, Council resolved
to begin public engagement on three SRV options, to formally notify IPART that Council intends to
submit an application, and to include rates harmonisation in the community engagement.
The following SRV options have been proposed:
1. A permanent SRV of 18.5% plus 2.0% rate peg (total 20.5%) commencing in 2021-22;
2. A permanent SRV of 8.5% plus 2.0% rate peg (total 10.5%) commencing in 2021-22; and
3. Discontinuation of the temporary SRV of 10% (above the rate peg) applied by the former
Armidale Dumaresq Council and ending on 30 June 2021.
The SRV options have been described to the community as:
SRV
Scenario
Description
1.
Improve
Services
Continuation of the temporary SRV plus an additional SRV increase
Council will apply for a Special Rate Variation (SRV) of 18.5% plus the 2.0% rate peg
(total of 20.5%). This will replace the funding currently provided by the temporary SRV
and increase total rate revenue by $1.8 million per annum.
This option will result in our current level of assets and services maintained and Council
will also be able to fund additional asset renewals and reduce our medium to long term
financial risk. Roads, bridges, buildings and community facilities maintenance and
renewal will be the focus of additional funds raised.
2.
Maintain
Services
Continuation of the temporary SRV - Does not address future growth
Council will apply for a Special Rate Variation of 8.5% plus the 2.0% rate peg (total of
10.5%). This will replace the loss of the current SRV which is due to stop in 2021.
This option will result in current levels of service maintained in the short term; however
our asset renewal backlog will increase. This will increase costs in the medium to long
term placing a financial burden on future generations. Council will have limited options
to fund new assets as the region grows.
3.
Decrease
Services
Discontinuation of the temporary SRV - Financially unsustainable
Council will not apply for a Special Rate Variation and revenue from ordinary rates will
drop by $1.5 million per annum.
This option will see a significant reduction in the services provided by Council and our
asset renewal backlog will increase. Roads, buildings and public spaces will deteriorate
placing a significant financial burden on future generations and threaten Council’s
medium and long term financial sustainability. Even though there would be a reduction
in individual rates assessments, harmonisation may result in an increase in some rates.

12
Key Purpose of the SRV
As indicated in the description of the SRV options, the focus of the proposed 2021/22 SRV is financial
sustainability and asset renewal funding.
The SRV funding will be used for managing Council’s existing infrastructure. This includes renewal
and ongoing maintenance of assets such as buildings, roads, drainage, parks and facilities. Renewal
activities extend the life of the asset such as re-sheeting a section of road. Maintenance includes
repairs, painting, replacement of broken fixtures, etc. The SRV will be used for managing existing
infrastructure to ensure assets are kept at current service standards and replaced at the planned
replacement time rather than allowing assets to deteriorate to a point where major rehabilitation
would be required.
Further details on the financial outcomes of each SRV scenario are shown under the Long Term
Financial Plan section in this document.
User Charges and Fees
Information on the amounts set for user charges and fees are contained in the Fees and Charges
2020-2021, which is a separate document also adopted as part of the budget.
Fees for services have been established having due consideration of the following factors:
• The importance of the service to the community;
• The cost of providing the service;
• The level of subsidy, if any, appropriate from other funding sources;
• Where applicable, the price set by a relevant industry body;
• Any factors specific in the Local Government Act 1993; and
• Market rates or pricing for similar services.
With many services provided by local government being of the nature of a public good, it can be
difficult to fully recover the cost of many services. The pricing for many regulatory services is also
constrained by amounts set by the NSW Government for these services. Council has a strong focus
on recovering costs by way of user charges and fees; however, is cognisant of the reality that full
cost recovery is only possible in some situations.
Interest and Investment Revenue
Interest revenue represents the returns paid by financial institutions on funds invested plus the
interest penalty levied on overdue rates and charges.
Other Revenues
“Other revenues” is a category that essentially captures revenues that are not assigned to another
category. For Council, this category includes items such as rent and least income and fines.
Operating Grants and Contributions
Council receives a significant level of funding in the form of operating grants and contributions. The
biggest funding sources in his category are:
• Financial Assistance Grants;
• Roads to Recovery; and
• Regional Roads Funding.
Any change to government policy that negatively impacts on these funding levels would have
significant consequences for Council.

13
Capital Grants and Contributions
Council usually receives capital grants and contributions for once off projects and in 2020-21 Council
is forecast to receive the following grants:
• Kempsey Road Natural Disaster Restoration $5 million;
• Airport industrial land development $3.8 million;
• Kempsey Road Big Hill Project $2.8 million;
• Puddledock Dam Pipeline Upgrade $1.4 million; and
• Dumaresq Dam Stability Upgrade $1.2 million.
These funding sources are allocated to specific capital projects and cannot be used to fund day to
day operations. For this reason, while this revenue is shown in the Income Statement, it is excluded
from the operating result when considering financial performance.
Capital grants and contributions are an important funding source as they are the main way that
Council can access the funding required to construct new or improved community assets. However,
consideration of new community assets requires careful consideration. While this is looked on
favourable by the community, new assets generally create additional operational costs and add to
Council’s infrastructure renewal funding requirements and infrastructure backlog.
Employee Costs
Employee costs represent the full cost of employing staff including wages, superannuation, annual
leave, sick leave, long service leave, workers compensation and training and development.
For the 2020-21 budget, the award increase has been assumed to be similar to historical levels.
The superannuation guarantee rate is currently 9.5%. At this time, the superannuation guarantee
rate is scheduled to increase to 10% from 1 July 2021 and then to progressively increase by 0.5% per
annum to 12% by 1 July 2025.
Borrowing Costs
Borrowing costs represent the interest on loans payable in accordance with Council’s loan schedule.
Materials and Contracts
The category of materials and contracts includes the cost of running Council’s fleet and provisions
for purchases such as gravel, stores and consumables. It also contains payments for contracted
maintenance services.
Depreciation
Depreciation represents the consumption of an asset over its useful life and is the only non cash
item in the Income Statement.
Depreciation expense rises annually by indexation representing the estimated increased cost of the
replacement of assets. Depreciation is also increased by the construction of new assets.
Depreciation is an important estimate as it is used to measure Council’s performance in renewing
assets.
Other Expenses
“Other expenses” includes the cost of items such as electricity, insurance, communications and
software licensing. This category also contains Council’s contributions to third parties. There is a
range of support provided to external contributions both in the form of direct financial support and
non-financial or in-kind support.

14
Council provides around $750,000 per annum in direct financial support to community groups and
for community wellbeing initiatives. In addition to this a range of in kind support services are
provided.
Net Operating Result
The net operating result is calculated as:
• Total income from continuing operations
• Less: Total expenses from continuing operations
The net operating result includes capital income and is an indicator of the extent to which revenue
raised covers operational expenses only or is available for capital funding purposes or other
purposes.
Net Operating Result before Capital Grants and Contributions
This is commonly referred to as just the Operating Result and similarly indicates the extent to which
revenue raised covers operational expenses only or is available for capital funding purposes or other
purposes. However, it excludes capital income and is a better indicator on which to measure
Council’s financial performance because Council should at least be covering depreciation expense
with operating revenues.
Proceeds from Sale of Assets
This is capital funding which is generated form the sale or disposal of assets. In the 2020/21 financial
year Council is forecast to dispose of $1.3 million in fleet trade in or auction sales.
Unrestricted Cash
Unrestricted cash is the balancing item between cash funding and cash expenditure. In the following
graphs this is either shown as a source of funding or a source of expenditure. Where unrestricted
cash is shown as a source of funding, this represents utilisation of cash held in reserve in the current
financial year that has been built up over previous financial years. Where unrestricted cash is shown
as a source of expenditure, this represents the planned build up of unrestricted cash to either be
held as a buffer against unexpected events or to be used in a future financial year.

15
Cash Reserves
Cash reserves are established either through legislative provisions or by way of Council resolving to
establish reserves. Reserves that are statutory are referred to as externally restricted reserves
whereas reserves that are established by way of Council’s own funding determinations are referred
to as internally restricted reserves.
In the General Fund, Council will transfer $7.1 million from cash reserves to assist with funding the
2020/21 budget. These reserve transfers include:
• Unspent grants $4.8 million
• Unspent loan funding for landfill construction $339,000
• Airport capital works $903,000
• PreSchool upgrade $480,000
• S7.12 Contribution Plan $90,000
• 2019/20 Carry Forward Works $45,000
• Other internal reserves $365,000
Transfers to reserve total $1.3 million and include:
• Domestic Waste Management $300,000
• Kolora repairs and maintenance $205,000
• Other internal reserves $585,000
• S7.12 Contribution Plan $250,000
Financial Results
The financial results for the 2020-21 original budget are outlined on the following pages by fund.

16
General Fund
Recurrent Revenue
The 2020-21 budget includes total recurrent revenue of $54.8 million. The breakup of this revenue is
shown below.
Recurrent Expenditure
The 2020-21 budget includes total recurrent expenditure of $56.2 million. The breakup of this
expenditure is shown below.
Rates and Annual
Charges
$26.7M
49%
User Charges and
Fees
$12.4M
22%
Interest Revenue
$0.3M
1%
Other Revenue
$2.2M
4%
Operating Grants
and Contributions
$13.2M
24%
2020/21 BudgetRecurrent Revenue
Employee Costs
$22.2M
40%
Borrowing Costs
$1.0M
2%
Materials and
Contracts
$10.3M
18%
Depreciation
$12.4M
22%
Other Expense
$10.3M
18%
2020/21 BudgetRecurrent Expenditure

17
Cash Funding
Total cash funding available for the 2020-21 budget is $79.3 million. The breakup of funding is shown
below.
Cash Expenditure
Total cash expended or used in the 2020-21 budget is $79.3 million. The breakup of expenditure is
shown below.
Recurrent Revenue
$54.8M
69%
Capital Grants and
Contributions
$16.1M
20%
Proceeds from Sale
of Assets
$1.3M
2%
Cash Reserves
$7.2M
9%
2020/21 BudgetCash Funding
Recurrent
Expenditure excl.
Dep'n
$43.8M
55%Capital Expenditure
$30.5M
39%
Repayment of
Borrowings
$2.6M
3%
Cash Reserves
$1.5M
2%
Increase in
Unrestricted Cash
$1.0M
1%
2020/21 BudgetCash Expenditure

18
Water Fund
Recurrent Revenue
The 2020-21 budget includes total recurrent revenue of $11.2 million. The breakup of this revenue is
shown below.
Recurrent Expenditure
The 2020-21 budget includes total recurrent expenditure of $11.8 million. The breakup of this
expenditure is shown below.
Rates and Annual
Charges
$2.4M
22%
User Charges and
Fees
$8.3M
73%
Interest Revenue
$0.4M
4%
Other Revenue
$0.0M
0%
Operating Grants
and Contributions
$0.1M
1%
2020/21 BudgetRecurrent Revenue
Employee Costs
$1.9M
16%
Borrowing Costs
$0.3M
2%
Materials and
Contracts
$5.6M
47%
Depreciation
$3.4M
29%
Other Expense
$0.7M
6%
2020/21 BudgetRecurrent Expenditure

19
Cash Funding
Total cash funding available for the 2020-21 budget is $17.0 million. The breakup of funding is shown
below.
Cash Expenditure
Total cash expended or used in the 2020-21 budget is $17.0 million. The breakup of expenditure is
shown below.
Recurrent Revenue
$11.2M
66%Capital Grants and
Contributions
$2.6M
15%
Cash Reserves
$3.2M
19%
2020/21 BudgetCash Funding
Recurrent
Expenditure excl.
Dep'n
$8.4M
49%
Capital Expenditure
$8.4M
49%
Repayment of
Borrowings
$0.3M
2%
2020/21 BudgetCash Expenditure

20
Sewer Fund
Recurrent Revenue
The 2020-21 budget includes total recurrent revenue of $7.2 million. The breakup of this revenue is
shown below.
Recurrent Expenditure
The 2020-21 budget includes total recurrent expenditure of $7.4 million. The breakup of this
expenditure is shown below.
Rates and Annual
Charges
$5.7M
79%
User Charges and
Fees
$0.3M
3%
Interest Revenue
$0.2M
3%
Other Revenue
$1.0M
14% Operating Grants
and Contributions
$0.1M
1%
2020/21 BudgetRecurrent Revenue
Employee Costs
$1.4M
19%
Materials and
Contracts
$2.8M
38%
Depreciation
$2.2M
30%
Other Expense
$1.0M
13%
2020/21 BudgetRecurrent Expenditure

21
Cash Funding
Total cash funding available for the 2020-21 budget is $7.2 million. The breakup of funding is shown
below.
Cash Expenditure
Total cash expended or used in the 2020-21 budget is $7.2 million. The breakup of expenditure is
shown below.
Recurrent Revenue
$7.2M
100%
2020/21 BudgetCash Funding
Recurrent
Expenditure excl.
Dep'n
$5.2M
72%
Capital Expenditure
$1.2M
16%
Increase in Cash
Reserve
$0.8M
12%
2020/21 BudgetCash Expenditure

22
Consolidated Result
Recurrent Revenue
The 2020-21 budget includes total recurrent revenue of $73.2 million. The breakup of this revenue is
shown below.
Recurrent Expenditure
The 2020-21 budget includes total recurrent expenditure of $75.5 million. The breakup of this
expenditure is shown below.
Rates and Annual
Charges
$34.9M
48%User Charges and
Fees
$20.9M
29%
Interest Revenue
$1.0M
1%
Other Revenue
$3.2M
4%
Operating Grants
and Contributions
$13.3M
18%
2020/21 BudgetRecurrent Revenue
Employee Costs
$25.5M
34%
Borrowing Costs
$1.3M
1%
Materials and
Contracts
$18.7M
25%
Depreciation
$18.1M
24%
Other Expense
$11.9M
16%
2020/21 BudgetRecurrent Expenditure

23
Cash Funding
Total cash funding available for the 2020-21 budget is $103.6 million. The breakup of funding is
shown below.
Cash Expenditure
Total cash expended or used in the 2020-21 budget is $103.6 million. The breakup of expenditure is
shown below.
Recurrent Revenue
$73.2M
71%Capital Grants and
Contributions
$18.7M
18%
Proceeds from Sale
of Assets
$1.3M
1%
Cash Reserves
$10.5M
10%
2020/21 BudgetCash Funding
Recurrent
Expenditure excl.
Dep'n
$57.4M
55%
Capital Expenditure
$40.0M
39%
Repayment of
Borrowings
$2.8M
3%
Cash Reserves
$1.5M
1%
Increase in Cash
Reserve
$0.9M
1%
Increase in
Unrestricted Cash
$1.0M
1%
2020/21 BudgetCash Expenditure

24
2020-21 Income Statement
$’000 General
Fund
Water
Fund
Sewer
Fund
Consolidated
Result
Income from Continuing Operations
Rates & Annual Charges 26,733 2,435 5,691 34,859
User Charges & Fees 12,355 8,250 251 20,856
Interest & Investment Revenue 342 409 208 959
Other Revenues 2,185 39 990 3,214
Operating Grants & Contributions 13,155 88 84 13,326
Capital Grants & Contributions 16,068 2,593 18,661
Total Income from Continuing Operations 70,838 13,813 7,224 91,875
Expenses from Continuing Operations
Employee Costs 22,187 1,880 1,414 25,480
Borrowing Costs 989 313 - 1,302
Materials & Contracts 10,336 5,552 2,815 18,703
Depreciation & Amortisation 12,405 3,426 2,248 18,079
Other Expenses 10,310 671 952 11,933
Total Expenses from Continuing Operations 56,226 11,842 7,429 75,497
Net Operating Result 14,612 1,971 (205) 16,378
Net Operating Result before Capital Grants and
Contributions (1,456) (621) (205) (2,283)

25
2020-21 Balance Sheet
$’000 General
Fund
Water
Fund
Sewer
Fund
Consolidated
Result
ASSETS
Current Assets
Cash & Cash Equivalents 5,889 2,767 8,656
Investments 14,474 19,829 15,457 49,760
Receivables 8,958 2,423 974 12,355
Inventories 541 305 846
Other 401 401
Total Current Assets 30,264 22,252 19,503 72,068
Non-Current Assets
Receivables 329 329
Infrastructure, Property,
Plant & Equipment 604,088 179,561 107,266 890,915
Total Non-Current Assets 604,417 179,561 107,266 891,244
TOTAL ASSETS 634,680 201,813 126,769 963,262
LIABILITIES
Current Liabilities
Payables 6,727 9 6,736
Income received in advance 1,091 109 1,200
Borrowings 2,707 281 2,988
Provisions 8,409 8,409
Total Current Liabilities 18,934 399 0 19,333
Non-Current Liabilities
Borrowings 14,041 3,949 17,990
Provisions 3,588 3,588
Total Non-Current Liabilities 17,628 3,949 0 21,578
TOTAL LIABILITIES 36,563 4,348 40,911
Net Assets 598,118 197,464 126,769 922,351
EQUITY
Retained Earnings 584,843 191,205 122,534 898,582
Revaluation Reserves 13,275 6,259 4,235 23,769
Total Equity 598,118 197,464 126,769 922,351
26
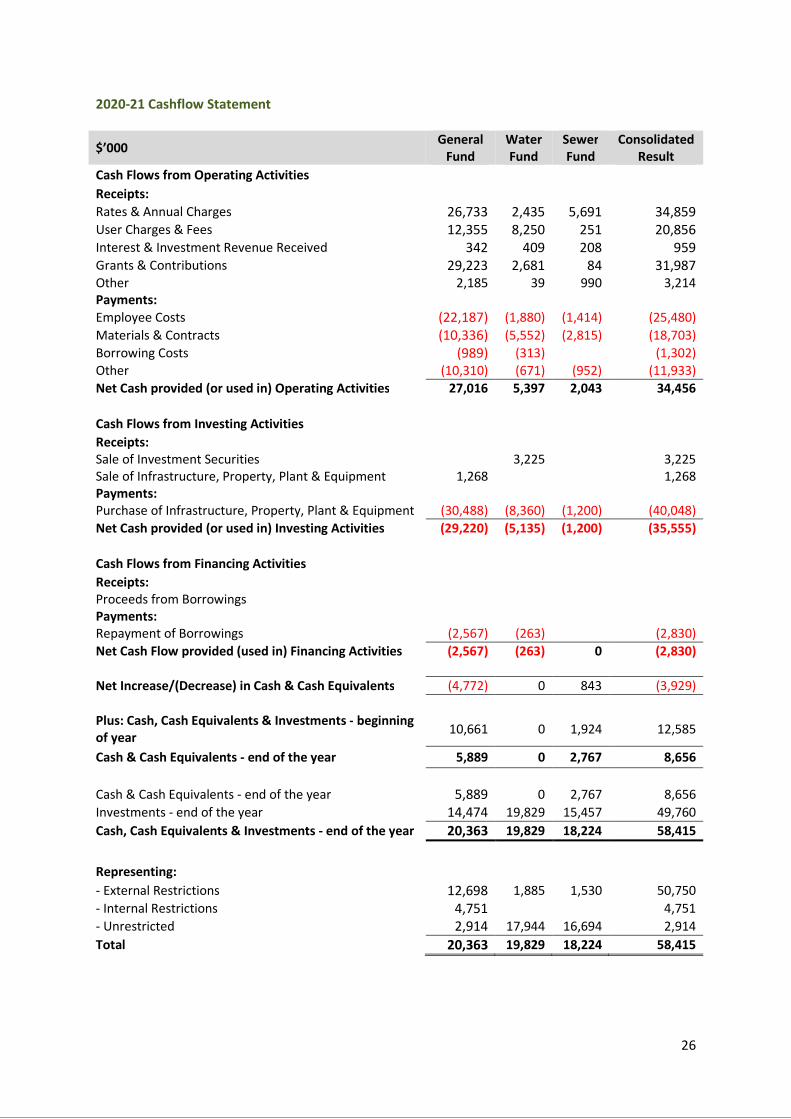
2020-21 Cashflow Statement
$’000 General
Fund
Water
Fund
Sewer
Fund
Consolidated
Result
Cash Flows from Operating Activities
Receipts:
Rates & Annual Charges 26,733 2,435 5,691 34,859
User Charges & Fees 12,355 8,250 251 20,856
Interest & Investment Revenue Received 342 409 208 959
Grants & Contributions 29,223 2,681 84 31,987
Other 2,185 39 990 3,214
Payments:
Employee Costs (22,187) (1,880) (1,414) (25,480)
Materials & Contracts (10,336) (5,552) (2,815) (18,703)
Borrowing Costs (989) (313) (1,302)
Other (10,310) (671) (952) (11,933)
Net Cash provided (or used in) Operating Activities 27,016 5,397 2,043 34,456
Cash Flows from Investing Activities
Receipts:
Sale of Investment Securities 3,225 3,225
Sale of Infrastructure, Property, Plant & Equipment 1,268 1,268
Payments:
Purchase of Infrastructure, Property, Plant & Equipment (30,488) (8,360) (1,200) (40,048)
Net Cash provided (or used in) Investing Activities (29,220) (5,135) (1,200) (35,555)
Cash Flows from Financing Activities
Receipts:
Proceeds from Borrowings
Payments:
Repayment of Borrowings (2,567) (263) (2,830)
Net Cash Flow provided (used in) Financing Activities (2,567) (263) 0 (2,830)
Net Increase/(Decrease) in Cash & Cash Equivalents (4,772) 0 843 (3,929)
Plus: Cash, Cash Equivalents & Investments - beginning
of year 10,661 0 1,924 12,585
Cash & Cash Equivalents - end of the year 5,889 0 2,767 8,656
Cash & Cash Equivalents - end of the year 5,889 0 2,767 8,656
Investments - end of the year 14,474 19,829 15,457 49,760
Cash, Cash Equivalents & Investments - end of the year 20,363 19,829 18,224 58,415
Representing:
- External Restrictions 12,698 1,885 1,530 50,750
- Internal Restrictions 4,751 4,751
- Unrestricted 2,914 17,944 16,694 2,914
Total 20,363 19,829 18,224 58,415

27
2020-21 Equity Statement
$’000 General
Fund
Water
Fund
Sewer
Fund
Consolidated
Result
Opening Balance 583,506 195,493 126,974 905,973
Net Operating Result for the Year 14,612 1,971 (205) 16,378
Closing Equity Balance 598,118 197,464 126,769 922,351
Capital Budget
Background
The original budget for the 2020-2021 capital program was developed by identifying critical works,
projects that are pre existing commitments and grant dependent projects. Using this criteria the
2020/21 capital program has reached $40 million, which is higher than prior year capital program
delivery.
There are a number of projects that were programmed to be completed in the 2019/20 financial
year that have been carried forward to the 2020/21 capital program due to the impact of drought,
fires and floods. These conditions have not only prevented works proceeding due to issues such as
lack of water but have also diverted resources to respond to disaster events.
Description Gross External Funding Council Funding
General Fund $30,488,104 $23,005,044 $7,483,060
Water Fund $8,360,000 $2,592,500 $5,767,500
Sewer Fund $1,200,000 $0 $1,200,000
Total $40,048,104 $25,597,544 $14,450,560
Further detail on the 2020/21 capital program is contained in Council’s 2020/21 Operational Plan.
28
Long Term Financial Plan
Introduction
The Long Term Financial Plan (LTFP) directly inks to Council’s Operational Plan and sets the
framework to provide cost effective services within available resources for the duration of the
forecast.
The IP&R framework requires Council to prepare a LTFP covering a period of at least ten years. The
LTFP is essential for being able to determine:
• The extent to which resources will be available to deliver outcomes identified in the
Community Strategic Plan and Delivery Program ;
• The ability of Council to meet financial sustainability targets over the term of the LTFP ; and
• The ability to evaluate and measure the impact of changes to service levels or the
introduction of new service levels.
The overall objective of Council’s LTFP is to maintain current service levels, identify a capital works
program that meets the asset renewal requirements contained in Council’s asset management plans
and achieve a financially sustainable position.
Based on the following assumptions, the LTFP represents Council’s estimates of projected ‘secure’
revenue within rate peg limits, the maintenance of existing services, infrastructure and facilities, and
the delivery of initiatives identified in the Operational Plan 2020-2021.
Assumptions
As with all forecasts, it must be acknowledged that things change over time and that long term
forecasts are useful as a guidance tool which can identify financial issues in advance and enable a
strategy or plan to be developed to deal with them. This LTFP has been prepared using a number of
assumptions, which are applicable from 2020-21 onwards.
The LTFP has been developed with the overriding assumption that Council will prioritise projects in
accordance with available funding and will continue to maintain its current service levels.
The LTFP is based on maintaining existing services at current levels of service. Service levels can
affect operating costs and income as well as asset maintenance costs. The LTFP demonstrates that
Council’s General Fund is not in a position to introduce additional unfunded services or increase
service levels above existing levels.
The LTFP also includes the following specific assumptions:
General Assumptions
Item Comment
Population
Growth
In line with NSW Government’s population forecasts, Council’s population is
currently estimated at 32,750 and this is projected to increase to 36,500 by
2031. These growth estimates have been incorporated into both revenues and
expenses.

29
Recurrent Revenue Assumptions
Item Comment
Rate Peg
The rate peg amount is closely related to local government CPI rates as
determined by IPART. The rate peg has been determined at 2% for 2021/22 and
IPART recommends use of 2.5% for financial modelling.
Special Rate
Variation (SRV)
The base scenario assumes no SRV funding and the remaining two scenarios
assume the following SRV options:
1. Council will apply for a permanent Special Rate Variation (SRV) of 18.5% plus
the 2.0% rate peg (total of 20.5%). This will replace the funding currently
provided by the temporary SRV and increase total rate revenue by $1.8
million per annum.
2. Council will apply for a permanent Special Rate Variation of 8.5% plus the
2.0% rate peg (total of 10.5%). This will replace the loss of the current
temporary SRV which is due to end in 2021.
Annual Charges –
Waste &
Drainage
Increased in line with estimated CPI increase of 2.5%.
There is an impact from reduction of the Waterfall Way landfill levy in line with
reduced loan repayments as follows:
2023/24 $600,000
2026/27 $300,000
2027/28 $1,100,000
While this doesn’t have an overall net impact on cash as the levy proceeds offset
the loan repayments it does negatively impact the operating result.
Annual & User
Charges – Water
& Sewer
The increase has been set to generate a sufficient level of funding for the water
and sewer capital program forecasts.
User Charges &
Fees – Non
Statutory
Increased in line with estimated CPI increase of 2.5% based on the assumption
that service levels will be maintained. Council is committed to all opportunities
to increase user fees where possible.
In 2020/21 a decrease in airport user fees and charges of around $825,000 has
been recognised due to COVID-19 shutdown provisions. This is assumed to
largely correct in 2021/22 as restrictions are eased and flight services resume.
User Charges &
Fees - Statutory Increases for these fees are not set by Council.
Interest &
Investment
Revenues
Recalculated based on forecast cash levels with an interest rate between 1%-2%
over the life of the forecast.
Other Revenues Increased in line with estimated CPI increase of 2.5%.
Operating Grants
& Contributions
Indexation has been applied to operating grants at 2.0%.
In 2021/22 a decrease in the Roads to Recovery grant of $715,000 has been
recognised as Council is currently receiving a temporary increase in the level of
funding as a result of drought funding.
Also in 2021/22 Council estimates Financial Assistance Grant funding will fall by
$300k due to the Tingha boundary adjustment and this has been removed from
both operating revenue and expenditure.

30
Recurrent Expenditure Assumptions
Item Comment
Employee Costs
Based on estimated award increases, increment increases and includes an
allowance for staffing numbers growth.
Movement in employee costs is determined through industry wide award
negotiations and market forces. Impacts affecting wages volatility include
internal and external factors, such as skills shortages, staff turnover, attraction
and retention of skilled and experienced staff, increases in superannuation,
award increase and changes in service levels.
Borrowing Costs Included as per loan borrowings schedule. New loans have only been assumed
for the Water Fund.
Materials &
Contracts
These costs generally increase in line with CPI; however a small growth
allowance has also been assumed.
The 2021/22 election is likely to increase these costs by at least $250,000 in
that year.
Depreciation
The 2019-20 depreciation rates for each class of assets are assumed to continue
over the life of the forecast.
In accordance with accounting standard requirements, all classes of assets will
continue to be revalued in the future, including a revaluation of transport
assets that is currently underway.
Other Expenses
These costs often increase above the level of CPI.
In 2021/22 an increase of $300,000 will occur in these costs for the increase in
the Emergency Services Levy passed onto councils by the NSW Government to
pay for increased workers compensation insurance.
Capital Assumptions
Item Comment
Capital Grants &
Contributions
An assumption is made that Council will continue to receive capital grants and
contributions from Federal and State sources, at a level that is consistent with
previous years.
Capital
Expenditure –
New Assets
Included as per the capital program. Ongoing new capital projects have been
assumed to be completed but beyond 2021/22 new capital spend consists of
projects at the airport, a minor amount of new footpaths and other structures
expenditure and a minor component of upgrade road works.
Capital
Expenditure –
Asset Renewal
Asset renewal projections are in accordance with the funding available under
each SRV scenario. The increase in funding from the SRV is applied to General
Fund asset renewal as follows:
• Maintain Services – additional $1.5 million in asset renewal funding
annually above decrease services (no SRV) scenario
• Improve Services – additional $3.3 million in asset renewal funding annually
above decrease services (no SRV) scenario

31
Item Comment
Loan Repayments
Repayments on the present loan are forecast in accordance with the
borrowings schedule.
New borrowings are assumed to be financed by 20 year loans at a current
indicative borrowing rate of 2.5%. Two new loans have been assumed in the
forecast for the Water Fund for the purpose of infrastructure funding.
The loan taken out for the landfill has a $4 million balloon payment due in the
2023-24 financial year. This has been assumed to be refinanced for a further 4
years at 4% to smooth out the cashflows required for the borrowing program.
Fixed Asset
Values
The value of fixed assets is based on the current value of PPE adjusted for the
forecast level of purchases and disposals.
Proceeds from
Asset Sales
Provision has been made for the trade in or disposal of plant and fleet in line
with the replacement program but no other asset sales have been assumed.

LTFP Assumptions
The following planning assumptions are constant in all financial modelling scenarios.
Assumptions Year 1
2021/22
Year 2
2022/23
Year 3
2023/24
Year 4
2024/25
Year 5
2025/26
Year 6
2026/27
Year 7
2027/28
Year 8
2028/29
Year 9
2029/30
Year 10
2030/31
Rate Peg 2.0% 2.5% 2.5% 2.5% 2.5% 2.5% 2.5% 2.5% 2.5% 2.5%
Growth Allowance 1.3% 1.3% 1.3% 1.3% 1.3% 1.3% 1.3% 1.3% 1.3% 1.3%
Annual Charges – Waste & Drainage 2.5% 2.5% 2.5% 2.5% 2.5% 2.5% 2.5% 2.5% 2.5% 2.5%
Growth Allowance 0.5% 0.5% 0.5% 0.5% 0.5% 0.5% 0.5% 0.5% 0.5% 0.5%
Annual Charges – Water & Sewer 4.5% 4.5% 4.5% 4.5% 4.5% 4.5% 4.5% 4.5% 4.5% 4.5%
Growth Allowance 0.5% 0.5% 0.5% 0.5% 0.5% 0.5% 0.5% 0.5% 0.5% 0.5%
User Charges & Fees – Non Statutory 2.5% 2.5% 2.5% 2.5% 2.5% 2.5% 2.5% 2.5% 2.5% 2.5%
Growth Allowance 1.3% 1.3% 1.3% 1.3% 1.3% 1.3% 1.3% 1.3% 1.3% 1.3%
User Charges & Fees – Statutory 2.0% 2.0% 2.0% 2.0% 2.0% 2.0% 2.0% 2.0% 2.0% 2.0%
Growth Allowance 1.3% 1.3% 1.3% 1.3% 1.3% 1.3% 1.3% 1.3% 1.3% 1.3%
User Charges – Water 5.0% 5.0% 5.0% 5.0% 5.0% 5.0% 5.0% 5.0% 5.0% 5.0%
Other Revenue 2.5% 2.5% 2.5% 2.5% 2.5% 2.5% 2.5% 2.5% 2.5% 2.5%
Operating Grants & Contributions 2.0% 2.0% 2.0% 2.0% 2.0% 2.0% 2.0% 2.0% 2.0% 2.0%
Employee Costs 2.5% 2.5% 2.5% 2.5% 2.5% 2.5% 2.5% 2.5% 2.5% 2.5%
Materials & Contracts 2.5% 2.5% 2.5% 2.5% 2.5% 2.5% 2.5% 2.5% 2.5% 2.5%
Growth Allowance 1.5% 1.5% 1.5% 1.5% 1.5% 1.5% 1.5% 1.5% 1.5% 1.5%
Other Expenses 2.0% 2.0% 2.0% 2.0% 2.0% 2.0% 2.0% 2.0% 2.0% 2.0%

Budgeted Financial Statements
Budgeted Income Statement
This statement outlines:
• All sources of Council’s income (revenue)
• All recurrent expenditure. These expenses relate to operations and do not include capital
expenditure although depreciation of assets is included.
The Net Operating Result for the year is a measure of Council’s financial performance. This figure is
determined by deducting total recurrent expenditure from total income.
The Net Operating Result before Capital Grants and Contributions therefore shows if the income
received is sufficient to pay for both operating expenses and asset renewal (as reflected in
depreciation costs). This result is considered the most relevant measure of financial sustainability as
it excludes income that can only be used for the acquisition of new assets.
Budgeted Balance Sheet
This statement outlines what Council owns (assets) and what it owes (liabilities) at a point in time.
Council’s net worth is determined by deducting total liabilities from total assets – the larger the net
equity, the stronger the financial position.
Budgeted Cashflow Statement
This statement summarises the actual flows of cash for a period and explains the change in the cash
balance held from the start of the period through to the end of the reporting period. The Cashflow
Statement shows the receipt and payment of all operating, investing and financing transactions, and
the impact of this on cash balances and the forecast level of unrestricted cash at the end of each
reporting period.

SRV SCENARIO: Decrease Services
LTFP Income Statement
$’000 Draft
Actual
Original
Budget Projected Years
2019/20 2020/21 2021/22 2022/23 2023/24 2024/25 2025/26 2026/27 2027/28 2028/29 2029/30 2030/31
Income from Continuing Operations
Revenue:
Rates & Annual Charges 33,409 34,859 34,654 36,005 36,811 38,256 39,759 41,023 41,541 43,193 44,912 46,701
User Charges & Fees 18,091 20,856 22,439 23,387 24,376 25,407 26,484 27,606 28,777 29,999 31,274 32,605
Interest & Investment Revenue 1,376 959 693 615 547 490 443 441 469 520 596 685
Other Revenues 3,658 3,214 3,295 3,377 3,462 3,548 3,637 3,728 3,821 3,916 4,014 4,115
Operating Grants & Contributions 16,979 13,326 11,013 11,233 11,458 11,687 11,920 12,159 12,402 12,650 12,903 13,161
Capital Grants & Contributions 23,025 18,661 12,269 4,026 3,160 3,998 4,064 3,181 3,034 4,531 2,971 2,265
Total Income 96,538 91,875 84,362 78,644 79,813 83,386 86,306 88,137 90,045 94,809 96,670 99,531
Expenses from Continuing Operations
Employee Costs 23,750 25,480 25,830 26,476 27,138 27,816 28,512 29,224 29,955 30,704 31,472 32,258
Borrowing Costs 2,000 1,302 1,146 1,153 1,044 893 744 606 505 436 368 319
Materials & Contracts 21,274 18,703 18,987 19,656 20,353 21,077 21,831 22,616 23,433 24,283 25,168 26,089
Depreciation & Amortisation 17,594 18,079 18,531 18,994 19,469 19,955 20,454 20,966 21,490 22,027 22,578 23,142
Other Expenses 8,231 11,933 11,749 11,998 12,253 12,512 12,778 13,049 13,325 13,608 13,897 14,192
Losses on Disposal of Assets 1,454
Revaluation/impairment IPPE 2,099
Total Expenses 76,402 75,497 76,243 78,277 80,256 82,254 84,319 86,460 88,708 91,058 93,482 96,001
Net Operating Result (20,310) 16,378 8,120 366 (443) 1,132 1,987 1,677 1,338 3,752 3,189 3,531
Net Operating Result before
Capital Grants and Contributions (2,889) (2,283) (4,149) (3,659) (3,603) (2,866) (2,077) (1,503) (1,697) (779) 218 1,266
General Fund Operating Result 177 (1,456) (3,490) (3,175) (3,380) (3,073) (2,754) (2,715) (3,510) (3,228) (2,913) (2,604)
Water Fund Operating Result (4,084) (621) (563) (499) (357) (67) 240 585 970 1,388 1,837 2,308
Sewer Fund Operating Result 1,018 (205) (95) 15 134 274 437 627 843 1,061 1,294 1,562
Consolidated Operating Result (2,889) (2,283) (4,149) (3,659) (3,603) (2,866) (2,077) (1,503) (1,697) (779) 218 1,266

35
LTFP Balance Sheet
$’000 Draft
Actual
Original
Budget
Projected Years
2019/20 2020/21 2021/22 2022/23 2023/24 2024/25 2025/26 2026/27 2027/28 2028/29 2029/30 2030/31
ASSETS
Current Assets
Cash & Cash Equivalents 20,856 16,928 14,516 14,678 14,916 14,190 15,413 19,038 20,075 27,021 33,241 42,810
Investments 51,295 48,069 44,045 37,031 31,431 27,038 22,274 22,253 22,253 22,253 22,253 22,253
Receivables 12,248 12,223 12,223 12,223 12,223 12,223 12,223 12,223 12,223 12,223 12,223 12,223
Inventories 1,027 1,027 1,027 1,027 1,027 1,027 1,027 1,027 1,027 1,027 1,027 1,027
Other 606 606 606 606 606 606 606 606 606 606 606 606
Non-current assets classified
as “held for sale” 1,359 680 680 680 680 680 680 680 680 680 680 680
Total Current Assets 87,391 79,532 73,096 66,245 60,882 55,763 52,222 55,826 56,863 63,810 70,029 79,598
Non-Current Assets
Receivables 312 337 337 337 337 337 337 337 337 337 337 337
Infrastructure, Property, Plant
& Equipment 860,175 881,277 898,615 906,393 908,041 911,147 913,664 909,161 908,049 903,551 899,373 892,655
Other 279 279 279 279 279 279 279 279 279 279 279 279
Total Non-Current Assets 860,487 881,894 899,232 907,009 908,657 911,764 914,280 909,777 908,665 904,168 899,990 893,271
TOTAL ASSETS 947,878 961,426 972,327 973,254 969,539 67,527 966,502 965,603 965,529 967,977 970,019 972,869
LIABILITIES
Current Liabilities
Payables 8,463 8,383 8,383 8,383 8,383 8,383 8,383 8,383 8,383 8,383 8,383 8,383
Income received in advance 7,245 7,519 7,519 7,519 7,519 7,519 7,519 7,519 7,519 7,519 7,519 7,519
Borrowings 2,831 2,988 3,440 3,272 3,144 3,012 2,576 1,412 1,303 1,147 680 689
Provisions 7,329 12,303 12,303 12,303 12,303 12,303 12,303 12,303 12,303 12,303 12,303 12,303
Total Current Liabilities 25,868 31,193 31,645 31,477 31,349 31,217 30,782 29,618 29,509 29,352 28,886 28,895
Non-Current Liabilities
Payables 253 59 59 59 59 59 59 59 59 59 59 59
Borrowings 20,946 17,959 20,289 21,017 17,873 14,861 12,285 10,873 9,569 8,422 7,742 7,053

36
$’000 Draft
Actual
Original
Budget
Projected Years
2019/20 2020/21 2021/22 2022/23 2023/24 2024/25 2025/26 2026/27 2027/28 2028/29 2029/30 2030/31
Provisions 23,987 19,013 19,013 19,013 19,013 19,013 19,013 19,013 19,013 19,013 19,013 19,013
Total Non-Current Liabilities 45,186 37,030 39,360 40,089 36,945 33,933 31,356 29,944 28,641 27,494 26,814 26,124
TOTAL LIABILITIES 71,054 68,224 71,006 71,566 68,294 65,150 62,138 59,562 58,150 56,846 55,699 55,019
Net Assets 876,824 893,202 901,322 901,688 901,245 902,377 904,364 906,042 907,379 911,131 914,320 917,850
EQUITY
Retained Earnings 845,741 862,119 870,239 870,605 870,162 871,294 873,281 874,959 876,296 880,048 883,237 886,767
Revaluation Reserves 31,083 31,083 31,083 31,083 31,083 31,083 31,083 31,083 31,083 31,083 31,083 31,083
Total Equity 876,824 893,202 901,322 901,688 901,245 902,377 904,364 906,042 907,379 911,131 914,320 917,850

37
LTFP Cashflow Statement
$’000 Draft
Actual
Original
Budget
Projected Years
2019/20 2020/21 2021/22 2022/23 2023/24 2024/25 2025/26 2026/27 2027/28 2028/29 2029/30 2030/31
Cash Flows from Operating
Activities
Receipts:
Rates & Annual Charges 33,429 34,859 34,654 36,005 36,811 38,256 39,759 41,023 41,541 43,193 44,912 46,701
User Charges & Fees 22,184 20,856 22,439 23,387 24,376 25,407 26,484 27,606 28,777 29,999 31,274 32,605
Interest & Investment
Revenue Received 1,944 959 693 615 547 490 443 441 469 520 596 685
Grants & Contributions 28,400 31,987 23,281 15,259 14,618 15,685 15,984 15,340 15,436 17,181 15,874 15,426
Other 852 3,488 3,295 3,377 3,462 3,548 3,637 3,728 3,821 3,916 4,014 4,115
Payments:
Employee Costs (23,001) (25,480) (25,830) (26,476) (27,138) (27,816) (28,512) (29,224) (29,955) (30,704) (31,472) (32,258)
Materials & Contracts (24,574) (18,977) (18,987) (19,656) (20,353) (21,077) (21,831) (22,616) (23,433) (24,283) (25,168) (26,089)
Borrowing Costs (2,350) (1,302) (1,146) (1,153) (1,044) (893) (744) (606) (505) (436) (368) (319)
Other (5,795) (11,933) (11,749) (11,998) (12,253) (12,512) (12,778) (13,049) (13,325) (13,608) (13,897) (14,192)
Net Cash provided (or used
in) Operating Activities 31,129 34,456 26,650 19,360 19,026 21,088 22,442 22,643 22,827 25,779 25,766 26,673
Cash Flows from Investing
Activities
Receipts:
Sale of Investment
Securities 79,000 3,226 4,025 7,014 5,600 4,392 4,765 20 - - - -
Sale of Infrastructure,
Property, Plant &
Equipment
2,870 1,268 1,228 1,205 1,367 1,203 1,202 1,197 1,215 1,157 1,177 1,236
Deferred Debtor Receipts 15
Payments:
Purchase of Investment
Securities (72,059)
Purchase of Infrastructure,
Property, Plant & (28,153) (40,048) (37,096) (27,977) (22,484) (24,265) (24,173) (17,659) (21,592) (18,686) (19,577) (17,660)

38
$’000 Draft
Actual
Original
Budget
Projected Years
2019/20 2020/21 2021/22 2022/23 2023/24 2024/25 2025/26 2026/27 2027/28 2028/29 2029/30 2030/31
Equipment
Net Cash provided (or used
in) Investing Activities (18,327) (35,555) (31,844) (19,758) (15,516) (18,669) (18,207) (16,442) (20,378) (17,529) (18,400) (16,423)
Cash Flows from Financing
Activities
Receipts:
Proceeds from Borrowings
& Advances - - 5,770 4,000 - - - - - - - -
Payments:
Repayment of Borrowings (2,986) (2,830) (2,988) (3,440) (3,272) (3,144) (3,012) (2,576) (1,412) (1,303) (1,147) (680)
Net Cash Flow provided
(used in) Financing
Activities
(2,986) (2,830) 2,782 560 (3,272) (3,144) (3,012) (2,576) (1,412) (1,303) (1,147) (680)
Net Increase/(Decrease) in
Cash & Cash Equivalents 9,816 (3,928) (2,412) 162 237 (726) 1,223 3,624 1,038 6,946 6,220 9,569
plus: Cash, Cash
Equivalents & Investments
- beginning of year
11,040 20,856 16,928 14,516 14,678 14,916 14,190 15,413 19,038 20,075 27,021 33,241
Cash & Cash Equivalents -
end of the year 20,856 16,928 14,516 14,678 14,916 14,190 15,413 19,038 20,075 27,021 33,241 42,810
Investments - end of the
year 51,295 48,069 44,045 37,031 31,431 27,038 22,274 22,253 22,253 22,253 22,253 22,253
Cash, Cash Equivalents &
Investments - end of the
year
72,151 64,997 58,560 51,709 46,346 41,228 37,687 41,291 42,328 49,274 55,494 65,063
Representing:
- External Restrictions 59,991 52,888 47,792 41,213 35,723 31,417 27,203 28,718 31,225 31,315 33,410 37,458
- Internal Restrictions 10,020 9,017 8,855 9,145 9,445 9,680 9,885 10,080 10,220 10,425 10,630 10,835
- Unrestricted 2,139 3,091 1,913 1,351 1,178 131 599 2,493 883 7,534 11,454 16,770
Total 72,151 64,997 58,560 51,709 46,346 41,228 37,687 41,291 42,328 49,274 55,494 65,063

39
Key Performance Indicators
Draft
Actual
Original
Budget
Projected Years
Bench-
mark
2019/20 2020/21 2021/22 2022/23 2023/24 2024/25 2025/26 2026/27 2027/28 2028/29 2029/30 2030/31
Operating
Performance
Ratio
>0%
General Fund 6.60% (2.66%) (6.59%) (5.81%) (6.05%) (5.33%) (4.63%) (4.44%) (5.66%) (5.04%) (4.40%) (3.81%)
Water Fund (41.80%) (5.53%) (4.87%) (4.12%) (2.82%) (0.50%) 1.73% 4.02% 6.35% 8.66% 10.91% 13.06%
Sewer Fund 14.15% (2.84%) (1.27%) 0.19% 1.64% 3.22% 4.92% 6.75% 8.67% 10.42% 12.15% 14.00%
Consolidated 0.90% (3.12%) (5.75%) (4.90%) (4.70%) (3.61%) (2.52%) (1.77%) (1.95%) (0.86%) 0.23% 1.30%
Own Source
Operating
Revenue
>60%
General Fund 54.12% 58.75% 69.73% 77.22% 77.50% 77.36% 77.59% 78.27% 78.38% 76.36% 78.49% 79.60%
Water Fund 64.75% 80.59% 70.12% 83.93% 88.75% 86.27% 86.79% 90.03% 90.45% 93.52% 93.80% 94.07%
Sewer Fund 91.20% 98.84% 98.87% 98.89% 98.91% 98.94% 98.96% 98.99% 99.01% 99.04% 99.06% 99.09%
Consolidated 58.56% 65.18% 72.40% 80.60% 81.69% 81.19% 81.48% 82.60% 82.86% 81.88% 83.58% 84.50%
Unrestricted
Current Ratio >1.5x Consolidated 2.64x 1.12x 1.05x 1.05x 1.07x 1.04x 1.08x 1.26x 1.19x 1.55x 1.80x 2.09x
Debt Service
Cover Ratio >2x
General Fund 4.06x 3.36x 2.83x 2.91x 3.39x 3.92x 4.57x 5.66x 13.73x 18.45x 26.79x 145.11x
Water Fund (1.11)x 5.41x 5.63x 3.69x 3.15x 3.44x 3.74x 4.57x 4.99x 5.44x 6.18x 7.72x
Sewer Fund 158.9x 102.14x 110.44x 118.83x 127.72x 137.76x 149.03x 161.7x 175.75x 189.98x 205.05x 221.97x
Consolidated 4.06x 4.12x 3.74x 3.57x 3.9x 4.43x 5.06x 6.27x 10.48x 12.32x 15.09x 24.26x
Cash Expense
Cover Ratio
(including
restricted cash)
>3
months
General Fund 6.72 6.39 6.01 5.89 5.87 5.58 5.75 6.15 5.90 7.29 7.84 8.99
Water Fund 142.45 29.55 25.85 19.44 15.52 11.53 6.91 6.80 7.16 8.23 9.46 9.85
Sewer Fund 57.61 43.46 36.33 28.23 20.78 17.54 15.15 17.71 20.28 17.97 20.46 25.29
Consolidated 14.75 12.89 8.71 7.08 5.89 4.96 4.00 3.92 3.89 3.80 3.71 3.63
Cash Expense
Cover Ratio
(unrestricted
cash)
>3
months Consolidated 0.59 0.79 0.49 0.34 0.29 0.03 0.14 0.58 0.21 1.71 2.54 3.64
Buildings &
Infrastructure
Renewals Ratio
>100%
General Fund 17.8% 60.2% 47.9% 42.7% 44.0% 54.3% 55.3% 52.9% 75.3% 40.7% 55.9% 41.4%
Water Fund 0.0% 125.7% 64.3% 133.5% 74.8% 142.9% 129.0% 50.8% 49.6% 48.4% 56.5% 70.3%
Sewer Fund 0.0% 44.3% 202.4% 237.7% 172.7% 122.6% 115.0% 66.9% 65.3% 136.5% 70.6% 49.9%
Consolidated 17.8% 72.6% 74.3% 91.8% 69.9% 84.3% 80.7% 54.5% 68.0% 56.5% 58.2% 49.2%

40
Draft
Actual
Original
Budget
Projected Years
Bench-
mark
2019/20 2020/21 2021/22 2022/23 2023/24 2024/25 2025/26 2026/27 2027/28 2028/29 2029/30 2030/31
Infrastructure
Backlog Ratio <2%
General Fund 2.12% 2.19% 2.41% 2.66% 2.91% 3.13% 3.35% 3.59% 3.72% 4.05% 4.31% 4.67%
Water Fund 0.91% 0.88% 1.02% 0.88% 0.99% 0.81% 0.68% 0.90% 1.13% 1.37% 1.58% 1.74%
Sewer Fund 2.29% 2.27% 1.80% 1.18% 0.87% 0.77% 0.70% 0.85% 1.00% 0.83% 0.96% 1.21%
Consolidated 1.87% 1.90% 2.01% 2.04% 2.18% 2.25% 2.33% 2.55% 2.71% 2.94% 3.16% 3.45%
Asset
Maintenance
Ratio
>100%
General Fund 84% 84% 84% 84% 84% 84% 84% 84% 84% 84% 84% 84%
Water Fund 98% 98% 98% 98% 98% 98% 98% 98% 98% 98% 98% 98%
Sewer Fund 101% 101% 101% 101% 101% 101% 101% 101% 101% 101% 101% 101%
Consolidated 89% 89% 89% 89% 89% 89% 89% 89% 89% 89% 89% 89%
Real Operating
Expenditure
per capita
N/A
General Fund $1,749 $1,673 $1,623 $1,597 $1,571 $1,547 $1,563 $1,552 $1,543 $1,534 $1,526 $1,518
Water Fund $430 $352 $349 $348 $345 $340 $342 $339 $337 $334 $331 $328
Sewer Fund $192 $221 $219 $216 $213 $210 $212 $211 $209 $208 $206 $205
Consolidated $2,370 $2,246 $2,191 $2,161 $2,129 $2,096 $2,118 $2,102 $2,088 $2,075 $2,063 $2,051

41
SRV SCENARIO: Maintain Services
LTFP Income Statement
$’000 Draft
Actual
Original
Budget Projected Years
2019/20 2020/21 2021/22 2022/23 2023/24 2024/25 2025/26 2026/27 2027/28 2028/29 2029/30 2030/31
Income from Continuing Operations
Revenue:
Rates & Annual Charges 33,409 34,859 36,122 37,529 38,393 39,898 41,463 42,792 43,378 45,099 46,890 48,755 User Charges & Fees 18,091 20,856 22,439 23,387 24,376 25,407 26,484 27,606 28,777 29,999 31,274 32,605
Interest & Investment Revenue 1,376 959 693 615 547 490 443 441 469 520 596 685
Other Revenues 3,658 3,214 3,295 3,377 3,462 3,548 3,637 3,728 3,821 3,916 4,014 4,115
Operating Grants & Contributions 16,979 13,326 11,013 11,233 11,458 11,687 11,920 12,159 12,402 12,650 12,903 13,161
Capital Grants & Contributions 23,025 18,661 12,269 4,026 3,160 3,998 4,064 3,181 3,034 4,531 2,971 2,265
Total Income 96,538 91,875 85,830 80,168 81,395 85,028 88,011 89,907 91,882 96,716 98,649 101,585
Expenses from Continuing Operations
Employee Costs 23,750 25,480 25,830 26,476 27,138 27,816 28,512 29,224 29,955 30,704 31,472 32,258
Borrowing Costs 2,000 1,302 1,146 1,153 1,044 893 744 606 505 436 368 319
Materials & Contracts 21,274 18,703 18,987 19,656 20,353 21,077 21,831 22,616 23,433 24,283 25,168 26,089
Depreciation & Amortisation 17,594 18,079 18,531 18,994 19,469 19,955 20,454 20,966 21,490 22,027 22,578 23,142
Other Expenses 8,231 11,933 11,749 11,998 12,253 12,512 12,778 13,049 13,325 13,608 13,897 14,192
Losses on Disposal of Assets 1,454
Revaluation/impairment IPPE 2,099
Total Expenses 76,402 75,497 76,243 78,277 80,256 82,254 84,319 86,460 88,708 91,058 93,482 96,001
Net Operating Result (20,310) 16,378 9,588 1,890 1,139 2,774 3,692 3,447 3,174 5,658 5,167 5,585
Net Operating Result before
Capital Grants and Contributions (2,889) (2,283) (2,681) (2,135) (2,021) (1,224) (372) 266 140 1,127 2,196 3,320
General Fund Operating Result 177 (1,456) (2,022) (1,651) (1,798) (1,431) (1,049) (946) (1,673) (1,321) (935) (550)
Water Fund Operating Result (4,084) (621) (563) (499) (357) (67) 240 585 970 1,388 1,837 2,308
Sewer Fund Operating Result 1,018 (205) (95) 15 134 274 437 627 843 1,061 1,294 1,562
Consolidated Operating Result (2,889) (2,283) (2,681) (2,135) (2,021) (1,224) (372) 266 140 1,127 2,196 3,320

42
LTFP Balance Sheet
$’000 Draft
Actual
Original
Budget
Projected Years
2019/20 2020/21 2021/22 2022/23 2023/24 2024/25 2025/26 2026/27 2027/28 2028/29 2029/30 2030/31
ASSETS
Current Assets
Cash & Cash Equivalents 20,856 16,928 14,484 14,671 14,990 14,407 15,834 19,728 21,102 28,454 35,153 45,276
Investments 51,295 48,069 44,045 37,031 31,431 27,038 22,274 22,253 22,253 22,253 22,253 22,253
Receivables 12,248 12,223 12,223 12,223 12,223 12,223 12,223 12,223 12,223 12,223 12,223 12,223
Inventories 1,027 1,027 1,027 1,027 1,027 1,027 1,027 1,027 1,027 1,027 1,027 1,027
Other 606 606 606 606 606 606 606 606 606 606 606 606
Non-current assets classified
as “held for sale” 1,359 680 680 680 680 680 680 680 680 680 680 680
Total Current Assets 87,391 79,532 73,064 66,237 60,956 55,980 52,643 56,516 57,890 65,243 71,941 82,064
Non-Current Assets
Receivables 312 337 337 337 337 337 337 337 337 337 337 337
Infrastructure, Property, Plant
& Equipment 860,175 881,277 900,115 909,393 912,541 917,147 921,164 918,161 918,549 915,551 912,873 907,655
Other 279 279 279 279 279 279 279 279 279 279 279 279
Total Non-Current Assets 860,487 881,894
900,732
910,009
913,157
917,764
921,780
918,777
919,165
916,168
913,490
908,271
TOTAL ASSETS 947,878 961,426 973,796 976,246 974,113 973,743 974,423 975,293 977,055 981,410 985,431 990,335
LIABILITIES
Current Liabilities
Payables 8,463 8,383 8,383 8,383 8,383 8,383 8,383 8,383 8,383 8,383 8,383 8,383
Income received in advance 7,245 7,519 7,519 7,519 7,519 7,519 7,519 7,519 7,519 7,519 7,519 7,519
Borrowings 2,831 2,988 3,440 3,272 3,144 3,012 2,576 1,412 1,303 1,147 680 689
Provisions 7,329 12,303 12,303 12,303 12,303 12,303 12,303 12,303 12,303 12,303 12,303 12,303
Total Current Liabilities 25,868 31,193 31,645 31,477 31,349 31,217 30,782 29,618 29,509 29,352 28,886 28,895
Non-Current Liabilities
Payables 253 59 59 59 59 59 59 59 59 59 59 59

43
$’000 Draft
Actual
Original
Budget
Projected Years
2019/20 2020/21 2021/22 2022/23 2023/24 2024/25 2025/26 2026/27 2027/28 2028/29 2029/30 2030/31
Borrowings 20,946 17,959 20,289 21,017 17,873 14,861 12,285 10,873 9,569 8,422 7,742 7,053
Provisions 23,987 19,013 19,013 19,013 19,013 19,013 19,013 19,013 19,013 19,013 19,013 19,013
Total Non-Current Liabilities 45,186 37,030 39,360 40,089 36,945 33,933 31,356 29,944 28,641 27,494 26,814 26,124
TOTAL LIABILITIES 71,054 68,224 71,006 71,566 68,294 65,150 62,138 59,562 58,150 56,846 55,699 55,019
Net Assets 876,824 893,202 902,790 904,680 905,819 908,593 912,285 915,732 918,906 924,564 929,731 935,316
EQUITY
Retained Earnings 845,741 862,119 871,707 873,597 874,736 877,510 881,202 884,649 887,823 893,481 898,648 904,233
Revaluation Reserves 31,083 31,083 31,083 31,083 31,083 31,083 31,083 31,083 31,083 31,083 31,083 31,083
Total Equity 876,824 893,202 902,790 904,680 905,819 908,593 912,285 915,732 918,906 924,564 929,731 935,316
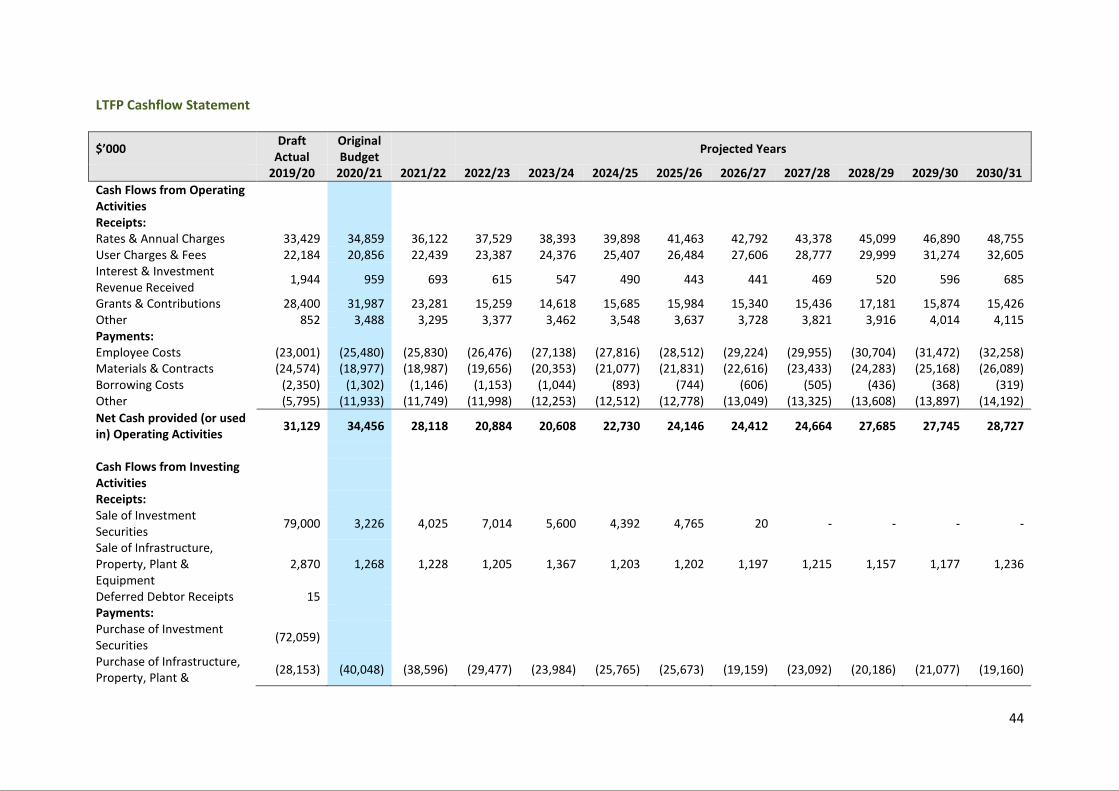
44
LTFP Cashflow Statement
$’000 Draft
Actual
Original
Budget
Projected Years
2019/20 2020/21 2021/22 2022/23 2023/24 2024/25 2025/26 2026/27 2027/28 2028/29 2029/30 2030/31
Cash Flows from Operating
Activities
Receipts:
Rates & Annual Charges 33,429 34,859 36,122 37,529 38,393 39,898 41,463 42,792 43,378 45,099 46,890 48,755
User Charges & Fees 22,184 20,856 22,439 23,387 24,376 25,407 26,484 27,606 28,777 29,999 31,274 32,605
Interest & Investment
Revenue Received 1,944 959 693 615 547 490 443 441 469 520 596 685
Grants & Contributions 28,400 31,987 23,281 15,259 14,618 15,685 15,984 15,340 15,436 17,181 15,874 15,426
Other 852 3,488 3,295 3,377 3,462 3,548 3,637 3,728 3,821 3,916 4,014 4,115
Payments:
Employee Costs (23,001) (25,480) (25,830) (26,476) (27,138) (27,816) (28,512) (29,224) (29,955) (30,704) (31,472) (32,258)
Materials & Contracts (24,574) (18,977) (18,987) (19,656) (20,353) (21,077) (21,831) (22,616) (23,433) (24,283) (25,168) (26,089)
Borrowing Costs (2,350) (1,302) (1,146) (1,153) (1,044) (893) (744) (606) (505) (436) (368) (319)
Other (5,795) (11,933) (11,749) (11,998) (12,253) (12,512) (12,778) (13,049) (13,325) (13,608) (13,897) (14,192)
Net Cash provided (or used
in) Operating Activities 31,129 34,456 28,118 20,884 20,608 22,730 24,146 24,412 24,664 27,685 27,745 28,727
Cash Flows from Investing
Activities
Receipts:
Sale of Investment
Securities 79,000 3,226 4,025 7,014 5,600 4,392 4,765 20 - - - -
Sale of Infrastructure,
Property, Plant &
Equipment
2,870 1,268 1,228 1,205 1,367 1,203 1,202 1,197 1,215 1,157 1,177 1,236
Deferred Debtor Receipts 15
Payments:
Purchase of Investment
Securities (72,059)
Purchase of Infrastructure,
Property, Plant & (28,153) (40,048) (38,596) (29,477) (23,984) (25,765) (25,673) (19,159) (23,092) (20,186) (21,077) (19,160)
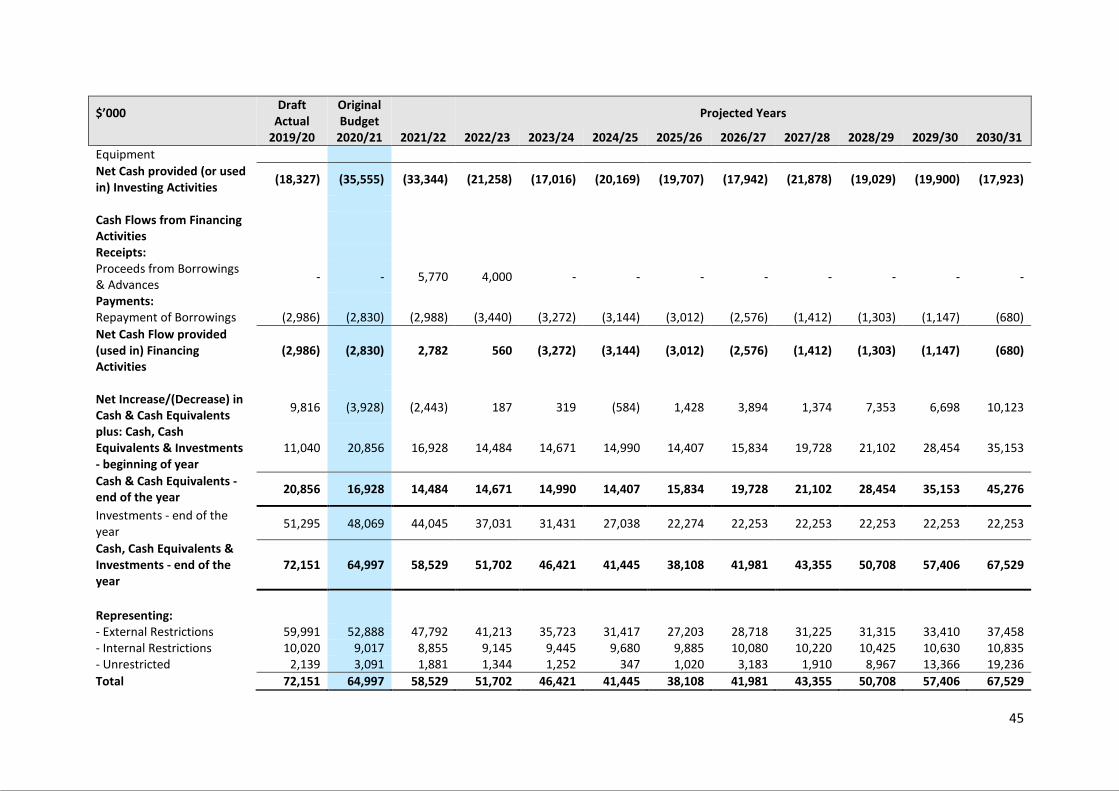
45
$’000 Draft
Actual
Original
Budget
Projected Years
2019/20 2020/21 2021/22 2022/23 2023/24 2024/25 2025/26 2026/27 2027/28 2028/29 2029/30 2030/31
Equipment
Net Cash provided (or used
in) Investing Activities (18,327) (35,555) (33,344) (21,258) (17,016) (20,169) (19,707) (17,942) (21,878) (19,029) (19,900) (17,923)
Cash Flows from Financing
Activities
Receipts:
Proceeds from Borrowings
& Advances - - 5,770 4,000 - - - - - - - -
Payments:
Repayment of Borrowings (2,986) (2,830) (2,988) (3,440) (3,272) (3,144) (3,012) (2,576) (1,412) (1,303) (1,147) (680)
Net Cash Flow provided
(used in) Financing
Activities
(2,986) (2,830) 2,782 560 (3,272) (3,144) (3,012) (2,576) (1,412) (1,303) (1,147) (680)
Net Increase/(Decrease) in
Cash & Cash Equivalents 9,816 (3,928) (2,443) 187 319 (584) 1,428 3,894 1,374 7,353 6,698 10,123
plus: Cash, Cash
Equivalents & Investments
- beginning of year
11,040 20,856 16,928 14,484 14,671 14,990 14,407 15,834 19,728 21,102 28,454 35,153
Cash & Cash Equivalents -
end of the year 20,856 16,928 14,484 14,671 14,990 14,407 15,834 19,728 21,102 28,454 35,153 45,276
Investments - end of the
year 51,295 48,069 44,045 37,031 31,431 27,038 22,274 22,253 22,253 22,253 22,253 22,253
Cash, Cash Equivalents &
Investments - end of the
year
72,151 64,997 58,529 51,702 46,421 41,445 38,108 41,981 43,355 50,708 57,406 67,529
Representing:
- External Restrictions 59,991 52,888 47,792 41,213 35,723 31,417 27,203 28,718 31,225 31,315 33,410 37,458
- Internal Restrictions 10,020 9,017 8,855 9,145 9,445 9,680 9,885 10,080 10,220 10,425 10,630 10,835
- Unrestricted 2,139 3,091 1,881 1,344 1,252 347 1,020 3,183 1,910 8,967 13,366 19,236
Total 72,151 64,997 58,529 51,702 46,421 41,445 38,108 41,981 43,355 50,708 57,406 67,529

46
Key Performance Indicators
Draft
Actual
Original
Budget
Projected Years
Bench-
mark
2019/20 2020/21 2021/22 2022/23 2023/24 2024/25 2025/26 2026/27 2027/28 2028/29 2029/30 2030/31
Operating
Performance
Ratio
>0%
General Fund 6.60% (2.66%) (3.71%) (2.94%) (3.13%) (2.41%) (1.71%) (1.50%) (2.62%) (2.00%) (1.37%) (0.78%)
Water Fund (41.80%) (5.53%) (4.87%) (4.12%) (2.82%) (0.50%) 1.73% 4.02% 6.35% 8.66% 10.91% 13.06%
Sewer Fund 14.15% (2.84%) (1.27%) 0.19% 1.64% 3.22% 4.92% 6.75% 8.67% 10.42% 12.15% 14.00%
Consolidated 0.90% (3.12%) (3.64%) (2.80%) (2.58%) (1.51%) (0.44%) 0.31% 0.16% 1.22% 2.30% 3.34%
Own Source
Operating
Revenue
>60%
General Fund 54.12% 58.75% 70.45% 77.82% 78.10% 77.97% 78.19% 78.87% 78.99% 77.01% 79.10% 80.19%
Water Fund 64.75% 80.59% 70.12% 83.93% 88.75% 86.27% 86.79% 90.03% 90.45% 93.52% 93.80% 94.07%
Sewer Fund 91.20% 98.84% 98.87% 98.89% 98.91% 98.94% 98.96% 98.99% 99.01% 99.04% 99.06% 99.09%
Consolidated 58.56% 65.18% 72.88% 80.97% 82.04% 81.55% 81.84% 82.94% 83.20% 82.24% 83.91% 84.81%
Unrestricted
Current Ratio >1.5x Consolidated 2.64x 1.12x 1.05x 1.05x 1.07x 1.05x 1.1x 1.29x 1.24x 1.63x 1.90x 2.22x
Debt Service
Cover Ratio >2x
General Fund 4.06x 3.36x 3.24x 3.33x 3.91x 4.5x 5.24x 6.51x 15.96x 21.39x 31x 167.55x
Water Fund (1.11)x 5.41x 5.63x 3.69x 3.15x 3.44x 3.74x 4.57x 4.99x 5.44x 6.18x 7.72x
Sewer Fund 158.9x 102.14x 110.44x 118.83x 127.72x 137.76x 149.03x 161.7x 175.75x 189.98x 205.05x 221.97x
Consolidated 4.06x 4.12x 4.09x 3.9x 4.26x 4.84x 5.52x 6.82x 11.43x 13.41x 16.38x 26.27x
Cash Expense
Cover Ratio
(including
restricted cash)
>3
months
General Fund 6.72 6.39 6.01 5.89 5.89 5.63 5.85 6.31 6.14 7.61 8.26 9.53
Water Fund 142.45 29.55 25.85 19.44 15.52 11.53 6.91 6.80 7.16 8.23 9.46 9.85
Sewer Fund 57.61 43.46 36.33 28.23 20.78 17.54 15.15 17.71 20.28 17.97 20.46 25.29
Consolidated 14.75 12.89 8.71 7.08 5.89 4.96 4.00 3.92 3.89 3.80 3.71 3.63
Cash Expense
Cover Ratio
(unrestricted
cash)
>3
months Consolidated 0.59 0.79 0.49 0.34 0.31 0.08 0.24 0.74 0.44 2.04 2.97 4.18
Buildings &
Infrastructure
Renewals Ratio
>100%
General Fund 17.8% 60.2% 63.1% 57.5% 58.5% 68.4% 69.1% 66.4% 88.4% 53.5% 68.4% 53.6%
Water Fund 0.0% 125.7% 64.3% 133.5% 74.8% 142.9% 129.0% 50.8% 49.6% 48.4% 56.5% 70.3%
Sewer Fund 0.0% 44.3% 202.4% 237.7% 172.7% 122.6% 115.0% 66.9% 65.3% 136.5% 70.6% 49.9%
Consolidated 17.8% 72.6% 83.9% 101.1% 79.0% 93.1% 89.3% 62.9% 76.3% 64.6% 66.1% 56.8%

47
Draft
Actual
Original
Budget
Projected Years
Bench-
mark
2019/20 2020/21 2021/22 2022/23 2023/24 2024/25 2025/26 2026/27 2027/28 2028/29 2029/30 2030/31
Infrastructure
Backlog Ratio <2%
General Fund 2.12% 2.19% 2.34% 2.53% 2.71% 2.86% 3.01% 3.18% 3.23% 3.48% 3.66% 3.92%
Water Fund 0.91% 0.88% 1.02% 0.88% 0.99% 0.81% 0.68% 0.90% 1.13% 1.37% 1.58% 1.74%
Sewer Fund 2.29% 2.27% 1.80% 1.18% 0.87% 0.77% 0.70% 0.85% 1.00% 0.83% 0.96% 1.21%
Consolidated 1.87% 1.90% 1.97% 1.97% 2.06% 2.09% 2.13% 2.31% 2.42% 2.60% 2.78% 3.01%
Asset
Maintenance
Ratio
>100%
General Fund 84% 84% 84% 84% 84% 84% 84% 84% 84% 84% 84% 84%
Water Fund 98% 98% 98% 98% 98% 98% 98% 98% 98% 98% 98% 98%
Sewer Fund 101% 101% 101% 101% 101% 101% 101% 101% 101% 101% 101% 101%
Consolidated 89% 89% 89% 89% 89% 89% 89% 89% 89% 89% 89% 89%
Real Operating
Expenditure
per capita
N/A
General Fund $1,749 $1,673 $1,623 $1,597 $1,571 $1,547 $1,563 $1,552 $1,543 $1,534 $1,526 $1,518
Water Fund $430 $352 $349 $348 $345 $340 $342 $339 $337 $334 $331 $328
Sewer Fund $192 $221 $219 $216 $213 $210 $212 $211 $209 $208 $206 $205
Consolidated $2,370 $2,246 $2,191 $2,161 $2,129 $2,096 $2,118 $2,102 $2,088 $2,075 $2,063 $2,051

48
SRV SCENARIO: Improve Services
LTFP Income Statement
$’000 Draft
Actual
Original
Budget Projected Years
2019/20 2020/21 2021/22 2022/23 2023/24 2024/25 2025/26 2026/27 2027/28 2028/29 2029/30 2030/31
Income from Continuing Operations
Revenue:
Rates & Annual Charges 33,409 34,859 37,972 39,449 40,386 41,966 43,610 45,021 45,691 47,500 49,383 51,342
User Charges & Fees 18,091 20,856 22,439 23,387 24,376 25,407 26,484 27,606 28,777 29,999 31,274 32,605
Interest & Investment Revenue 1,376 959 693 615 547 490 443 441 469 520 596 685
Other Revenues 3,658 3,214 3,295 3,377 3,462 3,548 3,637 3,728 3,821 3,916 4,014 4,115
Operating Grants & Contributions 16,979 13,326 11,013 11,233 11,458 11,687 11,920 12,159 12,402 12,650 12,903 13,161
Capital Grants & Contributions 23,025 18,661 12,269 4,026 3,160 3,998 4,064 3,181 3,034 4,531 2,971 2,265
Total Income 96,538 91,875 87,680 82,087 83,388 87,097 90,158 92,135 94,195 99,117 101,142 104,172
Expenses from Continuing Operations
Employee Costs 23,750 25,480 25,830 26,476 27,138 27,816 28,512 29,224 29,955 30,704 31,472 32,258
Borrowing Costs 2,000 1,302 1,146 1,153 1,044 893 744 606 505 436 368 319
Materials & Contracts 21,274 18,703 18,987 19,656 20,353 21,077 21,831 22,616 23,433 24,283 25,168 26,089
Depreciation & Amortisation 17,594 18,079 18,531 18,994 19,469 19,955 20,454 20,966 21,490 22,027 22,578 23,142
Other Expenses 8,231 11,933 11,749 11,998 12,253 12,512 12,778 13,049 13,325 13,608 13,897 14,192
Losses on Disposal of Assets 1,454
Revaluation/impairment IPPE 2,099
Total Expenses 76,402 75,497 76,243 78,277 80,256 82,254 84,319 86,460 88,708 91,058 93,482 96,001
Net Operating Result (20,310) 16,378 11,437 3,810 3,132 4,843 5,839 5,675 5,488 8,059 7,660 8,172
Net Operating Result before
Capital Grants and Contributions (2,889) (2,283) (831) (215) (28) 844 1,775 2,495 2,453 3,528 4,689 5,907
General Fund Operating Result 177 (1,456) (172) 269 195 637 1,098 1,283 640 1,080 1,558 2,037
Water Fund Operating Result (4,084) (621) (563) (499) (357) (67) 240 585 970 1,388 1,837 2,308
Sewer Fund Operating Result 1,018 (205) (95) 15 134 274 437 627 843 1,061 1,294 1,562
Consolidated Operating Result (2,889) (2,283) (831) (215) (28) 844 1,775 2,495 2,453 3,528 4,689 5,907
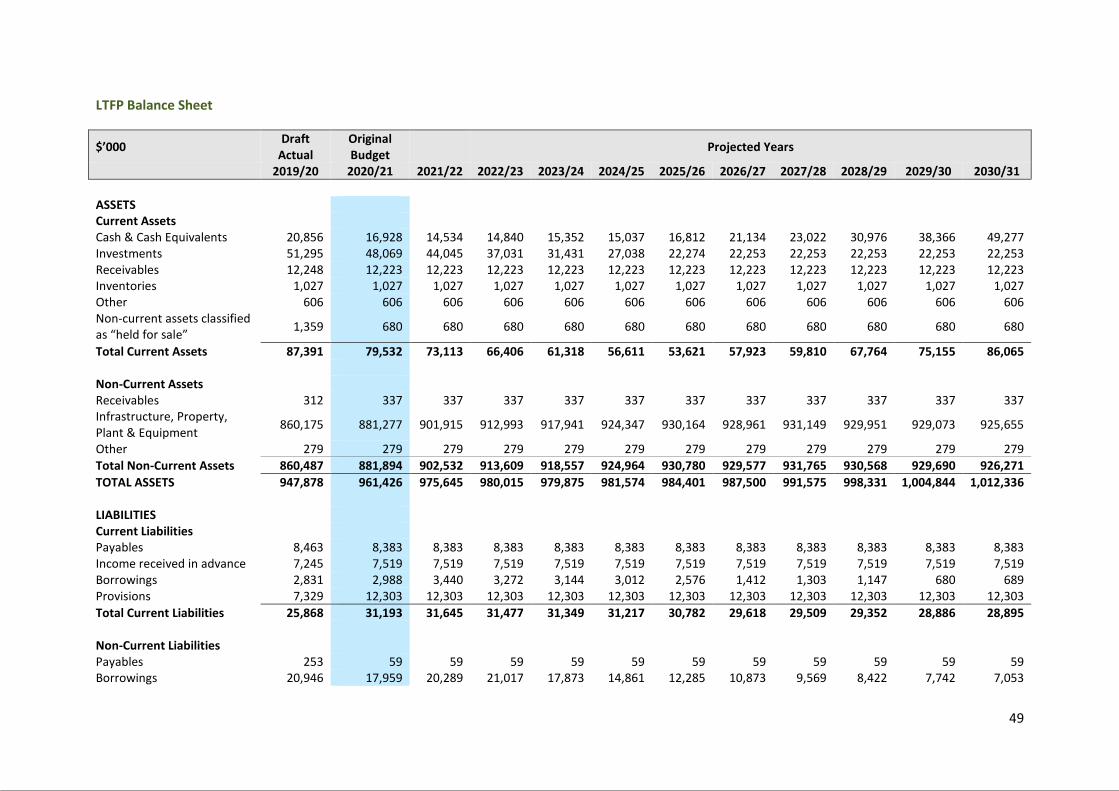
49
LTFP Balance Sheet
$’000 Draft
Actual
Original
Budget
Projected Years
2019/20 2020/21 2021/22 2022/23 2023/24 2024/25 2025/26 2026/27 2027/28 2028/29 2029/30 2030/31
ASSETS
Current Assets
Cash & Cash Equivalents 20,856 16,928 14,534 14,840 15,352 15,037 16,812 21,134 23,022 30,976 38,366 49,277
Investments 51,295 48,069 44,045 37,031 31,431 27,038 22,274 22,253 22,253 22,253 22,253 22,253
Receivables 12,248 12,223 12,223 12,223 12,223 12,223 12,223 12,223 12,223 12,223 12,223 12,223
Inventories 1,027 1,027 1,027 1,027 1,027 1,027 1,027 1,027 1,027 1,027 1,027 1,027
Other 606 606 606 606 606 606 606 606 606 606 606 606
Non-current assets classified
as “held for sale” 1,359 680 680 680 680 680 680 680 680 680 680 680
Total Current Assets 87,391 79,532 73,113 66,406 61,318 56,611 53,621 57,923 59,810 67,764 75,155 86,065
Non-Current Assets
Receivables 312 337 337 337 337 337 337 337 337 337 337 337
Infrastructure, Property,
Plant & Equipment 860,175 881,277 901,915 912,993 917,941 924,347 930,164 928,961 931,149 929,951 929,073 925,655
Other 279 279 279 279 279 279 279 279 279 279 279 279
Total Non-Current Assets 860,487 881,894 902,532 913,609 918,557 924,964 930,780 929,577 931,765 930,568 929,690 926,271
TOTAL ASSETS 947,878 961,426 975,645 980,015 979,875 981,574 984,401 987,500 991,575 998,331 1,004,844 1,012,336
LIABILITIES
Current Liabilities
Payables 8,463 8,383 8,383 8,383 8,383 8,383 8,383 8,383 8,383 8,383 8,383 8,383
Income received in advance 7,245 7,519 7,519 7,519 7,519 7,519 7,519 7,519 7,519 7,519 7,519 7,519
Borrowings 2,831 2,988 3,440 3,272 3,144 3,012 2,576 1,412 1,303 1,147 680 689
Provisions 7,329 12,303 12,303 12,303 12,303 12,303 12,303 12,303 12,303 12,303 12,303 12,303
Total Current Liabilities 25,868 31,193 31,645 31,477 31,349 31,217 30,782 29,618 29,509 29,352 28,886 28,895
Non-Current Liabilities
Payables 253 59 59 59 59 59 59 59 59 59 59 59
Borrowings 20,946 17,959 20,289 21,017 17,873 14,861 12,285 10,873 9,569 8,422 7,742 7,053
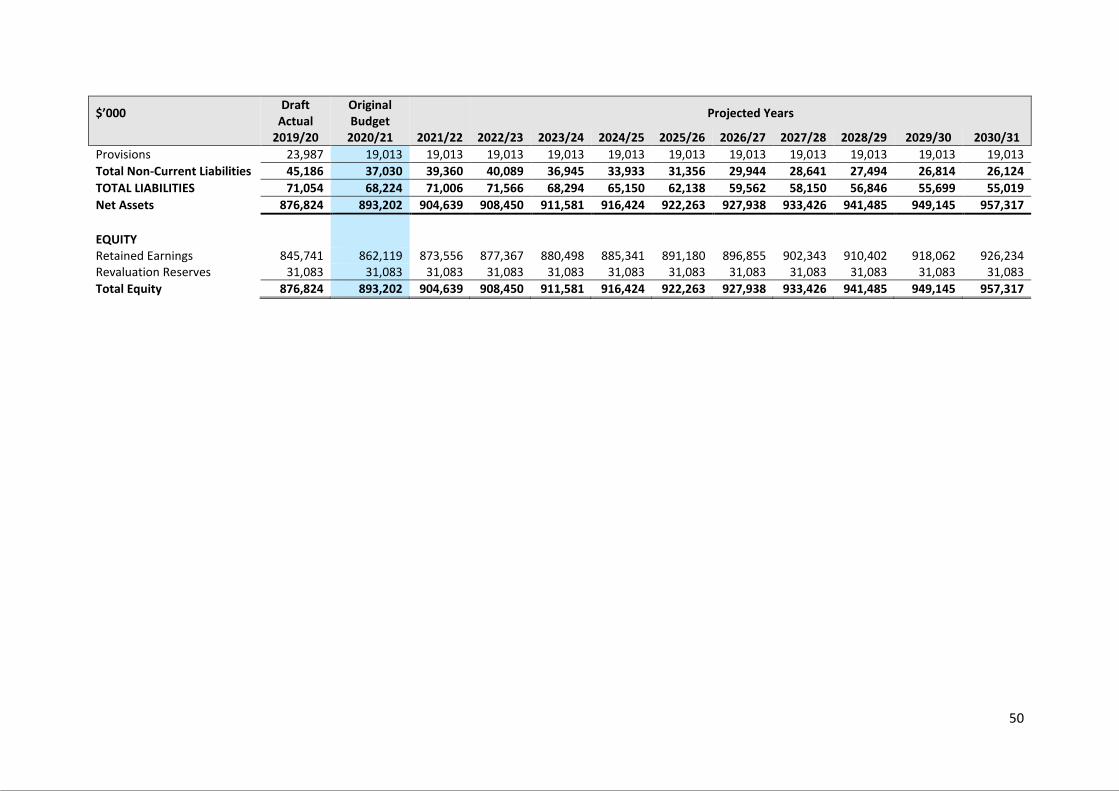
50
$’000 Draft
Actual
Original
Budget
Projected Years
2019/20 2020/21 2021/22 2022/23 2023/24 2024/25 2025/26 2026/27 2027/28 2028/29 2029/30 2030/31
Provisions 23,987 19,013 19,013 19,013 19,013 19,013 19,013 19,013 19,013 19,013 19,013 19,013
Total Non-Current Liabilities 45,186 37,030 39,360 40,089 36,945 33,933 31,356 29,944 28,641 27,494 26,814 26,124
TOTAL LIABILITIES 71,054 68,224 71,006 71,566 68,294 65,150 62,138 59,562 58,150 56,846 55,699 55,019
Net Assets 876,824 893,202 904,639 908,450 911,581 916,424 922,263 927,938 933,426 941,485 949,145 957,317
EQUITY
Retained Earnings 845,741 862,119 873,556 877,367 880,498 885,341 891,180 896,855 902,343 910,402 918,062 926,234
Revaluation Reserves 31,083 31,083 31,083 31,083 31,083 31,083 31,083 31,083 31,083 31,083 31,083 31,083
Total Equity 876,824 893,202 904,639 908,450 911,581 916,424 922,263 927,938 933,426 941,485 949,145 957,317

51
LTFP Cashflow Statement
$’000 Draft
Actual
Original
Budget
Projected Years
2019/20 2020/21 2021/22 2022/23 2023/24 2024/25 2025/26 2026/27 2027/28 2028/29 2029/30 2030/31
Cash Flows from Operating
Activities
Receipts:
Rates & Annual Charges 33,429 34,859 37,972 39,449 40,386 41,966 43,610 45,021 45,691 47,500 49,383 51,342
User Charges & Fees 22,184 20,856 22,439 23,387 24,376 25,407 26,484 27,606 28,777 29,999 31,274 32,605
Interest & Investment
Revenue Received 1,944 959 693 615 547 490 443 441 469 520 596 685
Grants & Contributions 28,400 31,987 23,281 15,259 14,618 15,685 15,984 15,340 15,436 17,181 15,874 15,426
Other 852 3,488 3,295 3,377 3,462 3,548 3,637 3,728 3,821 3,916 4,014 4,115
Payments:
Employee Costs (23,001) (25,480) (25,830) (26,476) (27,138) (27,816) (28,512) (29,224) (29,955) (30,704) (31,472) (32,258)
Materials & Contracts (24,574) (18,977) (18,987) (19,656) (20,353) (21,077) (21,831) (22,616) (23,433) (24,283) (25,168) (26,089)
Borrowing Costs (2,350) (1,302) (1,146) (1,153) (1,044) (893) (744) (606) (505) (436) (368) (319)
Other (5,795) (11,933) (11,749) (11,998) (12,253) (12,512) (12,778) (13,049) (13,325) (13,608) (13,897) (14,192)
Net Cash provided (or used
in) Operating Activities 31,129 34,456 29,968 22,804 22,600 24,798 26,293 26,641 26,977 30,087 30,238 31,314
Cash Flows from Investing
Activities
Receipts:
Sale of Investment
Securities 79,000 3,226 4,025 7,014 5,600 4,392 4,765 20 - - - -
Sale of Infrastructure,
Property, Plant &
Equipment
2,870 1,268 1,228 1,205 1,367 1,203 1,202 1,197 1,215 1,157 1,177 1,236
Deferred Debtor Receipts 15
Payments:
Purchase of Investment
Securities (72,059)
Purchase of Infrastructure,
Property, Plant & (28,153) (40,048) (40,396) (31,277) (25,784) (27,565) (27,473) (20,959) (24,892) (21,986) (22,877) (20,960)
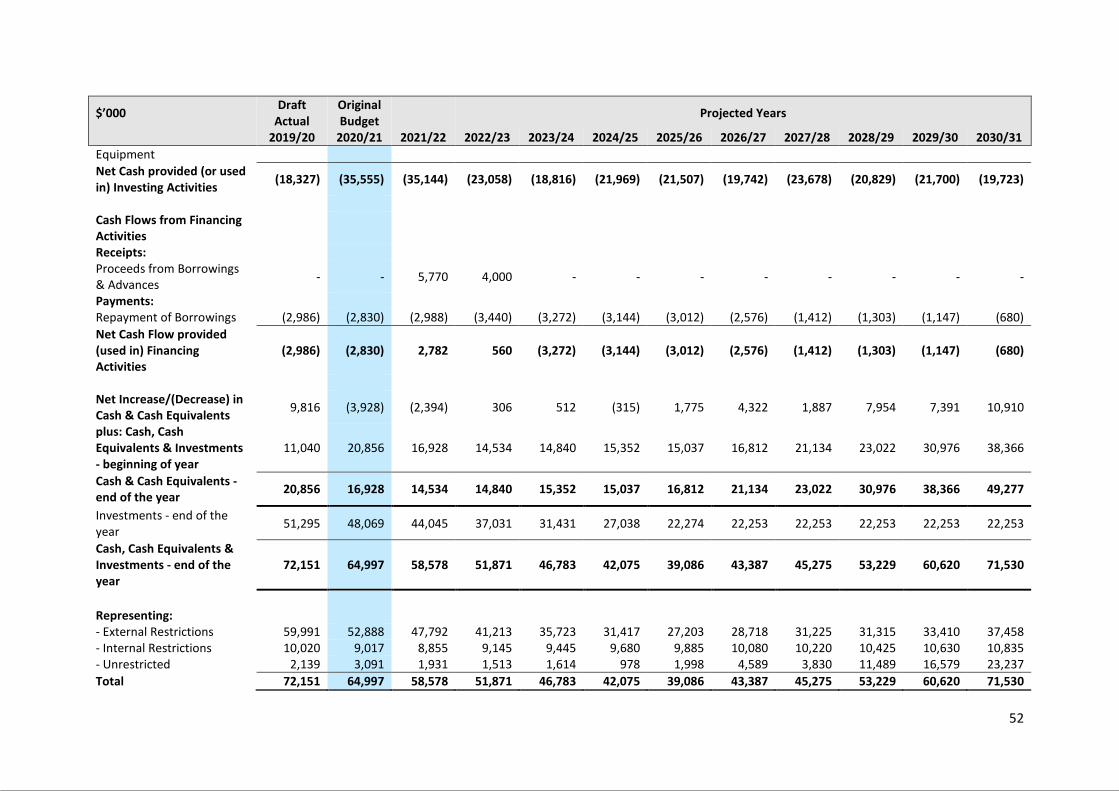
52
$’000 Draft
Actual
Original
Budget
Projected Years
2019/20 2020/21 2021/22 2022/23 2023/24 2024/25 2025/26 2026/27 2027/28 2028/29 2029/30 2030/31
Equipment
Net Cash provided (or used
in) Investing Activities (18,327) (35,555) (35,144) (23,058) (18,816) (21,969) (21,507) (19,742) (23,678) (20,829) (21,700) (19,723)
Cash Flows from Financing
Activities
Receipts:
Proceeds from Borrowings
& Advances - - 5,770 4,000 - - - - - - - -
Payments:
Repayment of Borrowings (2,986) (2,830) (2,988) (3,440) (3,272) (3,144) (3,012) (2,576) (1,412) (1,303) (1,147) (680)
Net Cash Flow provided
(used in) Financing
Activities
(2,986) (2,830) 2,782 560 (3,272) (3,144) (3,012) (2,576) (1,412) (1,303) (1,147) (680)
Net Increase/(Decrease) in
Cash & Cash Equivalents 9,816 (3,928) (2,394) 306 512 (315) 1,775 4,322 1,887 7,954 7,391 10,910
plus: Cash, Cash
Equivalents & Investments
- beginning of year
11,040 20,856 16,928 14,534 14,840 15,352 15,037 16,812 21,134 23,022 30,976 38,366
Cash & Cash Equivalents -
end of the year 20,856 16,928 14,534 14,840 15,352 15,037 16,812 21,134 23,022 30,976 38,366 49,277
Investments - end of the
year 51,295 48,069 44,045 37,031 31,431 27,038 22,274 22,253 22,253 22,253 22,253 22,253
Cash, Cash Equivalents &
Investments - end of the
year
72,151 64,997 58,578 51,871 46,783 42,075 39,086 43,387 45,275 53,229 60,620 71,530
Representing:
- External Restrictions 59,991 52,888 47,792 41,213 35,723 31,417 27,203 28,718 31,225 31,315 33,410 37,458
- Internal Restrictions 10,020 9,017 8,855 9,145 9,445 9,680 9,885 10,080 10,220 10,425 10,630 10,835
- Unrestricted 2,139 3,091 1,931 1,513 1,614 978 1,998 4,589 3,830 11,489 16,579 23,237
Total 72,151 64,997 58,578 51,871 46,783 42,075 39,086 43,387 45,275 53,229 60,620 71,530

53
Key Performance Indicators
Draft
Actual
Original
Budget
Projected Years
Bench-
mark
2019/20 2020/21 2021/22 2022/23 2023/24 2024/25 2025/26 2026/27 2027/28 2028/29 2029/30 2030/31
Operating
Performance
Ratio
>0%
General Fund 6.60% (2.66%) (0.31%) 0.46% 0.33% 1.04% 1.73% 1.97% 0.97% 1.58% 2.20% 2.79%
Water Fund (41.80%) (5.53%) (4.87%) (4.12%) (2.82%) (0.50%) 1.73% 4.02% 6.35% 8.66% 10.91% 13.06%
Sewer Fund 14.15% (2.84%) (1.27%) 0.19% 1.64% 3.22% 4.92% 6.75% 8.67% 10.42% 12.15% 14.00%
Consolidated 0.90% (3.12%) (1.10%) (0.28%) (0.04%) 1.02% 2.06% 2.80% 2.69% 3.73% 4.78% 5.80%
Own Source
Operating
Revenue
>60%
General Fund 54.12% 58.75% 71.30% 78.53% 78.82% 78.69% 78.91% 79.57% 79.71% 77.78% 79.81% 80.88%
Water Fund 64.75% 80.59% 70.12% 83.93% 88.75% 86.27% 86.79% 90.03% 90.45% 93.52% 93.80% 94.07%
Sewer Fund 91.20% 98.84% 98.87% 98.89% 98.91% 98.94% 98.96% 98.99% 99.01% 99.04% 99.06% 99.09%
Consolidated 58.56% 65.18% 73.45% 81.41% 82.47% 81.99% 82.27% 83.35% 83.61% 82.67% 84.31% 85.19%
Unrestricted
Current Ratio >1.5x Consolidated 2.64x 1.12x 1.05x 1.06x 1.09x 1.08x 1.15x 1.36x 1.34x 1.76x 2.07x 2.43x
Debt Service
Cover Ratio >2x
General Fund 4.06x 3.36x 3.76x 3.86x 4.55x 5.24x 6.09x 7.58x 18.76x 25.1x 36.3x 195.81x
Water Fund (1.11)x 5.41x 5.63x 3.69x 3.15x 3.44x 3.74x 4.57x 4.99x 5.44x 6.18x 7.72x
Sewer Fund 158.9x 102.14x 110.44x 118.83x 127.72x 137.76x 149.03x 161.7x 175.75x 189.98x 205.05x 221.97x
Consolidated 4.06x 4.12x 4.54x 4.32x 4.72x 5.35x 6.08x 7.52x 12.62x 14.77x 18.01x 28.81x
Cash Expense
Cover Ratio
(including
restricted cash)
>3
months
General Fund 6.72 6.39 6.02 5.94 5.98 5.78 6.09 6.64 6.59 8.19 8.98 10.40
Water Fund 142.45 29.55 25.85 19.44 15.52 11.53 6.91 6.80 7.16 8.23 9.46 9.85
Sewer Fund 57.61 43.46 36.33 28.23 20.78 17.54 15.15 17.71 20.28 17.97 20.46 25.29
Consolidated 14.75 12.89 8.71 7.08 5.89 4.96 4.00 3.92 3.89 3.80 3.71 3.63
Cash Expense
Cover Ratio
(unrestricted
cash)
>3
months Consolidated 0.59 0.79 0.50 0.38 0.40 0.24 0.47 1.07 0.89 2.61 3.68 5.05
Buildings &
Infrastructure
Renewals Ratio
>100%
General Fund 17.8% 60.2% 81.3% 75.3% 75.9% 85.4% 85.6% 82.5% 104.2% 68.9% 83.4% 68.2%
Water Fund 0.0% 125.7% 64.3% 133.5% 74.8% 142.9% 129.0% 50.8% 49.6% 48.4% 56.5% 70.3%
Sewer Fund 0.0% 44.3% 202.4% 237.7% 172.7% 122.6% 115.0% 66.9% 65.3% 136.5% 70.6% 49.9%
Consolidated 17.8% 72.6% 95.3% 112.3% 89.9% 103.8% 99.7% 73.1% 86.2% 74.2% 75.5% 66.0%

54
Draft
Actual
Original
Budget
Projected Years
Bench-
mark
2019/20 2020/21 2021/22 2022/23 2023/24 2024/25 2025/26 2026/27 2027/28 2028/29 2029/30 2030/31
Infrastructure
Backlog Ratio <2%
General Fund 2.12% 2.19% 2.27% 2.37% 2.48% 2.55% 2.61% 2.70% 2.68% 2.83% 2.92% 3.09%
Water Fund 0.91% 0.88% 1.02% 0.88% 0.99% 0.81% 0.68% 0.90% 1.13% 1.37% 1.58% 1.74%
Sewer Fund 2.29% 2.27% 1.80% 1.18% 0.87% 0.77% 0.70% 0.85% 1.00% 0.83% 0.96% 1.21%
Consolidated 1.87% 1.90% 1.92% 1.87% 1.91% 1.90% 1.90% 2.02% 2.08% 2.21% 2.33% 2.51%
Asset
Maintenance
Ratio
>100%
General Fund 84% 84% 84% 84% 84% 84% 84% 84% 84% 84% 84% 84%
Water Fund 98% 98% 98% 98% 98% 98% 98% 98% 98% 98% 98% 98%
Sewer Fund 101% 101% 101% 101% 101% 101% 101% 101% 101% 101% 101% 101%
Consolidated 89% 89% 89% 89% 89% 89% 89% 89% 89% 89% 89% 89%
Real Operating
Expenditure
per capita
N/A
General Fund $1,749 $1,673 $1,623 $1,597 $1,571 $1,547 $1,563 $1,552 $1,543 $1,534 $1,526 $1,518
Water Fund $430 $352 $349 $348 $345 $340 $342 $339 $337 $334 $331 $328
Sewer Fund $192 $221 $219 $216 $213 $210 $212 $211 $209 $208 $206 $205 Consolidated $2,370 $2,246 $2,191 $2,161 $2,129 $2,096 $2,118 $2,102 $2,088 $2,075 $2,063 $2,051

Risk and Sensitivity Analysis
Introduction
Council has undertaken a basic sensitivity analysis to determine factors likely to be sensitive to
variables and known major risks. These are listed and described below.
Temporary Special Rate Variation (SRV)
The temporary SRV in place for the former Armidale Dumaresq Council will expire 30 June 2021. The
impact of this SRV expiring without an alternative source of funding available would be significant as
rate income would need to reduce by around $1.5m recurrently.
This would have a significant impact on the General Fund and would immediately impact the level
unrestricted cash available as well as result in an operating deficit of over $3 million. Without a
significant change in service levels, the General Fund would completely run out of unrestricted cash
within 2 years if this scenario eventuates.
Financial Assistance Grants
The NSW Government has advised it is currently reviewing the grant methodology in line with NSW
policy to direct the general purpose component of the grant to councils with greatest relative need.
As Council is forecast to receive around $6 million in financial assistance grants, changes to the
allocation of these grants or a change in government policy that affects the value and timing of when
these grants are paid would have a significant impact.
If, for example, Council experienced a 10% reduction in the level of these grants then it would
immediately result in an operating deficit of over $600,000 and would also impact unrestricted cash.
Unexpected Events
While a range of possible scenarios can be modelled, Council’s largest risk is from the impact of
unexpected events, particularly where they have a financial impact within the year they are
identified. Such risks included:
• Project cost overruns due to unforeseen factors;
• Changes to government funding policies (e.g. removal of advance payment of financial
assistance grants or reduction in grant funding sources);
• Severe weather events (not declared disaster events) causing significant damage to road
infrastructure (e.g. landslips, blocked stormwater drains, potholes);
• Unexpected shifting of costs from other levels of government; and
• Downturn in the economy resulting in lower revenues from user charges and fees (e.g. landfill
fees and development approval fees).
As most of these impacts would significantly affect the General Fund, it has been identified as an
important strategy to increase the level of unrestricted cash to act as a buffer against these types of
events.

Workforce Management Plan
2018 - 2022
57
Introduction
Armidale Regional Council’s (ARC) Workforce Planning process is a dynamic process designed to
match workforce requirements with organisational objectives, now and into the future. It provides
Council with direction and helps identify workforce requirements needed to meet the expectations
of the Community as provided in the Community Strategic Plan.
The Integrated Planning and Reporting (IP&R) Framework and Fit for the Future Improvement Plan
conveys the need to outline how council will achieve financial sustainability into the future, including
through its workforce. The need for a Workforce Plan is a well considered theme within the sector
and has been recognised and promoted as a means of addressing the future challenges facing the
industry and changing operational needs.
In addition to delivering on the expectations of the community and requirements of the IP&R, one of
the five key objectives of the NSW State Government’s Stronger Council’s initiative is Sound
Organisational Health. The implementation of the Workforce Management Plan (WMP) is included
in the scope of the Sound Organisational Health project.
Themes of the need to address increasing skill shortages through innovative attraction and retention
strategies and leadership skill development amongst all senior managers, including General
Managers and Directors was identified as part of the Independent Local Government Review Panel
outcomes.
It is intended that this Plan will be an evolving document that will change as the community and the
organisation continues to grow and change. Council will continuously review and monitor the
Workforce Management Plan to ensure its meeting the organisations needs.
Building The Workforce Management Plan
As part of the process of building the workforce management plan, consideration was given to a
wide variety of issues related to the standard of our service delivery, key projects resourcing
requirements and linking into key strategic objectives of Council.

58
Looking To The Future
Council’s strategic workforce priorities will continue to build upon the achievements made to date
and develop the committed and capable workforce it already has.
In addition, the priorities and action plans contained herein are informed by key workforce trends,
the changing environment and Council’s workforce profile. Across the local government industry
and Australia, there are consistent themes of change which are impacting on the nature of work and
defining the workforce of the future. Council will need to be conscious of and responsive to these
changes.
Significant trends include:
The Impact Of Technology
With the rapid change in technology occurring, Council and its workforce need to evolve at the same
pace.
Technological improvements make it possible for Council to offer more flexible work arrangements
through the opportunity to telecommute and work from virtual offices or home. Information is now
more easily accessible and able to be shared more quickly than ever before and with fewer
resources.
Technology allows Council to find efficiencies in operations through automation and process
improvement as well as better opportunity to access advanced networking and learning.
Communication has changed significantly with the ease of access to information, cyber security, and
real time responses becoming a larger part of how we communicate.
Over the coming years, Council will look to address the challenges and opportunities for its people
brought about through the impact of technology.
An Older Experienced Workforce
Approximately 40%1 of Council employees are over the age of 50. This statistic is not uncommon
across Australian organisations as the Baby Boomers generation age. According to the Australian
Bureau of Statistics Census 2011, over 50 year olds represented 37% of all local government staff
compared to 29% of all workers nationally.
1 Information extracted from Tech One Council Data 12 April 2018

59
Indications are that the number of Australians aged 65 or over will have more than doubled by 2055.
This will potentially bring new challenges for Australia including the need for older workers to stay in
the workforce longer. Employers will need to consider ways to accommodate and maximise the
opportunity that an ageing workforce brings to a community while maintaining a safe and
productive workplace.
The ageing of Council’s workforce presents challenges for Council in terms of working arrangements
retention of corporate knowledge, safe work practices and succession planning.
Council will look to address the challenges and maximise the opportunities brought about through
the changing demographic of its workforce.
A Healthy Workplace As A Driver Of Performance
Most Australian adults spend around half their waking hours at work so it’s obvious that the
workplace is an important setting for promoting and supporting good health across the population.
It is not just physical health that needs addressing with reports indicating that one in five adults will
experience mental illness at some point in their life. The operational impact of illness, both physical
and mental is broad. A healthy workplace can increase productivity, reduce sick leave and
presentism, improve staff morale and motivate and improve workplace relationships.
The Australian Government - Department of Health ‘Healthy Workers Initiative’ reports that it has
been estimated that the healthiest Australian employees are three times more productive at work
than their colleagues.1
1. The increase in preventable disease and workplace injury resulting from unhealthy living is a
major cause of workplace absence or disruption.2
2. Lifestyle risk factors such as smoking, excessive drinking, poor diet, inactivity and excess
body weight can contribute to time away from work.
3. Loss in productivity due to obesity through absenteeism, attending work when sick and
premature death is estimated to cost $6.4 billion a year.
1 Medibank Private (2005) The Health of Australia’s Workforce, www.medibank.com.au/pdfs/MEDI_Workplace_Web_Sp.pdf.
2 Medibank Private (2005) The Health of Australia’s Workforce, www.medibank.com.au/pdfs/MEDI_Workplace_Web_Sp.pdf.

60
The Need For Talent Attraction
The projected decline of the available regional labour force in the years ahead will impact on the
Council’s ability to deliver services. This will necessitate a greater emphasis on not only attracting
new employees, but on retaining current employees in an increasingly tight and competitive labour
market.
Factors such as a lack of social engagement, entertainment, retail, industry, investment and
transport opportunities, combined with perceived geographic remoteness, has an impact on the
ability to attract skilled staff. The proximity of larger centres such as Tamworth and coastal
communities such as Coffs Harbour together with the relative proximity of Sydney and Brisbane
through air and rail services offset some of these factors to a limited extent.
Armidale Regional Council’s Workforce Management Plan provides the strategic direction to create a
sustainable workforce. Council must continue investing in the development and retention of the
right people, with the right capabilities, skills and behaviours, in the right jobs.
The Ability To Manage Change – Building Resilience In The Workforce
The local government environment and the societies and communities in which Council operate are
dynamic. Over the past century the number of local councils in NSW has more than halved and
recent changes in NSW have seen further reductions to the number of councils in the State. The Fit
for the Future reform process has more recently impacted directly on the local government
environment. The ongoing review and change that this reform brings to local government is wide
reaching and will continue to evolve over the foreseeable future.
In addition to larger structural changes such as council boundaries, councils regularly review their
operational needs and the mix of staffing needed to fulfill their operational obligations and
commitment to the community. Council functions are also varied due to legislation or funding
programs changes which are influenced by State and Federal Governments.
This type of environment requires a workforce which is responsive, cooperative and resilient to
endure the changes in a safe and sustainable way. It is important that Council address these
challenges to ensure the health of its staff and the organisation.
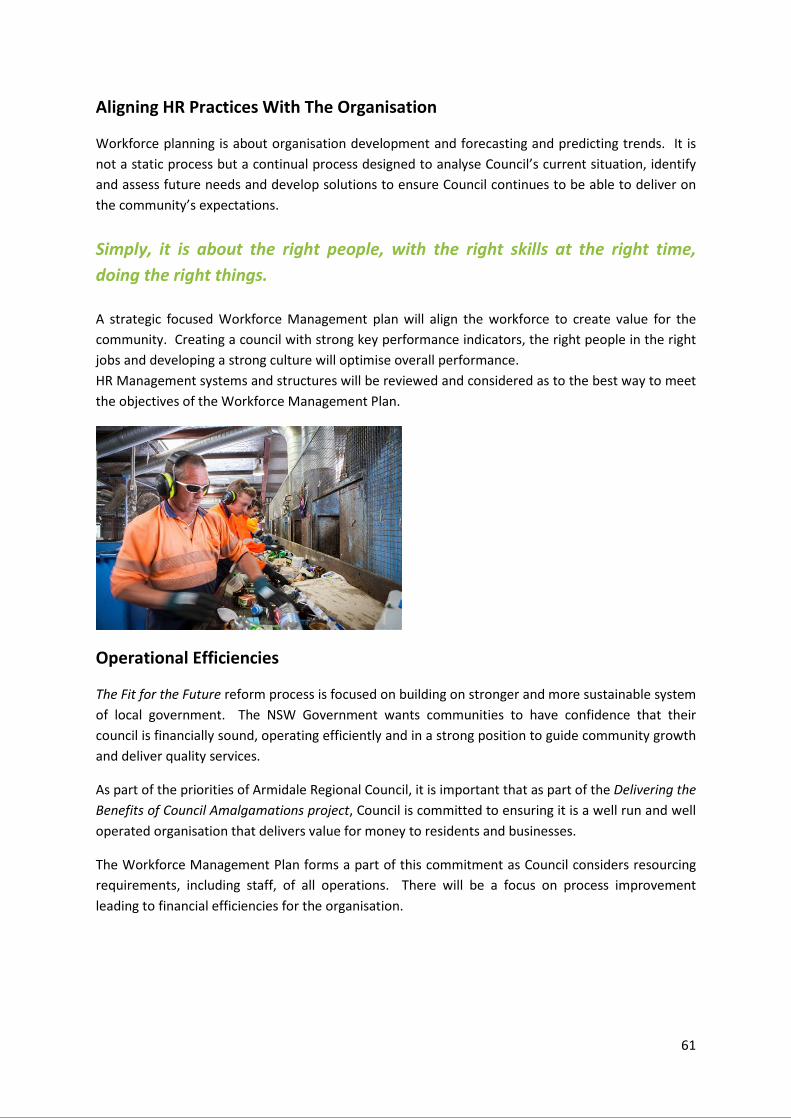
61
Aligning HR Practices With The Organisation
Workforce planning is about organisation development and forecasting and predicting trends. It is
not a static process but a continual process designed to analyse Council’s current situation, identify
and assess future needs and develop solutions to ensure Council continues to be able to deliver on
the community’s expectations.
Simply, it is about the right people, with the right skills at the right time,
doing the right things.
A strategic focused Workforce Management plan will align the workforce to create value for the
community. Creating a council with strong key performance indicators, the right people in the right
jobs and developing a strong culture will optimise overall performance.
HR Management systems and structures will be reviewed and considered as to the best way to meet
the objectives of the Workforce Management Plan.
Operational Efficiencies
The Fit for the Future reform process is focused on building on stronger and more sustainable system
of local government. The NSW Government wants communities to have confidence that their
council is financially sound, operating efficiently and in a strong position to guide community growth
and deliver quality services.
As part of the priorities of Armidale Regional Council, it is important that as part of the Delivering the
Benefits of Council Amalgamations project, Council is committed to ensuring it is a well run and well
operated organisation that delivers value for money to residents and businesses.
The Workforce Management Plan forms a part of this commitment as Council considers resourcing
requirements, including staff, of all operations. There will be a focus on process improvement
leading to financial efficiencies for the organisation.

62
Strategies To Address The Workforce Challenges Faced By
The Sector
1. Improving Workforce Planning and Development
2. Keeping our People and Communities Safe and Healthy
3. Promoting Local Government as a Place-Based Employer of Choice
4. Retaining and Attracting a Diverse Workforce
5. Creating a Contemporary Workplace
6. Investing in Skills
7. Culture Development
8. Improving Productivity and Leveraging Technology
9. Maximising Management and Leadership
10. Implementation and Collaboration
These strategies directly link Council’s Workforce Management Plan with the Local Government
NSW Workforce Management Plan and the strategies outlined in the Future-Proofing Local
Government: National Workforce Strategy 2013 – 2020 compiled by the Local Government Practice
Unit of Local Government Managers Australia (LGMA) on behalf of the Australian Centre of
Excellence for Local Government.

63
1. Improving workforce planning and development
As part of the Integrated Planning and Reporting (IP&R) framework Council is required to prepare a 4
year workforce management plan which addresses the human resource requirements of the 4 year
Delivery Program. The Delivery Program details the principal activities to be undertaken to achieve
the key elements established in the Community Strategic Plan.
Actions 1.1 Fully integrate the plan with the Operational Plan, Delivery Program, Long Term Financial
Plan and Asset Management Plan.
1.2 Create a framework to assess Workforce Planning and Organisation capability
1.3 Implement programs which provide career development opportunities to youth through
targeted Apprenticeship, Traineeship and Cadetship arrangements.
1.4 Consult broadly with ELT, Management team and other key stakeholders on the
components of the Workforce Management Plan to create a greater understanding of the
importance of the plan and its operational linkages.
1.4 Build and support a highly responsive and adaptable workforce which is able to respond
easily to changes in demand and service expectations.
1.6 Develop workforce planning capabilities and understanding for all managers to allow
resourcing considerations to become incorporated into strategic planning.
1.7 Provide greater support for managing hard to fill and business critical roles including the
development and implementation of a Succession Planning Program.
1.8 Develop and implement a holistic Transition to Retirement Program.

64
2. Keeping our People and Communities Safe and Healthy
The Workforce Management emphasizes the importance of Safety, Health and Wellbeing as a
fundamental component of our operations at Council.
Armidale Regional Council Safety Vision
At Armidale Regional Council we believe that the responsibility for safety starts with each one of
us and that all injuries are preventable and that no task is so important that it can’t be done
safely. Through our “Live Safe’ program we intentionally set the bar high in safety and encourage
everyone to ‘look out for their mates’.
Building a strong wellbeing and safety culture is a challenge that will play a critical part in improving
the health and wellbeing of our staff.
The workforce Management Plan acknowledges the emphasis on compliance in the Work, Health
and Safety Act 2011 and the inherent need to focus on risk management.
Actions 2.1 Assist with, and promote organisational safety for the life of this plan.
2.2 Provide clarity of safety responsibilities to meet legislative and organisational standards and
expectations.
2.3 Review our recruitment and fitness for work processes to ensure staff are fit for the defined
role.
2.4 Review and build/rebuild systems processes, policies and tools to manage all safety and risk
elements effectively across Council.
2.5 Ensure supervisors continually undertake safety conversations to reinforce safety
awareness.
2.6 Develop, consult, adopt and proactively implement initiatives which focus on fatigue
management, mental health, contractor management and risk, incident and audit online
reporting systems.

65
3. Promoting Local Government as a Place-Based Employer of Choice
In an environment where skill shortages are increasing across vital areas of Councils operations,
Council needs to be in a strong position to compete for highly skilled and talented people to join the
organisation. Local Government and Council aim to be seen as somewhere that people want to
work and stay and aspire to be an Employer of Choice.
Actions 3.1 Develop and implement an Employer Branding Strategy to promote local government and
ARC as an employer of choice.
3.2
Proactively identify opportunities to collaborate and regularly participate in industry events
which promote Local Government and ARC as an employer.
3.3
Maintain Council’s focus on entrenching the principles of diversity and inclusion within every
component of our organisation.
3.4 Promote the benefits of living and working in the region to support regional workforce
growth and Council employment.
3.5 Participate in relevant Awards that support the promotion of ARC as an employer of choice.

66
4. Retaining and Attracting a Diverse Workforce
It is vital that we have the right people, with the right capabilities, skills and attitudes in the
right jobs. The experience and knowledge that Council’s people hold is one of its biggest
assets. Council will attract and retain the right people from a diverse range of backgrounds
to enhance the work environment for all employees. Council will develop, implement and
continually improve recruitment and selection techniques to ensure they generate the
immediate and longer-term needs of the organisation.
Actions 4.1 Develop an innovative Recruitment Strategy for Council which supports the Employer
Branding Strategy and that aligns with our values and our organisation cultural expectations.
4.2 Improve Council’s career website presence and access for job seekers.
4.3 Review the formal and informal influences on our behaviour to ensure these align to our
preferred culture and desired business outcomes.
4.4 Review and implement on-boarding process to maximise engagement and retention.
4.5 Enable cultural change across Council that enhances Council’s constructive and community
focused culture.
4.6 Continue to strengthen and embed Council’s safety culture.
4.7 Develop and implement a Graduate Leadership Program.

67
5. Creating a Contemporary Workplace
The fifth strategy focuses on the creation of a contemporary workplace, that is a workplace that is
able to grow and adapt to the ever changing environment that the sector experiences. The creation
of a contemporary workplace that is flexible and progressive will assist to making Council attractive
to future generations of leaders.
Actions 5.1 Support the organisation in the development of networking and resource sharing
opportunities through the New England Joint Organisation (JO).
5.2 Review performance management systems and processes and identify and implement a
contemporary system for Council.
5.3 Review industrial arrangements that may impact on our capacity to deliver service
excellence and hinder our ability to create an environment where staff can enjoy a high level
of job satisfaction.
5.4 Develop and deliver recognition program.
5.5 Maintain staff health and wellbeing programs aimed at increasing health, functional capacity
and wellbeing.
5.6 Complete major review of HR related policies to ensure alignment with council’s strategic
direction and compliance.
5.7 Increase the focus on excellence in the development of an inclusive, innovative and high
performance culture.
5.8 Progress our Leadership and Culture journey through the implementation of the Culture
Plan.

68
6. Investing in Skills
The investment in training and development opportunities, beyond compliance and risk
management exercises, is key to the ongoing sustainability of Council. It provides benefits to both
Council and staff, improving the capacity of the organisation to adapt to change, gains in
productivity and an increase in employee job satisfaction and motivation.
Actions 6.1 Continue to invest in development and training to develop highly skilled, accountable and
innovative staff.
6.2 Proactively identify, promote and lobby for external funding and scholarship opportunities
for training and education for existing staff development.
6.3 Investigate the opportunity to implement a staff exchange program with targeted
organisations to broaden experience and enhance relationships with strategic partners
6.4 Council to participate in the annual Local Government Management Challenge.
6.5 Partner with Universities, TAFE and high schools to develop a program of work experience
and vocational skill development.
6.6 Development and implementation of a structured Leadership Program to form part of
Council’s Corporate Training Plan.
6.7 Support a Joint Organisation regional council approach to compliance training programs.

69
7. Culture Development
Council is embarking on a transformational change journey. The 2017 culture measure has provided
Council with the unique opportunity and insights to focus on those areas that provide the
opportunities to celebrate and leverage the strengths at Council to move forward with purpose.
Actions 7.1 Progress our Leadership and Culture journey through the implementation of the Culture
Plan.
7.2 Develop a whole Council Internal Communications framework that ensures consistent
messages and is flexible and fit for purpose.
7.3 Ongoing focus on the development of high performing, inclusive teams.
7.4 Create awareness of and continue to embed Council Values into operations.

70
8. Improving Productivity and Leveraging Technology
Technology allows Council to find efficiencies in operations through automation and process
improvement as well as better opportunities to access advanced networking and learning
opportunities.
Actions 8.1 Identify opportunities to use technology to support our staff, increase productivity and meet
our quality service expectations.
8.2 Investigate and implement human resource information system software (HRIS) which
integrates with existing Council systems.
8.3 Maximise use of intranet with HR information ie. Diversity statistics, Manager tool kits and
checklists and policies.
8.4 Council will continue to use relevant data and metrics to form and support strategic
decisions and program development.
8.5 Undertake a technology skills gap analysis within the current workforce and address gaps as
required.
8.6 Embrace technology to support increased access to learning opportunities including online
learning and webinars.

71
9. Maximising Management and Leadership
Great teams accomplish great work. Councils that assist their managers and executives to become
good people managers are well placed to deal with workforce challenges of the future.
Actions 9.1 Improve the leadership capability of the current and future leaders of Council.
9.2 Developing and implementing a leadership and management capability framework.
9.3 Development of high performing and inclusive teams.
9.4 Promote mentoring opportunities for the management group and throughout the
organisation.
9.5 Investment in ‘team building’ activities for both the ELT and management groups to
encourage greater collaboration and understanding between the individuals.
9.6 Develop on-line HR resources and systems to support the delivery of identified strategies
and to provide for employee self service options.
10. Implementation and Collaboration
The final strategic priority is vital in ensuring the strategic priorities of the Workforce Management
Plan are realised. The resourcing and collaboration between both internal and external parties will
guide the delivery of the plan. The actions and measures outlined below will provide a way of
monitoring, evaluating and communication the progress of the delivery of the plan.
Actions 10.1 Prepare and regularly report on an annual action plan that will be endorsed by the Executive
Leadership Team detailing activities aimed at achieving the Workforce Management Plan
objectives
10.2 Establish resourcing requirements to deliver all actions in the Plan and establish budget
requirements.
10.3 Monitor progress of the plan every six months and review actions every 12 months for
action and relevance, including reporting to the Executive Leadership Team.
10.4 Developing appropriate measures of performance and culture as the basis of measuring and
rewarding performance.
10.5 Implementing an appropriate benchmarking methodology around key performance
measures, both internally and externally.

72
Asset Management Planning

73
Introduction
On 12 May 2016 the Minister for Local Government announced the newly formed Armidale Regional
Council – a merger of the former Armidale Dumaresq and Guyra Shire Councils. Prior to this, the
former Councils had each endorsed an Asset Management Policy. Armidale Regional Council’s Asset
Management Policy will provide the framework for the Asset Management Strategy and Plans. It will
provide a strategic direction for the management of Council’s assets to support the service delivery
needs of the community into the future, balanced with the available financial resources and
workforce to ensure long term sustainable service provision.
Council is currently in the process of reviewing the Asset Management Framework which will include
Council’s Asset Management Policy, Strategy and associated Plans. Asset Management Plans have
been developed and contain specific details about:
• asset inventory, values and condition
• asset based levels of service
• demand and service management
• risk management
• maintenance and renewal estimates
The plans will cover the following asset categories:
Table 1 Summary of combined infrastructure asset values as at 30 June 2020
Asset Class Gross Replacement Cost
(CRC) 000’s Written Down Value
(WDV) 000’s Annual Depreciation
Expense 000’s
Transport1 $442,579 $346,220 -$5,429
Buildings $118,483 $61,760 -$2,149
Stormwater $60,393 $46,906 -$630
Parks, Recreation and Other $10,878 $6,608 -$142
Water Supply $239,718 $161,608 -$3,163
Sewerage Network $134,885 $96,688 -$2,082
Airport $9,545 $6,977 -$370
Combined $1,016,481 $726,767 -$13,965
1 Excludes non depreciable earthworks
Development of asset management plans for Council’s infrastructure assets is a mandatory
requirement for NSW local governments. Local Government Act 1993 Section 8B “Principles of
sound financial management”. The Act states that:
a) Council spending should be responsible and sustainable, aligning general revenue and expenses.
b) Councils should invest in responsible and sustainable infrastructure for the benefit of the local
community.
c) Councils should have effective financial and asset management, including sound policies and
processes for the following:
i. performance management and reporting
ii. asset maintenance and enhancement

74
iii. funding decisions
iv. risk management practices
d) Councils should have regard to achieving intergenerational equity, including ensuring the
following:
i. policy decisions are made after considering their financial effects on future generations
ii. the current generation funds the cost of its services
Financial Sustainability
Council is the custodian of community assets with a current replacement cost $1.2 billion as at 30
June 2020. Council faces a significant challenge in distributing sufficient funds to each asset class to
maintain adequate condition, functionality and capacity. Funding for individual assets cannot be
considered in isolation. The strategy and plans need to consider the condition and outlook for each
asset class but also have an overall position that takes into account the risk and dependency of
service levels being managed.
Council must ensure that community assets such as roads, bridges, stormwater, footpaths, buildings,
waste, water and sewerage infrastructure are maintained in a manner that will enable the long term
financial sustainability for current and future generations. This will be achieved by ensuring efficient
and effective service delivery and ensuring appropriate funds are allocated to maintain and renew
infrastructure assets. Asset funding requirements are identified in asset management plans, which
should then inform capital works programs and be funded in Council’s long term financial forecast.
Failure to achieve this outcome will result in an asset backlog being created and unsatisfactory
condition of assets will result. This will cause negative long term impacts to the community and
impact the ability for the local community to facilitate economic growth including population
growth.
Current State of Assets
Similar to other councils across the state, Council is struggling with the challenge of maintaining and
renewing older assets. Our asset maintenance and building and infrastructure asset renewal
performance is below indicative benchmarks set by the State Government. Council has collected and
developed indicative data set that reveals a significant proportion of our infrastructure assets are
more than 50 years old and almost all of these are high-cost/long-life assets (eg, roads and drainage
infrastructure) with an expected life of around 60-100 years.
Funding the ongoing projected renewal of these assets is a significant financial challenge for Council
and is the main reason why Council is proposing a special rate variation. Funding asset renewal
requires ongoing review of possible revenue sources from facilities and properties to ensure a fairer
allocation between subsidy from rates and user charges is achieved.

75
The table below shows the volume of infrastructure assets currently under management as at 30
June 2020.
Asset Sub Class Volume Replacement Cost $’000
Sealed Roads 779km $158,031
Unsealed Roads 1,078km $31,133
Bulk Earthworks 2,027km $142,101
Bridges & Culverts 112 $64,962
Stormwater Drainage 119km $60,393
Footpaths 132km $14,219
Kerb and Gutter 252km $21,844
Traffic Furniture (Roundabouts, etc) 307 $10,289
Buildings 264 $118,483
Other Structures (Pools, parks
infrastructure, playgrounds, etc) 300 $40,800
Airport Infrastructure 16 $9,545
TOTAL $671,800
For these assets, the average condition by asset value is:
Condition 1 2 3 4 5
Replacement cost $’000 $361,880 $152,601 $114,258 $35,844 $7,216

76
Definition of each level of condition
Condition
Rating
IP&R
description
IPWEA Description
1 Excellent/
very good
New or as new condition. Only planned cyclic inspection
and maintenance required. 2
Good
Sound or good condition with minor defects. Minor routine
maintenance along with planned cyclic inspection and
maintenance. 3
Satisfactory
Fair condition with significant defects requiring regular
maintenance on top of planned cyclic inspections and
maintenance.
4 Poor Poor condition with asset requiring significant
renewal/rehabilitation, or higher levels of inspection and
substantial maintenance to keep the asset serviceable.
5 Very Poor Very poor condition. Asset physically unsound and/or beyond
rehabilitation. Renewal required.
Asset Management Planning Process
Asset Management planning is a comprehensive process to ensure that assets are managed and
maintained in a way that enables affordable services from infrastructure to be provide in an
economically optimal way. In turn, affordable service levels can be determined by assessing
financially sustainability under scenarios with different proposed services levels. Asset management
planning commences with defining stakeholder and legal requirements and needs, incorporating
these needs into the organisation’s strategic plan, developing asset management policy, strategy,
asset management plans and operational plans, linked to a long-term financial plan with a funding
plan.
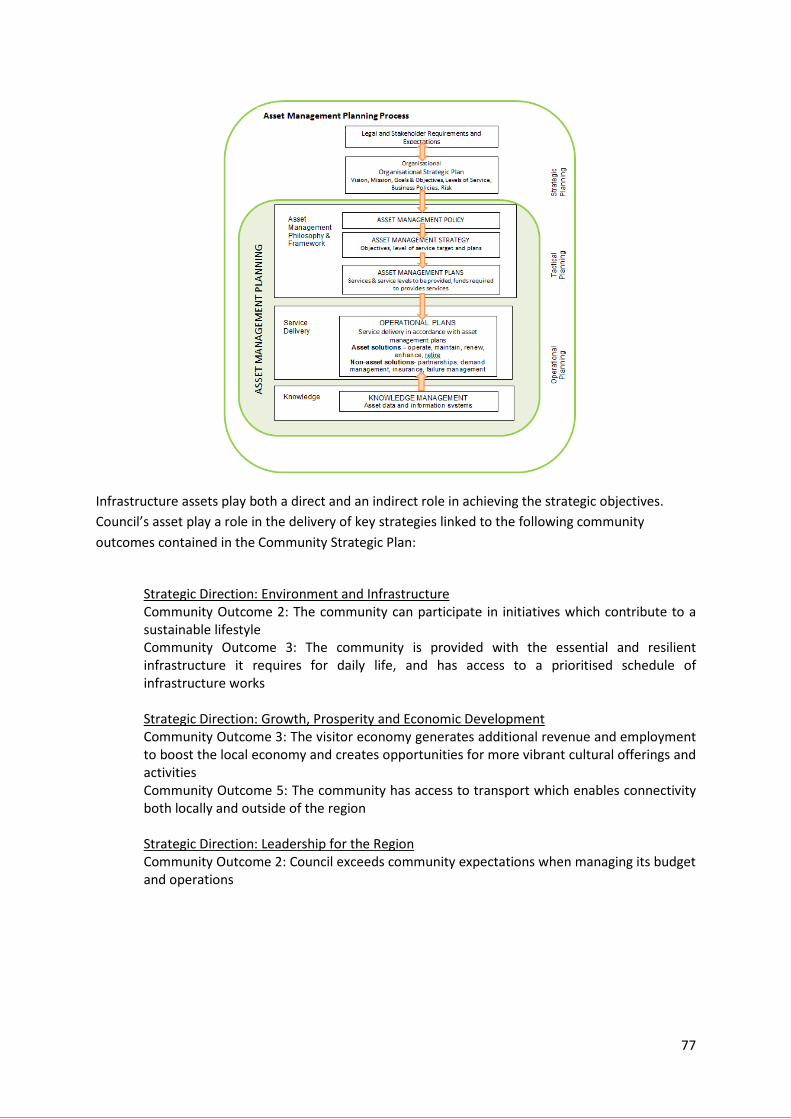
77
Infrastructure assets play both a direct and an indirect role in achieving the strategic objectives.
Council’s asset play a role in the delivery of key strategies linked to the following community
outcomes contained in the Community Strategic Plan:
Strategic Direction: Environment and Infrastructure
Community Outcome 2: The community can participate in initiatives which contribute to a
sustainable lifestyle
Community Outcome 3: The community is provided with the essential and resilient
infrastructure it requires for daily life, and has access to a prioritised schedule of
infrastructure works
Strategic Direction: Growth, Prosperity and Economic Development
Community Outcome 3: The visitor economy generates additional revenue and employment
to boost the local economy and creates opportunities for more vibrant cultural offerings and
activities
Community Outcome 5: The community has access to transport which enables connectivity
both locally and outside of the region
Strategic Direction: Leadership for the Region
Community Outcome 2: Council exceeds community expectations when managing its budget
and operations