time and timing in the acoustic recognition system of crickets
TRANSCRIPT
HYPOTHESIS AND THEORY ARTICLEpublished: 12 August 2014
doi: 10.3389/fphys.2014.00286
Time and timing in the acoustic recognition system ofcricketsR. Matthias Hennig1*, Klaus-Gerhard Heller1 and Jan Clemens2
1 Behavioural Physiology, Department of Biology, Humboldt-Universität zu Berlin, Berlin, Germany2 Princeton Neuroscience Institute, Princeton University, Princeton, NJ, USA
Edited by:Silvio Macias, Havana University,Cuba
Reviewed by:Berthold Gerhard Hedwig,University of Cambridge, UKJohannes Schul, University ofMissouri, USA
*Correspondence:R. Matthias Hennig, BehaviouralPhysiology, Department of Biology,Humboldt-Universität zu Berlin,Invalidenstr. 43, 10115 Berlin,Germanye-mail: [email protected]
The songs of many insects exhibit precise timing as the result of repetitive andstereotyped subunits on several time scales. As these signals encode the identity of aspecies, time and timing are important for the recognition system that analyzes thesesignals. Crickets are a prominent example as their songs are built from sound pulses thatare broadcast in a long trill or as a chirped song. This pattern appears to be analyzed on twotimescales, short and long. Recent evidence suggests that song recognition in cricketsrelies on two computations with respect to time; a short linear-nonlinear (LN) model thatoperates as a filter for pulse rate and a longer integration time window for monitoringsong energy over time. Therefore, there is a twofold role for timing. A filter for pulse rateshows differentiating properties for which the specific timing of excitation and inhibition isimportant. For an integrator, however, the duration of the time window is more importantthan the precise timing of events. Here, we first review evidence for the role of LN-modelsand integration time windows for song recognition in crickets. We then parameterize thefilter part by Gabor functions and explore the effects of duration, frequency, phase, andoffset as these will correspond to differently timed patterns of excitation and inhibition.These filter properties were compared with known preference functions of crickets andkatydids. In a comparative approach, the power for song discrimination by LN-models wastested with the songs of over 100 cricket species. It is demonstrated how the acousticsignals of crickets occupy a simple 2-dimensional space for song recognition that arisesfrom timing, described by a Gabor function, and time, the integration window. Finally,we discuss the evolution of recognition systems in insects based on simple sensorycomputations.
Keywords: acoustic communication, insects, crickets, auditory processing, computational neuroscience
ACOUSTIC SIGNALS CARRY INFORMATION ON DIFFERENTTIME SCALESCommunication signals of different modalities can exhibit staticand dynamic components (Bradbury and Vehrencamp, 1998).Dynamic signals change over time, an attribute that is sharedby signals directed at different sensory modalities, from visualand olfactory signals to acoustic signals. Even for human speech,the temporal component is an important information channelthat is decoded with sub-millisecond precision over multipletime scales (Giraud and Poeppel, 2012; David and Shamma,2013; Garcia-Lazaro et al., 2013). The acoustic signals of manyspecies from arthropods to vertebrates and humans vary overtime and carry information in their temporal dynamic. For allspecies with low resolution for carrier frequencies and thus poorspectral analysis it is the temporal domain in which informa-tion can be transmitted. Particularly sound (pulse) rates, soundonsets and durations are important features in signals frominsects, fish, frogs or mammals (Rose and Capranica, 1984;Langner, 1992; Crawford, 1997; Gerhardt and Huber, 2002;Felix et al., 2011). Although we observe and describe manyof these features in the acoustic signals, our understanding of
the underlying feature detectors in a receiver is by far lessadvanced.
The songs of insects are a case in point. Over the last hundredyears the calling songs of insects were recognized as importantbarriers for pregamic isolation and the song patterns were doc-umented in numerous monographs (Otte and Alexander, 1983;Otte, 1994; Ragge and Reynolds, 1998). As insects usually havelow spectral resolution it is the temporal component that carriesmost information. For most cases the long-range signals of insectsreveal a comparatively simple signal structure (with the exceptionof grasshoppers and their courtship songs, cicadas with frequencymodulations). Nevertheless there are now several examples thatdemonstrate that the information relevant for a receiver is dis-tributed over several time scales, to which in insect songs we referto pulses or syllables and chirps, trills or phrases (Figures 1A,F,Deily and Schul, 2009; Grobe et al., 2012). The physiological basisfor a basic feature detector was demonstrated for grasshoppers(gap detection, Ronacher and Stumpner, 1988) and recently incrickets (pulse rate detector, Kostarakos and Hedwig, 2012). Thecentral element of both is the timing of inhibition and excita-tion. However, the physiological correlate of a filter on a longer
www.frontiersin.org August 2014 | Volume 5 | Article 286 | 1

Hennig et al. Timing in crickets
time scale is still elusive. It remains a challenge to understandthe temporal computations on the longer time scale of chirps andphrases.
In crickets, but also katydids, it is known that females eval-uate song signals on several time scales (Deily and Schul, 2009;Grobe et al., 2012). Especially, the songs of crickets are simpleand binary-like as they are composed of single sound events,the pulses produced by the closing movements of the forewings(Huber et al., 1989). From an evolutionary point of view thereexist several descriptions about the evolution of song patterns(Alexander, 1962; Otte, 1992, 1994; see also Desutter-Grandcollasand Robillard, 2003; Korsunovskaya, 2008). In these scenarios theancestral calling songs consisted of long pulse trains, which werethen modified by disruption into chirps and trills. Yet, it is unclearhow the corresponding feature detectors of the receiver shapedthe calling songs of crickets. We also lack an understanding of howfeature detectors on short and long time scale changed duringevolution and how these changes affected the calling song signalsthat can be observed today.
Recently, a simple solution was proposed for the evaluation ofsignals on different time scales (Figure 1, Clemens and Hennig,2013). Two species of crickets within the same genus (Gryllusbimaculatus, G. locorojo) produce song patterns with short chirps.The females of both species evaluate the pulse rate on the shorttime scale (Figures 1A,F) and the chirp pattern on the long timescale (Figures 1B,G). A major difference between the two specieslies in the preference for the chirp pattern (Grobe et al., 2012;Rothbart and Hennig, 2012a; see also Meckenhäuser et al., 2013).While one species accepted chirps over a wide range of duty cycles(Figure 1B), the other preferred chirps only over a small dutycycle range (Figure 1G).
These phonotactic responses can be reproduced using ageneral model that has 4 components: (1) a linear filter, (2)
a nonlinearity, (3) an integration time window, and (4) aweighting function (summarized in Table 1). Linear-nonlinear(LN)-models are commonly used to describe the computationsperformed by sensory neurons (e.g., Pillow et al., 2008). TheseLN models exhibit a linear part, the filter, and a nonlinearity char-acterized by a threshold and a saturation (Clemens and Hennig,2013). The linear filter describes the temporal tuning of themodel—positive and negative lobes of the filter can be producedby precisely timed excitatory or inhibitory inputs to a neuron.The filter constitutes a template, which is compared to the stim-ulus pattern; the filter’s output as given by the filtered stimulusthus corresponds to the similarity between the stimulus and filter(Figures 2A–C). For the evaluation of phonotactic responses, theoutput of LN-models for a test pattern was integrated over a timewindow of 1 s into a single feature value (Clemens and Hennig,2013). This corresponds to the computation performed by inte-grator neurons used in drift-diffusion models of decision makingand found in vertebrate cortex (Brunton et al., 2013). Song signalswere processed in parallel by several LN-models, whose integratedoutput was linearly weighted to yield the predicted phonotaxisvalue for the test pattern (Figure 2).
Fitting this model structure to behavioral data showed thattwo LN-models sufficed to predict female responses, if correctlyweighted against one another (Figures 1D,I, see Clemens andHennig, 2013, for details). Accordingly, two linear filters emergedfor each species (Figures 1C,H). Notably, recent recordings fromindividual brain neurons in crickets (Zorovic and Hedwig, 2011;Kostarakos and Hedwig, 2012) appear be similar to the outputpredicted by LN-models (Figure 2E). At least one of these filtersresembled a Gabor function; that is, a sinusoid with a given fre-quency modulated by a Gaussian distribution (Figures 1C,H, 2,see filter in green). Gabor filters are known from many systemsand have been used to describe the feature selectivity of sensory
pulses/s
dc/s
10 16 25 40 63 100 1580
0.2
0.4
0.6
pulses/s
dc/s
10 16 25 40 63 100 1580
0.2
0.4
0.6
chirp duration [ms]
chirp
pau
se [m
s]
0 500 1000
0
500
1000
chirp duration [ms]
chirp
pau
se [m
s]
0 500 1000
0
500
1000
pulse duration [ms]
paus
e du
ratio
n [m
s]
0 20 40 60
0
20
40
60
pulse duration [ms]
paus
e du
ratio
n [m
s]
0 20 40 60
0
20
40
60
0
0.2
0.4
0.6
0.8
1
20 ms
0.2 0.4 0.6 0.8
0
0.2
0.4
0.6
0.8
r2 = 0.75
0.2 0.4 0.6 0.8
−0.2
0
0.2
0.4
0.6
0.8
r2 = 0.67
Gryllusbimaculatus
Grylluslocorojo
pulse preference chirp preference
0
0.2
0.4
0.6
0.8
1
behavioral filter model output
model
beha
vior
model
beha
vior
behavioral feature space
20 ms
F G I JH
A B D EC
FIGURE 1 | LN-models derived from behavioral preference tests of twoGryllus species for acoustic signals. Preference profiles for (A,F) pulse and(B,G) chirp patterns (insets: schematic song patterns). (C,H) linear filters(filters were scaled to unit-norm and have no units) (D,I) model outputpredicts behavior, units refer to the attractiveness of test patterns from
behavioral trials with crickets and the respective output of the computationalmodel (E,J) 2-dimensional feature space for song recognition, DC/s refers tothe duty cycle per second (data in A,B,F and G modified from Grobe et al.,2012 and Rothbart and Hennig, 2012a, C,D,E, and H,I,J modified fromClemens and Hennig, 2013).
Frontiers in Physiology | Integrative Physiology August 2014 | Volume 5 | Article 286 | 2
Hennig et al. Timing in crickets
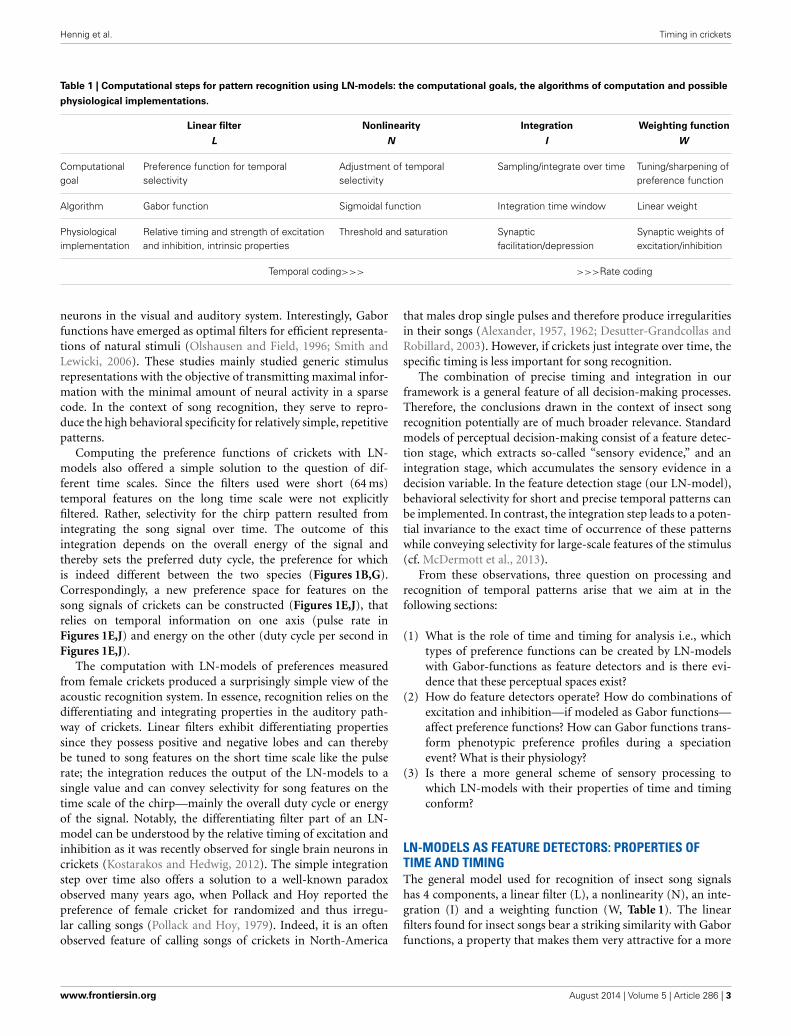
Table 1 | Computational steps for pattern recognition using LN-models: the computational goals, the algorithms of computation and possiblephysiological implementations.
Linear filter Nonlinearity Integration Weighting functionL N I W
Computationalgoal
Preference function for temporalselectivity
Adjustment of temporalselectivity
Sampling/integrate over time Tuning/sharpening ofpreference function
Algorithm Gabor function Sigmoidal function Integration time window Linear weight
Physiologicalimplementation
Relative timing and strength of excitationand inhibition, intrinsic properties
Threshold and saturation Synapticfacilitation/depression
Synaptic weights ofexcitation/inhibition
Temporal coding>>> >>>Rate coding
neurons in the visual and auditory system. Interestingly, Gaborfunctions have emerged as optimal filters for efficient representa-tions of natural stimuli (Olshausen and Field, 1996; Smith andLewicki, 2006). These studies mainly studied generic stimulusrepresentations with the objective of transmitting maximal infor-mation with the minimal amount of neural activity in a sparsecode. In the context of song recognition, they serve to repro-duce the high behavioral specificity for relatively simple, repetitivepatterns.
Computing the preference functions of crickets with LN-models also offered a simple solution to the question of dif-ferent time scales. Since the filters used were short (64 ms)temporal features on the long time scale were not explicitlyfiltered. Rather, selectivity for the chirp pattern resulted fromintegrating the song signal over time. The outcome of thisintegration depends on the overall energy of the signal andthereby sets the preferred duty cycle, the preference for whichis indeed different between the two species (Figures 1B,G).Correspondingly, a new preference space for features on thesong signals of crickets can be constructed (Figures 1E,J), thatrelies on temporal information on one axis (pulse rate inFigures 1E,J) and energy on the other (duty cycle per second inFigures 1E,J).
The computation with LN-models of preferences measuredfrom female crickets produced a surprisingly simple view of theacoustic recognition system. In essence, recognition relies on thedifferentiating and integrating properties in the auditory path-way of crickets. Linear filters exhibit differentiating propertiessince they possess positive and negative lobes and can therebybe tuned to song features on the short time scale like the pulserate; the integration reduces the output of the LN-models to asingle value and can convey selectivity for song features on thetime scale of the chirp—mainly the overall duty cycle or energyof the signal. Notably, the differentiating filter part of an LN-model can be understood by the relative timing of excitation andinhibition as it was recently observed for single brain neurons incrickets (Kostarakos and Hedwig, 2012). The simple integrationstep over time also offers a solution to a well-known paradoxobserved many years ago, when Pollack and Hoy reported thepreference of female cricket for randomized and thus irregu-lar calling songs (Pollack and Hoy, 1979). Indeed, it is an oftenobserved feature of calling songs of crickets in North-America
that males drop single pulses and therefore produce irregularitiesin their songs (Alexander, 1957, 1962; Desutter-Grandcollas andRobillard, 2003). However, if crickets just integrate over time, thespecific timing is less important for song recognition.
The combination of precise timing and integration in ourframework is a general feature of all decision-making processes.Therefore, the conclusions drawn in the context of insect songrecognition potentially are of much broader relevance. Standardmodels of perceptual decision-making consist of a feature detec-tion stage, which extracts so-called “sensory evidence,” and anintegration stage, which accumulates the sensory evidence in adecision variable. In the feature detection stage (our LN-model),behavioral selectivity for short and precise temporal patterns canbe implemented. In contrast, the integration step leads to a poten-tial invariance to the exact time of occurrence of these patternswhile conveying selectivity for large-scale features of the stimulus(cf. McDermott et al., 2013).
From these observations, three question on processing andrecognition of temporal patterns arise that we aim at in thefollowing sections:
(1) What is the role of time and timing for analysis i.e., whichtypes of preference functions can be created by LN-modelswith Gabor-functions as feature detectors and is there evi-dence that these perceptual spaces exist?
(2) How do feature detectors operate? How do combinations ofexcitation and inhibition—if modeled as Gabor functions—affect preference functions? How can Gabor functions trans-form phenotypic preference profiles during a speciationevent? What is their physiology?
(3) Is there a more general scheme of sensory processing towhich LN-models with their properties of time and timingconform?
LN-MODELS AS FEATURE DETECTORS: PROPERTIES OFTIME AND TIMINGThe general model used for recognition of insect song signalshas 4 components, a linear filter (L), a nonlinearity (N), an inte-gration (I) and a weighting function (W, Table 1). The linearfilters found for insect songs bear a striking similarity with Gaborfunctions, a property that makes them very attractive for a more
www.frontiersin.org August 2014 | Volume 5 | Article 286 | 3
Hennig et al. Timing in crickets
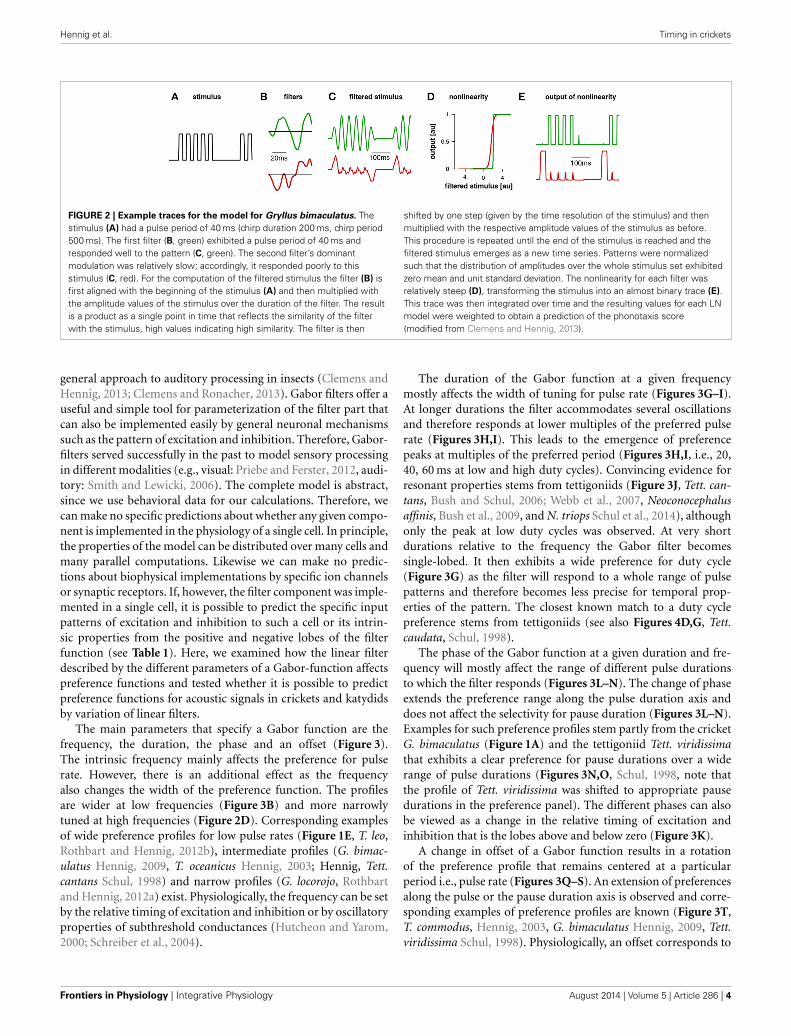
FIGURE 2 | Example traces for the model for Gryllus bimaculatus. Thestimulus (A) had a pulse period of 40 ms (chirp duration 200 ms, chirp period500 ms). The first filter (B, green) exhibited a pulse period of 40 ms andresponded well to the pattern (C, green). The second filter’s dominantmodulation was relatively slow; accordingly, it responded poorly to thisstimulus (C, red). For the computation of the filtered stimulus the filter (B) isfirst aligned with the beginning of the stimulus (A) and then multiplied withthe amplitude values of the stimulus over the duration of the filter. The resultis a product as a single point in time that reflects the similarity of the filterwith the stimulus, high values indicating high similarity. The filter is then
shifted by one step (given by the time resolution of the stimulus) and thenmultiplied with the respective amplitude values of the stimulus as before.This procedure is repeated until the end of the stimulus is reached and thefiltered stimulus emerges as a new time series. Patterns were normalizedsuch that the distribution of amplitudes over the whole stimulus set exhibitedzero mean and unit standard deviation. The nonlinearity for each filter wasrelatively steep (D), transforming the stimulus into an almost binary trace (E).This trace was then integrated over time and the resulting values for each LNmodel were weighted to obtain a prediction of the phonotaxis score(modified from Clemens and Hennig, 2013).
general approach to auditory processing in insects (Clemens andHennig, 2013; Clemens and Ronacher, 2013). Gabor filters offer auseful and simple tool for parameterization of the filter part thatcan also be implemented easily by general neuronal mechanismssuch as the pattern of excitation and inhibition. Therefore, Gabor-filters served successfully in the past to model sensory processingin different modalities (e.g., visual: Priebe and Ferster, 2012, audi-tory: Smith and Lewicki, 2006). The complete model is abstract,since we use behavioral data for our calculations. Therefore, wecan make no specific predictions about whether any given compo-nent is implemented in the physiology of a single cell. In principle,the properties of the model can be distributed over many cells andmany parallel computations. Likewise we can make no predic-tions about biophysical implementations by specific ion channelsor synaptic receptors. If, however, the filter component was imple-mented in a single cell, it is possible to predict the specific inputpatterns of excitation and inhibition to such a cell or its intrin-sic properties from the positive and negative lobes of the filterfunction (see Table 1). Here, we examined how the linear filterdescribed by the different parameters of a Gabor-function affectspreference functions and tested whether it is possible to predictpreference functions for acoustic signals in crickets and katydidsby variation of linear filters.
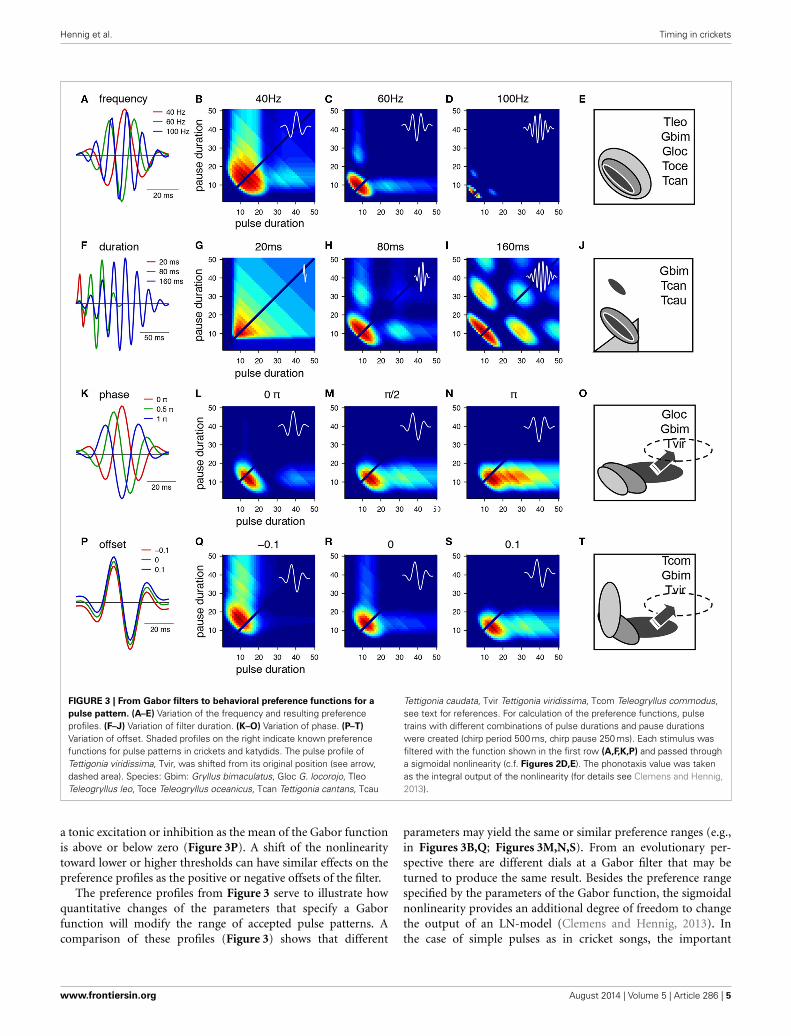
The main parameters that specify a Gabor function are thefrequency, the duration, the phase and an offset (Figure 3).The intrinsic frequency mainly affects the preference for pulserate. However, there is an additional effect as the frequencyalso changes the width of the preference function. The profilesare wider at low frequencies (Figure 3B) and more narrowlytuned at high frequencies (Figure 2D). Corresponding examplesof wide preference profiles for low pulse rates (Figure 1E, T. leo,Rothbart and Hennig, 2012b), intermediate profiles (G. bimac-ulatus Hennig, 2009, T. oceanicus Hennig, 2003; Hennig, Tett.cantans Schul, 1998) and narrow profiles (G. locorojo, Rothbartand Hennig, 2012a) exist. Physiologically, the frequency can be setby the relative timing of excitation and inhibition or by oscillatoryproperties of subthreshold conductances (Hutcheon and Yarom,2000; Schreiber et al., 2004).
The duration of the Gabor function at a given frequencymostly affects the width of tuning for pulse rate (Figures 3G–I).At longer durations the filter accommodates several oscillationsand therefore responds at lower multiples of the preferred pulserate (Figures 3H,I). This leads to the emergence of preferencepeaks at multiples of the preferred period (Figures 3H,I, i.e., 20,40, 60 ms at low and high duty cycles). Convincing evidence forresonant properties stems from tettigoniids (Figure 3J, Tett. can-tans, Bush and Schul, 2006; Webb et al., 2007, Neoconocephalusaffinis, Bush et al., 2009, and N. triops Schul et al., 2014), althoughonly the peak at low duty cycles was observed. At very shortdurations relative to the frequency the Gabor filter becomessingle-lobed. It then exhibits a wide preference for duty cycle(Figure 3G) as the filter will respond to a whole range of pulsepatterns and therefore becomes less precise for temporal prop-erties of the pattern. The closest known match to a duty cyclepreference stems from tettigoniids (see also Figures 4D,G, Tett.caudata, Schul, 1998).
The phase of the Gabor function at a given duration and fre-quency will mostly affect the range of different pulse durationsto which the filter responds (Figures 3L–N). The change of phaseextends the preference range along the pulse duration axis anddoes not affect the selectivity for pause duration (Figures 3L–N).Examples for such preference profiles stem partly from the cricketG. bimaculatus (Figure 1A) and the tettigoniid Tett. viridissimathat exhibits a clear preference for pause durations over a widerange of pulse durations (Figures 3N,O, Schul, 1998, note thatthe profile of Tett. viridissima was shifted to appropriate pausedurations in the preference panel). The different phases can alsobe viewed as a change in the relative timing of excitation andinhibition that is the lobes above and below zero (Figure 3K).
A change in offset of a Gabor function results in a rotationof the preference profile that remains centered at a particularperiod i.e., pulse rate (Figures 3Q–S). An extension of preferencesalong the pulse or the pause duration axis is observed and corre-sponding examples of preference profiles are known (Figure 3T,T. commodus, Hennig, 2003, G. bimaculatus Hennig, 2009, Tett.viridissima Schul, 1998). Physiologically, an offset corresponds to
Frontiers in Physiology | Integrative Physiology August 2014 | Volume 5 | Article 286 | 4
Hennig et al. Timing in crickets
FIGURE 3 | From Gabor filters to behavioral preference functions for apulse pattern. (A–E) Variation of the frequency and resulting preferenceprofiles. (F–J) Variation of filter duration. (K–O) Variation of phase. (P–T)Variation of offset. Shaded profiles on the right indicate known preferencefunctions for pulse patterns in crickets and katydids. The pulse profile ofTettigonia viridissima, Tvir, was shifted from its original position (see arrow,dashed area). Species: Gbim: Gryllus bimaculatus, Gloc G. locorojo, TleoTeleogryllus leo, Toce Teleogryllus oceanicus, Tcan Tettigonia cantans, Tcau
Tettigonia caudata, Tvir Tettigonia viridissima, Tcom Teleogryllus commodus,see text for references. For calculation of the preference functions, pulsetrains with different combinations of pulse durations and pause durationswere created (chirp period 500 ms, chirp pause 250 ms). Each stimulus wasfiltered with the function shown in the first row (A,F,K,P) and passed througha sigmoidal nonlinearity (c.f. Figures 2D,E). The phonotaxis value was takenas the integral output of the nonlinearity (for details see Clemens and Hennig,2013).
a tonic excitation or inhibition as the mean of the Gabor functionis above or below zero (Figure 3P). A shift of the nonlinearitytoward lower or higher thresholds can have similar effects on thepreference profiles as the positive or negative offsets of the filter.
The preference profiles from Figure 3 serve to illustrate howquantitative changes of the parameters that specify a Gaborfunction will modify the range of accepted pulse patterns. Acomparison of these profiles (Figure 3) shows that different
parameters may yield the same or similar preference ranges (e.g.,in Figures 3B,Q; Figures 3M,N,S). From an evolutionary per-spective there are different dials at a Gabor filter that may beturned to produce the same result. Besides the preference rangespecified by the parameters of the Gabor function, the sigmoidalnonlinearity provides an additional degree of freedom to changethe output of an LN-model (Clemens and Hennig, 2013). Inthe case of simple pulses as in cricket songs, the important
www.frontiersin.org August 2014 | Volume 5 | Article 286 | 5
Hennig et al. Timing in crickets
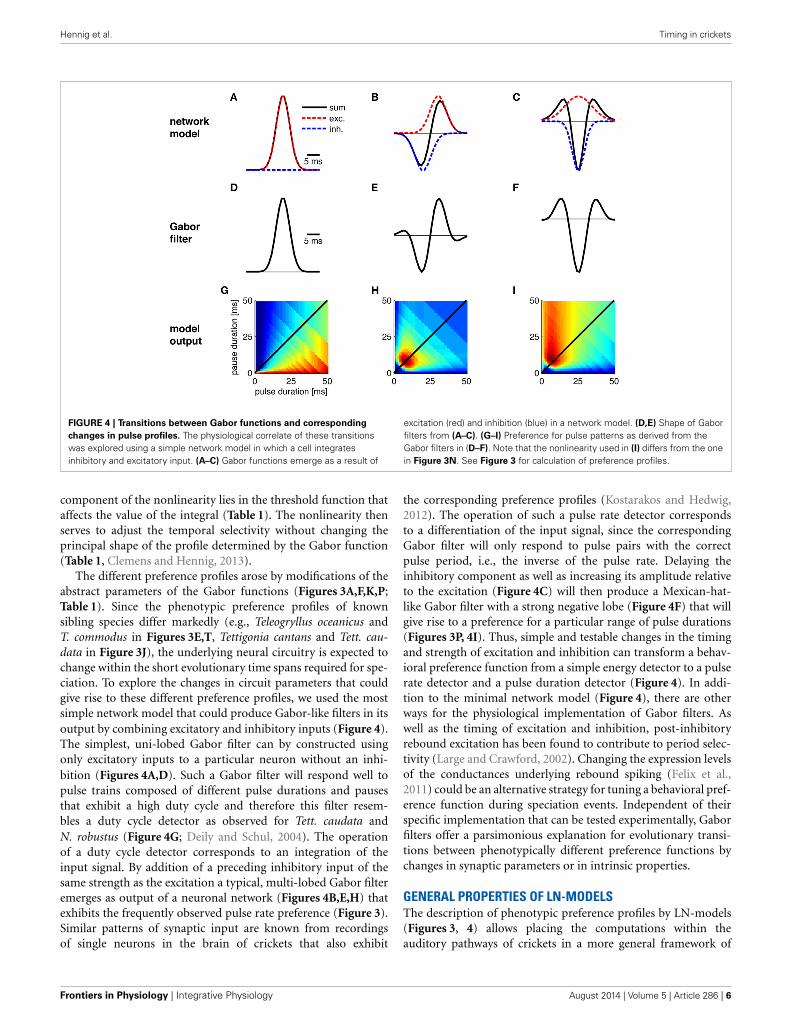
FIGURE 4 | Transitions between Gabor functions and correspondingchanges in pulse profiles. The physiological correlate of these transitionswas explored using a simple network model in which a cell integratesinhibitory and excitatory input. (A–C) Gabor functions emerge as a result of
excitation (red) and inhibition (blue) in a network model. (D,E) Shape of Gaborfilters from (A–C). (G–I) Preference for pulse patterns as derived from theGabor filters in (D–F). Note that the nonlinearity used in (I) differs from the onein Figure 3N. See Figure 3 for calculation of preference profiles.
component of the nonlinearity lies in the threshold function thataffects the value of the integral (Table 1). The nonlinearity thenserves to adjust the temporal selectivity without changing theprincipal shape of the profile determined by the Gabor function(Table 1, Clemens and Hennig, 2013).
The different preference profiles arose by modifications of theabstract parameters of the Gabor functions (Figures 3A,F,K,P;Table 1). Since the phenotypic preference profiles of knownsibling species differ markedly (e.g., Teleogryllus oceanicus andT. commodus in Figures 3E,T, Tettigonia cantans and Tett. cau-data in Figure 3J), the underlying neural circuitry is expected tochange within the short evolutionary time spans required for spe-ciation. To explore the changes in circuit parameters that couldgive rise to these different preference profiles, we used the mostsimple network model that could produce Gabor-like filters in itsoutput by combining excitatory and inhibitory inputs (Figure 4).The simplest, uni-lobed Gabor filter can by constructed usingonly excitatory inputs to a particular neuron without an inhi-bition (Figures 4A,D). Such a Gabor filter will respond well topulse trains composed of different pulse durations and pausesthat exhibit a high duty cycle and therefore this filter resem-bles a duty cycle detector as observed for Tett. caudata andN. robustus (Figure 4G; Deily and Schul, 2004). The operationof a duty cycle detector corresponds to an integration of theinput signal. By addition of a preceding inhibitory input of thesame strength as the excitation a typical, multi-lobed Gabor filteremerges as output of a neuronal network (Figures 4B,E,H) thatexhibits the frequently observed pulse rate preference (Figure 3).Similar patterns of synaptic input are known from recordingsof single neurons in the brain of crickets that also exhibit
the corresponding preference profiles (Kostarakos and Hedwig,2012). The operation of such a pulse rate detector correspondsto a differentiation of the input signal, since the correspondingGabor filter will only respond to pulse pairs with the correctpulse period, i.e., the inverse of the pulse rate. Delaying theinhibitory component as well as increasing its amplitude relativeto the excitation (Figure 4C) will then produce a Mexican-hat-like Gabor filter with a strong negative lobe (Figure 4F) that willgive rise to a preference for a particular range of pulse durations(Figures 3P, 4I). Thus, simple and testable changes in the timingand strength of excitation and inhibition can transform a behav-ioral preference function from a simple energy detector to a pulserate detector and a pulse duration detector (Figure 4). In addi-tion to the minimal network model (Figure 4), there are otherways for the physiological implementation of Gabor filters. Aswell as the timing of excitation and inhibition, post-inhibitoryrebound excitation has been found to contribute to period selec-tivity (Large and Crawford, 2002). Changing the expression levelsof the conductances underlying rebound spiking (Felix et al.,2011) could be an alternative strategy for tuning a behavioral pref-erence function during speciation events. Independent of theirspecific implementation that can be tested experimentally, Gaborfilters offer a parsimonious explanation for evolutionary transi-tions between phenotypically different preference functions bychanges in synaptic parameters or in intrinsic properties.
GENERAL PROPERTIES OF LN-MODELSThe description of phenotypic preference profiles by LN-models(Figures 3, 4) allows placing the computations within theauditory pathways of crickets in a more general framework of
Frontiers in Physiology | Integrative Physiology August 2014 | Volume 5 | Article 286 | 6
Hennig et al. Timing in crickets
sensory processing (Table 1). Barlow (1961), Marr (1982) andKonishi (1990) emphasized the importance of understanding thecomputational goals and implemented algorithms for our under-standing of sensory processing in different modalities and sensorypathways. The general computational goal of auditory process-ing of crickets and katydids for mate recognition is specified bythe recognition of the conspecific song signal or, more parsimo-niously by the discrimination of its own signal against all othersignals (c.f. Gerhardt and Huber, 2002). For each component of aLN-model it is also possible to specify a computational goal andan appropriate algorithm (Table 1). From computational goalsand algorithms the salient cues (Konishi, 1990) for signal discrim-ination can be derived that consist of temporal information givenby pulse rate and duty cycle (Figures 3, 4).
The extraction of these salient cues is achieved by special-ized circuits that represent a physiological implementation ofthe linear Gabor filters, given by the timing and strength ofexcitation and inhibition (Figures 3, 4), combined with theirrespective nonlinearity (Table 1, Clemens and Hennig, 2013). Theother components required for signal discrimination within thisframework, the integration time window and the linear weight-ing function, may be represented by general properties knownfrom synaptic transmission and dendritic integration (Table 1).Therefore, the physiological implementations of LN-models canbe derived from intrinsic properties of neurons, their synap-tic input patterns or small neural networks (Figure 4, Table 1).Although examples exist that suggest single neurons can exhibitthe properties of individual LN-models (see examples in Clemensand Hennig, 2013), the models derived from behavioral prefer-ence functions reflect the abstract output of the whole system andit is not explicitly necessary to observe the convergence at the sin-gle cell level (see Clemens and Ronacher, 2013). The sequenceof processing from LN-model to integration and weighting alsoinvolves a transformation of coding with high temporal preci-sion to a rate code (Table 1). Such transformations are knownfrom the auditory pathways of insects (Schildberger, 1984; Vogelet al., 2005; Clemens et al., 2011; Kostarakos and Hedwig, 2012)and correspond to the more general scheme also known fromvertebrates (Joris et al., 2004).
In summary, Gabor-functions as the basic, linear part of LN-models provide a unitary and simple way for understandingdiverse preference functions of crickets and katydids. Conceivableevolutionary changes and transitions between preference pro-files of sibling species can be derived easily from small changesof properties (i.e., frequency, duration, phase, offset of Gaborfunctions, Figures 3, 4). Preference functions with qualitativelydifferent phenotype can be transformed drastically by change ofa single parameter (Figures 3, 4). In order to better understandsuch transitions it is a principal requirement to measure prefer-ence functions of insects for acoustic signals not only as a pulseprofile but also with respect to the energy preference for a giventime window of integration (Figure 1).
THE DISCRIMINATIVE POWER OF LN-MODELSThere are only few components of which LN-models are built(Table 1). Although the songs of crickets differ in pulse rates,chirp rates and chirp durations as specified by the number of
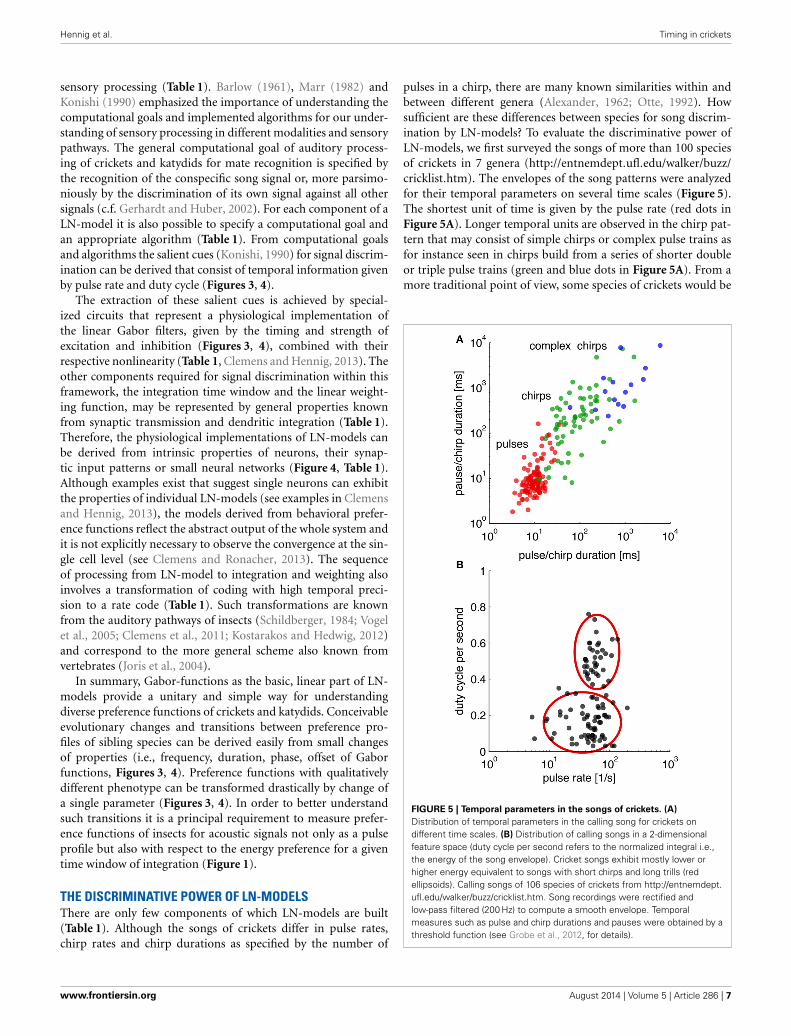
pulses in a chirp, there are many known similarities within andbetween different genera (Alexander, 1962; Otte, 1992). Howsufficient are these differences between species for song discrim-ination by LN-models? To evaluate the discriminative power ofLN-models, we first surveyed the songs of more than 100 speciesof crickets in 7 genera (http://entnemdept.ufl.edu/walker/buzz/cricklist.htm). The envelopes of the song patterns were analyzedfor their temporal parameters on several time scales (Figure 5).The shortest unit of time is given by the pulse rate (red dots inFigure 5A). Longer temporal units are observed in the chirp pat-tern that may consist of simple chirps or complex pulse trains asfor instance seen in chirps build from a series of shorter doubleor triple pulse trains (green and blue dots in Figure 5A). From amore traditional point of view, some species of crickets would be
FIGURE 5 | Temporal parameters in the songs of crickets. (A)Distribution of temporal parameters in the calling song for crickets ondifferent time scales. (B) Distribution of calling songs in a 2-dimensionalfeature space (duty cycle per second refers to the normalized integral i.e.,the energy of the song envelope). Cricket songs exhibit mostly lower orhigher energy equivalent to songs with short chirps and long trills (redellipsoids). Calling songs of 106 species of crickets from http://entnemdept.ufl.edu/walker/buzz/cricklist.htm. Song recordings were rectified andlow-pass filtered (200 Hz) to compute a smooth envelope. Temporalmeasures such as pulse and chirp durations and pauses were obtained by athreshold function (see Grobe et al., 2012, for details).
www.frontiersin.org August 2014 | Volume 5 | Article 286 | 7

Hennig et al. Timing in crickets
expected to analyze the song pattern at least on two time scales,that of the pulse and the chirp pattern (Figure 5A). Especiallythe complex song patterns may require sophisticated processingon several time scales. A transformation of the song patternsinto a 2-dimensional feature space as suggested by LN-models(Figures 1E,J) shows that only two computations are required; anextraction of the pulse rate and a measurement of the energy com-ponent (Figure 5B). The songs of crickets in North America thenshow a common pulse rate between 30 and 100 pps with only fewexceptions (Figure 5B). The distribution of energy in the songsof those crickets was largely bimodal, suggesting that songs ofcrickets can be roughly divided into two groups with shorter andlonger chirps (Figure 5B).
However, the question arises whether the power of LN-modelsis sufficient to discriminate between the songs of different speciesgiven that many of the song patterns show similar pulse rates(Figures 5A,B) or energy distributions (Figure 5B). We trainedan LN model for each species to discriminate the conspecificsong from all other song patterns (N = 106, see Clemens andHennig, 2013, for Methods). This analysis reflects an unrealisti-cally hard scenario, since the geographical distributions do notrequire that crickets discriminate their own song from more than100 other cricket songs (http://entnemdept.ufl.edu/walker/buzz/cricklist.htm). Still, the discrimination of the song pattern fora particular species was remarkably high (Figure 6, median ofcorrectly assigned species was 93%, chance level 1/106 = 0.94%). The songs of most crickets were discriminated well across,but also within subfamilies (Figures 6B–F, correctly assignedspecies were between 90 and 99%). There were only few callingsongs within each subfamily that were less well discriminated.
This unexpectedly high discrimination was based on the twofeatures used for song discrimination by individual species ofcrickets (Figure 1): a pulse rate filter based on central timing thatdifferentiates and a duty cycle filter from integration based on atime window (Clemens and Hennig, 2013). LN-models then offera surprisingly simple view on signal recognition in crickets andthe relevant feature space (Figure 5B).
In view of LN-models the bimodal distribution of energy insongs of cricket also suggests two levels of complexity in song pat-tern recognition (Figure 5B). The recognition of songs with highenergy levels composed from long chirps (or trills) will requireonly a single upper threshold for the computation from the inte-gration time window (Table 1). The discrimination of songs withshort chirps would require two such thresholds, a lower one thathas to be passed and a higher one that must not be passed for thesong to be recognized. The simplicity of the former arrangementis also in line with views on the evolution of song patterns, whichsuggest that longer chirps (or trills) correspond to the ancestralsituation (Alexander, 1962; Otte, 1992; Korsunovskaya, 2008).
In summary, LN-models offer powerful discrimination ofcricket songs, based on properties of differentiation (Figure 4B)and integration (Figure 4A). The new feature space indicatesbimodal separation of songs by energy or duty cycle, but homo-geneous distribution of pulse rates. This view confirms the oftenused taxonomic criteria of pulse rate, chirp duration (i.e., thenumber of pulses) and chirp rate as useful discriminators ofcricket songs. The recognition of cricket songs can be summa-rized by a peripheral filter for carrier frequency (Kostarakos et al.,2009), a differentiating pulse rate filter evaluating the temporalsong components on a short time scale by the timing of excitation
FIGURE 6 | LN-models discriminate the songs of 106 North-Americanspecies of crickets. For each species, we trained a model with twofilter-nonlinearity pairs (see Figures 1, 2) to discriminate its own song from allthe other 105 songs using a Genetic Algorithm (cf. Clemens and Hennig,2013). Each row in (A–F) depicts the normalized output values of eachspecies’ model for all songs (color coded). Dark shading confined to the maindiagonal indicates high specificity (i.e., phonotaxis scores) of the model
output for the conspecific song (see color bar C). (A) Discrimination matrix(shading indicates predicted output value of the reference species for thetested species quality of correct assignment). (B–F) Discrimination matrix for5 major subfamilies. Discrimination power was determined from songenvelopes (low-pass filter: 200 Hz) by LN-models. Calling songs of cricketsand taxonomical classification from http://entnemdept.ufl.edu/walker/buzz/cricklist.htm.
Frontiers in Physiology | Integrative Physiology August 2014 | Volume 5 | Article 286 | 8

Hennig et al. Timing in crickets
and inhibition (Figure 4) and an integrating filter for song energy(Table 1).
CONSEQUENCES FOR THE EVOLUTION OFCOMMUNICATION SYSTEMSThe goal of the present review was to illustrate the power of a verygeneral coding scheme for sensory processing with only few basicand physiologically plausible components (Table 1). The aim ofthe following section is to illustrate predictions derived from thegeneral model about filter properties that can be falsified by neu-rophysiological approaches and to point out consequences for theevolution of communication systems.
TRANSITIONS AND TRANSFORMATIONS BETWEEN FILTERSFrom an evolutionary perspective the properties of Gabor func-tions suggest a simple solution to the large phenotypic differencesobserved in the song patterns and preferences of sibling speciesin different taxa (crickets: Teleogryllus Hennig and Weber, 1997,tettigoniids: Tettigonia, Schul, 1998, Neoconocephalus Schul et al.,2014, Isophya Orci, 2007, grasshoppers: von Helversen and vonHelversen, 1994). Small changes in strength and timing of excita-tion and inhibition may already suffice to generate the observeddifferences (Figures 3, 4). Even the transition from a duty cyclepreference to a pulse rate preference may require only few smallsteps (Figure 4).
HOW LN-MODELS MAY SHAPE THE TEMPORAL PATTERNS OF SONGSIGNALSA fundamental component of LN-models is the selectivity fortemporal characteristics of the pattern that is given by the filterpart—in our case the Gabor function (Figures 3, 4, Table 1). Theproperties of this filter depend on the relative strength and tim-ing of excitation and inhibition that correspond to a fundamentaloperation performed in sensory pathways in general. The callingsongs of crickets, but also other insects, would have to match thefilter part of the LN-model over a given integration time window.Consequently a number of different song patterns may suffice toactivate the same type of Gabor filter implemented in the audi-tory pathways of females with very different genetic background.In this view the convergent appearance of song patterns is not sur-prising (Otte, 1992; Bush and Schul, 2010; Korsunovskaya, 2008).Different mechanisms of signal production may then converge toactivate the same type of LN-model as for instance by differentlayouts of central pattern generators (Marder, 2011) or by theproduction of the same sound signals due to stridulation withwings or legs within the grasshopper genus Stenobothrus (Elsnerand Wasser, 1995).
SIMPLE AND COMPLEX SONGSThe songs of many insects, from crickets to katydids andgrasshoppers, are of a simple type (crickets: Gryllidae Desutter-Grandcollas and Robillard, 2003, Tettigoniidae: NeoconocephalusBush and Schul, 2010, grasshoppers, Ragge and Reynolds,1998). The recognition of such song patterns can be describedwith basic LN-models. However, within all taxa complexsongs are also known (crickets: Teleogryllus Otte and Cade,1983), Eneopterinae (Robillard and Desutter-Grandcolas, 2011;Tettigoniidae: Phaneropterinae, Dobler et al., 1994; Walker,
2004; Hemp et al., 2009; grasshoppers: Chorthippus Ragge andReynolds, 1998, Stenobothrus Ostrowski et al., 2009). So far it isstill unresolved whether more complex patterns in the song sig-nals of insects across very diverse taxa, such as pulse rate sweeps,alternating rhythms or tick and buzz schemes can be explainedby the proposed LN-models. The high discrimination of complexsongs among the North-American crickets (e.g., Eneopterinae inFigure 6A, c.f. Robillard and Desutter-Grandcolas, 2011) by sim-ple LN-models that evaluate only pulse rates and duty cycle isindeed surprising. Several scenarios may account for the evolu-tion of complex songs. In the first case, a complex song may evolvethat can be recognized by a simple preference function. For exam-ple, the cricket Teleogryllus oceanicus exhibits a complex song withtwo rhythms, but females exhibit a simple preference for a singlepulse rate (Pollack and Hoy, 1979; Hennig and Weber, 1997; seealso Schul, 1998 for a similar example in katydids). Grasshoppersof the genus Chorthippus exhibit elaborate and highly amplitudemodulated song signals, but females also respond to simple soundpatterns build from blocks of pulses (von Helversen and vonHelversen, 1994). In a second scenario, complex songs evolve inresponse to two or more simple preference functions. For examplethe cricket T. commodus exhibits a song with two pulse rates, bothof which have to present for song recognition (Hennig and Weber,1997), a pattern that is also known for grasshoppers (Stumpnerand von Helversen, 1992). Such an atomistic recognition of fea-tures build from several simple LN-models may account foralternating rhythms that are known for many species of insects.In a third scenario, the song may be as complex as the recogni-tion similar to a Gestalt-like perception as may be the case forindividual neurons in songbirds (Margoliash and Fortune, 1992).Presently, the call recognition of the tettigoniid Neoconocephalusaffinis is among the most complex known in insects (Bush et al.,2009).
In summary, song signals viewed in the light of sensory pro-cessing by a receiver based on LN-models will advance ourunderstanding of how song patterns evolve, how filters shapesong signals, how transitions from rate filters to integrating fil-ters are possible and whether simple and complex songs requiresimple and complex filters. It also allows us to search more specif-ically for physiological mechanisms. Not at least, LN-models arereminiscent of the technique of Pointillism used in impression-istic paintings. While the sound pulses produced by insects mayrepresent the pixels of different shade and color over time fromwhich all kinds of songs, or acoustic pictures, can be made, theGabor functions equip us with a pointillistic view on insect songsthat touches upon perceptual capacities in much the same waypainters did about one hundred years ago.
ACKNOWLEDGMENTSThis work was funded by grants from the Deutsche Forschungs-gemeinschaft (SFB618) and the Federal Ministry of Educationand Research, Germany (01GQ1001A).
REFERENCESAlexander, R. D. (1957). The song relationships of four species of ground crickets
(Orthoptera: Gryllidae: Nemobius). Ohio J. Sci. 57, 153–163.Alexander, R. D. (1962). Evolutionary change in cricket acoustical communication.
Evolution 16, 443–467. doi: 10.2307/2406178
www.frontiersin.org August 2014 | Volume 5 | Article 286 | 9

Hennig et al. Timing in crickets
Barlow, H. B. (1961). “Possible principles underlying the transformation of sensorymessages,” in Sensory Communication, ed W. A. Rosenblith (Cambridge, MA:MIT Press), 217–234.
Bradbury, J. W., and Vehrencamp, S. L. (1998). Principles of AnimalCommunication. Sunderland, MA: Sinauer.
Brunton, B. W., Botvinick, M. M., and Brody, C. D. (2013). Rats and humans canoptimally accumulate evidence for decision-making. Science 340, 95–98. doi:10.1126/science.1233912
Bush, S. L., Beckers, O. M., and Schul, J. (2009). A complex mechanism of callrecognition in the katydid Neoconocephalus affinis (Orthoptera: Tettigoniidae).J. Exp. Biol. 212, 648–655. doi: 10.1242/jeb.024786
Bush, S. L., and Schul, J. (2006). Pulse-rate recognition in an insect: evidence of arole for oscillatory neurons. J. Comp. Physiol. A Neuroethol. Sens. Neural Behav.Physiol. 192, 1–9. doi: 10.1007/s00359-005-0053-x
Bush, S. L., and Schul, J. (2010). Evolution of novel signal traits in the absenceof female preferences in Neoconocephalus katydids (Orthoptera, Tettigoniidae).PLoS ONE 5:e12457. doi: 10.1371/journal.pone.0012457
Clemens, J., and Hennig, R. M. (2013). Computational principles underlying therecognition of acoustic signals in insects. J. Comput. Neurosci. 35, 75–85. doi:10.1007/s10827-013-0441-0
Clemens, J., Kutzki, O., Ronacher, B., Schreiber, S., and Wohlgemuth, S.(2011). Efficient transformation of an auditory population code in asmall sensory system. Proc. Natl. Acad. Sci. U.S.A. 108, 13812–13817. doi:10.1073/pnas.1104506108
Clemens, J., and Ronacher, B. (2013). Feature extraction and integration under-lying perceptual decision making during courtship behavior. J. Neurosci. 33,12136–12145. doi: 10.1523/JNEUROSCI.0724-13.2013
Crawford, J. D. (1997). Feature-detecting auditory neurons in the brain of a soundproducing fish. J. Comp. Physiol. A 180, 439–450. doi: 10.1007/s003590050061
David, S. V., and Shamma, S. A. (2013). Integration over multipletimescales in primary auditory cortex. J. Neurosci. 33, 19154–19166. doi:10.1523/JNEUROSCI.2270-13.2013
Deily, J. A., and Schul, J. (2004). Recognition of calls with exceptionally fastpulse rates: female phonotaxis in the genus Neoconocephalus (Orthoptera:Tettigoniidae). J. Exp. Biol. 207, 3523–3529. doi: 10.1242/jeb.01179
Deily, J. A., and Schul, J. (2009). Selective phonotaxis in Neoconocephalus nebrascen-sis (Orthoptera: Tettigoniidae): call recognition at two temporal scales. J. Comp.Physiol. A 195, 31–37. doi: 10.1007/s00359-008-0379-2
Desutter-Grandcollas, L., and Robillard, T. (2003). Phylogeny and the evolution ofcalling songs in Gryllus (Insecta, Orthoptera, Gryllidae). Zool. Scr. 32, 173–183.doi: 10.1046/j.1463-6409.2003.00107.x
Dobler, S., Heller, K. G., and von Helversen, O. (1994). Song pattern recog-nition and an auditory time window in the female bushcricket Ancistruranigrovittata (Orthoptera: Phaneropteridae). J. Comp. Physiol. A 175, 67–74. doi:10.1007/BF00217437
Elsner, N., and Wasser, G. (1995). The transition from leg towing stridulationin two geographically distinct populations of the grasshopper Stenobothrusrubicundus. Naturwissenschaften 82, 384–386.
Felix, R. A. 2nd., Fridberger, A., Leijon, S., Berrebi, A. S., and Magnusson, A.K. (2011). Sound rhythms are encoded by post-inhibitory rebound spik-ing in the superior paraolivary nucleus. J. Neurosci. 31, 12566–12578. doi:10.1523/JNEUROSCI.2450-11.2011
Garcia-Lazaro, J. A., Belivieau, L. A. C., and Lesica, N. A. (2013). Independentpopulation coding of speech with sub-millisecond precision. J. Neurosci. 33,19362–19372. doi: 10.1523/JNEUROSCI.3711-13.2013
Gerhardt, C. H., and Huber, F. (2002). Acoustic Communication in Insects andAnurans. Chicago, IL: University of Chicago Press.
Giraud, A. L., and Poeppel, D. (2012). Cortical oscillations and speech processing:emerging computational principles and operations. Nat. Neurosci. 15, 511–517.doi: 10.1038/nn.3063
Grobe, B., Rothbart, M. M., Hanschke, A., and Hennig, R. M. (2012). Auditoryprocessing at two time scales by the cricket Gryllus bimaculatus. J Exp. Biol. 215,1681–1690. doi: 10.1242/jeb.065466
Hemp, C., Voje, K. L., Heller, K.-G., and Hemp, A. (2009). Biogeography, phy-logeny and acoustics of the flightless bush-crickets of the East African genusMonticolaria Sjöstedt, 1909, with the description of a new species (Orthoptera:Phaneropterinae). Zool. J. Linn. Soc.156, 494–506. doi: 10.1111/j.1096-3642.2008.00490.x
Hennig, R. M. (2003). Acoustic feature extraction by cross-correlation in crickets ?J. Comp. Physiol. A Neuroethol. Sens. Neural Behav. Physiol. 189, 589–598. doi:10.1007/s00359-003-0438-7
Hennig, R. M. (2009). Walking in Fourier’s space: algorithms for the compu-tation of periodicities in song patterns by the cricket Gryllus bimaculatus.J. Comp. Physiol. A Neuroethol. Sens. Neural Behav. Physiol. 195, 971–987. doi:10.1007/s00359-009-0473-0
Hennig, R. M., and Weber, T. (1997). Filtering of temporal parameters of the call-ing song by cricket females of two closely related species: a behavioral analysis.J. Comp. Physiol. A Neuroethol. Sens. Neural Behav. Physiol. 180, 621–630. doi:10.1007/s003590050078
Huber, F., Moore, T. E. M., and Loher, W. (1989). Cricket Behavior andNeurobiology. Ithaca, NY: Cornell University Press.
Hutcheon, B., and Yarom, Y. (2000). Resonance, oscillation and the intrin-sic frequency preferences of neurons. Trends Neurosci. 23, 216–222. doi:10.1016/S0166-2236(00)01547-2
Joris, P. X., Schreiner, C. E., and Rees, A. (2004). Neural processing of amplitude-modulated sounds. Physiol. Rev. 84, 541–577. doi: 10.1152/physrev.00029.2003
Konishi, M. (1990). Similar algorithms in different sensory systems and animals.Cold Spring Harb. Symp. Quant. Biol. 55, 575–584.
Korsunovskaya, O. S. (2008). Sound signalling in katydids and bushcrickets(Orthoptera, Tettigonioidea). Report 1. Entomol. Rev. 88, 1032–1050. doi:10.1134/S0013873808090029
Kostarakos, K., and Hedwig, B. (2012). Calling song recognition in female crickets:temporal tuning of identified brain neurons matches behavior. J. Neurosci. 32,9601–9612. doi: 10.1523/JNEUROSCI.1170-12.2012
Kostarakos, K., Hennig, R. M., and Römer, H. (2009). Two matched filters andthe evolution of mating signals in four species of cricket. Front. Zool. 6:22. doi:10.1186/1742-9994-6-22
Langner, G. (1992). Periodicity coding in the auditory system. Hear. Res. 60,115–142. doi: 10.1016/0378-5955(92)90015-F
Large, E. W., and Crawford, J. D. (2002). Auditory temporal computation: intervalselectivity based on post-inhibitory rebound. J. Comput. Neurosci. 13, 125–142.doi: 10.1023/A:1020162207511
Marder, E. (2011). Variability, compensation, and modulation in neu-rons and circuits. Proc. Natl. Acad. Sci. U.S.A. 108, 15542–15548. doi:10.1073/pnas.1010674108
Margoliash, D., and Fortune, E. S. (1992). Temporal and harmonic combination-sensitive neurons in the zebra finch’s HVc. J. Neurosci. 12, 4309–4326.
Marr, D. (1982). Vision. New York, NY: Freeman and Company.McDermott, J. H., Schemitsch, M., and Simoncelli, E. P. (2013). Summary statistics
in auditory perception. Nat. Neurosci. 16, 493–498. doi: 10.1038/nn.3347Meckenhäuser, G., Hennig, R. M., and Nawrot, M. P. (2013). Critical song fea-
tures for auditory pattern recognition in crickets. PLoS ONE 8:e55349. doi:10.1371/journal.pone.0055349
Olshausen, B. A., and Field, D. J. (1996). Emergence of simple-cell receptive fieldproperties by learning a sparse code for natural images. Nature 381, 607–609.doi: 10.1038/381607a0
Orci, K. M. (2007). Female preferences for male song characters in the bush-cricketIsophya camptoxypha (Orthoptera, Tettigonioidea). J. Insect Behav. 20, 503–513.doi: 10.1007/s10905-007-9096-x
Ostrowski, T. D., Sradnick, J., Stumpner, A., and Elsner, N. (2009). The elabo-rate courtship behavior of Stenobothrus clavatus Willemse, 1979 (Acrididae:Gomphocerinae). J. Orthoptera Res. 18, 171–182. doi: 10.1665/034.018.0206
Otte, D. (1992). Evolution of cricket songs. J. Orthoptera Res. 1, 25–49. doi:10.2307/3503559
Otte, D. (1994). The Crickets of Hawaii. Philadelphia, PA: Orthopterists’ Society atThe Academy of Natural Sciences of Philadelphia.
Otte, D., and Alexander, R. D. (1983). The Australian crickets (Orthoptera:Gryllidae). Acad. Nat. Sci. Phil. Monogr. 22, 1–477.
Otte, D., and Cade, W. (1983). African crickets (Gryllidae). 1 Teleogryllus of Easternand Southern Africa Proc. Acad. Nat. Sci. Phil. 135, 102–127.
Pillow, J. W., Shlens, J., Paninski, L., Sher, A., Litke, A. M., Chichilnisky, E. J.,et al. (2008). Spatio-temporal correlations and visual signaling in a completeneuronal population. Nature 454, 995–999. doi: 10.1038/nature07140
Pollack, G. S., and Hoy, R. (1979). Temporal pattern as a cue for species specificcalling song recognition in crickets. Science 204, 429–432. doi: 10.1126/sci-ence.204.4391.429
Frontiers in Physiology | Integrative Physiology August 2014 | Volume 5 | Article 286 | 10

Hennig et al. Timing in crickets
Priebe, N. J., and Ferster, D. (2012). Mechanisms of neuronal computation in mam-malian visual cortex. Neuron 75, 194–208. doi: 10.1016/j.neuron.2012.06.011
Ragge, D. R., and Reynolds, W. J. (1998). The Songs of the Grasshoppers and CricketsOf Western Europe. Colchester: Harley.
Robillard, T., and Desutter-Grandcolas, L. (2011). Evolution of calling songs asmulticomponent signals in crickets (Orthoptera: Grylloidea: Eneopterinae).Behaviour 148, 627–672. doi: 10.1163/000579511X572044
Ronacher, B., and Stumpner, A. (1988). Filtering of behaviourally relevanttemporal parameters of a grasshopper’s song by an auditory interneuron.J. Comp. Physiol. A Neuroethol. Sens. Neural Behav. Physiol. 163, 517–523. doi:10.1007/BF00604905
Rose, G. J., and Capranica, R. R. (1984). Processing amplitude-modulated soundsby the auditory midbrain of two species of toads: matched temporal filters.J. Comp. Physiol. A 154, 211–219. doi: 10.1007/BF00604986
Rothbart, M. M., and Hennig, R. M. (2012a). The Steppengrille (Gryllusspec./assimilis): selective filters and signal mismatch on two time scales. PLoSONE 7:e43975. doi: 10.1371/journal.pone.0043975
Rothbart, M. M., and Hennig, R. M. (2012b). Calling song signals and tem-poral preference functions in the cricket Teleogryllus leo. J. Comp. Physiol. ANeuroethol. Sens. Neural Behav. Physiol. 198, 817–825. doi: 10.1007/s00359-012-0751-0
Schildberger, K. (1984). Temporal selectivity of identified auditory neurons in thecricket brain. J. Comp. Physiol. 155, 171–185. doi: 10.1007/BF00612635
Schreiber, S., Erchova, I., Heinemann, U., and Herz, A. V. M. (2004). Subthresholdresonance explains the frequency-dependent integration of periodic as well asrandom stimuli in the entorhinal cortex. J. Neurophysiol. 92, 408–415. doi:10.1152/jn.01116.2003
Schul, J. (1998). Song recognition by temporal cues in a group of closely relatedbushcricket species (genus Tettigonia). J. Comp. Physiol. A Neuroethol. Sens.Neural Behav. Physiol. 183, 401–410. doi: 10.1007/s003590050266
Schul, J., Bush, S., and Frederick, K. H. (2014). “Evolution of call patterns and pat-tern recognition mechanisms in Neoconocephalus katydids,” in Insect Hearingand Acoustic Communication. Animal Signals and Communication, Vol. 1, edB. Hedwig (Berlin; Heidelberg: Springer), 167–184. doi: 10.1007/978-3-642-40462-7-10
Smith, E. C., and Lewicki, M. S. (2006). Efficient auditory coding. Nature 439,978–982. doi: 10.1038/nature04485
Stumpner, A., and von Helversen, O. (1992). Recognition of a two-element songin a grasshopper Chorthippus dorsatus (Orthoptera: Gomphocerinae). J. Comp.Physiol. A 171, 405–412. doi: 10.1007/BF00223970
Vogel, A., Hennig, M. R., and Ronacher, B. (2005). Increase of neuronal responsevariability at higher processing levels as revealed by simultaneous recordings.J. Neurophysiol. 93, 3548–3559. doi: 10.1152/jn.01288.2004
von Helversen, O., and von Helversen, D. (1994). “Forces driving coevolution ofsong and song recognition in grasshoppers,” in Neural Basis of BehaviouralAdaptations, eds K. Schildberger and N. Elsner (Stuttgart: Fischer), 253–284.
Walker, T. J. (2004). The uhleri group of the genus Amblycorypha (Orthoptera:Tettigoniidae): extraordinarily complex songs and new species. J. OrthopteraRes. 13, 169–183. doi: 10.1665/1082-6467(2004)013[0169:TUGOTG]2.0.CO;2
Webb, B., Wessnitzer, J., Bush, S. L., Schul, J., Buchli, J., and Ijspeert, A.(2007). Resonant neurons and bushcricket behaviour J. Comp. Physiol. ANeuroethol. Sens. Neural Behav. Physiol. 193, 285–288. doi: 10.1007/s00359-006-0199-1
Zorovic, M., and Hedwig, B. (2011). Processing of species-specific auditory pat-terns in the cricket brain by ascending, local, and descending neurons duringstanding and walking. J. Neurophysiol. 105, 2181–2194. doi: 10.1152/jn.00416.2010
Conflict of Interest Statement: The authors declare that the research was con-ducted in the absence of any commercial or financial relationships that could beconstrued as a potential conflict of interest.
Received: 31 December 2013; accepted: 14 July 2014; published online: 12 August 2014.Citation: Hennig RM, Heller K-G and Clemens J (2014) Time and timing in theacoustic recognition system of crickets. Front. Physiol. 5:286. doi: 10.3389/fphys.2014.00286This article was submitted to Integrative Physiology, a section of the journal Frontiersin Physiology.Copyright © 2014 Hennig, Heller and Clemens. This is an open-access article dis-tributed under the terms of the Creative Commons Attribution License (CC BY). Theuse, distribution or reproduction in other forums is permitted, provided the originalauthor(s) or licensor are credited and that the original publication in this jour-nal is cited, in accordance with accepted academic practice. No use, distribution orreproduction is permitted which does not comply with these terms.
www.frontiersin.org August 2014 | Volume 5 | Article 286 | 11