time and spaceresolved radiofrequency plasma electron...
TRANSCRIPT
Time and spaceresolved radiofrequency plasma electron energydistributions from a displacementcurrentbased electric probe diagnosticR. B. Turkot and D. N. Ruzic Citation: J. Appl. Phys. 73, 2173 (1993); doi: 10.1063/1.353119 View online: http://dx.doi.org/10.1063/1.353119 View Table of Contents: http://jap.aip.org/resource/1/JAPIAU/v73/i5 Published by the American Institute of Physics. Related ArticlesElectric field measurement in microwave discharge ion thruster with electro-optic probe Rev. Sci. Instrum. 83, 124702 (2012) Compact high-speed reciprocating probe system for measurements in a Hall thruster discharge and plume Rev. Sci. Instrum. 83, 123503 (2012) On physical interpretation of two dimensional time-correlations regarding time delay velocities and eddy shaping Phys. Plasmas 19, 122302 (2012) The simplest equivalent circuit of a pulsed dielectric barrier discharge and the determination of the gas gapcharge transfer Rev. Sci. Instrum. 83, 115112 (2012) Electrical potential measurement in plasma columns of atmospheric plasma jets J. Appl. Phys. 112, 103305 (2012) Additional information on J. Appl. Phys.Journal Homepage: http://jap.aip.org/ Journal Information: http://jap.aip.org/about/about_the_journal Top downloads: http://jap.aip.org/features/most_downloaded Information for Authors: http://jap.aip.org/authors
Downloaded 23 Dec 2012 to 192.17.144.173. Redistribution subject to AIP license or copyright; see http://jap.aip.org/about/rights_and_permissions

Time- and space-resolved radio-frequency plasma electron energy distributions from a displacement-current-based electric probe diagnostic
FL B. Turkot, Jr. and D. N. Ruzic Department of Nuclear Engineering, University of Ilhnois, Urbana, IIlinois 61801
(Received 30 April 1992; accepted for publication 23 November 1992)
A displacement-current-based, Langmuir probe technique was developed to measure time-resolved and spatially dependent electron energy distribution functions (EEDF) in a 100 mTorr argon plasma. This diagnostic was designed to take consideration of the changes in displacement current collected at the probe due to changes in the probe tip sheath potential. The EEDFs collected displayed evidence of a time-dependent as well as spatially dependent electron beam component. The beam energy was seen to increase with the instantaneous plasma potential. The electron density was found to be 3.2 f 1.1 X 10⁹, 1 .O f 1.5 X lOlo, and 2.7* 1.0~ IO9 cmm3 at locations 0.6, 1.8, and 2.8 cm from the grounded electrode, respectively. Mean electron energies were also spatially dependent, measuring 8.7hO.8, 11.3 + 1.0, and 6.9 ho.7 eV at locations 0.6, 1.8, and 2.8 cm from the grounded electrode, respectively.
I. INTRODUCTION
Langmuir probes’-5 and capacitive probes5’6 have proven useful diagnostic tools in studying laboratory plas- mas. Many variations on their simplistic designs such as tuned Langmuir probes,7*8 double probe techniques,“” and emitting probes11”2 have also been employed. By utilizing such tools researchers strive to characterize their plasmas by determining parameters such as plasma potential, float- ing potential, electron and ion temperature, density, and the electron energy distribution function. One goal of these measurements is to determine a “recipe” for how to obtain such plasma characteristics. This would allow people to choose the parameters necessary for a specific task and be able to select a plasma suitable for those needs. Under- standing the various plasma characteristics provides in- sight into the particle kinetics and helps to more accurately understand the plasma-material interactions occuring within the system. 13-15
Through many attempts to reach this goal an abun- dance of good information has resulted. However, a lack of consistant time-dependent data has hindered the complete understanding of plasma parameters. Most plasma dis- charges are driven by a time-varying ac signal. 13.56 MHz and several of its higher harmonics are common frequen- cies in most r-f-driven plasma environments. As the driving voltage of the discharge varies sinusoidally across its cycle, it generates a time-dependent electric field between the electrodes. Since the electron plasma frequency for most plasmas of interest to plasma processing is much higher than 13.56 MHz, electrons will respond to the instanta- neous electric field while ions respond only to the time- averaged electric field. The oscillating motion of the elec- trons creates a time-dependent plasma potential which produces a time-varying electric field predominantly lo- cated in the plasma sheath near both electrodes. Other important parameters such as electron temperature and the electron energy distribution are also related to the rapidly moving electrons and hence are tune dependent.
Time-averaged measurements do not reveal complete
information about rf-driven plasma parameters since par- ticle reactions with materials and other plasma species are occuring at varying electron energies much different than their respective time-averaged values. Hence, time- averaged results tend to conceal those effects due to the changing numbers of high and low energy electrons. Areas such as plasma etching and deposition and fusion engineer- ing, which are sensitive to each collision that occurs in the plasma and on the surfaces surrounding it, require the knowledge of species density and velocity as a function of time to correctly determine the specific reactions which occur. In order to accurately understand what is happen- ing inside a plasma, time-dependent measurements of all vital plasma parameters must be made.
Although time dependent information is desirable from a Langmuir probe, several complexities exist in cor- rectly determining time-resolved electron probe current. While in the plasma, the probe tip simultaneously collects electron current, ion current, and displacement current. In order to correctly calculate the plasma parameters, the electron current must be separated from the ion and dis- placement current. While the ion current can be considered constant due to its low plasma frequency, the displacement current created by the time-varying electric field across the probe sheath is not constant with respect to time or probe bias. The focus of this paper is a description of an electric probe diagnostic method which can correctly separate ion, electron, and displacement currents. This method is based on basic laws of electrodynamics and provides a look at the time-dependent current components collected by the probe and the plasma parameters derived from their analysis.
II. APPARATUS
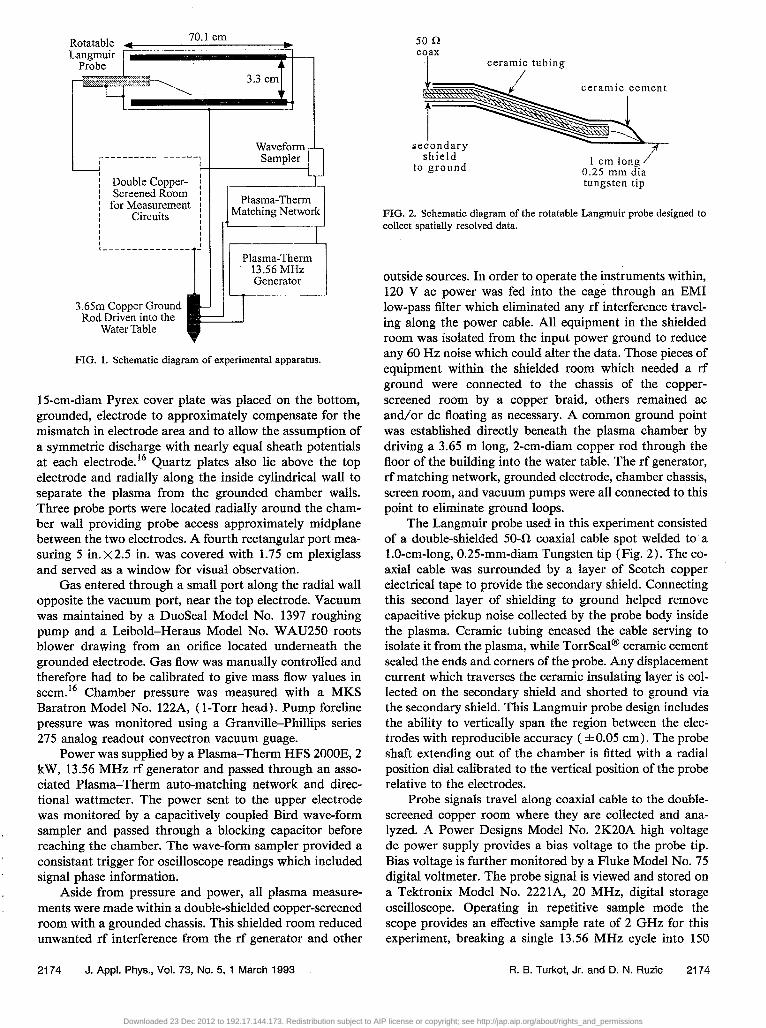
The plasma used in this experiment was produced in a Davis and Wilder Model No. 425 plasma etcher (Fig. 1). This capacitively coupled parallel plate device contained two water-cooled electrodes which were each 70.1 cm in diameter and separated by 3.3 cm. The upper, powered, electrode contained a 16.5-cm-diam hole in the center. A
2173 J. Appl. Phys. 73 (5), 1 March 1993 0021-8979/93/052173-07$06.00 @ 1993 American institute of Physics 2173
Downloaded 23 Dec 2012 to 192.17.144.173. Redistribution subject to AIP license or copyright; see http://jap.aip.org/about/rights_and_permissions
Rotatable 4 70.1 cm
I
/ Double Copper- i 1 Screened Room I for Measurement
3.65m Copper Ground Rod Driven into the
Water Table
Plasma-Therm Matching Network
FIG. 1. Schematic diagram of experimental apparatus.
15-cm-diam Pyrex cover plate was placed on the bottom, grounded, electrode to approximately compensate for the mismatch in electrode area and to allow the assumption of a symmetric discharge with nearly equal sheath potentials at each electrode.16 Quartz plates also lie above the top electrode and radially along the inside cylindrical wall to separate the plasma from the grounded chamber walls. Three probe ports were located radially around the cham- ber wall providing probe access approximately midplane between the two electrodes. A fourth rectangular port mea- suring 5 in. x 2.5 in. was covered with 1.75 cm plexiglass and served as a window for visual observation.
Gas entered through a small port along the radial wall opposite the vacuum port, near the top electrode. Vacuum was maintained by a DuoSeal Model No. 1397 roughing pump and a Leibold-Heraus Model No. WAU250 roots blower drawing from an orifice located underneath the grounded electrode. Gas flow was manually controlled and therefore had to be calibrated to give mass flow values in sccm.16 Chamber pressure was measured with a MKS Baratron Model No. 122A, ( 1-Torr head). Pump foreline pressure was monitored using a GranvillePhillips series 275 analog readout convectron vacuum guage.
Power was supplied by a Plasma-Therm HFS 2OOOE, 2 kW, 13.56 MHz rf generator and passed through an asso- ciated Plasma-Therm auto-matching network and direc- tional wattmeter. The power sent to the upper electrode was monitored by a capacitively coupled Bird wave-form sampler and passed through a blocking capacitor before reaching the chamber. The wave-form sampler provided a consistant trigger for oscilloscope readings which included signal phase information.
Aside from pressure and power, all plasma measure- ments were made within a double-shielded copper-screened room with a grounded chassis. This shielded room reduced unwanted rf interference from the rf generator and other
50 a coax
ceramic tubing
0.25 mm dia tungsten tip
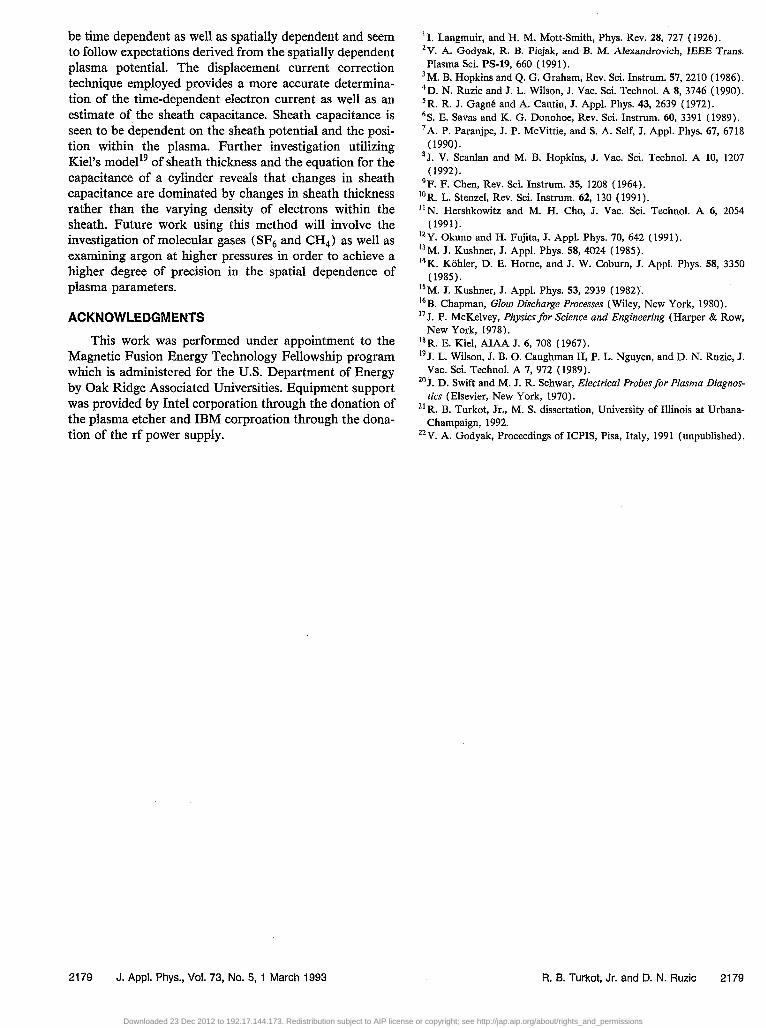
FIG. 2. Schematic diagram of the rotatable Langmuir probe designed to collect spatially resolved data.
outside sources. In order to operate the instruments within, 120 V ac power was fed into the cage through an EM1 low-pass filter which eliminated any rf interference travel- ing along the power cable. All equipment in the shielded room was isolated from the input power ground to reduce any 60 Hz noise which could alter the data. Those pieces of equipment within the shielded room which needed a rf ground were connected to the chassis of the copper- screened room by a copper braid, others remained ac and/or dc floating as necessary. A common ground point was established directly beneath the plasma chamber by driving a 3.65 m long, 2-cm-diam copper rod through the floor of the building into the water table. The rf generator, rf matching network, grounded electrode, chamber chassis, screen room, and vacuum pumps were all connected to this point to eliminate ground loops.
The Langmuir probe used in this experiment consisted of a double-shielded 50-n coaxial cable spot welded to.a l.O-cm-long, 0.25-mm-diam Tungsten tip (Fig. 2). The co- axial cable was surrounded by a layer of Scotch copper electrical tape to provide the secondary shield. Connecting this second layer of shielding to ground helped remove capacitive pickup noise collected by the probe body inside the plasma. Ceramic tubing encased the cable serving to isolate it from the plasma, while TorrSeal@ ceramic cement sealed the ends and corners of the probe. Any displacement current which traverses the ceramic insulating layer is col- lected on the secondary shield and shorted to ground via the secondary shield. This Langmuir probe design includes the ability to vertically span the region between the elec- trodes with reproducible accuracy ( f 0.05 cm). The probe shaft extending out of the chamber is fitted with a radial position dial calibrated to the vertical position of the probe relative to the electrodes.
Probe signals travel along coaxial cable to the double- screened copper room where they are collected and ana- lyzed. A Power Designs Model No. 2K20A high voltage dc power supply provides a bias voltage to the probe tip. Bias voltage is further monitored by a Fluke Model No. 75 digital voltmeter. The probe signal is viewed and stored on a Tektronix Model No. 2221A, 20 MHz, digital storage oscilloscope. Operating in repetitive sample mode the scope provides an effective sample rate of 2 GHz for this experiment, breaking a single 13.56 MHz cycle into 150
2174 J. Appl. Phys., Vol. 73, No. 5, 1 March 1993, R. B. Turkot, Jr. and D. N. Ruzic 2174
Downloaded 23 Dec 2012 to 192.17.144.173. Redistribution subject to AIP license or copyright; see http://jap.aip.org/about/rights_and_permissions

time points. Fitted with an IEEE 488-Bus, the oscilloscope sends the digitized data to a Gateway 2000, 33 MHz, 486 personal computer where it was stored and analyzed using a wave-form spreadsheet program called DADISP~~. Using this program it is possible to produce an electron current vs probe bias voltage plot for any of 150 points in time during a rf cycle. The probe, power supply, and cabling were cal- ibrated at 13.56 MHz.
III. THEORY
The voltage difference which exists between the probe tip bias potential, Vbia, and the plasma potential, VJ t), is termed the sheath potential, Vsheath(t). The time depen- dence of the plasma potential forces Vsheath to be time de- pendent and hence the sheath contains a time varying elec- tric field
V sheath(t) = v,(t) - Vbias 9 (1)
E dVshe,th(t)
sheath(t)=- dx .
In this procedure Vbi& is never raised above the minimum Vp( t) . Therefore, plasma potenial will be the most positive potential in our system at all times. Hence, V&&h(t) is always a positive potential difference generating an electric field which accelerates positive ions toward and repels elec- trons from the probe tip.
At any given time, t, during the rf cycle, the total instantaneous current collected on the probe, Ittotal( t), con- sists of three components: electron current, I,(t), displace- ment current, Id(t), and positive ion current, lP
4&d(t) =ut> +Adt) +&. (3) Due to the ions’ low mobility, the positive ion current is considered to be independent of time for a given V&s. Further, since the ion current in an argon plasma is negli- gible compared with the electron current, any time depen- dence on IP can be ignored. The collected electron current, on the other hand, is affected by the size of the sheath potential since electrons with an energy less than v,h&h( t) are turned away before they reach the probe. In addition, the high mobility of electrons allows them to react quickly to the changing electric field in the sheath, making I,(t) a time-dependent quantity as well as a function of V+ath.
Displacement current, Id(t), is the third component of the total collected probe current, Itotal, and is created by the time-varying electric field across the sheath.
(4)
where Asheath is the outer area of the sheath surrounding the probe tip, fro is the permittivity of free space, and &&h is the electric field within the sheath which is approximated as uniform throughout. Sustaining the voltage separation between the probe tip and the plasma, the sheath region acts like a capacitor and hence will be treated as one for the determination of displacement current. The oscillating electric field across the sheath causes a time-varying sheath
thickness and produces a time-dependent current. Capaci- tive effects due to the probe body have been neglected due to the secondary probe shielding described in the apparatus section. Thus the displacement current will be assumed to arise purely from the sheath capacitance
dV,(t) Icdt) =Gheath(t) dt .
If Id( t) and Vp( t) are known, an estimate of C&e.&, can be made. The strength of any capacitor is determined by its size and geometry. For this experimental system the sheath thickness and the length and radius of the probe tip are the critical dimensions. The probe tip and sheath combination can be vewed as a pair of concentric cylinders with a ca- pacitance given as
C 2%-Q L -~
sheath-h r~r, 3 (6)
where r, is the probe tip radius, r, is the radius of the sheath measured from the probe tip centerline, L is the length of the probe tip, and e. is the permittivity of free space.17 Since L and r, are constant Eq. (6) states that changes in C&..th will be due to changes in sheath thick- ness. The sheath thickness changes due to the time-varying sheath potential and is estimated using a formula derived by Kielr8 which shows a [V,(t) - VbiJ 1’2 dependence.
The sinusoidal voltage to the powered electrode pro- duces a plasma potential in phase .with the driving volt- age. I9 Mathematically, the time-varying plasma potential V,(t) at a given position can be expressed as the sum of a time-averaged dc potential, Vpdo and an oscillating poten- tial with amplitude VP,,
VP(t) = VP, sin(d + Vpdc , (7)
where GJ is the driving frequency. The probe current signal was Fourier analyzed to determine the frequencies which make up the total collected probe current. Analysis at var- ious values of Vbias shows that 90% f 5% of the incoming signal is at 13.56 MHz, while the second, third, and fourth harmonics at 27.12, 40.68, and 54.24 MHz, respectively, are found to comprise 4% f l%, 3% f l%, and 2% f 1% of the total collected probe current. The variance in har- monic contribution, represented by the errors values listed above, is due to changes in Vbias and probe location within the plasma. Therefore, the assumption of a single driving frequency (13.56 MHz) for this system introduces only negligible error. Figure 3 shows a frequency spectrum taken from a 100 mTorr, 100 W, argon plasma with the probe tip 1.8 cm from the grounded electrode. Little vari- ation with position or vbias was seen. Since the displace- ment current is proportional to the time derivative of Vp( t), 1,(t) is independent of the dc plasma potential, V pdc, for a given Csheath* This leaves the displacement cur- rent defined as
Id(t) =&eat’, Vpac@ cos(mt). (8)
Thus the displacement current is 90” out-of-phase with the driving voltage. Biasing the probe tip in the ion saturation
2175 J. Appl. Phys., Vol. 73, No. 5, 1 March 1993 FL B. Turkot, Jr. and D. N. Ruzic 2175
Downloaded 23 Dec 2012 to 192.17.144.173. Redistribution subject to AIP license or copyright; see http://jap.aip.org/about/rights_and_permissions

1.00
w .z 0.75 3 z 0.50
lg 0.25 Q
0.00
(20%) n 40.68 MHz
54.24 MHz (2%)
13.56 MHz
1 - ---= ~3 -r---7---- 7- ----- ------
l(10’) 3(107) S(10’) 7(107)
Hertz
FIG. 3. Frequency distribution of total collected current wave forin. Since 13.56 MHz is seen to be the dominant harmonic, the assumption of a single harmonic will introduce negligible error. Spectra show little change with Vbi, or spatial location within the plasma.
region ( V,= - 100 V) restricts the probe to collection of only ions and displacement current since electrons will not have enough energy to cross the sheath. As the probe tip bias voltage is increased toward plasma potential the col- lected electron current increases while the ion current var- ies only slightly and is negligible compared to IC Vbias also has an effect on Id(t), and that effect is measured in this paper, but Id(t) is a more complicated function of Vbias and other plasma parameters. Electron current, I,(t), has its maximum magnitude at the plasma potential minimum, which is the lowest value of the sheath potential. Figure 4 is a theoretical representation of the phase and magnitude relationship between V,(t), I,(t), and Id(t). At high val- ues of VP the probe is instantaneously in the ion saturation region where I, goes to zero.
Both the electron and displacement current, at the fun- damental frequency, maintain their phase integrity with the plasma potential throughout the sweeping of Vbias, even though the total collected probe current shifts in phase with respect to Vp( t). This phenomenon can be explained
*Or ~-~~ ~~ ~~~ -1
-60 .-.-i-ll -_........ I T--, 0 60 120 180 240 300 360
Relative Phase (Degrees)
FIG. 4. Theoretical representation of current-voltage phase relationships obtained with the probe held at a constant Vbias. Electron current, Z,(t), has its maximum magnitude at the minimum value of V&t). +t high enough values of V,(t) the probe is instantaneously in the *on saturation region where Z,(r) =O.
2176 J. Appl. Phys., Vol. 73, No. 5, 1 March 1993 R. B. Turkot, Jr. and D. N. Ruzic 2176
by the changing value of the electron current. In the ion saturation region displacement current dominates the total current collected at the probe. As Vbia is increased toward plasma potential the electron current increases and even- tually begins to dominate the total current near plasma potential.
The phase relationships between the individual cur- rents and plasma potential provide the foundation for the analysis. In order to correctly determine the collected elec- tron current, the correct values for ion current and dis- placement current must be subtracted from the total col- lected probe current. In most cases, if a constant displacement current (i.e., sinusoidal, but independent of the sheath potential) is used for all Vbias the electron cur- rent which is calculated will not maintain its phase rela- tionship with the plasma potential. Thus, changes in dis- placement current, and hence the sheath capacitance, are caused by variations in the sheath potential and the parti- cle densities within.
Once the 1, vs Vbias traces are corrected, time-resolved information about the plasma can be determined. The most informative of such is the electron energy distribution function (EEDF). Following Swift and Schwar2’
f(-G4 4 probee
(9)
where f(E) is given in [cma3 eV-3’2], E’ is the electron energy, A, is the effective current collection area of the probe, e and m, are the electron charge and mass, and dazed V~ias is the second derivative of the corrected 1J t) vs Vbias characteristic. From f(E) the averge electron en- ergy (E) and electron density N, can be determined
N,= f(E) El/‘dE, s
(10)
(E) =N,-’ j- E3"f (E)dE. (11)
Data points were chosen as a series of periodic measure- ments where the current collection is smoothly varying and more finely detailed increments when data collection is more responsive to increases in probe tip bias voltage. This promises a smoother and more accurate second derivative measurement when determining f(E) .
IV. EXPERIMENT AND RESULTS
To determine the lower bound of displacement current the probe tip is biased to - 100 V, the ion saturation re- gion, restricting’ the probe to collection of only ion and displacement current since electrons will not have enough energy to overcome the barrierlike sheath potential. This signal is digitized and collected via computer along with other traces taken at bias voltages increasing up to the minimum plasma potential. Next, the true displacement current at each bias voltage is discerned by subtracting a multiple of the displacement current collected at - 100 V from each Vbias trace. The correct amplitude of displace- ment current is that value which shows the maximum elec- tron current in phase with the minimum plasma potential.
Downloaded 23 Dec 2012 to 192.17.144.173. Redistribution subject to AIP license or copyright; see http://jap.aip.org/about/rights_and_permissions

0.2 z E 3 0.0
2 -0.2 r
i 3 u.4
-0.6 l.-, “hi* , , , , ~~--=I r.. 1.6(10-‘) 2.4( 10-7) 3.2(10-‘)
Relative Time (seconds)
FIG. 5. Total collected current wave forms as a fuction of probe tip bias voltage. The increasing dominance of electron current (displayed as neg- ative current) over the displacement current causes a phase shift as shown.
Figure 5 shows the total probe current at a range of Vbias As Vbias increases toward VP the electron current increases due to the drop in Ysheath and becomes an instantaneously dominant contribution to the total collected probe current. Since I,(t) and Id(t) are 90” out of phase with each other a phase shift in the total collected probe current is visible. Figure 6 shows time-resolved electron current after the correct value of Id(t) is subtracted from Itotal( t) for several values of Vbias+ The regions where i,(t) rise above zero are representative of the experimental error in determining the correct value of I,(t). For values of Vbias very near VP, nonlinearities in the sheath conductance occur as the po- tential difference v,(t) - Vbias becomes comparable to the dc component of the sheath voltage and currents at small I’bias are not exactly proportional to those at larger Vbias. The correct value of 1,( t) was determined to be that which kept the maximum magnitude of I,(t) in phase with the minimum value of VP(t). Thus, Id(t) is found to be Id( t, ybias). Utilizing Eq. (6) for the sheath capacitance and Kiel’s model for the sheath thickness, rshe& shows how sheath thickness varies with the sheath potential (Fig. 7). Hence, as T’bim increases toward Vplasmar rsh&, de- creases due to the increasing number of electrons entering the sheath region.
r-- -~ ~~I ~-__
1.6(10-‘7) 2.4(W) 3.2(10-7)
ReIative Time (secondsj
FIG. 6. Time-resolved electron current (displayed as negative current) as a function of probe tip bias voltage. Regions of positive current are due to experimental error in fitting Id(t) to traces with Vbias near V,
2177 J. Appl. Phys., Vol. 73, No. 5, 1 March 1993
3
2.5
1 2 :
3 .z 1.5
R
9 z
1
6
0.5 I
0 T
.y---Ijzl C’
~+:::~~ ~ ~ ~- ________= .- - 2 -. ----- __ --
/! c.-.-----. -“.
,I--, _.-. . . . . . .
0 20 40 60 SO 100 120 140 Sheath Potential (V)
FIG. 7. Calculated sheath thickness vs instantaneous sheath potential with the probe 0.6 cm from the grounded electrode. Note the vertical scale is offset from zero.
Knowing Id( t, Vbias), time-dependent electron current vs probe bias voltage plots for any point in time can now be derived and evaluated for such quantities as mean electron energy, density, and the electron energy distribution func- tion. It is found, however, that full time-dependent data is only obtainable for probe tip bias voltages up to the mini- mum VJ t) . Hence, data for times with VP(t) > Vpmin will be incomplete in the range P’min < Vbias < VP(t) . This re- striction is due to the collapsing of the sheath once Vbi, reaches Vpin. When the sheath breaks, all points in time of the rf cycle experience a sharp increase in electron cur- rent.21 This distortion is present at times both before and after Vpmin, implying that the sheath requires a finite time, greater than 74 ns (13.56 MHz)-‘, to reform and restabi- lize itself.
EEDFs for times with VP > Vpmin reveal information about higher energy electrons while information about lower energy electrons is limited by the collapsing sheath distortion. Figure 8 shows time-resolved EEDF data for argon at 100 *5 W, lOO=t5 mTorr, and 2+ 1 seem at 0.6 cm from the grounded electrode. As explained earlier, in- formation about lower energy electrons for times with V,(t) > P’min is limited by the collapsing of the sheath. Hence, total electron densitites and mean electron energies cannot be accurately determined for times other than when V'(t) = VPin. Figure 8 shows an electron beam compo- nent increasing in energy from 35-40 eV at t=O ( VP = Vpi,) to approximately 55 eV at t=w/4 (l/8 of a rf period) and 65 eV at t=r/2 (l/4 of a rf period). The increasing energy of the electron beam components (rep- resented by the bumps in the EEDF at the energies indi- cated above) is due to the increased sheath potential and electric field within the sheath which accelerates these elec- trons to a higher energy. The “dips” in the EEDFs at energies just preceeding the electron beam components represent a high degree of anisotropy and therefore inval- idate the accuracy of the magnitude in the EEDF formula at energies beyond. Hence the magnitude of the data in the range of the electron beam components should be consid-
FL B. Turkot, Jr. and D. N. Ruzic 2177
Downloaded 23 Dec 2012 to 192.17.144.173. Redistribution subject to AIP license or copyright; see http://jap.aip.org/about/rights_and_permissions

log
? lo*
m I ?I
2 I 107 E
u z 10
6
105 !IIl I I 0 10 20 30 40 50 60 70 80
Energy (eV)
FIG. 8. Time-resolved EEDF at 0.6 cm from the grounded electrode. Electron beam components at 35, 55, and 65 eV show a dependence on P>(t). Data in the beam component region should be considered only qualitative due to the breakdown of the EEDF formula at regions of anisotropy (the dips preceeding the electron beam components).
ered only qualitative.22 For times in the rf cycle the plasma potential is greater than V+, the energy scale for Fig. 8 is determined using the assumption that the magnitude of the ac floating potential is comparable to the ac variation of the plasma of the plasma potential.4
Spatially resolved EEDF data at the time of Vmin for the same conditions are shown in Fig. 9. Here, evidence of a peaked electron density in the center of the discharge which tapers down toward the sheaths is evident by com- paring the area under each curve. Measurements closer to the sheath regions (0.6 and 2.8 cm in fig. 9) show electron beam components near 40 eV while the center of the dis- charge ( 1.8 cm) contains a beam component near 55 eV. Moving from the sheaths to the center of the discharge, the EEDFs are seen to flatten out in the low energy region due to the increased density and the larger number of electrons
- 108 ? ":
ii m*
cm- IF lo7
-'
E; w lo6
0 10 20 30 40 50 60 70 Energy (eV)
FIG. 9. Spatially resolved EEDF at plasma potential minimum. Electron beam components are seen to be of lower energy within the sheaths (0.6 and 2.8 cm) than in the center of the discharge ( 1.8 cm). Electron density is also higher in the discharge center than in the sheaths.
2 m
10
- -..
i
- _ __----“_-_ _-~ .^ . ._._
4
__._ __
04
5 .~ --
1 O-l-T-l?! I T?f7- -r-T-II I I I I , 1-7 J
0 0.5 1 1.5 2 2.5 3 Position from grounded electrode (cm)
FIG. 10. Spatially resolved plasma potential minimum.
which have gained energy traversing the sheath region or through collisions with such electrons. The electron beam component in the center of the discharge is of a higher energy than those in the sheaths because the electrons have fully traversed the sheath and gained their maximum en- ergy from such, whereas within the sheath the collected electrons have only experienced a portion of the sheath’s electric field. Once again the dips preceeding the beam components restrict data beyond to be considered only qualitatively. Utilizing a plot of spatially resolved P&in, Fig. 10, the spatially resolved EEDFs of Fig. 9 show the acceleration and retardation of electron energy as they traverse the plasma and interact with the spatially depen- dent plasma potential. For example, the change in electron beam energy is about 12 eV between 0.6 and 1.8 cm from the grounded electrode. The change in VP for this region is roughly 9 f 1 V which would accelerate electrons from the 0.6 cm position further in the plasma. Although more de- tailed kinetics actually take place, the influence of VP is clearly seen. The same observation can be made at the position 2.8 cm.
Table I displays spatially resolved mean electron en- ergy and electron density values at 3 locations for this same argon plasma. Together with Fig. 9, the energies in Table I show that the higher energy electrons have only a small effect on the mean electron energy values.
v. DlSCUSSlON
Although Langmuir probe data is limited to voltages where Vbias < P&in, valuable data concerning middle- to high-energy electrons can be collected for times with VP above Vpina Electron beam components are clearly seen to
TABLE I. Spatially resolved mean electron energies and densities.
0.6 cm 1.8 cm 2.8 cm
N, 3.2*l.lx109 cme3 1.0*1.5~10’~ cm-3 2.7*1.0x109 cmm3 (I$ 8.7+0.8 eV 11.3*1.0 eV 6.9hO.7 eV
2178 J. Appl. Phys., Vol. 73, No. 5, 1 March 1993 FL B. Turkot, Jr. and D. N. Ruzic 2178
Downloaded 23 Dec 2012 to 192.17.144.173. Redistribution subject to AIP license or copyright; see http://jap.aip.org/about/rights_and_permissions
be time dependent as well as spatially dependent and seem to follow expectations derived from the spatially dependent plasma potential. The displacement current correction technique employed provides a more accurate determina- tion of the time-dependent electron current as well as an estimate of the sheath capacitance. Sheath capacitance is seen to be dependent on the sheath potential and the posi- tion within the plasma. Further investigation utilizing Kiel’s modeli of sheath thickness and the equation for the capacitance of a cylinder reveals that changes in sheath capacitance are dominated by changes in sheath thickness rather than the varying density of electrons within the sheath. Future work using this method will involve the investigation of molecular gases (SF, and CH,) as well as examining argon at higher pressures in order to achieve a higher degree of precision in the spatial dependence of plasma parameters.
ACKNOWLEDGMENTS
This work was performed under appointment to the Magnetic Fusion Energy Technology Fellowship program which is administered for the U.S. Department of Energy by Oak Ridge Associated Universities. Equipment support was provided by Intel corporation through the donation of the plasma etcher and IBM corproation through the dona- tion of the rf power supply.
‘I. Langmuir, and H. M. Mott-Smith, Phys. Rev. 28, 727 (1926). ‘V. A. Godyak, R. B. Piejak, and B. M. Alexandrovich, IEEE Trans.
Plasma Sci. PS-19, 660 (1991). 3M. B. Hopkins and Q. G. Graham, Rev. Sci. Instrum. 57,221O (1986). 4D. N. Ruzic and J. L. Wilson, J. Vat. Sci. Technol. A 8, 3746 (1990). 5R. R. J. Gag& and A. Cantin, J. Appl. Phys. 43, 2639 (1972). “S. E. Savas and K. G. Donohoe, Rev. Sci. Instrum. 60, 3391 (1989). ‘A. P. Paranjpe, J. P. McVittie, and S. A. Self, J. AppI. Phys. 67, 6718
(1990). *J. V. Scanlan and M. B. Hopkins, J. Vat. Sci. Technol. A 10, 1207
(1992). 9F. F. Chen, Rev. Sci. Instrum. 35, 1208 (1964).
‘OR. L. Stenzel, Rev. Sci. Instrum. 62, 130 (1991). “N. Hershkowitz and M. H. Cho, J. Vat. Sci. Technol. A 6, 2054
(1991). 12Y. Okuno and H. Fujita, J. Appl. Phys. 70, 642 (1991). t3M. J. Kushner, J. Appl. Phys. 58, 4024 (1985). 14K. Kiihler, D. E. Horne, and J. W. Coburn, J. Appl. Phys. 58, 3350
(1985). ‘*M. J. Kushner, J. Appl. Phys. 53, 2939 (1982). 16B. Chapman, Glow Discharge Processes (Wiley, New York, 1980). “J P McKelvey, Physics for Science and Engineering (Harper & Row, * .
New York, 1978). I8 R. E. Kiel, AIAA J. 6, 708 ( 1967). “J. L. Wilson, J. B. 0. Caughman II, P. L. Nguyen, and D. N. Ruzic, J.
Vat. Sci. Technol. A 7, 972 (1989). “J. D. Swift and M. J. R. Schwar, Electrical Probes jbr Plasma Diagnos-
tics (Elsevier, New York, 1970). “R B Turkot, Jr., M. S. dissertation, University of Illinois at Urbana- , .
Champaign, 1992. *‘V. A. Godyak, Proceedings of ICPIS, Pisa, Italy, 1991 (unpublished).
2179 J. Appl. Phys., Vol. 73, No. 5, 1 March 1993 R. B. Turkot, Jr. and D. N. Ruzic 2179
Downloaded 23 Dec 2012 to 192.17.144.173. Redistribution subject to AIP license or copyright; see http://jap.aip.org/about/rights_and_permissions